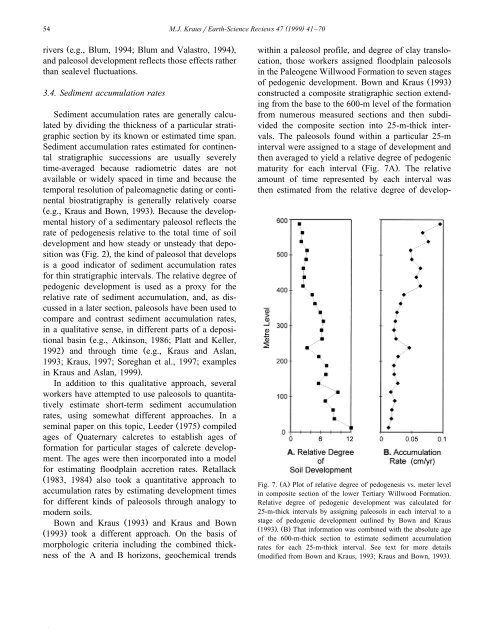
54( )M.J. KrausrEarth-Science ReÕiews 47 1999 41–70Ž .rivers e.g., Blum, 1994; Blum and Valastro, 1994 ,and paleosol development reflects those effects ratherthan sealevel fluctuations.3.4. Sediment accumulation ratesSediment accumulation rates are generally calculatedby divid<strong>in</strong>g the thickness of a particular stratigraphicsection by its known or estimated time span.Sediment accumulation rates estimated for cont<strong>in</strong>entalstratigraphic successions are usually severelytime-averaged because radiometric dates are notavailable or widely spaced <strong>in</strong> time and because thetemporal resolution of paleomagnetic dat<strong>in</strong>g or cont<strong>in</strong>entalbiostratigraphy is generally relatively coarseŽ e.g., Kraus and Bown, 1993 .. Because the developmentalhistory of a <strong>sedimentary</strong> paleosol reflects therate of pedogenesis relative to the total time of soildevelopment and how steady or unsteady that depositionwas Ž Fig. 2 ., the k<strong>in</strong>d of paleosol that developsis a good <strong>in</strong>dicator of sediment accumulation ratesfor th<strong>in</strong> stratigraphic <strong>in</strong>tervals. The relative degree ofpedogenic development is used as a proxy for therelative rate of sediment accumulation, and, as discussed<strong>in</strong> a later section, paleosols have been used tocompare and contrast sediment accumulation rates,<strong>in</strong> a qualitative sense, <strong>in</strong> different parts of a depositionalbas<strong>in</strong> Že.g., Atk<strong>in</strong>son, 1986; Platt and Keller,1992. and through time Že.g., Kraus and Aslan,1993; Kraus, 1997; Soreghan et al., 1997; examples<strong>in</strong> Kraus and Aslan, 1999 ..In addition to this qualitative approach, severalworkers have attempted to use paleosols to quantitativelyestimate short-term sediment accumulationrates, us<strong>in</strong>g somewhat different approaches. In asem<strong>in</strong>al paper on this topic, Leeder Ž 1975.compiledages of Quaternary calcretes to establish ages offormation for particular stages of calcrete development.The ages were then <strong>in</strong>corporated <strong>in</strong>to a modelfor estimat<strong>in</strong>g floodpla<strong>in</strong> accretion rates. RetallackŽ 1983, 1984.also took a quantitative approach toaccumulation rates by estimat<strong>in</strong>g development timesfor different k<strong>in</strong>ds of paleosols through analogy tomodern soils.Bown and Kraus Ž 1993.and Kraus and BownŽ 1993.took a different approach. On the basis ofmorphologic criteria <strong>in</strong>clud<strong>in</strong>g the comb<strong>in</strong>ed thicknessof the A and B horizons, geochemical trendswith<strong>in</strong> a paleosol profile, and degree of clay translocation,those workers assigned floodpla<strong>in</strong> paleosols<strong>in</strong> the Paleogene Willwood Formation to seven stagesof pedogenic development. Bown and Kraus Ž 1993.constructed a composite stratigraphic section extend<strong>in</strong>gfrom the base to the 600-m level of the formationfrom numerous measured sections and then subdividedthe composite section <strong>in</strong>to 25-m-thick <strong>in</strong>tervals.The paleosols found with<strong>in</strong> a particular 25-m<strong>in</strong>terval were assigned to a stage of development andthen averaged to yield a relative degree of pedogenicmaturity for each <strong>in</strong>terval Ž Fig. 7A .. The relativeamount of time represented by each <strong>in</strong>terval wasthen estimated from the relative degree of develop-Fig. 7. Ž A.Plot of relative degree of pedogenesis vs. meter level<strong>in</strong> composite section of the lower Tertiary Willwood Formation.Relative degree of pedogenic development was calculated for25-m-thick <strong>in</strong>tervals by assign<strong>in</strong>g paleosols <strong>in</strong> each <strong>in</strong>terval to astage of pedogenic development outl<strong>in</strong>ed by Bown and KrausŽ 1993 .. Ž B.That <strong>in</strong>formation was comb<strong>in</strong>ed with the absolute ageof the 600-m-thick section to estimate sediment accumulationrates for each 25-m-thick <strong>in</strong>terval. See text for more detailsŽ modified from Bown and Kraus, 1993; Kraus and Bown, 1993 ..
( )M.J. KrausrEarth-Science ReÕiews 47 1999 41–70 55ment for each <strong>in</strong>terval. For example, the lowest 25-m<strong>in</strong>terval has the highest relative degree of maturity at12.0 and occupied 9% of the total time representedby the total section Ž Fig. 7A .. Because absolute ageshad been established for the lower and upper boundariesof the 600-m-thick section, the time span foreach 25-m <strong>in</strong>terval could be calculated. From thatcalculation, the sediment accumulation rate for each25-m-thick <strong>in</strong>terval was estimated Ž Fig. 7B .. Krausand Bown Ž 1993.then used these short-term accumulationrates to exam<strong>in</strong>e up-section changes <strong>in</strong>sedimentology and paleontology.Us<strong>in</strong>g paleosols to estimate sediment accumulationrates <strong>in</strong> a quantitative fashion suffers from severallimitations. The Leeder Ž 1975.and RetallackŽ 1983, 1984.approach assumes that times of formationof modern soil analogs can be reliably determ<strong>in</strong>ed.The pitfalls of this assumption for calcreteshave been thoroughly discussed by Wright Ž 1990 ..He concluded that this approach is not justifiedbecause Quaternary calcretes actually show considerablevariability <strong>in</strong> <strong>their</strong> rates of formation depend<strong>in</strong>gon local ra<strong>in</strong>fall and the availability of airbornecarbonate dust.A second potential problem is erosion or slowsedimentation rates, which can generate compositepaleosols. With erosion, accumulation rates can beunderestimated. If the paleosols are composite, asthey are <strong>in</strong> numerous stratigraphic successions, accumulationrates can be overestimated. F<strong>in</strong>ally, RetallackŽ 1998.has po<strong>in</strong>ted out that studies like those ofBown and Kraus Ž 1993. and Kraus and Bown Ž 1993.assume that there are no major discont<strong>in</strong>uities <strong>in</strong> thepaleosol section and that all of the time conta<strong>in</strong>ed <strong>in</strong>a vertical section is represented by paleosols. Henoted that this is probably an unrealistic assumptionfor stratigraphic sections that span several millionsof years.4. Paleolandscape reconstructionIn the Quaternary record, soil–landscape studiesare important for <strong>in</strong>terpret<strong>in</strong>g landscape evolutionŽ e.g., McFadden and Knuepfer, 1990 .. Similarly, <strong>in</strong>pre-Quaternary strata, paleosol–landscape studies canhelp <strong>in</strong> reconstruct<strong>in</strong>g ancient landscapes Že.g., Bownand Kraus, 1987; Besly and Field<strong>in</strong>g, 1989; Platt andKeller, 1992 .. Paleosolrlandscape studies focus onthe spatial distribution of different k<strong>in</strong>ds of paleosolsand the different landscape elements and processesthat produced those paleosols. The study of JoeckelŽ 1995 ., described above, is a good example of us<strong>in</strong>glateral changes <strong>in</strong> a paleosol associated with anunconformity to analyze regional topographic variationsalong a specific degradational landscape. Furthermore,thick <strong>sedimentary</strong> sequences with multiplepaleosols provide a record of land surfaces over timeso that landscape changes and evolution can beexam<strong>in</strong>ed.Paleosol–landscape associations can be studied atdifferent spatial scales that range from local Že.g., achannel and associated floodpla<strong>in</strong>, an eolian duneand associated <strong>in</strong>terdune.to bas<strong>in</strong>-wide <strong>in</strong> scopeŽ e.g., a dra<strong>in</strong>age system, a sand sea .. At the localscale, lateral changes <strong>in</strong> paleosol properties arelargely the result of local variations <strong>in</strong> gra<strong>in</strong> size andtopography. At the scale of the <strong>sedimentary</strong> bas<strong>in</strong>,paleosols <strong>in</strong> different locations differ because ofbas<strong>in</strong>al variations <strong>in</strong> topography, gra<strong>in</strong> size, climate,and subsidence rate. The follow<strong>in</strong>g discussion providesexamples of how paleosols have been used to<strong>in</strong>terpret landscapes of the past, start<strong>in</strong>g at the localscale and build<strong>in</strong>g to the bas<strong>in</strong>-wide scale. For amore thorough discussion of paleosol–landscape associationsat different spatial and temporal scales,Ž .see Kraus and Aslan 1999 .4.1. Local landscape reconstructionPaleosol–landscape associations at this scale havebeen studied primarily <strong>in</strong> alluvial <strong>rocks</strong> Že.g., Bownand Kraus, 1987; Kraus, 1987, 1997; Besly andField<strong>in</strong>g, 1989; Platt and Keller, 1992 .. Catenas andpedofacies are common paleosol–landscape associationsthat develop at the scale of the channel andassociated floodpla<strong>in</strong>. The two are not mutually exclusive,and floodpla<strong>in</strong> paleosols can show a comb<strong>in</strong>ationof the two.In a catena, better-dra<strong>in</strong>ed soils form on channelmarg<strong>in</strong>aldeposits Ž levees, crevasse splays.becausethe deposits are elevated relative to the surround<strong>in</strong>gfloodbas<strong>in</strong> and usually consist of relatively permeablef<strong>in</strong>e sands and silts Ž Fig. 8 .. The soils may showevidence of oxidized conditions, <strong>in</strong>clud<strong>in</strong>g brown Aand Bw Ž weathered or structural B.horizons and