CHARITABLE BINGO OPERATIONS DIVISION - Txbingo.org
CHARITABLE BINGO OPERATIONS DIVISION - Txbingo.org
CHARITABLE BINGO OPERATIONS DIVISION - Txbingo.org
- No tags were found...

You also want an ePaper? Increase the reach of your titles
YUMPU automatically turns print PDFs into web optimized ePapers that Google loves.
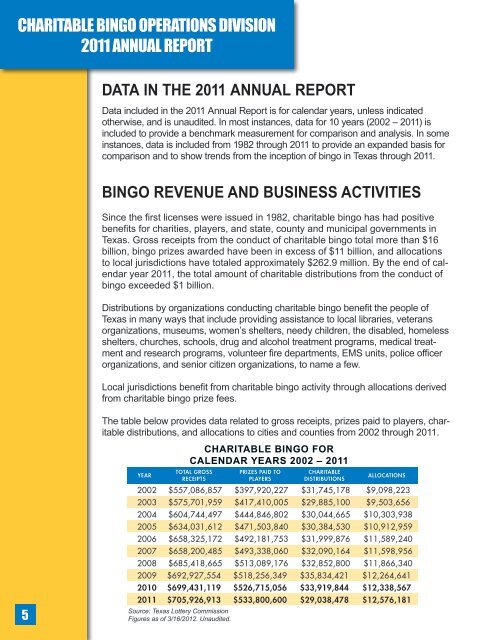
<strong>CHARITABLE</strong> <strong>BINGO</strong> <strong>OPERATIONS</strong> <strong>DIVISION</strong>2011 ANNUAL REPORTDATA IN THE 2011 ANNUAL REPORTData included in the 2011 Annual Report is for calendar years, unless indicatedotherwise, and is unaudited. In most instances, data for 10 years (2002 – 2011) isincluded to provide a benchmark measurement for comparison and analysis. In someinstances, data is included from 1982 through 2011 to provide an expanded basis forcomparison and to show trends from the inception of bingo in Texas through 2011.<strong>BINGO</strong> REVENUE AND BUSINESS ACTIVITIESSince the first licenses were issued in 1982, charitable bingo has had positivebenefits for charities, players, and state, county and municipal governments inTexas. Gross receipts from the conduct of charitable bingo total more than $16billion, bingo prizes awarded have been in excess of $11 billion, and allocationsto local jurisdictions have totaled approximately $262.9 million. By the end of calendaryear 2011, the total amount of charitable distributions from the conduct ofbingo exceeded $1 billion.Distributions by <strong>org</strong>anizations conducting charitable bingo benefit the people ofTexas in many ways that include providing assistance to local libraries, veterans<strong>org</strong>anizations, museums, women’s shelters, needy children, the disabled, homelessshelters, churches, schools, drug and alcohol treatment programs, medical treatmentand research programs, volunteer fire departments, EMS units, police officer<strong>org</strong>anizations, and senior citizen <strong>org</strong>anizations, to name a few.Local jurisdictions benefit from charitable bingo activity through allocations derivedfrom charitable bingo prize fees.The table below provides data related to gross receipts, prizes paid to players, charitabledistributions, and allocations to cities and counties from 2002 through 2011.5YEARTOTAL GROSSRECEIPTSSource: Texas Lottery CommissionFigures as of 3/16/2012. Unaudited.<strong>CHARITABLE</strong> <strong>BINGO</strong> FORCALENDAR YEARS 2002 – 2011PRIZES PAID TOPLAYERS<strong>CHARITABLE</strong>DISTRIBUTIONSALLOCATIONS2002 $557,086,857 $397,920,227 $31,745,178 $9,098,2232003 $575,701,959 $417,410,005 $29,885,100 $9,503,6562004 $604,744,497 $444,846,802 $30,044,665 $10,303,9382005 $634,031,612 $471,503,840 $30,384,530 $10,912,9592006 $658,325,172 $492,181,753 $31,999,876 $11,589,2402007 $658,200,485 $493,338,060 $32,090,164 $11,598,9562008 $685,418,665 $513,089,176 $32,852,800 $11,866,3402009 $692,927,554 $518,256,349 $35,834,421 $12,264,6412010 $699,431,119 $526,715,056 $33,919,844 $12,338,5672011 $705,926,913 $533,800,600 $29,038,478 $12,576,181