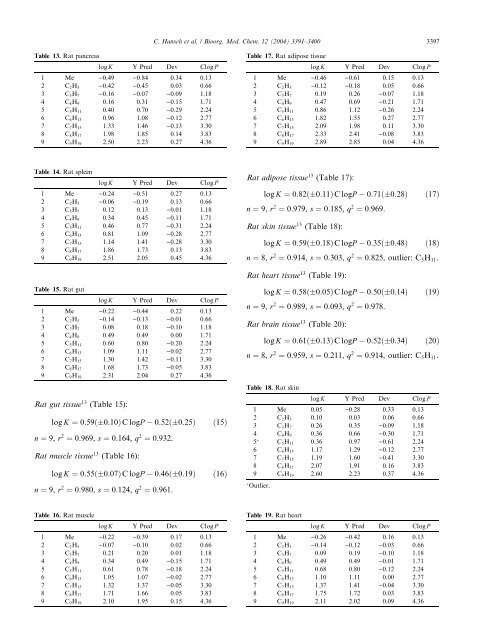
3396 C. Hansch et al. / Bioorg. Med. Chem. 12 (2004) 3391–3400log k ¼ 0:14ð0:05Þ log P 0:45ð0:16Þbilin logPþ 0:61ð0:07Þð8Þn ¼ 10, r 2 ¼ 0:910, s ¼ 0:023, q 2 ¼ 0:815, optimumlog P ¼ 2:6, outliers: 4-isopropylamine, 4-tertbutylaniline,4-betylaniline.k is the absorption rate. Thus, we find rather goodagreement in three examples for the dominant role ofhydrophobicity in determining the rate of intestinalabsorption. All have similar optimum values, despitebeing compounds of quite varied structure. While penetrationrates into Caco-2 cells can still be used to modelthe absorption process, it would be much more economicalin time <strong>and</strong> money to use Clog P values.2.2. Drug distributionDrug distribution is a more difficult process to characterize.There are many different compartments in thebody so that it is hard to generalize from the analysis ofa single site. Some time ago, we elected to consider drugsacting on the central nervous system, since a widevariety of compounds have been studied for CNS effects.A considerable number of <strong>QSAR</strong> studies indicate thatthere is an optimal hydrophobicity for CNS agents. Inthese studies, it was generally assumed that the measuredCNS depression is directly proportional to theconcentration in the brain. A very important conclusionfrom these studies is that the optimum log P was 2 ± 0.05for 114 drugs of very widely different structures. 6 Therange of optimal value is influenced by permutation <strong>and</strong>by receptor affinity. The best study we have on distributionis that from Nestorov et al. 13 These authorsshowed by a plot of their data against log P that a goodrelationship could be found for 5-N-alkyl-5-ethyl-barbitucacids interacting in rats after intravenous injection.log K is the tissue/plasma ratio.Rat lung tissue 13 (Table 9):log K ¼ 0:63ð0:17ÞC logP 0:55ð0:45Þ ð9Þn ¼ 9, r 2 ¼ 0:914, s ¼ 0:298, q 2 ¼ 0:843.Rat liver tissue 13 (Table 10):log K ¼ 0:44ð0:15ÞC logP þ 0:11ð0:40Þð10ÞTable 10. Rat liverlog K Y Pred Dev Clog P1 Me 0.44 0.17 0.27 0.132 C 2 H 5 0.59 0.40 0.19 0.663 C 3 H 7 0.53 0.64 )0.10 1.184 C 4 H 9 0.69 0.87 )0.18 1.715 C 5 H 11 0.82 1.11 )0.29 2.246 C 6 H 13 1.18 1.34 )0.16 2.777 C 7 H 15 1.31 1.57 )0.27 3.308 C 8 H 17 1.97 1.81 0.16 3.839 C 9 H 19 2.41 2.04 0.37 4.36n ¼ 9, r 2 ¼ 0:871, s ¼ 0:265, q 2 ¼ 0:749.Rat kidney tissue 13 (Table 11):log K ¼ 0:50ð0:10ÞC logP 0:03ð0:27Þ ð11Þn ¼ 8, r 2 ¼ 0:961, s ¼ 0:170, q 2 ¼ 0:933, outlier: C 5 H 11 .Rat stomach tissue 13 (Table 12):log K ¼ 0:74ð0:09ÞC logP 0:92ð0:24Þ ð12Þn ¼ 9, r 2 ¼ 0:982, s ¼ 0:157, q 2 ¼ 0:965.Rat pancreas tissue (Table 13): 13log K ¼ 0:72ð0:13ÞC logP 0:93ð0:34Þ ð13Þn ¼ 9, r 2 ¼ 0:961, s ¼ 0:226, q 2 ¼ 0:921.Rat spleen tissue 13 (Table 14):log K ¼ 0:61ð0:17ÞC logP 0:59ð0:44Þ ð14Þn ¼ 9, r 2 ¼ 0:914, s ¼ 0:288, q 2 ¼ 0:830.Table 11. Rat kidneylog K Y Pred Dev Clog P1 Me 0.10 0.03 0.07 0.132 C 2 H 5 0.27 0.30 )0.03 0.663 C 3 H 7 0.66 0.56 0.10 1.184 C 4 H 9 0.87 0.83 0.04 1.715 C 5 H 11 0.78 1.10 )0.32 2.246 C 6 H 13 1.06 1.36 )0.30 2.777 C 7 H 15 1.47 1.63 )0.16 3.308 C 8 H 17 2.00 1.90 0.11 3.839 C 9 H 19 2.34 2.16 0.18 4.36 Outlier.Table 9. Rat lunglog K Y Pred Dev Clog P1 Me )0.21 )0.47 0.25 0.132 C 2 H 5 0.02 )0.14 0.15 0.663 C 3 H 7 0.23 0.20 0.03 1.184 C 4 H 9 0.41 0.53 )0.12 1.715 C 5 H 11 0.53 0.86 )0.33 2.246 C 6 H 13 0.83 1.19 )0.37 2.777 C 7 H 15 1.28 1.53 )0.25 3.308 C 8 H 17 2.10 1.86 0.24 3.839 C 9 H 19 2.59 2.19 0.39 4.36Table 12. Rat stomachlog K Y Pred Dev Clog P1 Me )0.59 )0.83 0.24 0.132 C 2 H 5 )0.52 )0.43 )0.09 0.663 C 3 H 7 )0.14 )0.04 )0.10 1.184 C 4 H 9 0.34 0.35 )0.02 1.715 C 5 H 11 0.51 0.75 )0.24 2.246 C 6 H 13 1.21 1.14 0.07 2.777 C 7 H 15 1.65 1.53 0.12 3.308 C 8 H 17 1.83 1.93 )0.09 3.839 C 9 H 19 2.42 2.32 0.11 4.36
C. Hansch et al. / Bioorg. Med. Chem. 12 (2004) 3391–3400 3397Table 13. Rat pancreaslog K Y Pred Dev Clog P1 Me )0.49 )0.84 0.34 0.132 C 2 H 5 )0.42 )0.45 0.03 0.663 C 3 H 7 )0.16 )0.07 )0.09 1.184 C 4 H 9 0.16 0.31 )0.15 1.715 C 5 H 11 0.40 0.70 )0.29 2.246 C 6 H 13 0.96 1.08 )0.12 2.777 C 7 H 15 1.33 1.46 )0.13 3.308 C 8 H 17 1.98 1.85 0.14 3.839 C 9 H 19 2.50 2.23 0.27 4.36Table 17. Rat adipose tissuelog K Y Pred Dev Clog P1 Me )0.46 )0.61 0.15 0.132 C 2 H 5 )0.12 )0.18 0.05 0.663 C 3 H 7 0.19 0.26 )0.07 1.184 C 4 H 9 0.47 0.69 )0.21 1.715 C 5 H 11 0.86 1.12 )0.26 2.246 C 6 H 13 1.82 1.55 0.27 2.777 C 7 H 15 2.09 1.98 0.11 3.308 C 8 H 17 2.33 2.41 )0.08 3.839 C 9 H 19 2.89 2.85 0.04 4.36Table 14. Rat spleenlog K Y Pred Dev Clog P1 Me )0.24 )0.51 0.27 0.132 C 2 H 5 )0.06 )0.19 0.13 0.663 C 3 H 7 0.12 0.13 )0.01 1.184 C 4 H 9 0.34 0.45 )0.11 1.715 C 5 H 11 0.46 0.77 )0.31 2.246 C 6 H 13 0.81 1.09 )0.28 2.777 C 7 H 15 1.14 1.41 )0.28 3.308 C 8 H 17 1.86 1.73 0.13 3.839 C 9 H 19 2.51 2.05 0.45 4.36Rat adipose tissue 13 (Table 17):log K ¼ 0:82ð0:11ÞC logP 0:71ð0:28Þ ð17Þn ¼ 9, r 2 ¼ 0:979, s ¼ 0:185, q 2 ¼ 0:969.Rat skin tissue 13 (Table 18):log K ¼ 0:59ð0:18ÞC logP 0:35ð0:48Þ ð18Þn ¼ 8, r 2 ¼ 0:914, s ¼ 0:303, q 2 ¼ 0:825, outlier: C 5 H 11 .Rat heart tissue 13 (Table 19):Table 15. Rat gutlog K Y Pred Dev Clog P1 Me )0.22 )0.44 0.22 0.132 C 2 H 5 )0.14 )0.13 )0.01 0.663 C 3 H 7 0.08 0.18 )0.10 1.184 C 4 H 9 0.49 0.49 0.00 1.715 C 5 H 11 0.60 0.80 )0.20 2.246 C 6 H 13 1.09 1.11 )0.02 2.777 C 7 H 15 1.30 1.42 )0.11 3.308 C 8 H 17 1.68 1.73 )0.05 3.839 C 9 H 19 2.31 2.04 0.27 4.36Rat gut tissue 13 (Table 15):log K ¼ 0:59ð0:10ÞC logP 0:52ð0:25Þ ð15Þn ¼ 9, r 2 ¼ 0:969, s ¼ 0:164, q 2 ¼ 0:932.Rat muscle tissue 13 (Table 16):log K ¼ 0:55ð0:07ÞC logP 0:46ð0:19Þ ð16Þn ¼ 9, r 2 ¼ 0:980, s ¼ 0:124, q 2 ¼ 0:961.log K ¼ 0:58ð0:05ÞC logP 0:50ð0:14Þ ð19Þn ¼ 9, r 2 ¼ 0:989, s ¼ 0:093, q 2 ¼ 0:978.Rat brain tissue 13 (Table 20):log K ¼ 0:61ð0:13ÞC logP 0:52ð0:34Þ ð20Þn ¼ 8, r 2 ¼ 0:959, s ¼ 0:211, q 2 ¼ 0:914, outlier: C 5 H 11 .Table 18. Rat skinlog K Y Pred Dev Clog P1 Me 0.05 )0.28 0.33 0.132 C 2 H 5 0.10 0.03 0.06 0.663 C 3 H 7 0.26 0.35 )0.09 1.184 C 4 H 9 0.36 0.66 )0.30 1.715 C 5 H 11 0.36 0.97 )0.61 2.246 C 6 H 13 1.17 1.29 )0.12 2.777 C 7 H 15 1.19 1.60 )0.41 3.308 C 8 H 17 2.07 1.91 0.16 3.839 C 9 H 19 2.60 2.23 0.37 4.36 Outlier.Table 16. Rat musclelog K Y Pred Dev Clog P1 Me )0.22 )0.39 0.17 0.132 C 2 H 5 )0.07 )0.10 0.02 0.663 C 3 H 7 0.21 0.20 0.01 1.184 C 4 H 9 0.34 0.49 )0.15 1.715 C 5 H 11 0.61 0.78 )0.18 2.246 C 6 H 13 1.05 1.07 )0.02 2.777 C 7 H 15 1.32 1.37 )0.05 3.308 C 8 H 17 1.71 1.66 0.05 3.839 C 9 H 19 2.10 1.95 0.15 4.36Table 19. Rat heartlog K Y Pred Dev Clog P1 Me )0.26 )0.42 0.16 0.132 C 2 H 5 )0.14 )0.12 )0.03 0.663 C 3 H 7 0.09 0.19 )0.10 1.184 C 4 H 9 0.49 0.49 )0.01 1.715 C 5 H 11 0.68 0.80 )0.12 2.246 C 6 H 13 1.10 1.11 0.00 2.777 C 7 H 15 1.37 1.41 )0.04 3.308 C 8 H 17 1.75 1.72 0.03 3.839 C 9 H 19 2.11 2.02 0.09 4.36