Original Research - STAR Journal
Original Research - STAR Journal
Original Research - STAR Journal
- No tags were found...

You also want an ePaper? Increase the reach of your titles
YUMPU automatically turns print PDFs into web optimized ePapers that Google loves.
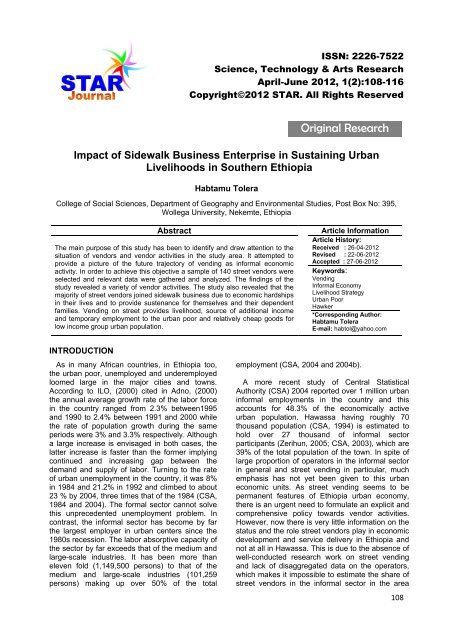
Habtamu Tolera <strong>STAR</strong>, April-June 2012, 1(2):108-116under investigation. So the provision of informationon vendors and their customers to urban plannersand policy makers might help them formulate longtermpolicy towards vendors in the country ingeneral and in the study area in particular.MATERIALS AND METHODSDescription of Study AreaHawassa, the capital of the newly delineatedSouthern Nations and Nationalities and PeoplesRegional State (SNNPRS) is located at 07 0 03’North latitudes and 30 0 29 ’ East longitudes. It isfound along the international road that connectsAddis Ababa, Ethiopia with Nairobi at 275kilometers south of Addis Ababa. The town isbounded by Lake Hawassa in the west, Oromiaregional state in the North and Alamura Mountainin the South and Hawassa Zuria Wereda in theEast. The town emerged in 1960 as a smallvillage along the shores of Lake Hawassa anddesignated as the capital town of SidamoAdministrative Region two years later by EmperorHaile ellasie the first. However, since 1992, thetown has become the socio-economic andpolitical center of SNNPRS.Sampling, Data Collection and AnalysisThe target population for the survey is streetvendors of Hawassa Town. According to theinformation obtained from the City Administrationof Hawassa, there is no complete record of streetvendors. So, the researcher constructedsampling frame through a census method. Staticand semi-static vendors were enumerated interms of the types of enterprises they operate. Atotal of 438 vendors were found to be engaged indifferent enterprises and then manageablesample population was determined as 32 % of atotal giving a sample size of 140. Hence, samplevendors were drawn using a stratified randomsampling procedure and proportional samplingfraction. The former was used because thepopulation to be sampled was heterogeneouswhile the latter was preferred to obtain samplenumber that was proportional to each stratumsize in the population. Eventually, representativerespondents were randomly selected andapproached for interview.Table 1: Coverage of sample vendors by types of activities.Types of activities (Industry) Sample Frame Sample Size % SharePrepared food 50 16 11.0Secondhand clothes 104 33 24.0Bicycle service 129 41 29.0Fruits and vegetables 74 24 17.0Household goods 39 13 9.0Miscellaneous activities 42 13 10.0Total 438 140 100.0The main body of information, primary data,was collected through questionnaire to the streetvendors. It contains details of vendors’ sociodemographicaspects; details of the economicaspects of vendor operations and the nature oflinkages exist in terms of initial capital, credit,wage, purchase, sale and labor mobility withother sectors and the major challenges facedvendor operators. The questionnaire wascarefully designed and structured based on theobjective of the study. Ten interviewers wereselected on the bases of their personalcharacteristics and educational level (all are highschool graduates). They were given a two daystraining on the nature and details of thequestionnaire as well as on the procedures theyshould follow while conducting the interview. Apilot survey consisting of 15 vendors (11% of thetotal sample) was conducted to pretest thequestionnaire before embarking on the survey.In some cases, however, the secondary datasources also referred. The secondary data usedin this study were different official documents likebooks, proceedings, journals, variouspublications, web sites, etc on the subject ofinformal sectors and street vending. The sourceswere from various organizations such asILO/JASPA and various departments andlibraries of Addis Ababa University, etc.Both qualitative and quantitative methods ofdata analysis were used. The first stage of dataanalysis comprised the preparation of code booksfor the questionnaires. The questionnaires wereedited, coded, and analyzed using the (SPSS)computer programs. The quantitative techniquesutilized in this study were cross tabulations andfrequency % ages. Tables, figures and graphswere used to show the results of the analysis andto facilitate the interpretation of the data.109
Habtamu Tolera <strong>STAR</strong>, April-June 2012, 1(2):108-116RESULTS AND DISCUSSIONSocio-Demographic Features of VendorRespondentsAs the survey result reveals, vendingoperations were a particularly important source ofemployment and income for youths. The majorityof the respondents (82.9%) were in youth agestructure, i.e. between 16-30 years. Furthermore,some 15.0% vendor entrepreneurs aged 31 yearsand above and the remaining 2.1% were agedbetween 11-15 years old.Vending industry was a particularly importantsource of employment and income for bothgender groups. About 67.1% of the entrepreneurswere males and 32.9 % were females. Hence,males’ representation was higher than females.On the other hand, there were some interestinginter-firm variations with respect to enterpriseowners. In Hawassa, 79.2% of total enterpriseowners in fruit and vegetable, 81.2% in preparedfood and 61.5% in household goods hawkingwere females. Females were also significant inmiscellaneous types of vendor activities such ascharcoal selling, cosmetics selling, shoe vending,etc. Such informal income generating activitiesgave women a special way to escape social andcultural restrictions by strengthening theireconomic status in the households or outsidewhen divorced or separated or unmarried in thecity surveyed.The survey found out that, out of the 140vendor entrepreneurs interviewed, 59.3%enterprise owners were single, 30% married, 5%widowed and 5.7 were divorced. This evidenceclearly indicates vending permits unmarried,married, widowed and divorced population togenerate jobs and income with small capitaloutlay, little skill and education in the areasurveyed. According to Central StatisticalAuthority (1994) report on the marital status ofHawassa city, 37.4% were married, 4.3%widowed, 53.1% single and 5.3% divorced. Thisevidence is almost confirming the marital statusof the survey result in the study area. Closerexamination of the data in table also suggeststhat in almost all enterprises, most of theenterprise owners were single. This implies thatvendor activities represent mainly survivalstrategies adopted in the face of growingunemployment and underemployment aiming atraising incomes for own support so as to alleviatehunger and poverty. Secondly, this fact is in casewhen vendors have tried some to strengthen theireconomic base and stock to support themselvesand other burdens/ dependents before marriage.Out of 140 sampled vendors interviewed,15.4% had (1-2) children, 12.2% (3-4), 7.1% (5-6), and some 5.7% of respondents had (7-8)children. Thus, the owners had relatively largefamily members whose livelihoods depend oninformal sources of income. This evidence,therefore, suggests the significance of urbaninformal employment, in this case of streetvending. The rest, also the overwhelming majority(59.3%), cited no children. They were soleproprietors. However, they had rather extendedfamily and other dependents. This implies thatvending was not only providing cash income tosustain the livelihood of vendors themselves andtheir immediate family but the enterprise alsoimportant for the survival of their extendedfamilies in the households and other dependentsfrom somewhere else in the households.When we come to types of ethnicity, out of 140sampled respondents interviewed, 30.0 per cent,and 25.0% were the Wolayita and the Guragheethnic groups respectively. The two were theknown vendor entrepreneurs in the cityunderstudy. The two groups alone constitutedover half of the total sample employment. Otherethnic groups such as Tigraway, Hadiya,Kambata, and Gedeo were insignificant innumber (7.1%) in the study area. Turning tospecific vendor activities, the Guraghe groupsdominated several of the streetentrepreneurships. 56 %, 48.4%, and 38.4 % ofvendors in prepared food, secondhand cloth, andhousehold goods enterprises were respectivelythe Guraghes. A recent survey reinforces theseevidences. For instance, according to Tebarek(1997), the predominance of this ethnic group intrade-oriented activities was consistent with theculture of the people that induced bothgeographical mobility and entrepreneurial activity.Education is one of the most important socialaspects. The level of education influencesproductivity, in this cases the productivity ofvendor activities. It was a key determinant factorof entrepreneurial activities, primarily, to developthe ability and technical skills ofentrepreneurships to improve the productivity ofthe work force and the level of firms’ performanceand their vertical proliferations (Kassahun, 2000)low. From overall 140 respondents, 87.1% wereliterate whereas 12.9% were illiterate. From thisavailable evidence, one can observe that vendingemployments in study area were indeedsubstantial. This is the fact that vending activitiesplayed an important role in proffering employmentand income for broad masses of urban literatessuch as school leavers, school attendees,technical school graduates and some illiterates.110
Habtamu Tolera <strong>STAR</strong>, April-June 2012, 1(2):108-116The study area was overwhelmingly consideredto hold impoverished rural migrants who flockedto the urban informal sector for urban streetvending. A great proportion of respondents (75.7%) were found to be from outside Hawassa whileonly 24.3% were city-born. The major push factorof village to town migration was probably thescarcity of farmland due to population pressureand the drudgery associated with traditionalfarming for very low returns in rural setting. Therecent increasingly growing importance of thetown as a socio-economic and political center ofthe SNNPRS was also considered as pull factorfor migrants from both rural and urban areas. Theamalgam of these factors mainly attracted largeproportion of population from the city’s hinterlandand other urban centers (Figure 1).Figure 1: Migrant vendor respondents by rural and urban settings.Over all, Figure1 depicts the growingimportance of street vending incomes insustaining urban livelihood of rural migrants,urban migrants, and city-born individuals andhouseholds in the study town According to thefinding, 50.7% of the respondents reportedmigration to the city to look for employment. Insupport of this evidence, Todaro (1986) statedthat the migrants’ main reason to move to townswould be directly related to the probabilities offinding a job. Some 16.4% mentioned to meetparents /relative/ friends, 6.5% to go to school,and only 2.1% cited city-attraction as the mainreason for coming to the study town.Table 2: Vendors by types of activities and their reasons for coming to the town.Reasons forMigrationFruits andVegetablesSecondHandClothesBicycleServicePreparedFoodHouseHoldGoodsMiscellane-ousActivitiesTotalNo % No % No % No % No % No % No %Employment 9 37.5 23 69.8 26 63.5 2 12.5 5 38.4 6 46.1 71 50.7Meet Parents 1 4.2 1 3.0 9 22.0 6 37.5 3 23.1 3 23.1 23 16.4To go toschool2 8.3 1 3.0 1 2.4 3 18.8 1 7.7 1 7.7 9 6.5City-attraction 1 4.2 - - 2 4.8 - - - - - - 3 2.1Non-migrants 11 45.8 8 24.2 3 7.3 5 31.2 4 30.8 3 23.1 34 24.3Total 24 100 33 100 41 100 16 100 13 100 13 100 140 100Economic Aspects of Vendors BusinessVentureThe informal sector is heterogeneous incharacter and comprises a wide variety ofactivities. There were even distinct differencesamong the vendor operations in terms of themajor commodity or service groups sold ordelivered (Sethruaman, 1997; De Soto, 1989;McGee, 1986). Vendor entrepreneurs inHawassa at “Piassa and Menaheria” areas alsobelonged to this group. They engaged in a varietyof types of street based activities and offereddifferent kinds of goods or services to thecommunity at low cost. Table 3 shows types ofvendor activities and their importance in terms ofnumber of operators employed and types ofgoods or service they sold or delivered topedestrian customers, individuals and111
Habtamu Tolera <strong>STAR</strong>, April-June 2012, 1(2):108-116households, as well as data in Table 3 clearlyshows vending activities are different in kind andbicycle services and secondhand cloth sellingwere by far the predominant activities in the studyarea.Table 3: Vendors by types of their business operations.Types of FirmsFrequency%age Share ofVendor OperatorsBicycle services 41 29.0Secondhand clothes 33 24.0Fruits and vegetables 24 17.0Prepared food 16 11.0Household goods 13 9.0Miscellaneous activities 13 10.0Total 140 100.0The dominant form of ownership in the streetoccupation was consistently individualproprietorship. In the study area, as data in Table4 reveal, 94.3%, almost exclusively, wereorganized under sole ownership. About 4.3% ofvendors’ establishments were family ownershipwhile the remaining 1.4% was operated aspartnership ownership.Table 4: %age of vendors by types of activities and ownership pattern.OwnershipPatternFruitsandVegetableSecondHandClothsBicycleServicePreparedFoodHouseholdgoodsMiscellan-eousActivitiesTotalSole ownership 91.7 96.9 92.7 100 - 92.3 94.3Family Own 8.3 - 7.3 - 92.3 7.7 4.3Partnership - 3.1 - - 7.7 - 1.4Total 100 100 100 100 100 100 100When specific vendor activities viewedindependently, the pattern was analogues withthe above situation. For instance, in second handclothes sole ownership accounted for 96.9% ofthe total sampled population. The correspondingproportion for prepared food, bicycle service,miscellaneous activities and fruit and vegetableoperations were 100.0%, 92.7%, 92.3% and91.7% respectively. In contrast, there was no soleownership enterprise owner in household goodbusiness operation. The majority of householdgoods vending (92.3%) ownerships were thefamily and the remaining 7.7% were partnershipownership.The survey found out that self-employedoperators represented 67.1% of the streetbusiness employment, i.e. over two-thirds ofvendor activities were what would be termed as asingle person-operated enterprises and about32.9% of them were ran by 2-3 persons. Thecases of the latter types, owners were asked tostate their relationships with their businessoperations. Accordingly, 73.9% were found to beunpaid family workers, 23.9% were paidemployees, and 2.2% were unpaid apprentices.Thus, employment in the street occupation instudy area held working proprietors/selfemployed,unpaid family workers, unpaidapprentices and paid employees. Clearly, in thevendor context, street activities represent mainlysurvival strategies adopted in the face of growingunemployment. The evidence seems to supportthe widely held view that the majority of the urbanlabor force is self-employed. It reinforces theimportance of self-employment in sustaininglivelihood in the further urban labor profile. Themajority of labors employed were migrants fromrural labor work especially agriculture. Somewere school leavers, graduates from technicalschools and retrenched workers due to thecollapse of previous occupations.112
Habtamu Tolera <strong>STAR</strong>, April-June 2012, 1(2):108-116Table 5: Vendors by types of activities and sources of their skills training.Sourceof SkillsFruit andVegetableSecondHandClothBicycleServicePreparedFoodHouseholdGoodsMiscellan-eousActivitiesTotalNo % No % No % No % No % No % No %Self-taught 17 70.8 23 69.7 29 70.7 10 62.4 4 30.8 5 38.4 88 62.9Formal Training - - - - - - - - - - - - - -ApprenticeProgramme5 20.8 8 24.2 12 29.3 3 18.8 5 38.4 3 23.2 36 25.7Family 2 8.4 2 6.1 - - 3 18.8 4 30.8 5 38.4 16 11.4Total 24 100 33 100 41 100 16 100 13 100 13 100 140 100Level of training background and skills acquiredover the years influence the income level ofvendor respondents. The source of knowledgeand the level of training background of informalsector operators were affected not only bytechnical and production aspects but also by thequestions of management and organization.Their links with formal training institutions werevery low (Bagchaw 1993; UNECA, 1993). Thesurvey result reinforces this evidence.The predominant position of skill acquisition instreet vending was self-taught/personal effort, i.e.62.9% of vendor entrepreneurs had acquiredtheir skills by teaching themselves. The secondmost important method of skill acquisition wasthrough the informal apprentice programme/ onjob training, i.e. learning by observing andassisting other workers. This was the fact thatapprentice was a cost effective because itcombines learning with work. In study area, thetotal number of respondents that acquired theirskills using this method was 25.2%. Therefore,with regard to links with training institutions, itwas noted that a vast majority of the vendorentrepreneurs (over 88%) obtained their trainingusing these two methods. Turning to specificactivities, these methods were typically the mostskill acquisition methods in bicycle service andfruit and vegetable operations. Furthermore,some 11.4% of the sampled respondents citedfamily as source of their skill training.Surprisingly, no vendor obtained formal trainingthat had a direct relevance with his/her presenthawking profession in study area. This impliespoor links with formal training institutions and theabsence of government attentions to helpvendors in their course of struggle against hungerand poverty through planned interventions suchas training. Therefore formal training should berequired because the lack of such training inmarketing and technical skills perhaps influencethe productivity and work efficiency of vendorbusinesses in the area surveyed.The study result also investigates the longevityof vendors in vending profession in study area.Accordingly, the largest proportion of vendors(75%) characterized by recent entrants whohawked 4 years and below. Some 20% hawkedbetween 5 and 10 years. This shows that hugenumbers of street operators joined the businessin a very recent past.The study reveals vendors modes of paymentsto obtain goods or services for their stalls. Themajority of vendors (69.3%) paid for their goodsor services sold by cash. Some 21.4% ofrespondents obtained on consignment/agreement while 7.9% mentioned credit as theirmain mechanisms to receive of goods or servicesfrom sources. The remaining 1.4% used severalof these approaches such as cash and credit,cash and consignment, etc.So, the evidence shows that most vendorspreferred to pay for their goods or services bycash and keeps a low volume of stock. This isbecause they hoped to sell their stock quickly andtherefore purchase their goods or services for thenext day to earn immediate cash to sustain dailyliving. The root cause for supplying of low volumeof stock is primarily vendors’ low capital base toinvest on large stocks and even lack of stores tosecure this stock. Consignment/ contract/ wasthe second most important modes of obtaininginputs next to cash payments.According to Ethiopian labor law, the averageworking hours a day for all class of workers is 8hours (Mulat, 1989). Based on this information ifit is assumed that 48 (8 hrs a day, 6 days a week)hours per week represents full time employment,then 85.7% of the vendor entrepreneurs invending activities can be considered full timewhile about 14.3% worked less than 8 hours per113
Habtamu Tolera <strong>STAR</strong>, April-June 2012, 1(2):108-116day (less than 48 hours/week), i.e. they spentless than full time.As survey result indicated, out the 140 sampledentrepreneurs, the larger proportion of vendors(52.2%) mentioned selling at discount as theirmajor adaptive mechanism to attractclients/markets. This goes in line with theopinions of the customers in the study area .Thismeans that the lower price of vendors’ goods orservices was the major motives that pull them tothe vendor markets .About 21.4% said calling fortheir goods or services together with price astheir best method to sell the major part of theirsales/stock. A small 0.7% used other approachessuch as selling by credits, provision of qualitygoods or services, and the like. Over all, thecommon mechanism vendors adopted in studyarea to sell the major part of their sales or toreduce intense market competition was loweringtheir profit margins substantially. The fact thatvendors’ competition did not only provide food,clothes, household goods, etc at cheaper priceswhich make up the largest share of poor peoplebudget but it was important for the survival of thepoor with limited purchasing power.Table 6: Vendors by types of activities and level of their initial capital.BirrFruit andVegetableSecondhandClothBicycleServicePreparedFoodHouseholdGoodsMiscellaneousActivitiesTotalNo % No % No % No % No % No % No %
Habtamu Tolera <strong>STAR</strong>, April-June 2012, 1(2):108-116Figure 2: Initial capital versus current capital.and another important point is that even thecurrent capital of 8 vendors (or 5.7%) out strippedBirr 1000 and adds another new income categorybeyond that of initial capital level (Figure 2).We asked about whether their income wassatisfying to them in fulfilling the basic needs oftheir family and other dependents, the majority(60.7%) would reply it was not enough while39.3% said it was better. The former were alsoasked how did they bridge a gap. Then, 37.2%mentioned that they had a support from friends/relatives, 15.5% reported careful management/saving of what they would get, 7.2% noted thatthe family generated other incomes and 4.1%reported selling of assets for survival.In nutshell, half (50.8%) of street vendorsspend about Birr 250 and below while theremaining half (49.2%) Birr 251 and above. In hisinformal and closer discussion with respondents,a researcher examined that vendors expendmuch larger money than what they claimed to betheir income. Most of the money they earnedwere spent on fulfilling basic needs of theirfamilies such as food, clothing, house rent andschool fees, which make up the largest share oftheir monthly earnings. To them, vendingrepresents mainly survival strategies adopted toavoid unemployment and to earn a subsistenceincome.CONCLUSIONSThe study identified different types of vendoractivities. These are fruits and vegetables,secondhand clothes, bicycles services, preparedfood, household goods and miscellaneousactivities. These street enterprises provide someadvantages to the town’s economy andpopulation by performing major role in the saleand distribution of foodstuffs and othercommodities or in delivering urban services.Vending for bicycle service and secondhandclothes were by far the predominant activities.They alone absorbed 53% of the total sampledvendor operators and delivered a variety of goodsor services for low income individuals andhouseholds.The survey reveals that the majority of streetvendors (82.9%) were concentrated in the youngage group between 16 and 30 years. It is an agegroup when youths were either married or werepreparing to marry to set up own family apartfrom parents stock. Thus, street vending wouldbe an attractive alternative to these youths thanwaiting for employment in urban modern sectorunits, which are at best in very limited and shortsupply, and again which are highly competitiveseeking out more educated and skilled personsthan they are. It is also found that street vendingwas a particularly important source ofemployment and income for both sexes. Male’srepresentation was 67.1%, higher than females,Vending enterprises were dominated by single/unmarried vendor entrepreneurs (59.3%). Thisimplies that vendor activities represent mainlysurvival strategies adopted in the face of growingunemployment and underemployment aiming atraising incomes for own support so as to alleviatehunger and poverty. Secondly, this fact is in casewhen vendors have tried some to supportthemselves and other economic burdens/dependents and to strengthen their economicbase and stock before marriage.115
Habtamu Tolera <strong>STAR</strong>, April-June 2012, 1(2):108-116The dominant ethnic groups flocked to streetvending occupation were wolayita (30%) andGuraghe (25%). In terms of specific types ofvendor activities, the Guraghe group dominatedseveral activities. It was found that informal streetbusiness was closely linked to migration in thestudy area. Almost half of respondents (46.4%)were of rural origin while 29.3% were urbanmigrants. The remaining 24.3% were city-born.Vending on street provides livelihood, source ofadditional income and temporary employment tothe urban poor and relatively cheap goods for lowincome group urban population. In this context,the country should develop an integrated informalsector policy which frequently promotes andtransfers these sectors into formal enterprises forthe overall socio economic development of thecountry.REFERENCESBagachwa, M.D. and Lauanga. (1993). The state andthe informal sector in Tanzania. ILO/JASPA, AddisAbaba.Central Statistical Authority. (1984). Population andHousing Census of Ethiopia, Addis Ababa.Central Statistical Authority. (1994). Population andHousing census of Ethiopia, Addis Ababa.Central Statistical Authority. (1996). Report on urbaninformal sector sample survey; statistical bulletin,174, Addis Ababa.Central Statistical Authority (2000). Report on urbaninformal sector sample survey, statistical bulletin,319, Addis Ababa.Central Statistical Authority. (2000). The 1994Population and Housing census of Ethiopia, Volume1, statistical report, Addis Ababa.Central Statistical Authority. (2004a). Urban biannualemployment unemployment survey, volume 319,statistical bulletin, Addis Ababa.Central Statistical Authority. (2004b). Report on largeand medium scale manufacturing and electricityindustrial survey statistical bulletin, Volume321,Addis Ababa.De Soto, H. (1989). The Other Path, Harper and RowNew York.International Labor Office. (1972). Employment,income and equality: strategies for increasingproductivity in Kenya, Geneva.International Labor Office. (1984). The informal sector inAfrica: synthesis and country summaries, AddisAbaba.International Labor Office. (1985). Informal sector inAfrica, Addis Ababa.International Labor Office. (1991). The dilemma of theinformal sector. International Labor Conference, 78 thsessions, Geneva.International Labor Office. (1992). African employreport.International Labor Office. (1993). Ethiopia towardssustained employment promotion, Addis Ababa.International Labor Office. (1997/98). World labor report:Industrialization, democracy and social stability,Geneva.Kassahuun Argaw. (2000). The urban informal sectorin Nazareth Town: The case of women petty tradersin “Gimb Gebeya,” unpublished M.A. thesis,Deportment of Geography, Addis Ababa University,Addis Ababa.McGee, T. (1986). On the utilization of dualism: Theinformal sector and Mega urbanization in developingcountries. RDD 17(1): 83-94.Sethuramen, S.V. (1976). The urban informal sector:Concepts, measurement and policy. ILO, Geneva.Sethuramen, S.V. (1977). The Urban informal sector inAfrica.Sethuramen, S.V. (1981). The role of urban informalsectors in Sethuraman (ed.): The urban informalsector in developing countries. Employment, povertyand environment. ILO, Geneva.Sethuramen, S.V. (1997). Urban poverty and theinformal Sector: A critical assessment of currentstrategies. ILO, Geneva. (Online), available athttp://www.ilo.org/public/english/employment/recon/eiip/publ/1998/urbpover.htmTebarek Leka. (1997). Employment and Income inUrban Informal Sector: The Case of ShoeEnterprises in “Wereda” 5 at Merkato Area.Teshome Adno (2000). Unemployment in AddisAbaba: Trends, level and differentials. unpublishedM.A. Thesis; Department of Demography, AddisAbaba University, Addis Ababa.Mulat Tehome. (1986). The average working hours aday for all class of workers in Ethiopia.Todaro, P. M. (1986). International migration, domesticunemployment and urbanization: A three-sectormodel, New York.UNECA. (1993). Creating of enabling environment forthe informal sector in Ethiopia, Addis Ababa.UNECA. (2002). The development of micro financeindustry in Ethiopia: performance, problems andprospects in Gebrehiowt Ageba, Jemal Mohammedand Solomon Tesfaye (Eds): Policy reform,implementation and outcome in Ethiopia. AddisAbaba.Zerihun Dido (2005). Informal business sectorinventory and analysis in “kebele” 06, Higher (1) ofHawassa.116