Water security for Indore city - ImagineIndore.org
Water security for Indore city - ImagineIndore.org
Water security for Indore city - ImagineIndore.org
- No tags were found...

Create successful ePaper yourself
Turn your PDF publications into a flip-book with our unique Google optimized e-Paper software.
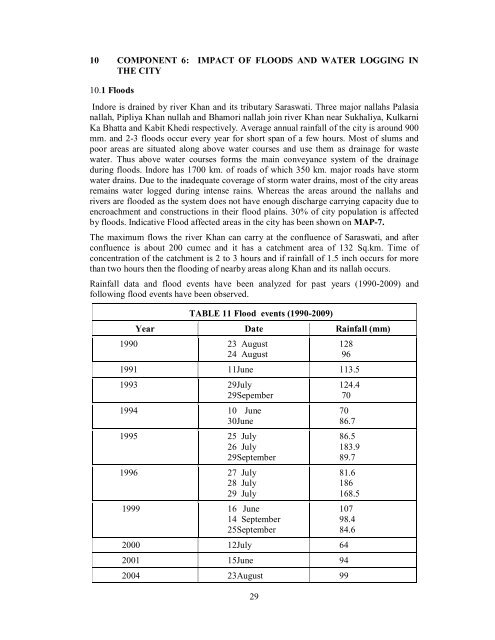
10 COMPONENT 6: IMPACT OF FLOODS AND WATER LOGGING INTHE CITY10.1 Floods<strong>Indore</strong> is drained by river Khan and its tributary Saraswati. Three major nallahs Palasianallah, Pipliya Khan nullah and Bhamori nallah join river Khan near Sukhaliya, KulkarniKa Bhatta and Kabit Khedi respectively. Average annual rainfall of the <strong>city</strong> is around 900mm. and 2-3 floods occur every year <strong>for</strong> short span of a few hours. Most of slums andpoor areas are situated along above water courses and use them as drainage <strong>for</strong> wastewater. Thus above water courses <strong>for</strong>ms the main conveyance system of the drainageduring floods. <strong>Indore</strong> has 1700 km. of roads of which 350 km. major roads have stormwater drains. Due to the inadequate coverage of storm water drains, most of the <strong>city</strong> areasremains water logged during intense rains. Whereas the areas around the nallahs andrivers are flooded as the system does not have enough discharge carrying capa<strong>city</strong> due toencroachment and constructions in their flood plains. 30% of <strong>city</strong> population is affectedby floods. Indicative Flood affected areas in the <strong>city</strong> has been shown on MAP-7.The maximum flows the river Khan can carry at the confluence of Saraswati, and afterconfluence is about 200 cumec and it has a catchment area of 132 Sq.km. Time ofconcentration of the catchment is 2 to 3 hours and if rainfall of 1.5 inch occurs <strong>for</strong> morethan two hours then the flooding of nearby areas along Khan and its nallah occurs.Rainfall data and flood events have been analyzed <strong>for</strong> past years (1990-2009) andfollowing flood events have been observed.TABLE 11 Flood events (1990-2009)Year Date Rainfall (mm)1990 23 August24 August29128961991 11June 113.51993 29July29Sepember1994 10 June30June1995 25 July26 July29September1996 27 July28 July29 July1999 16 June14 September25September2000 12July 642001 15June 94124.4707086.786.5183.989.781.6186168.510798.484.62004 23August 99