The Dormouse Monitor vol 1 2012 - People's Trust for Endangered ...
The Dormouse Monitor vol 1 2012 - People's Trust for Endangered ...
The Dormouse Monitor vol 1 2012 - People's Trust for Endangered ...

You also want an ePaper? Increase the reach of your titles
YUMPU automatically turns print PDFs into web optimized ePapers that Google loves.
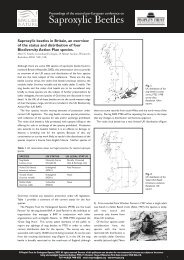
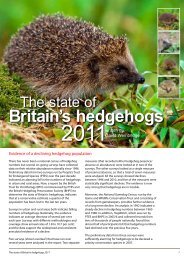
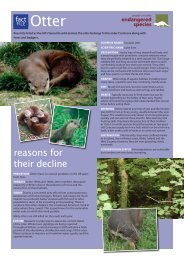
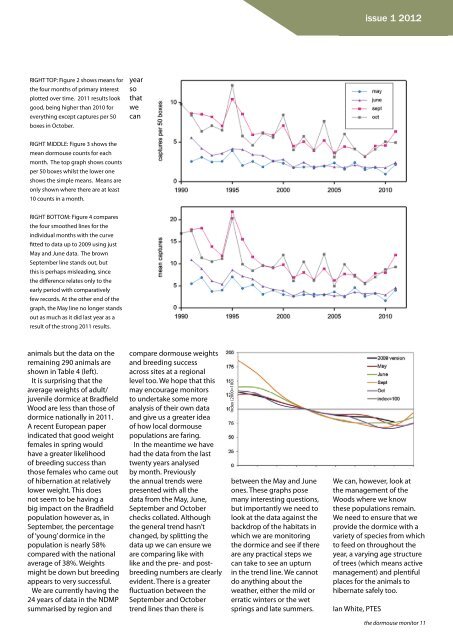
issue 1 <strong>2012</strong>RIGHT TOP: Figure 2 shows means <strong>for</strong>the four months of primary interestplotted over time. 2011 results lookgood, being higher than 2010 <strong>for</strong>everything except captures per 50boxes in October.yearsothatwecanRIGHT MIDDLE: Figure 3 shows themean dormouse counts <strong>for</strong> eachmonth. <strong>The</strong> top graph shows countsper 50 boxes whilst the lower oneshows the simple means. Means areonly shown where there are at least10 counts in a month.RIGHT BOTTOM: Figure 4 comparesthe four smoothed lines <strong>for</strong> theindividual months with the curvefitted to data up to 2009 using justMay and June data. <strong>The</strong> brownSeptember line stands out, butthis is perhaps misleading, sincethe difference relates only to theearly period with comparativelyfew records. At the other end of thegraph, the May line no longer standsout as much as it did last year as aresult of the strong 2011 results.animals but the data on theremaining 290 animals areshown in Table 4 (left).It is surprising that theaverage weights of adult/juvenile dormice at BradfieldWood are less than those ofdormice nationally in 2011.A recent European paperindicated that good weightfemales in spring wouldhave a greater likelihoodof breeding success thanthose females who came outof hibernation at relativelylower weight. This doesnot seem to be having abig impact on the Bradfieldpopulation however as, inSeptember, the percentageof ‘young’ dormice in thepopulation is nearly 58%compared with the nationalaverage of 38%. Weightsmight be down but breedingappears to very successful.We are currently having the24 years of data in the NDMPsummarised by region andcompare dormouse weightsand breeding successacross sites at a regionallevel too. We hope that thismay encourage monitorsto undertake some moreanalysis of their own dataand give us a greater ideaof how local dormousepopulations are faring.In the meantime we havehad the data from the lasttwenty years analysedby month. Previouslythe annual trends werepresented with all thedata from the May, June,September and Octoberchecks collated. Althoughthe general trend hasn’tchanged, by splitting thedata up we can ensure weare comparing like withlike and the pre- and postbreedingnumbers are clearlyevident. <strong>The</strong>re is a greaterfluctuation between theSeptember and Octobertrend lines than there isIndex (2000=100)between the May and Juneones. <strong>The</strong>se graphs posemany interesting questions,but importantly we need tolook at the data against thebackdrop of the habitats inwhich we are monitoringthe dormice and see if thereare any practical steps wecan take to see an upturnin the trend line. We cannotdo anything about theweather, either the mild orerratic winters or the wetsprings and late summers.We can, however, look atthe management of theWoods where we knowthese populations remain.We need to ensure that weprovide the dormice with avariety of species from whichto feed on throughout theyear, a varying age structureof trees (which means activemanagement) and plentifulplaces <strong>for</strong> the animals tohibernate safely too.Ian White, PTESthe dormouse monitor 11