Willow Sawfly Management Trials - Weeds Australia
Willow Sawfly Management Trials - Weeds Australia
Willow Sawfly Management Trials - Weeds Australia

Create successful ePaper yourself
Turn your PDF publications into a flip-book with our unique Google optimized e-Paper software.
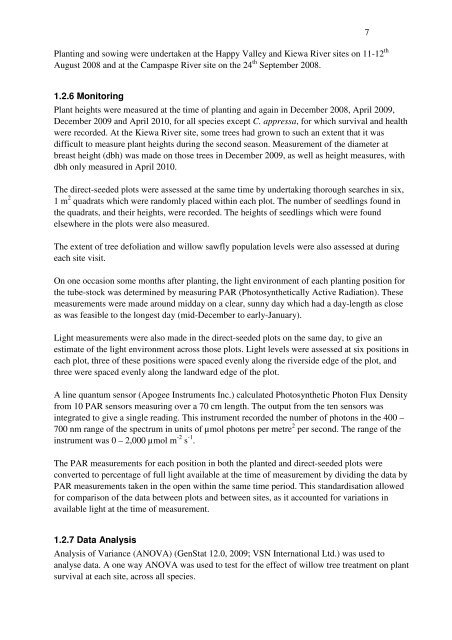
Planting and sowing were undertaken at the Happy Valley and Kiewa River sites on 11-12 thAugust 2008 and at the Campaspe River site on the 24 th September 2008.71.2.6 MonitoringPlant heights were measured at the time of planting and again in December 2008, April 2009,December 2009 and April 2010, for all species except C. appressa, for which survival and healthwere recorded. At the Kiewa River site, some trees had grown to such an extent that it wasdifficult to measure plant heights during the second season. Measurement of the diameter atbreast height (dbh) was made on those trees in December 2009, as well as height measures, withdbh only measured in April 2010.The direct-seeded plots were assessed at the same time by undertaking thorough searches in six,1 m 2 quadrats which were randomly placed within each plot. The number of seedlings found inthe quadrats, and their heights, were recorded. The heights of seedlings which were foundelsewhere in the plots were also measured.The extent of tree defoliation and willow sawfly population levels were also assessed at duringeach site visit.On one occasion some months after planting, the light environment of each planting position forthe tube-stock was determined by measuring PAR (Photosynthetically Active Radiation). Thesemeasurements were made around midday on a clear, sunny day which had a day-length as closeas was feasible to the longest day (mid-December to early-January).Light measurements were also made in the direct-seeded plots on the same day, to give anestimate of the light environment across those plots. Light levels were assessed at six positions ineach plot, three of these positions were spaced evenly along the riverside edge of the plot, andthree were spaced evenly along the landward edge of the plot.A line quantum sensor (Apogee Instruments Inc.) calculated Photosynthetic Photon Flux Densityfrom 10 PAR sensors measuring over a 70 cm length. The output from the ten sensors wasintegrated to give a single reading. This instrument recorded the number of photons in the 400 –700 nm range of the spectrum in units of µmol photons per metre 2 per second. The range of theinstrument was 0 – 2,000 µmol m -2 s -1 .The PAR measurements for each position in both the planted and direct-seeded plots wereconverted to percentage of full light available at the time of measurement by dividing the data byPAR measurements taken in the open within the same time period. This standardisation allowedfor comparison of the data between plots and between sites, as it accounted for variations inavailable light at the time of measurement.1.2.7 Data AnalysisAnalysis of Variance (ANOVA) (GenStat 12.0, 2009; VSN International Ltd.) was used toanalyse data. A one way ANOVA was used to test for the effect of willow tree treatment on plantsurvival at each site, across all species.