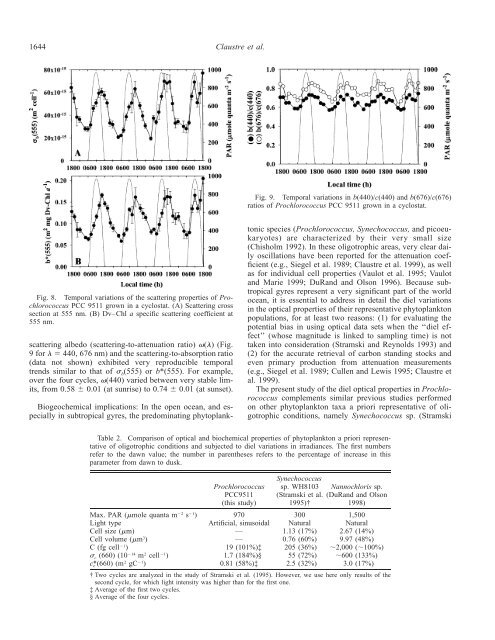
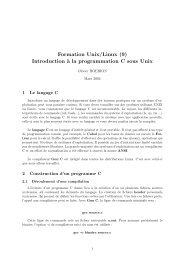
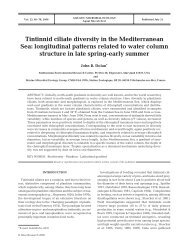
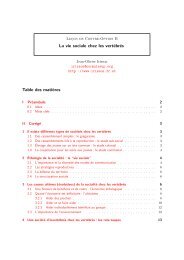
1644 Claustre et al.Fig. 9. Temporal <strong>variation</strong>s <strong>in</strong> b(440)/c(440) and b(676)/c(676)ratios of <strong>Prochlorococcus</strong> PCC 9511 grown <strong>in</strong> a cyclostat.Fig. 8. Temporal <strong>variation</strong>s of the scatter<strong>in</strong>g <strong>properties</strong> of <strong>Prochlorococcus</strong>PCC 9511 grown <strong>in</strong> a cyclostat. (A) Scatter<strong>in</strong>g crosssection at 555 nm. (B) Dv–Chl a specific scatter<strong>in</strong>g coefficient at555 nm.scatter<strong>in</strong>g albedo (scatter<strong>in</strong>g-to-attenuation ratio) () (Fig.9 for 440, 676 nm) and the scatter<strong>in</strong>g-to-absorption ratio(data not shown) exhibited very reproducible temporaltrends similar to that of b (555) or b*(555). For example,over the four cycles, (440) varied between very stable limits,from 0.58 0.01 (at sunrise) to 0.74 0.01 (at sunset).Biogeochemical implications: In the open ocean, and especially<strong>in</strong> subtropical gyres, the predom<strong>in</strong>at<strong>in</strong>g phytoplanktonicspecies (<strong>Prochlorococcus</strong>, Synechococcus, and picoeukaryotes)are characterized by their very small size(Chisholm 1992). In these oligotrophic areas, very clear dailyoscillations have been reported for the attenuation coefficient(e.g., Siegel et al. 1989; Claustre et al. 1999), as wellas for <strong>in</strong>dividual cell <strong>properties</strong> (Vaulot et al. 1995; Vaulotand Marie 1999; DuRand and Olson 1996). Because subtropicalgyres represent a very significant part of the worldocean, it is essential to address <strong>in</strong> detail the diel <strong>variation</strong>s<strong>in</strong> the <strong>optical</strong> <strong>properties</strong> of their representative phytoplanktonpopulations, for at least two reasons: (1) for evaluat<strong>in</strong>g thepotential bias <strong>in</strong> us<strong>in</strong>g <strong>optical</strong> data sets when the ‘‘diel effect’’(whose magnitude is l<strong>in</strong>ked to sampl<strong>in</strong>g time) is nottaken <strong>in</strong>to consideration (Stramski and Reynolds 1993) and(2) for the accurate retrieval of carbon stand<strong>in</strong>g stocks andeven primary production from attenuation measurements(e.g., Siegel et al. 1989; Cullen and Lewis 1995; Claustre etal. 1999).The present study of the diel <strong>optical</strong> <strong>properties</strong> <strong>in</strong> <strong>Prochlorococcus</strong>complements similar previous studies performedon other phytoplankton taxa a priori representative of oligotrophicconditions, namely Synechococcus sp. (StramskiTable 2. Comparison of <strong>optical</strong> and biochemical <strong>properties</strong> of phytoplankton a priori representativeof oligotrophic conditions and subjected to diel <strong>variation</strong>s <strong>in</strong> irradiances. The first numbersrefer to the dawn value; the number <strong>in</strong> parentheses refers to the percentage of <strong>in</strong>crease <strong>in</strong> thisparameter from dawn to dusk.Max. PAR (mole quanta m 2 s 1 )Light typeCell size (m)Cell volume (m 3 )C (fg cell 1 ) c (660) (10 14 m 2 cell 1 )c (660) (m 2 gC 1 )*c<strong>Prochlorococcus</strong>PCC9511(this study)970Artificial, s<strong>in</strong>usoidal——19 (101%)‡1.7 (184%)§0.81 (58%)‡Synechococcussp. WH8103(Stramski et al.1995)†300Natural1.13 (17%)0.76 (60%)205 (36%)55 (72%)2.5 (32%)Nannochloris sp.(DuRand and Olson1998)1,500Natural2.67 (14%)9.97 (48%)2,000 (100%)600 (133%)3.0 (17%)† Two cycles are analyzed <strong>in</strong> the study of Stramski et al. (1995). However, we use here only results of thesecond cycle, for which light <strong>in</strong>tensity was higher than for the first one.‡ Average of the first two cycles.§ Average of the four cycles.
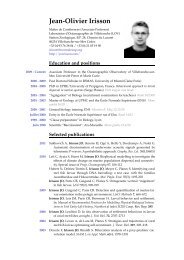
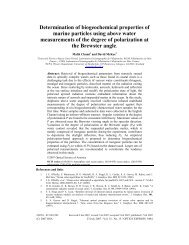
<strong>Prochlorococcus</strong> <strong>optical</strong> <strong>properties</strong>1645Fig. 10. Temporal <strong>variation</strong>s <strong>in</strong> the carbon-specific attenuationcoefficient at 660 nm of <strong>Prochlorococcus</strong> PCC 9511 grown <strong>in</strong> acyclostat.et al. 1995) and Nannochloris sp. (DuRand and Olson 1998).Table 2 summarizes, for some important cellular and <strong>optical</strong><strong>properties</strong>, the differences between these three phytoplankters.Their carbon content spans over two orders of magnitude(20, 200, 2,000 fg C cell 1 , for <strong>Prochlorococcus</strong>, Synechococcus,Nannochloris, respectively). The range of<strong>variation</strong> <strong>in</strong> the attenuation cross section at 660 nm (thewavelength at which most <strong>in</strong> situ measurements are done), c (660), is even greater (0.017, 0.55, 6 m 2 cell 1 for <strong>Prochlorococcus</strong>,Synechococcus, Nannochloris, respectively).The <strong>in</strong>crease <strong>in</strong> c (660) over the daily period is always greaterthan 70% of the morn<strong>in</strong>g value and even reaches 180%for <strong>Prochlorococcus</strong> (this study). This result clearly illustratesthat attenuation/scatter<strong>in</strong>g <strong>properties</strong> of the upperocean might be very sensitive to the diel cycle, <strong>in</strong> particular(but not exclusively) if <strong>Prochlorococcus</strong> significantly contributesto the biomass and to the attenuation coefficient.Claustre et al. (1999) have estimated the contribution of<strong>Prochlorococcus</strong> attenuation to be 8% and 12% of particleattenuation <strong>in</strong> the euphotic zone of subequatorial (5S,150W) and subtropical (16, 150W) stations of the SouthPacific, respectively. In the equatorial Pacific, this contributionis <strong>in</strong> the range 5–15% (DuRand and Olson 1996;Chung et al. 1998).Accurate determ<strong>in</strong>ations of carbon stocks from attenuationmeasurements (generally at 660 nm) require that appropriateconversion factors are used. The carbon-specific attenuationcoefficient c *(660), <strong>in</strong> m 2 gC 1 c, is the parameter that isgenerally chosen for that purpose (e.g., Siegel et al. 1989;Cullen et al. 1992). Thanks to the low biomass of bacteria<strong>in</strong> the culture, <strong>Prochlorococcus</strong> c * c (660) was here determ<strong>in</strong>edfor the first time (Fig. 10). The average value, 1 m 2 gC 1 ,is 3 times lower than estimates for Synechococcus andNannochloris and even more if compared to the diatomThalassiosira pseudonana (3.8 m 2 g C 1 ) (Stramski andReynolds 1993). The value of c * c (660) for <strong>Prochlorococcus</strong>is also lower than the correspond<strong>in</strong>g estimation for particulatematter <strong>in</strong> the equatorial and subequatorial Pacific (2 m 2gC 1 ; Claustre et al. 1999) and lower still than similar estimations<strong>in</strong> the North Pacific (3.9 m 2 gC 1 ; Siegel et al.1989) or the North Atlantic (3.9–5.6 m 2 gC 1 ; Walsh et al.1995).The actual attenuation capabilities of the liv<strong>in</strong>g carbon of<strong>Prochlorococcus</strong> are at least three times lower than for otherphytoplankton and two times lower than for bulk particles.It is also a confirmation of the previous study of Morel etal. (1993) demonstrat<strong>in</strong>g that, as a consequence of its lowscatter<strong>in</strong>g efficiency Q b () (always 0.2) result<strong>in</strong>g from itst<strong>in</strong>y size, <strong>Prochlorococcus</strong> has a lower effect than other phytoplanktonon the particle attenuation coefficient c p . Therefore,even if <strong>Prochlorococcus</strong> is numerically the most abundantphotosynthetic organism <strong>in</strong> the ocean (Partensky et al.1999) and if its Dv–Chl a biomass often represents one-thirdor more of the total Chl a biomass (Goericke and Welschmeyer1993b; Claustre and Marty 1995; Gibb et al. 2001),its impact on attenuation is expected to rema<strong>in</strong> low.Interest<strong>in</strong>gly, the estimation of <strong>Prochlorococcus</strong> c * c (660)allows us to estimate the carbon-specific attenuation for nonalgalmaterial (heterotrophs, but mostly detritus), an importantand unknown pool that might contribute to 50%–80%of the particle attenuation (DuRand and Olson 1996; Chunget al. 1998; Claustre et al. 1999). For that calculation, weuse the value of c *(660) for particulate matter (2 m 2 gC 1 c)obta<strong>in</strong>ed for a particle assemblage constituted by 61% nonalgalmaterial, 23% picoeukaryotes, 8% Synechococcus, and8% <strong>Prochlorococcus</strong> (Claustre et al. 1999). The c * c (660) valuesreported on Table 2 are assigned to these phytoplankton(Nannochloris is assumed to be representative of picoeukaryotes)so that c * c (660) for nonalgal material is estimated to1.5 m 2 gC 1 . This rather low value (comparatively to otherphytoplankton larger than <strong>Prochlorococcus</strong>, Table 2) is an<strong>in</strong>dication that the nonalgal pool contribut<strong>in</strong>g to attenuationis likely dom<strong>in</strong>ated by small particles, with a low scatter<strong>in</strong>gefficiency.Apply<strong>in</strong>g a generic c * c (660) value to get carbon measurementfrom c(660) <strong>in</strong> any trophic situation is not valid. Indeed,the differences recorded <strong>in</strong> c * c (660) for various phytoplanktonspecies and nonalgal material imply that c * c (660)for bulk particulate material is dependent upon the proportionof algal and nonalgal material as well as on the compositionof the vegetal assemblage. This observation expla<strong>in</strong>s,at least partly, regional differences between the lowestimation of c*(660) (2 m 2 gC 1 ) for the South Pacific(Claustre et al. 1999) compared to the higher c * c (660) valuesreported for the North Pacific (Siegel et al. 1989) or NorthAtlantic (Walsh et al. 1995). Thus, (at least a few) carbonmeasurements on discrete samples are always necessary toestablish regional c(660) versus carbon relationships for thepurpose of <strong>in</strong>vert<strong>in</strong>g c(660) measurements <strong>in</strong>to carbon concentrationequivalents. Additionally, <strong>in</strong>formation on thecomposition of the particle assemblage, <strong>in</strong>clud<strong>in</strong>g phytoplankton,is needed for resolv<strong>in</strong>g regional <strong>variation</strong>s <strong>in</strong> suchrelationships.DuRand and Olson (1996) have shown that daily change<strong>in</strong> the attenuation by algal material accounts for most of thedaily change recorded <strong>in</strong> c(660) (<strong>in</strong> other words, attenuationby nonalgal material does not vary at the daily scale). Table2 shows that, although c (660) for representative phytoplanktonspecies exhibits a considerable <strong>variation</strong> at the dailyscale (70–180% of the morn<strong>in</strong>g value), c (660) varia-* c