Presentation (PDF) - Skanska
Presentation (PDF) - Skanska
Presentation (PDF) - Skanska
Create successful ePaper yourself
Turn your PDF publications into a flip-book with our unique Google optimized e-Paper software.
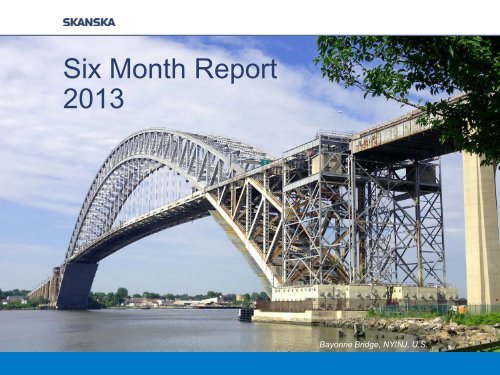
Six Month Report2013Bayonne Bridge, NY/NJ, U.S.
Six Month Report2013−−−−−−Stable Q2Strong order bookingsIncreased revenues and profits inthe U.S.Improved profitability in the Finnishand Norwegian constructionoperationsImproved results in the RDbusiness, especially in SwedenThree commercial properties andfive PPP-projects divested duringthe quarter2July 18, 2013 <strong>Skanska</strong> Six Month Report 2013
Construction− Revenue SEK 58.9 bn (57.2)− 7% growth in local currency−−Order bookings SEK 60.3 bn(61.6)− Poland, Norway and U.S. strongOperating income SEK 1.6 bn(1.3)− Improved profitability in Finlandand NorwayGold Line Bridge, Los Angeles, U.S.3July 18, 2013 <strong>Skanska</strong> Six Month Report 2013
New orders inConstruction in Q2SEK MBuilding, U.S. 4,300Bayonne Bridge, U.S. 2,600Railway Project, Norway 1,500Ludgate Office Project, UK 1,100Bridge Project, U.S. 770Office Project, U.S. 760Total bookings in Q2 36,0004July 18, 2013 <strong>Skanska</strong> Six Month Report 2013Ludgate, London, UK
ResidentialDevelopment− Revenue SEK 5.2 bn (4.0)− 1,907 (1,408) homes sold− 1,663 (1,381) homes started−−Operating income SEK 329 M(-310)− Improved profitability inSwedenLower volumes during rest ofthe year5July 18, 2013 <strong>Skanska</strong> Six Month Report 2013BoKlok Tomtberget, Norsborg, Sweden
Commercial PropertyDevelopment−−−−Transactions− Divestments of SEK 1,905 M(3,222)− Income from divestmentsSEK 381 M (703)3 project starts in Q229 ongoing projects− SEK 8.5 bn in investment value− 68% pre-leasing rate− 58% completion rate77,000 sq m leased− 60,000 sq m in Q2Dominikański, Wrocław, Poland6July 18, 2013 <strong>Skanska</strong> Six Month Report 2013
InfrastructureDevelopment−−Net present value of SEK 4.5 bnin project portfolioDivestments− 3 school projects (UK)− 2 street lighting projects (UK)− Divestments exceeding internalvaluationsBristol Schools, UK7July 18, 2013 <strong>Skanska</strong> Six Month Report 2013
Synergies in <strong>Skanska</strong>’s business modelFree working capitalRevenue clientsConstructionInvestmentopportunitiesProject DevelopmentInternalcontracts12% of revenuein ConstructionReturn on equity 18-20%Dividend 40-70% of profitInternal revenue, SEK bn8July 18, 2013 <strong>Skanska</strong> Six Month Report 2013Jan–Jun2013Jan–Jun2012Residential Development 2.2 2.4Commercial Property Development 1.4 1.4Infrastructure Development 3.5 3.3Total 7.1 7.1
ConstructionOrder situationSEK bn1751501251007550R-12 Book-to-build 94%Order backlogOrder bookings,R-12Revenue, R-12Order bookingsper quarter250Q3 Q4 Q109Q2 Q3 Q4 Q110Q2 Q3 Q4 Q111Q2 Q3 Q4 Q112Q2 Q3 Q4 Q113Q2SEK bnJan–Jun2013Jan–Jun2012Jan–Dec2012Revenue 58.9 57.2 124.5Order bookings 60.3 61.6 120.1Order backlog 148.7 161.1 146.79July 18, 2013 <strong>Skanska</strong> Six Month Report 2013
ConstructionOrder bookingsSEK bnJan–Jun2013Jan–Jun2012Changein localcurrency, %Bookto-build,R-12, %Sweden 13.9 13.6 2% 91%Norway 8.6 5.9 50% 91%Finland 3.3 3.1 14% 100%Poland 4.5 2.4 93% 120%Czech Republic 1.2 2.0 -36% 61%UK 4.4 4.8 -1% 91%USA Building 14.2 12.3 21% 100%USA Civil 7.0 12.2 -39% 96%Latin America 2.9 5.4 -43% 77%Other 0.3 – – –Total 60.3 61.6 2% 94%10July 18, 2013 <strong>Skanska</strong> Six Month Report 2013
ConstructionIncome statementOperating margin, R-12, %5.04.54.03.53.02.52.0SEK bnQ3 Q4Q1 Q2 Q3 Q42009Q1 Q2 Q3 Q4201011July 18, 2013 <strong>Skanska</strong> Six Month Report 2013Q1 Q2 Q3 Q42011Jan–Jun2013Q1 Q2 Q3 Q42012Revenue, R-12, SEK bnJan–Jun2012RevenueOperating marginQ1 Q2201316012080400Jan–Dec2012Revenue 58.9 57.2 124.5Gross income 4.5 4.4 9.6Selling and admin. expenses -2.9 -3.1 -6.2Operating income 1.6 1.3 3.5Gross margin, % 7.6 7.7 7.7Selling and admin. expenses, % -4.9 -5.4 -5.0Operating margin, % 2.7 2.4 2.8
ConstructionIncome statementOperating income, SEK M Operating margin, %Jan–Jun2013Jan–Jun2012Jan–Jun2013Jan–Jun2012Sweden 311 410 2.3 3.1Norway 177 36 2.5 0.5Finland 66 22 2.4 0.6Poland 84 132 3.6 4.2Czech Republic (12) 12 neg 0.5UK 175 218 3.2 3.8USA Building 216 198 1.4 1.6USA Civil 520 411 8.1 6.9Latin America 36 -91 0.9 negOther – – – –Total 1,573 1,348 2.7 2.412July 18, 2013 <strong>Skanska</strong> Six Month Report 2013
Residential DevelopmentIncome statement, segment reportingOperating margin, R-12, %1050-5-10-15SEK MQ3 Q4 Q12009Q2 Q3 Q4 Q1201013July 18, 2013 <strong>Skanska</strong> Six Month Report 2013Q2 Q3 Q4 Q12011Q2 Q3 Q4 Q12012Jan–Jun2013Q2 Q3 Q4 Q12013Jan–Jun2012Revenue, R-12, SEK bnRevenueOperating marginQ2121086420Jan–Dec2012Revenue 5,249 4,010 8,682Gross income 587 216 706Selling and admin. expenses -265 -526 -823Income from joint ventures 7 – 3Operating income 329 -310 -114Gross margin, % 11.2 5.4 8.1Selling and admin. expenses, % -5.0 -13.1 -9.5Operating margin, % 6.3 neg neg
Residential DevelopmentIncome statementOperating income,SEK M 1 Operating margin, % 1Jan–Jun2013Jan–Jun2012Jan–Jun2013Jan–Jun2012Sweden 189 -333 7.7 negNorway 77 79 6.6 6.3Finland 69 47 5.5 3.9Nordics 335 -207 6.8 negOther Europeancountries 2 -6 -103 neg negTotal 329 -310 6.3 neg1 Development gain only, construction margin reported under Construction2 Czech Republic, Poland and the UK14July 18, 2013 <strong>Skanska</strong> Six Month Report 2013
Residential DevelopmentHomes sold and startedHomes4,5004,0003,5003,0002,5002,0001,5001,0005000Q3 Q4 Q12009Q2 Q3 Q4 Q12010Q2 Q3 Q4 Q12011Q2 Q3 Q4 Q12012Q2 Q3 Q4 Q12013Q2Sold, R-12Started, R-12Jan–Jun2013Homes startedJan–Jun2012Jan–Dec2012Jan–Jun2013Homes soldJan–Jun2012Jan–Dec20121,663 1,381 2,993 1,907 1,408 3,06015July 18, 2013 <strong>Skanska</strong> Six Month Report 2013
Residential DevelopmentIn production statusHomes7,0006,0005,0004,0003,0002,000UnsoldCompletedUnsold underconstructionSold underconstruction1,0000Q3 Q4 Q12009Q2 Q3 Q4 Q1 Q22010Q3 Q4 Q12011Q2 Q3 Q4 Q12012Q2 Q3 Q4 Q12013Q2Homes in production Of which sold, %Unsoldcompleted homesJun 30, 2013 Dec 31, 2012 Jun 30, 2013 Dec 31, 2012 Jun 30, 2013 Dec 31, 20125,185 4,890 65 60 325 43516July 18, 2013 <strong>Skanska</strong> Six Month Report 2013
Commercial Property DevelopmentIncome statement, segment reportingSEK MJan–Jun2013Jan–Jun2012Jan–Dec2012Revenue 2,122 3,467 6,742Gross income 477 823 1,923Selling and administrative expenses -228 -230 -488Income from J/V and associatedcompanies 9 10 13Operating income 258 603 1,448of which gain from divestmentsof properties 1 381 703 1,693of which write downs/reversalof write downs – – –1 Additional gain included in eliminations was 26 27 107Development gain only, construction margin reported under Construction17July 18, 2013 <strong>Skanska</strong> Six Month Report 2013
Commercial Property DevelopmentInvestments and divestmentsSEK bn9876543210Q3 Q4Q1 Q2 Q3 Q42009Q1 Q2 Q3 Q42010Q1 Q2 Q3 Q42011Q1 Q2 Q3 Q42012Q1 Q22013Revenue fromdivestments,R-12Operatingincome fromdivestments,R-12Sale of commercial propertiesSEK M Sales price Capital gainYTD 1,905 38118July 18, 2013 <strong>Skanska</strong> Six Month Report 2013
Commercial Property DevelopmentCarrying amounts and market valuesSEK bn1210864Carrying amountupon completionMarket value20Ongoing projects, Jan 1, 2013 Net change, 2013 Ongoing projects, Jun 30, 201319July 18, 2013 <strong>Skanska</strong> Six Month Report 2013Carrying amount,end of periodCarrying amount,upon completionMarketvalueOccupancyrate, %Degree ofcompletion%SEK bnCompleted projects 3.1 3.1 3.9 70 100Undeveloped land anddevelopment properties 6.1 6.1 6.7Ongoing projects 4.9 8.5 10.5 68 58Total 14.0 17.7 21.1of which completed projects soldaccording to segment reporting 0.5 0.5 0.6of which ongoing projects soldaccording to segment reporting 0.6 1.4 1.6
Commercial Property DevelopmentLeasing000 sqm350300250200150100Leasing,quarterlyLeasing,R-12500Q3 Q4Q1 Q2 Q3 Q42009Q1 Q2 Q3 Q42010Q1 Q2 Q3 Q42011Q1 Q2 Q3 Q42012Q1 Q22013New leases of space were signed for 60,000 sq m in Q220July 18, 2013 <strong>Skanska</strong> Six Month Report 2013
Infrastructure DevelopmentIncome statementSEK MJan–Jun2013Jan–Jun2012Jan–Dec2012Revenue 46 158 242Gross income -64 44 9Selling and admin. expenses -65 -70 -186Income from joint ventures 355 215 765Operating income 226 189 588of which gains from divestmentsof shares in projects 118 – 41421July 18, 2013 <strong>Skanska</strong> Six Month Report 2013
Infrastructure DevelopmentProject portfolioNet present value of projects, SEK bn5.04.54.03.53.02.52.01.51.00.50.04.5SEK bn Jun 30, 2013 Jun 30, 2012 Dec 31, 2012Present value of cash flow from projects 5.3 5.8 5.4Net present value of projects 4.5 4.8 4.5Carrying amount -2.9 -3.3 -2.8Unrealized development gain 1.6 1.5 1.7Cash flow hedge 1.1 1.5 1.6Effect in unrealized Equity 2.7 3.0 3.322July 18, 2013 <strong>Skanska</strong> Six Month Report 20130.2 -0.20.0 4,5Dec 31, 2012 Derisk/Time value Net Investments Currency effect June 30, 2013
GroupIncome statementSEK MJan–Jun2013Jan–Jun2012Jan–Dec2012Operating income frombusiness streams 2,386 1,830 5,396Central -351 -333 -723Eliminations -20 -50 -68Operating income 2,015 1,447 4,605Net financial items -147 -69 -234Income after financial items 1,868 1,378 4,371Taxes -467 -371 -1,066Profit for the period 1,401 1,007 3,305Earnings per share, SEK 3.40 2.44 8.00Tax rate, % 25 27 2423July 18, 2013 <strong>Skanska</strong> Six Month Report 2013
GroupCash flowSEK bn1086420-2-4-6Q3 Q4 Q12009Q2 Q3 Q4 Q12010Q2 Q3 Q4 Q12011Q2 Q3 Q4 Q12012Q2 Q3 Q4 Q12013Q2Cash flowfrombusinessoperations,quarterlyR-12SEK bnJan–Jun2013Jan–Jun2012Jan–Dec2012Cash flow from operations -0.9 -5.0 -2.0Dividend etc. -2.6 -2.6 -2.7Cash flow before change in interestbearingreceivables and liabilities -3.5 -7.6 -4.724July 18, 2013 <strong>Skanska</strong> Six Month Report 2013
ConstructionFree working capitalSEK bn25%181620141510512108642Free workingcapital, SEK bnFree workingcapital, end ofQ2, SEK bnAverage freeworking capital/Constructionrevenue, R-12, %0Q3 Q4 Q12009Q2 Q3 Q4 Q12010Q2 Q3 Q4 Q12011Q2 Q3 Q4 Q12012Q2 Q3 Q4Q12013Q2025July 18, 2013 <strong>Skanska</strong> Six Month Report 2013
GroupFinancial positionOperating net financial assets/liabilitiesSEK bn14121086420Q3 Q4 Q12009Q2 Q3 Q4 Q12010Q2 Q3 Q4 Q12011Q2 Q3 Q4 Q12012Q2 Q3 Q4 Q12013Q2SEK bn26July 18, 2013 <strong>Skanska</strong> Six Month Report 2013Jun 302013Jun 302012Dec 312012Total assets 86.3 85.7 88.2Equity attributable to equity holders 19.4 17.8 19.4Interest-bearing net receivables (+)/net debt (-) -4.5 -5.0 -1.9Operating net financial assets/liabilities 1.2 2.3 4.6Capital employed, closing balance 35.2 33.0 34.5Equity/assets ratio, % 22.5 20.7 21.9
GroupChange in financial positionSEK bnJan–Jun2013Jan–Jun2012Jan–Dec2012Opening balance interest-bearingnet receivables -1.9 2.9 2.9Cash flow before change in interestbearingreceivables and liabilities -3.5 -7.6 -4.7Change in pension liability 0.5 -0.5 -0.1Other changes 0.4 0.2 0.0Change in interest-bearing netreceivables -2.6 -8.0 -4.8Closing balance interest-bearing netreceivables/net debt -4.5 -5.0 -1.9Pension liability, net 3.0 4.1 3.6Interest-bearing debt co-ops 2.7 3.3 2.8Operating net financialassets/liabilities 1.2 2.3 4.627July 18, 2013 <strong>Skanska</strong> Six Month Report 2013
GroupChange in equitySEK bnJan–Jun2013Jan–Jun2012Jan–Dec2012Opening balance 19.4 19.6 19.6Dividend to shareholders -2.5 -2.5 -2.5Profit for the period 1.8 1.0 2.9Other comprehensive incomeTranslation differences -0.2 0.1 -0.3Effects of actuarial gains and losseson pensions 0.4 -0.5 -0.2Effects of cash flow hedges 0.5 0.1 -0.1Closing balance 19.4 17.8 19.428July 18, 2013 <strong>Skanska</strong> Six Month Report 2013
GroupInvestments and capital employedSEK bn1086420-2-4-6-8Q3 Q4Q1 Q2 Q3 Q42009Q1 Q2 Q3 Q42010Q1 Q2 Q3 Q42011Q1 Q2 Q3 Q42012Q1 Q22013Investments,quarterlyDivestments,quarterlyNet investments,R-12SEK bnCapital employed in:Jun 30,2013Jun 30,2012Dec 31,2012Residential Development 10.8 12.8 11.3Commercial Property Development 13.8 12.2 13.6Infrastructure Development 1.7 1.7 1.1Total in Development Streams 26.4 26.7 26.029July 18, 2013 <strong>Skanska</strong> Six Month Report 2013
Q2Market outlookConstruction−General− Stable but large local differences− Tough competition− USA Civil− Large and complex civil constructionprojects− Intense competition− USA Building− Healthcare, Airports, IT-facilities− Commercial buildings− Latin America− Market towards mining industry remainsweak− Nordics− Norway good, Sweden stable− Large civil projects stable but competitive− Other European countries30July 18, 2013 <strong>Skanska</strong> Six Month Report 2013United Nations, NY, U.S.
Q2Market outlookResidential Development−General− Improved market but still someuncertainty among buyers− Sweden− Stable market− Norway− Good demand− Finland− Somewhat weaker− Other European countries− Poland relatively stable− Czech weak but has improvedsomewhat31July 18, 2013 <strong>Skanska</strong> Six Month Report 2013BoKlok
Q2Market outlookCommercial PropertyDevelopment−General−−Tenants: Relative stable vacancy ratesInvestors: Demand for green propertieswith stable tenants, valuations attractive− Nordics− Tenants long decision processes− Investors picky− Other European countries− Higher demand in Poland− The U.S.− Vacancy rates continues to decline32July 18, 2013 <strong>Skanska</strong> Six Month Report 2013Green Court – Bucharest, Romania
Q2Market outlookInfrastructure Development−−−Good potential for PPP in the U.S.but tough competitionUK market – thin pipelineRest of Europe limited market33July 18, 2013 <strong>Skanska</strong> Six Month Report 2013M25, London, UK
Going forwardConstructionResidentialProject DevelopmentCommercialPropertyInfrastructureOpportunities − USA− Poland − Projectportfolio− U.S. marketChallenges− Latin America− Sweden− Land in theNordics− UK pipeline− LongprocessesActions− Expand U.S.operations− Turn around LatinAmerica− Improveproductionefficiency− Leasing− Divestments− Prepare newbids34July 18, 2013 <strong>Skanska</strong> Six Month Report 2013


