TR News - Transportation Research Board
TR News - Transportation Research Board
TR News - Transportation Research Board
- No tags were found...

Create successful ePaper yourself
Turn your PDF publications into a flip-book with our unique Google optimized e-Paper software.
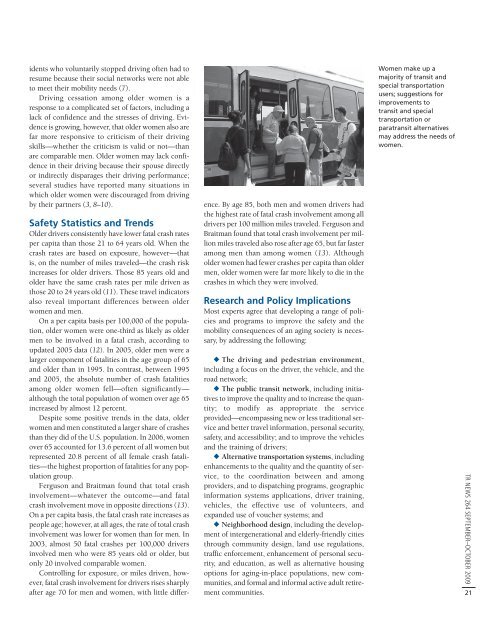
idents who voluntarily stopped driving often had toresume because their social networks were not ableto meet their mobility needs (7).Driving cessation among older women is aresponse to a complicated set of factors, including alack of confidence and the stresses of driving. Evidenceis growing, however, that older women also arefar more responsive to criticism of their drivingskills—whether the criticism is valid or not—thanare comparable men. Older women may lack confidencein their driving because their spouse directlyor indirectly disparages their driving performance;several studies have reported many situations inwhich older women were discouraged from drivingby their partners (3, 8–10).Safety Statistics and TrendsOlder drivers consistently have lower fatal crash ratesper capita than those 21 to 64 years old. When thecrash rates are based on exposure, however—thatis, on the number of miles traveled—the crash riskincreases for older drivers. Those 85 years old andolder have the same crash rates per mile driven asthose 20 to 24 years old (11). These travel indicatorsalso reveal important differences between olderwomen and men.On a per capita basis per 100,000 of the population,older women were one-third as likely as oldermen to be involved in a fatal crash, according toupdated 2005 data (12). In 2005, older men were alarger component of fatalities in the age group of 65and older than in 1995. In contrast, between 1995and 2005, the absolute number of crash fatalitiesamong older women fell—often significantly—although the total population of women over age 65increased by almost 12 percent.Despite some positive trends in the data, olderwomen and men constituted a larger share of crashesthan they did of the U.S. population. In 2006, womenover 65 accounted for 13.6 percent of all women butrepresented 20.8 percent of all female crash fatalities—thehighest proportion of fatalities for any populationgroup.Ferguson and Braitman found that total crashinvolvement—whatever the outcome—and fatalcrash involvement move in opposite directions (13).On a per capita basis, the fatal crash rate increases aspeople age; however, at all ages, the rate of total crashinvolvement was lower for women than for men. In2003, almost 50 fatal crashes per 100,000 driversinvolved men who were 85 years old or older, butonly 20 involved comparable women.Controlling for exposure, or miles driven, however,fatal crash involvement for drivers rises sharplyafter age 70 for men and women, with little difference.By age 85, both men and women drivers hadthe highest rate of fatal crash involvement among alldrivers per 100 million miles traveled. Ferguson andBraitman found that total crash involvement per millionmiles traveled also rose after age 65, but far fasteramong men than among women (13). Althougholder women had fewer crashes per capita than oldermen, older women were far more likely to die in thecrashes in which they were involved.<strong>Research</strong> and Policy ImplicationsMost experts agree that developing a range of policiesand programs to improve the safety and themobility consequences of an aging society is necessary,by addressing the following:u The driving and pedestrian environment,including a focus on the driver, the vehicle, and theroad network;u The public transit network, including initiativesto improve the quality and to increase the quantity;to modify as appropriate the serviceprovided—encompassing new or less traditional serviceand better travel information, personal security,safety, and accessibility; and to improve the vehiclesand the training of drivers;u Alternative transportation systems, includingenhancements to the quality and the quantity of service,to the coordination between and amongproviders, and to dispatching programs, geographicinformation systems applications, driver training,vehicles, the effective use of volunteers, andexpanded use of voucher systems; andu Neighborhood design, including the developmentof intergenerational and elderly-friendly citiesthrough community design, land use regulations,traffic enforcement, enhancement of personal security,and education, as well as alternative housingoptions for aging-in-place populations, new communities,and formal and informal active adult retirementcommunities.Women make up amajority of transit andspecial transportationusers; suggestions forimprovements totransit and specialtransportation orparatransit alternativesmay address the needs ofwomen.<strong>TR</strong> NEWS 264 SEPTEMBER–OCTOBER 200921