TR News - Transportation Research Board
TR News - Transportation Research Board
TR News - Transportation Research Board
- No tags were found...

Create successful ePaper yourself
Turn your PDF publications into a flip-book with our unique Google optimized e-Paper software.
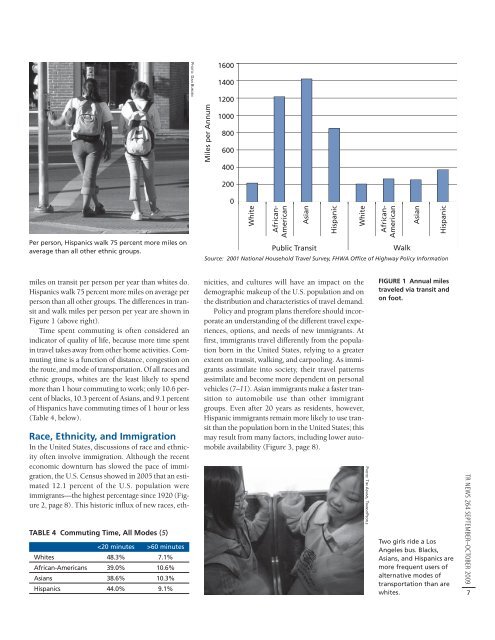
PHOTO: DAN BURDENMiles per Annum1600140012001000800600400200Per person, Hispanics walk 75 percent more miles onaverage than all other ethnic groups.0WhiteAfrican-AmericanAsianPublic TransitWalkSource: 2001 National Household Travel Survey, FHWA Office of Highway Policy InformationHispanicWhiteAfrican-AmericanAsianHispanicmiles on transit per person per year than whites do.Hispanics walk 75 percent more miles on average perperson than all other groups. The differences in transitand walk miles per person per year are shown inFigure 1 (above right).Time spent commuting is often considered anindicator of quality of life, because more time spentin travel takes away from other home activities. Commutingtime is a function of distance, congestion onthe route, and mode of transportation. Of all races andethnic groups, whites are the least likely to spendmore than 1 hour commuting to work; only 10.6 percentof blacks, 10.3 percent of Asians, and 9.1 percentof Hispanics have commuting times of 1 hour or less(Table 4, below).TABLE 4 Commuting Time, All Modes (5)60 minutesWhites 48.3% 7.1%African-Americans 39.0% 10.6%Asians 38.6% 10.3%Hispanics 44.0% 9.1%Race, Ethnicity, and ImmigrationIn the United States, discussions of race and ethnicityoften involve immigration. Although the recenteconomic downturn has slowed the pace of immigration,the U.S. Census showed in 2005 that an estimated12.1 percent of the U.S. population wereimmigrants—the highest percentage since 1920 (Figure2, page 8). This historic influx of new races, ethnicities,and cultures will have an impact on thedemographic makeup of the U.S. population and onthe distribution and characteristics of travel demand.Policy and program plans therefore should incorporatean understanding of the different travel experiences,options, and needs of new immigrants. Atfirst, immigrants travel differently from the populationborn in the United States, relying to a greaterextent on transit, walking, and carpooling. As immigrantsassimilate into society, their travel patternsassimilate and become more dependent on personalvehicles (7–11). Asian immigrants make a faster transitionto automobile use than other immigrantgroups. Even after 20 years as residents, however,Hispanic immigrants remain more likely to use transitthan the population born in the United States; thismay result from many factors, including lower automobileavailability (Figure 3, page 8).PHOTO: TIM ADAMS, <strong>TR</strong>ANSITPEOPLEFIGURE 1 Annual milestraveled via transit andon foot.Two girls ride a LosAngeles bus. Blacks,Asians, and Hispanics aremore frequent users ofalternative modes oftransportation than arewhites.<strong>TR</strong> NEWS 264 SEPTEMBER–OCTOBER 20097