implications for permafrost degradation and slope instability in the ...
implications for permafrost degradation and slope instability in the ...
implications for permafrost degradation and slope instability in the ...

Create successful ePaper yourself
Turn your PDF publications into a flip-book with our unique Google optimized e-Paper software.
1<br />
2<br />
3<br />
4<br />
R. P. Daanen et al.: Rapid movement of frozen debris-lobes 1527<br />
Temperature ( o C)<br />
Temperature ( o C)<br />
20<br />
10<br />
0<br />
-10<br />
-20<br />
-30<br />
-40<br />
-50<br />
9/1/08<br />
1900<br />
1910<br />
11/1/08<br />
1/1/09<br />
3/1/09<br />
5/1/09<br />
SNOTEL, Air<br />
DG-A, Air<br />
Surface<br />
0.5 m<br />
1.8 m<br />
7/1/09<br />
9/1/09<br />
11/1/09<br />
1/1/10<br />
3/1/10<br />
1920<br />
1930<br />
1940<br />
1950<br />
1960<br />
1970<br />
1980<br />
1990<br />
2000<br />
2010<br />
2020<br />
5/1/10<br />
Movement of frozen debris-lobes can be observed <strong>in</strong> <strong>the</strong><br />
<strong>for</strong>m of cracks <strong>in</strong> <strong>the</strong> surface of <strong>the</strong>se features. These cracks<br />
are up to 25 cm wide, several metres deep <strong>and</strong> stretch over<br />
tens of metres laterally, <strong>and</strong> are often responsible <strong>for</strong> split<br />
tree trunks. Along <strong>the</strong> term<strong>in</strong>us of <strong>the</strong>se features, trees are<br />
commonly overrun as <strong>the</strong> frozen debris-lobe advances. We<br />
observed live trees be<strong>in</strong>g pushed over <strong>and</strong> partially covered<br />
by flow<strong>in</strong>g mud (summer) <strong>and</strong> by frozen debris slabs (w<strong>in</strong>ter).<br />
Frozen debris slabs slide over weak zones, <strong>and</strong> are observed<br />
dur<strong>in</strong>g spr<strong>in</strong>g protrud<strong>in</strong>g out from <strong>the</strong> surface near<br />
steep <strong>slope</strong>s. In addition, frozen soil <strong>and</strong> debris slabs buckle<br />
Degree Days ( o C-day)<br />
32<br />
<strong>in</strong> front of <strong>the</strong> frozen debris-lobes, <strong>for</strong>m<strong>in</strong>g cavities that collapse<br />
upon spr<strong>in</strong>g thaw. This <strong>for</strong>mation seems to be <strong>the</strong> result<br />
of <strong>the</strong> feature push<strong>in</strong>g on <strong>the</strong> frozen soils <strong>in</strong> front of <strong>the</strong> lobe.<br />
Active layer detachment slides <strong>and</strong> retrogressive thaw<br />
slumps are also observed on <strong>the</strong>se features. Typically <strong>the</strong>se<br />
features mobilize <strong>the</strong> sediments <strong>and</strong> accelerate <strong>the</strong> alluviation<br />
processes. Mobilization of <strong>the</strong> rocks was also observed<br />
from a steep section of <strong>the</strong> lobe term<strong>in</strong>us.<br />
4.2 Ground <strong>the</strong>rmal regime<br />
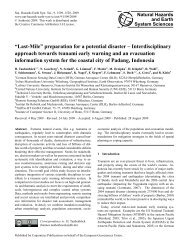
To underst<strong>and</strong> changes <strong>in</strong> ground temperature, we collected<br />
both ground <strong>and</strong> air temperatures on FDL-A (Fig. 5). The<br />
2008–2009 mean annual air temperature is −5.1 ◦ C <strong>and</strong> <strong>the</strong><br />
mean annual ground temperature at a depth of 0.5 m <strong>in</strong> m<strong>in</strong>eral<br />
soil is −0.3 ◦ C. We compared <strong>the</strong>se data to those from<br />
<strong>the</strong> Coldfoot Snow Telemetry (SNOTEL) site, which corre-<br />
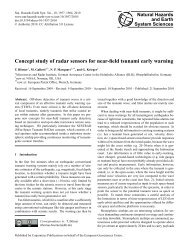
Figure 5.Air <strong>and</strong> soil temperatures (surface, 0.5, <strong>and</strong> 1.8 m) <strong>for</strong> FDL-A.Air temperatures from lates strongly with a 2008–2009 mean annual air temperature<br />
<strong>the</strong> SNOTEL<br />
Fig.<br />
wea<strong>the</strong>r<br />
5. Air<br />
station<br />
<strong>and</strong> soil<br />
<strong>in</strong> Coldfoot<br />
temperatures<br />
are <strong>in</strong>cluded<br />
(surface,<br />
<strong>for</strong> comparison.<br />
0.5 <strong>and</strong> 1.8 m) <strong>for</strong> FDL-<br />
A.Air temperatures from <strong>the</strong> SNOTEL wea<strong>the</strong>r station <strong>in</strong> Coldfoot<br />
are <strong>in</strong>cluded <strong>for</strong> comparison.<br />
of −7.7<br />
0<br />
2000<br />
-1<br />
-2<br />
Air Temperature (SNAP)<br />
MAAT (Coldfoot)<br />
MAAT (Wiseman)<br />
1000<br />
-3<br />
TDD (Coldfoot)<br />
-4<br />
FDD (Coldfoot)<br />
0<br />
-5<br />
-6<br />
-1000<br />
-7<br />
-8<br />
-2000<br />
-9<br />
-10<br />
-3000<br />
-11<br />
-12<br />
-4000<br />
1<br />
2<br />
3<br />
4<br />
5<br />
6<br />
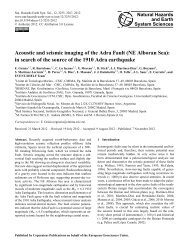
Figure 6.Mean annual air temperature near FDL-A.Reanalysis data is from SNAP; measured<br />
Fig. 6. Mean annual air temperature near FDL-A. Reanalysis data is<br />
data was taken from <strong>the</strong> SNOTEL site near Coldfoot (60 km south of FDL-A) <strong>and</strong> near Wiseman<br />
from SNAP; measured data was taken from <strong>the</strong> SNOTEL site near<br />
(50 km south of FDL-A) (National Water <strong>and</strong> Climate Center, part of <strong>the</strong> Natural Resources<br />
Coldfoot (60 km south of FDL-A) <strong>and</strong> near Wiseman (50 km south<br />
Conservation service); thaw<strong>in</strong>g <strong>and</strong> freez<strong>in</strong>g degree days are <strong>for</strong> Coldfoot.<br />
of FDL-A) (National Water <strong>and</strong> Climate Center, part of <strong>the</strong> Natural<br />
Resources Conservation service); thaw<strong>in</strong>g <strong>and</strong> freez<strong>in</strong>g degree days<br />
are <strong>for</strong> Coldfoot.<br />
31<br />
◦C. The difference of 2.6 ◦C is most likely due to atmospheric<br />
<strong>in</strong>version with FDL-A 200 metres elevated over<br />
<strong>the</strong> valley floor where <strong>the</strong> SNOTEL site is located. Longterm<br />
changes <strong>in</strong> ground temperature are mostly a function<br />
of changes <strong>in</strong> mean annual air temperature. We compared<br />
<strong>the</strong> short record <strong>for</strong> mean annual air temperature <strong>in</strong> <strong>the</strong> region<br />
to climate reanalysis developed by <strong>the</strong> Scenarios Network<br />
<strong>for</strong> Alaska Plann<strong>in</strong>g (SNAP) (Fig. 6). This dataset<br />
was downscaled from multiple global circulation models<br />
(http://www.snap.uaf.edu). The short-term trend of decreas<strong>in</strong>g<br />
mean annual air temperature measured near Coldfoot,<br />
Alaska appears contradictory to <strong>the</strong> regional warm<strong>in</strong>g trend<br />
<strong>in</strong> <strong>the</strong> long-term record <strong>and</strong> <strong>permafrost</strong> temperatures (Fig. 6).<br />
However, <strong>the</strong> trend <strong>in</strong> thaw<strong>in</strong>g degree days s<strong>in</strong>ce 2001 <strong>in</strong>dicates<br />
a warm<strong>in</strong>g trend <strong>for</strong> <strong>the</strong> region <strong>in</strong> summer, <strong>in</strong> spite of<br />
relatively cold w<strong>in</strong>ters.<br />
Although <strong>the</strong> soil temperature dataset from FDL-A only<br />
spans two years, it provides some <strong>in</strong>sights <strong>in</strong>to <strong>the</strong> ground<br />
<strong>the</strong>rmal regime. Soil temperatures collected on FDL-A <strong>in</strong>dicate<br />
an active layer at least 1.8 m deep (see Fig. 5). Movement<br />
of FDL’s causes debris exposure to <strong>the</strong> atmosphere,<br />
whereas nearby stable areas typically bear cont<strong>in</strong>uous cover<br />
of moss <strong>and</strong> tussocks, result<strong>in</strong>g <strong>in</strong> colder soil conditions. Additionally,<br />
<strong>the</strong> surface on <strong>the</strong>se features is also much better<br />
dra<strong>in</strong>ed, reduc<strong>in</strong>g <strong>the</strong> <strong>the</strong>rmal offset.<br />
4.3 DGPS surveys<br />
The results of <strong>the</strong> marker p<strong>in</strong> survey on FDL-A with a DGPS<br />
demonstrated 1.3 m of movement dur<strong>in</strong>g four months between<br />
April <strong>and</strong> August 2008, which <strong>in</strong>dicates an average<br />
rate slightly greater than 1 cm day −1 . Repeat measurements<br />
<strong>in</strong> 2009 also showed a similar daily movement rate.<br />
A survey of <strong>the</strong> entire feature dur<strong>in</strong>g 2009 is presented <strong>in</strong><br />
Fig. 2b. The DGPS was carried <strong>in</strong> a backpack while climb<strong>in</strong>g<br />
over <strong>the</strong> feature. These data provide a snapshot of <strong>the</strong><br />
geometry that can be compared with future datasets.<br />
www.nat-hazards-earth-syst-sci.net/12/1521/2012/ Nat. Hazards Earth Syst. Sci., 12, 1521–1537, 2012