Download - Water Utility Infrastructure Management
Download - Water Utility Infrastructure Management
Download - Water Utility Infrastructure Management

Create successful ePaper yourself
Turn your PDF publications into a flip-book with our unique Google optimized e-Paper software.
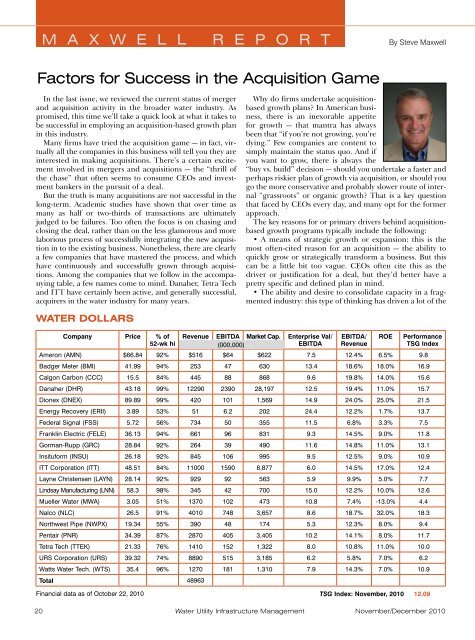
M A X W E L L R E P O R T By Steve MaxwellFactors for Success in the Acquisition GameIn the last issue, we reviewed the current status of mergerand acquisition activity in the broader water industry. Aspromised, this time we’ll take a quick look at what it takes tobe successful in employing an acquisition-based growth planin this industry.Many firms have tried the acquisition game — in fact, virtuallyall the companies in this business will tell you they areinterested in making acquisitions. There’s a certain excitementinvolved in mergers and acquisitions — the “thrill ofthe chase” that often seems to consume CEOs and investmentbankers in the pursuit of a deal.But the truth is many acquisitions are not successful in thelong-term. Academic studies have shown that over time asmany as half or two-thirds of transactions are ultimatelyjudged to be failures. Too often the focus is on chasing andclosing the deal, rather than on the less glamorous and morelaborious process of successfully integrating the new acquisitionin to the existing business. Nonetheless, there are clearlya few companies that have mastered the process, and whichhave continuously and successfully grown through acquisitions.Among the companies that we follow in the accompanyingtable, a few names come to mind. Danaher, Tetra Techand ITT have certainly been active, and generally successful,acquirers in the water industry for many years.Why do firms undertake acquisitionbasedgrowth plans? In American business,there is an inexorable appetitefor growth — that mantra has alwaysbeen that “if you’re not growing, you’redying.” Few companies are content tosimply maintain the status quo. And ifyou want to grow, there is always the“buy vs. build” decision — should you undertake a faster andperhaps riskier plan of growth via acquisition, or should yougo the more conservative and probably slower route of internal“grassroots” or organic growth? That is a key questionthat faced by CEOs every day, and many opt for the formerapproach.The key reasons for or primary drivers behind acquisitionbasedgrowth programs typically include the following:• A means of strategic growth or expansion: this is themost often-cited reason for an acquisition — the ability toquickly grow or strategically transform a business. But thiscan be a little bit too vague. CEOs often cite this as thedriver or justification for a deal, but they’d better have apretty specific and defined plan in mind.• The ability and desire to consolidate capacity in a fragmentedindustry: this type of thinking has driven a lot of theWATER DOLLARSCompany Price % of52-wk hiRevenue EBITDA Market Cap. Enterprise Val/(000,000)EBITDAEBITDA/RevenueROEPerformanceTSG IndexAmeron (AMN) $66.84 92% $516 $64 $622 7.5 12.4% 6.5% 9.8Badger Meter (BMI) 41.99 94% 253 47 630 13.4 18.6% 18.0% 16.9Calgon Carbon (CCC) 15.5 84% 445 88 868 9.6 19.8% 14.0% 15.6Danaher (DHR) 43.18 99% 12290 2390 28,197 12.5 19.4% 11.0% 15.7Dionex (DNEX) 89.89 99% 420 101 1,569 14.9 24.0% 25.0% 21.5Energy Recovery (ERII) 3.89 53% 51 6.2 202 24.4 12.2% 1.7% 13.7Federal Signal (FSS) 5.72 56% 734 50 355 11.5 6.8% 3.3% 7.5Franklin Electric (FELE) 36.13 94% 661 96 831 9.3 14.5% 9.0% 11.8Gorman-Rupp (GRC) 28.84 92% 264 39 490 11.6 14.8% 11.0% 13.1Insituform (INSU) 26.18 92% 845 106 995 9.5 12.5% 9.0% 10.9ITT Corporation (ITT) 48.51 84% 11000 1590 8,877 6.0 14.5% 17.0% 12.4Layne Christensen (LAYN) 28.14 92% 929 92 563 5.9 9.9% 5.0% 7.7Lindsay Manufacturing (LNN) 58.3 98% 345 42 700 15.0 12.2% 10.0% 12.6Mueller <strong>Water</strong> (MWA) 3.05 51% 1370 102 473 10.8 7.4% -13.0% 4.4Nalco (NLC) 26.5 91% 4010 748 3,657 8.6 18.7% 32.0% 18.3Northwest Pipe (NWPX) 19.34 55% 390 48 174 5.3 12.3% 8.0% 9.4Pentair (PNR) 34.39 87% 2870 405 3,405 10.2 14.1% 8.0% 11.7Tetra Tech (TTEK) 21.33 76% 1410 152 1,322 8.0 10.8% 11.0% 10.0URS Corporation (URS) 39.32 74% 8890 515 3,185 6.2 5.8% 7.0% 6.2Watts <strong>Water</strong> Tech. (WTS) 35.4 96% 1270 181 1,310 7.9 14.3% 7.0% 10.9Total 48963Financial data as of October 22, 2010TSG Index: November, 2010 12.0920 <strong>Water</strong> <strong>Utility</strong> <strong>Infrastructure</strong> <strong>Management</strong>November/December 2010