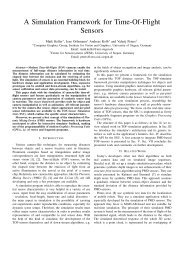
Interactive Dynamic Range Reduction for SAR Images
Interactive Dynamic Range Reduction for SAR Images
Interactive Dynamic Range Reduction for SAR Images

You also want an ePaper? Increase the reach of your titles
YUMPU automatically turns print PDFs into web optimized ePapers that Google loves.
Computergraphik undMultimediasysteme<strong>Interactive</strong> <strong>Dynamic</strong> <strong>Range</strong> <strong>Reduction</strong> <strong>for</strong> <strong>SAR</strong> <strong>Images</strong>Martin Lambers, Holger Nies, Andreas KolbVersion: April 2008Faculty 12 (Electronical Engineering & Computer Science)Institute <strong>for</strong> Vision and Graphics (IVG)Computer Graphics and Multimedia GroupProf. Dr. Andreas Kolb
1. Introduction 2AbstractThe visualization of <strong>SAR</strong> data involves the mapping of high dynamic range amplitude valuesto gray values of a lower dynamic range display device. This dynamic range reduction processcontrols the amount of in<strong>for</strong>mation in the displayed result and is there<strong>for</strong>e an importantpart of each <strong>SAR</strong> visualization system. <strong>Interactive</strong> systems provide the user with immediatefeedback on changes of the reduction method and its parameters.In this paper, we examine different dynamic range reduction techniques known from tonemapping of optical images. The techniques are analyzed regarding their applicability to <strong>SAR</strong>data and incorporated into our interactive visualization framework based on programmablegraphics hardware.Keywords: Synthetic Aperture Radar, <strong>Dynamic</strong> <strong>Range</strong>, Tone Mapping, Graphics ProcessingUnits1. IntroductionData sets from Synthetic Aperture Radar (<strong>SAR</strong>) systems are typically visualized by mappingtheir amplitude values, coming from single look complex (SLC) data files, to gray levels (inthis paper, only single channel amplitude data sets are considered). A SLC <strong>SAR</strong> data setcontains in<strong>for</strong>mation of the combined reflectivity (including both amplitude and phase) of theindividual resolution cells. The reflectivity strongly depends on the radar cross section (RCS)of the backscattering target. The RCS can vary very much depending on the point of viewand the nature of the backscatterer. Corner reflectors, used <strong>for</strong> calibration and geocodingpurposes, generate especially large values. This results in a large dynamic range of theamplitude values. It is usually much higher than the dynamic range of typical display devices.There<strong>for</strong>e, the mapping to gray levels implies dynamic range reduction.This mapping is often done using ad-hoc methods that give visually pleasing results <strong>for</strong> mostdata sets. For example, the RAT radar tools [1] first apply gamma mapping to the amplitudevalues, then clip values that are larger than a threshold, and then map the results linearly tothe gray level range [0,1]. There are many similar possibilities, e.g. mapping an interval [a,b]to [0,1] using a linear or logarithmic function after estimating the bounds a and b from theamplitude data. Such methods are largely undocumented in the literature.<strong>Dynamic</strong> range reduction methods should maximize the contrast in the interesting amplituderanges and minimize in<strong>for</strong>mation loss caused by clipping high amplitude values to white.These goals contradict each other.The dynamic range reduction problem <strong>for</strong> <strong>SAR</strong> data is related to the tone mapping problem<strong>for</strong> optical images. Tone mapping is used to prepare high dynamic range optical images <strong>for</strong>display on low dynamic range display devices. For this purpose, tone mapping operatorsreduce the dynamic range of the luminance of optical images.In interactive visualization systems, the user can choose the dynamic range reduction methodand its parameters interactively and get immediate feedback on adjustments. This enablesthe user to get the most out of the visualized data. Graphics Processing Units (GPUs) are well
2. Tone Mapping 3suited <strong>for</strong> the task of interactive <strong>SAR</strong> data visualization because they provide the necessarycomputational power [2].In this paper, we examine a selection of tone mapping operators regarding their applicabilityto <strong>SAR</strong> data and their usability <strong>for</strong> GPU-based interactive visualization. Sec. 2 gives anoverview of the tone mapping problem. In Sec. 3, we analyze the applicability of tone mappingmethods to <strong>SAR</strong> data. Sec. 4 discusses the implementation of global and local dynamicrange reduction methods in our GPU-based visualization framework. Results are presentedin Sec. 5.2. Tone MappingTone mapping operators (TMOs) prepare high dynamic range (HDR) optical images of bothnatural and generated scenes <strong>for</strong> display on low dynamic range (LDR) display devices.Global TMOs use an identical mapping function <strong>for</strong> all image pixels. In contrast, local TMOsmap pixels depending on their neighborhood. Bright pixels in dark areas are treated differentlythan bright pixels in bright areas. This gives local TMOs more flexibility both <strong>for</strong>reduction of the dynamic ranges and <strong>for</strong> preservation of local image details [3].A number of global and local TMOs have been proposed in recent years; see [3] <strong>for</strong> anoverview.Some TMOs are based on sophisticated models of color perception, e.g. the Fairchild iCAMmodel and the Pattanaik Multiscale Observer Model [3]. Additionally, a few TMOs aim toreproduce certain perceptual effects of the human visual system, e.g. night vision and glareeffects [4]. These methods are not considered in this paper.An additional selection criterion <strong>for</strong> TMOs in this paper is the implementability in our GPUbasedvisualization framework. The GPU is a parallel stream processor. Operations aredefined via microprograms and then applied to data streams. Thus, input and output datasets are strictly separated. A discussion of the stream programming model and the restrictionsof GPU programming can be found in [5]. To achieve interactive per<strong>for</strong>mance evenwith very large data sets, we use a tile-based data management approach [2]. TMOs thatrequire access to the whole data set to process each pixel, e.g. the Fourier-trans<strong>for</strong>m basedOppenheim operator [3], are there<strong>for</strong>e not considered in this paper.The majority of TMOs work on single channel data. They first extract the luminance in<strong>for</strong>mationfrom the optical image, then reduce its dynamic range, and re-add the color in<strong>for</strong>mationafterwards. By omitting the color handling, such TMOs are applicable to other types of datain a straight<strong>for</strong>ward way.Single-channel TMOs map world luminances L w to display luminances L d using a mappingfunction f . The world luminances L w can either be absolute luminance values in physicalunits, or relative values (usually from [0,1]) that are linearly related to absolute luminances.For TMOs that require absolute luminances as input, a prescaling parameter p can be appliedin order to trans<strong>for</strong>m relative values to a suitable range [3].The mapping function f of global TMOs depends only on the world luminance of the current
3. <strong>Dynamic</strong> <strong>Range</strong> <strong>Reduction</strong> <strong>for</strong> <strong>SAR</strong> Data 4pixel:L d (x,y) = f (L w (x,y)) (1)For local TMOs, f depends on a neighborhood N(x,y) of the current pixel instead:L d (x,y) = f ({L w (x ′ ,y ′ )|(x ′ ,y ′ ) ∈ N(x,y)}) (2)Global techniques are the natural choice when processing speed is critical [3], but usingthe GPU, it is also possible to realize interactive visualization systems based on local methods[4].3. <strong>Dynamic</strong> <strong>Range</strong> <strong>Reduction</strong> <strong>for</strong> <strong>SAR</strong> DataIn this section, we first summarize important differences between tone mapping <strong>for</strong> opticalimages and dynamic range reduction <strong>for</strong> <strong>SAR</strong> data. After that, we list some commonly useddynamic range reduction methods <strong>for</strong> <strong>SAR</strong> data. We then examine a selection of both globaland local TMOs with regard to their applicability to dynamic range reduction of <strong>SAR</strong> data. Adescription of all TMOs mentioned in this section can be found in chapters 7 and 8 of [3].In the following, the input values are amplitude values A (from SLC data) instead of worldluminances L w . The amplitude values are normalized to [0,1]. If necessary, a prescale factorp is used as a parameter to map normalized amplitude values to a range that can substituteabsolute L w values.3.1. ChallengesAlthough the purpose is similar, there are several important differences between tone mapping<strong>for</strong> optical images and dynamic range reduction <strong>for</strong> <strong>SAR</strong> data.Tone mapping approximates the appearance of HDR optical images on LDR displays. There<strong>for</strong>e,quality measurement techniques <strong>for</strong> TMOs can be based on comparisons of the reproducedresult with the original scene (or with the original scene as reproduced by a specialHDR display) [6, 7]. For <strong>SAR</strong> data, no original appearance exists, and objective quality measurements<strong>for</strong> dynamic range reduction methods are currently not possible.Furthermore, the distribution of amplitude values in <strong>SAR</strong> data sets differs from the distributionof luminance in optical images [8]. For example, corner reflectors and other strong scattererscause small peaks of high amplitude in areas of significantly lower amplitude in the <strong>SAR</strong> data.This may cause problems <strong>for</strong> TMOs. Additionally, local average values in optical images areoften estimated using a Gaussian distribution. This does not work well with the multiplicativespeckle in <strong>SAR</strong> data.Finally, the goal of TMOs is often to produce results that look "natural". The reproduction ofdetails is not of high importance <strong>for</strong> this goal [9], but it is central <strong>for</strong> dynamic range reduction<strong>for</strong> <strong>SAR</strong> data. Local methods can enhance local contrast and thereby improve the visibilityof details, but they have the disadvantage that the <strong>SAR</strong> data calibration is not maintained.Resulting gray levels in different areas are not directly comparable anymore.
3. <strong>Dynamic</strong> <strong>Range</strong> <strong>Reduction</strong> <strong>for</strong> <strong>SAR</strong> Data 53.2. Commonly Used Methods3.2.1. Linear MappingLinear mapping from amplitude values to gray levels is only usable if a relatively small rangeof the amplitude values is selected and all values outside of this range are clipped to blackor white respectively. Otherwise, most details are lost in very dark regions of the resultingimage. A possible mapping function is the following, where µ is the mean of the amplitudevalues and σ is the standard deviation:min(t, A(x,y))L d (x,y) = , t = µ + 3σtAll in<strong>for</strong>mation in amplitude values greater than t is lost when using this method.3.2.2. Logarithmic MappingLogarithmic mapping is often used with <strong>SAR</strong> data. It is usually adjustable with one parameterc that controls the overall brightness of the result. The following mapping function can beused:log(1 + cA(x,y))L d (x,y) =log(1 + c)To make better use of the available gray level range, often only a part of the amplitude rangeis mapped to gray levels in this way. Values outside of this range are clipped to black or whiterespectively. Various methods exist to estimate suitable threshold values from the amplitudedata. <strong>Interactive</strong> systems allow the user to change thresholds on the fly.3.2.3. Gamma MappingThis is an ad-hoc dynamic range reduction method based on gamma mapping:L d (x,y) = A(x,y) γ , γ ∈ (0,1)The RAT radar tools [1] use the following variant: First, gamma mapping with γ = 0.7 isapplied to the amplitude values. Then the mean value m of the results is computed. Afterthat, the interval [0,2.5m] is linearly mapped to [0,1]. Values larger than 2.5m are clipped towhite.3.3. Global Methods Based on TMOs3.3.1. Drago Logarithmic MappingThe Drago method [10] is a logarithmic mapping method that adapts the base of the logarithmdepending on the amplitude of the current pixel.L d (x,y) =m log(1 + cA(x,y))·log(1 + c) log(2 + 8A(x,y) b )
3. <strong>Dynamic</strong> <strong>Range</strong> <strong>Reduction</strong> <strong>for</strong> <strong>SAR</strong> Data 6The parameter c is analogous to the simple logarithmic mapping. The parameter m determinesthe brightness of the result, and the parameter b steers the amount of contrast.3.3.2. Tumblin-Rushmeier Brightness Preserving OperatorThe Tumblin-Rushmeier operator [11] is based on psychophysical experiments that measurethe interrelation of luminance and perceived brightness. It aims to preserve the perceivedbrightness in the resulting image. The method uses two adaptation parameters, L da and A a ,<strong>for</strong> display luminances and amplitude values respectively. Additionally, a prescaling parameteris used.L d (x,y) = L da( pA(x,y)A a) γ(Aa )/γ(L da )The function γ is a logarithmic function that models the human contrast sensitivity.3.3.3. Schlick Uni<strong>for</strong>m Rational QuantizationThe Schlick method [12] is applicable to single channel data such as normalized <strong>SAR</strong> amplitudevalues in a straight<strong>for</strong>ward way. The resulting mapping function is not based on assumptionsabout the human visual system:L d (x,y) =bA(x,y)(b − 1)A(x,y) + 1 , b ∈ [1,∞)It uses a single parameter b which controls the overall brightness of the result.3.3.4. Reinhard-Devlin Photoreceptor ModelThe Reinhard-Devlin method [13] is motivated by photoreceptor behaviour and is designed towork on the RGB channels of optical images. Using sophisticated models <strong>for</strong> the computationof a photoreceptor adaptation level, effects such as light adaptation and chromatic adaptationcan be simulated. If the method is applied to single channel data, only the light adaptationterm L a remains.L a (x,y) = lA(x,y) + (1 − l)A avg , l ∈ [0,1]A(x,y)L d (x,y) =A(x,y) + (bL a (x,y)) m , b > 0The constant m is computed from the minimum and average amplitude values: m = 0.3 +0.7((1 − A avg )/(1 − A min )) 1.4 . The parameter l steers the light adaptation term and influencesthe contrast in the resulting image. The parameter b determines the brightness.
3. <strong>Dynamic</strong> <strong>Range</strong> <strong>Reduction</strong> <strong>for</strong> <strong>SAR</strong> Data 73.4. Local Methods Based on TMOs3.4.1. Chiu Spatially Variant OperatorThe Chiu method [14] was one of the first local methods to be used <strong>for</strong> tone mapping. Themapping function is as follows:L d (x,y) =A(x,y)cA a (x,y)Here, A a is a Gauss-filtered version of A. There<strong>for</strong>e, L d (x,y) depends on the neighborhoodN as described by Eq. 2. The parameter c is a constant of proportionality between the twovalues.3.4.2. Rahman RetinexLike the Chiu method, the Rahman method [15] uses Gauss filtering to reduce the dynamicrange. Multiple filtered versions of the input data set are produced using different Gauss filtersizes. A set of weights determines the influence of each filtered data set on the result. Theweights can be computed from a single user parameter w. Additionally, the method uses aprescaling parameter.3.4.3. Ashikhmin Spatially Variant OperatorThe Ashikhmin TMO [16] was designed to be contrast-preserving. It uses multiple Gaussfiltered versions of the input data set to determine a local adaptation value A a <strong>for</strong> each pixel.The largest Gauss filter that does not cross high gradients is used. This avoids blurring ofdata features. The mapping function is then defined asL d (x,y) = F(A ′ a(x,y)) A′ (x,y)A ′ a(x,y)Here, A ′ and A ′ a are computed after prescaling the amplitude values with a prescaling factorp. An additional parameter t determines the minimum strength of gradients that the Gaussfilters are not allowed to cross. The function F is designed using perceptual motivations.3.4.4. Reinhard et al. Photographic Tone ReproductionThe Reinhard TMO [17] uses ideas from photography, namely scene keys and dodging-andburning.The basic mapping function isL d (x,y) =A′ (x,y)1 + A ′ a(x,y)Here, A ′ a is a Gauss filtered version of the prescaled amplitude values A′ , using the biggestfilter size that does not cross strong gradients. Reinhard et al. propose some refinements tothis equation to better use the available gray level range. Parameters of the resulting mappingfunction are the prescaling factor p and a parameter w that influences the smallest amplitudethat is mapped to white. Additionally, the computation of A b requires a sharpness-influencingparameter s and a gradient threshold t.
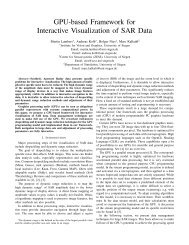
4. GPU-based <strong>Interactive</strong> <strong>Dynamic</strong> <strong>Range</strong> <strong>Reduction</strong> 8Figure 1: Simultaneous use of global and local dynamic range reduction methods in our interactiveGPU-based visualization framework. Data courtesy of FGAN/FHR, processed at ZESS/IPP.3.4.5. Durand Bilateral FilteringThe Durand TMO [18] splits the data set into a base layer and a detail layer. <strong>Dynamic</strong> rangecompression is applied only to the base layer. The details are later re-added. The baselayer is produced by applying a bilateral filter to the original data set. The bilateral filter isa smoothing filter that avoids to smooth across boundaries, i.e. high amplitude differences.The detail layer is the difference between the original and the filtered data set.4. GPU-based <strong>Interactive</strong> <strong>Dynamic</strong> <strong>Range</strong> <strong>Reduction</strong>We implemented the techniques listed in Sec. 3 in our interactive GPU-based visualizationframework [2]. This allows to explore the properties of each method in a wide range ofsituations.Having a variety of dynamic range reduction methods is only useful if the user can interactivelyadjust method and parameters to both the current <strong>SAR</strong> data set and his analysis goals.
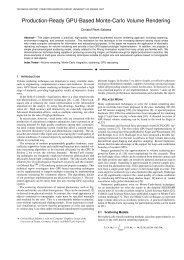
5. Results 9Linear Logarithmic Reinhard-DevlinRahman Ashikhmin ReinhardFigure 2: Results from a selection of global (Linear, Logarithmic, Reinhard-Devlin) and local(Rahman, Ashikhmin, Reinhard) dynamic range reduction methods. The bottom right part of eachimage shows a closeup of the area framed by the white rectangle. Data courtesy of FGAN/FHR,processed at ZESS/IPP.In particular, the user must be able to interactively switch between global methods that allowa direct comparison of different image regions, and local methods that show more details inspecific regions. In our GPU-based framework, global and local methods can also be usedsimultaneously. The local method is then applied to a subregion of the displayed region ofinterest as shown in Fig. 1. This allows users to benefit from the more detailed results oflocal methods while still allowing the direct comparison of different image regions permittedby global methods.5. ResultsFig. 2 shows results <strong>for</strong> one exemplary data set produced with the AER-II sender and PAMIRreceiver [19]. The methods were also applied to different single-channel <strong>SAR</strong> SLC data setsfrom the ERS-1/2 and Envisat sensors.
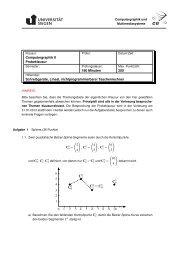
5. Results 10Figure 3: Results of logarithmic mapping (left), the Ashikhmin method using Gauss filtering(middle), and the Ashikhmin method using Median filtering (right). Data courtesy of FGAN/FHR,processed at ZESS/IPP.Global methodsThe result of linear mapping clearly shows that high amplitude ranges are clipped to white,and there<strong>for</strong>e details are lost. Both the logarithmic and gamma mappings avoid this problemto some extent. The result of gamma mapping lacks contrast when compared to otherresults. The Drago logarithmic mapping method can produce better results than the simplelogarithmic mapping due to its adaptability and additional parameters, but this requires somefine-tuning.The Tumblin-Rushmeier method is adjustable to a wide range of input data via its parameters,but it tends to clip higher amplitude ranges to white. The psychophysical model that motivatesthe method is likely not suitable <strong>for</strong> <strong>SAR</strong> data.The Schlick and Reinhard-Devlin methods both produce high contrast results without clippinghigh amplitude values. The brightness parameter of the Schlick method and the brightness/contrastparameter pair of the Reinhard-Devlin method are easily adjustable. Bothmethods are valuable alternatives to the commonly used simple logarithmic mapping method.Local methodsThe Chiu method emphasizes very high frequencies corresponding to very fine local structureseven when used with relatively strong Gauss filtering. There<strong>for</strong>e, it is very difficultto obtain usable results <strong>for</strong> <strong>SAR</strong> data sets because of their speckled nature. The Rahmanmethod has similar problems, but the influence of speckle can be reduced using its parameterf .The Ashikhmin method works well <strong>for</strong> <strong>SAR</strong> data even though it is based on perceptual motivations.The parameter t influences the amount of detail that is emphasized. By setting tappropriately, the results are much less affected by speckle than the results of the Chiu andRahman methods.The Reinhard method, like the Tumblin-Rushmeier method, tends to clip higher amplituderanges to white when applied to <strong>SAR</strong> data. Additionally, <strong>for</strong> our test data sets, it is hard
6. Conclusion 11to adjust the four parameters to produce reasonable results. The Durand method is a littlebit easier to adjust, but like the Tumblin-Rushmeier and Reinhard methods it tends to cliphigher amplitude ranges to white. For all three methods, this effect may be caused by thephoto-centric nature of the underlying assumptions.Fig. 2 shows that local methods can produce results with increased local contrast, and significantlyincrease the preservation of local details. This helps to analyze image details.Nevertheless, the results should still be improved. All presented local methods use variantsof Gauss filtering to determine a local adaptation value. This works well <strong>for</strong> optical images,but is not ideal <strong>for</strong> <strong>SAR</strong> data. Fig. 3 shows that the results of the Ashikhmin method improvewhen a Median filter is used instead of a Gauss filter. Local peaks are more clearly separated,and their original distribution is preserved better. More complex filters that are betteradapted to the properties of <strong>SAR</strong> data may further improve the results. To avoid skewedresults, such filters must match the TMO’s assumptions about local adaptation values.6. Conclusion<strong>Dynamic</strong> range reduction is an important step in <strong>SAR</strong> data visualization. <strong>Interactive</strong> adjustmentof dynamic range reduction and other visualization steps, e.g. despeckling, helps tointeractively explore and analyze <strong>SAR</strong> data.We have adapted tone mapping techniques <strong>for</strong> optical images to the problem of dynamicrange reduction of <strong>SAR</strong> data. The resulting methods have been implemented in our GPUbasedinteractive visualization framework.The results show that some of the presented global methods can provide reasonable alternativesto the commonly used methods. Local methods have high potential to increase localcontrast and thereby make details better visible. However, to make full use of this approach, itis necessary to develop methods that are tailored to the properties of <strong>SAR</strong> data. In particular,the methods must cope with multiplicative speckle and the presence of high peaks with smallspatial extension in the data. This is subject of future work.AcknowledgementThis project is partially funded by grant KO-2960-3/1 from the German Research Foundation(DFG).References1. A. Reigber and O. Hellwich, “RAT (radar tools): A free <strong>SAR</strong> image analysis softwarepackage,” in Proc. EU<strong>SAR</strong>, 2004, pp. 997–1000.2. M. Lambers, A. Kolb, H. Nies, and M. Kalkuhl, “GPU-based framework <strong>for</strong> interactive
6. Conclusion 12visualization of <strong>SAR</strong> data,” in Proc. Int. Geoscience and Remote Sensing Symposium(IGARSS), 2007.3. E. Reinhard, G. Ward, S. Pattanaik, and P. Debevec, High <strong>Dynamic</strong> <strong>Range</strong> Imaging:Acquisition, Display and Image-based Lighting. Morgan Kaufmann, 2005.4. G. Krawczyk, K. Myszkowski, and H.-P. Seidel, “Perceptual effects in real-time tone mapping,”in Spring Conf. Computer Graphics. ACM, 2005, pp. 195–202.5. R. Strzodka, M. Doggett, and A. Kolb, “Scientific computation <strong>for</strong> simulations on programmablegraphics hardware,” Simulation Practice & Theory, vol. 13, no. 8, pp. 667–680, 2005.6. A. Yoshida, R. Mantiuk, K. Myszkowski, and H.-P. Seidel, “Analysis of reproducing realworldappearance on displays of varying dynamic range,” in Proc. Eurographics, 2006,pp. 415–426.7. P. Ledda, A. Chalmers, T. Troscianko, and H. Seetzen, “Evaluation of tone mapping operatorsusing a high dynamic range display,” in Proc. SIGGRAPH, 2005, pp. 640–648.8. C. Oliver and S. Quegan, Understanding Synthetic Aperture Radar <strong>Images</strong>. ArtechHouse, 1998.9. M. Čadík, M. Wimmer, L. Neumann, and A. Artusi, “Image attributes and quality <strong>for</strong> evaluationof tone mapping operators,” in Proc. Pacific Graphics, 2006, pp. 35–44.10. F. Drago, K. Myszkowski, T. Annen, and N. Chiba, “Adaptive logarithmic mapping <strong>for</strong>displaying high contrast scenes,” Computer Graphics Forum, vol. 22, no. 3, pp. 419–426,2003.11. J. Tumblin and G. Turk, “LCIS: A boundary hierarchy <strong>for</strong> detail-preserving contrast reduction,”in Proc. SIGGRAPH, 1999, pp. 83–90.12. C. Schlick, Photorealistic Rendering Techniques. Springer, 1994, ch. Quantization Techniques<strong>for</strong> the Visualization of High <strong>Dynamic</strong> <strong>Range</strong> Pictures.13. E. Reinhard and K. Devlin, “<strong>Dynamic</strong> range reduction inspired by photoreceptor physiology,”IEEE Trans. Visualization and Computer Graphics, vol. 11, no. 1, pp. 13–24, 2005.14. K. Chiu, M. Herf, P. Shirley, S. Swamy, C. Wang, and K. Zimmerman, “Spatially nonuni<strong>for</strong>mscaling functions <strong>for</strong> high contrast images,” in Proc. Graphics Interface, 1993, pp.245–253.15. Z. Rahman, D. J. Jobson, and G. A. Woodell, “A multiscale retinex <strong>for</strong> color rendition anddynamic range compression,” in SPIE Proc. Applications of Digital Image Processing XIX,vol. 2847, 1996.16. M. Ashikhmin, “A tone mapping algorithm <strong>for</strong> high contrast images,” in Proc. Eurographicsworkshop on Rendering, 2002, pp. 145–156.17. E. Reinhard, M. Stark, P. Shirley, and J. Ferwerda, “Photographic tone reproduction <strong>for</strong>digital images,” ACM Trans. Graph., vol. 21, no. 3, pp. 267–276, 2002.18. F. Durand and J. Dorsey, “Fast bilateral filtering <strong>for</strong> the display of high-dynamic-rangeimages,” in Proc. SIGGRAPH, 2002, pp. 257–266.
6. Conclusion 1319. A. R. Brenner and J. H. G. Ender, “Demonstration of advanced reconnaissance techniqueswith the airborne <strong>SAR</strong>/GMTI sensor PAMIR,” in IEE Proc. Radar, Sonar and Navigation,2006, pp. 152–162.