Modelling Swelling Rock Behaviour in Tunnelling.pdf - Plaxis
Modelling Swelling Rock Behaviour in Tunnelling.pdf - Plaxis
Modelling Swelling Rock Behaviour in Tunnelling.pdf - Plaxis

You also want an ePaper? Increase the reach of your titles
YUMPU automatically turns print PDFs into web optimized ePapers that Google loves.
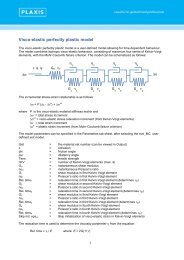
TitleFoto by Christian Ammer<strong>in</strong>g<strong>Modell<strong>in</strong>g</strong> <strong>Swell<strong>in</strong>g</strong> <strong>Rock</strong> <strong>Behaviour</strong> <strong>in</strong> Tunnell<strong>in</strong>gBert Schädlich & Helmut F. Schweiger, Institute for Soil Mechanics and Foundation Eng<strong>in</strong>eer<strong>in</strong>g, Graz University of Technology, Graz, AustriaThomas Marcher, ILF Consult<strong>in</strong>g Eng<strong>in</strong>eers, Innsbruck, AustriaAlthough a great amount of practical experience has been ga<strong>in</strong>ed <strong>in</strong> the last decades, tunnel design <strong>in</strong> swell<strong>in</strong>grock is still a very challeng<strong>in</strong>g task, as the recent examples of the Engelbergtunnel <strong>in</strong> southern Germany and theChienbergtunnel <strong>in</strong> Switzerland demonstrate. Reliable prediction of swell<strong>in</strong>g pressures and swell<strong>in</strong>g deformationsespecially <strong>in</strong> anhydritic rock is extremely difficult due to the heterogeneity of the material and the complexity ofthe <strong>in</strong>volved transport mechanisms. However, modern design codes and eng<strong>in</strong>eer<strong>in</strong>g practice demand capacitychecks for tunnel l<strong>in</strong><strong>in</strong>gs, which usually can only be provided by numerical analysis with an appropriate constitutivemodel. Such a constitutive swell<strong>in</strong>g model, which adds swell<strong>in</strong>g stra<strong>in</strong>s <strong>in</strong> dependence on the stress level andaccounts for the time dependent evolution of swell<strong>in</strong>g, has been implemented for <strong>Plaxis</strong>. This article compares theresults of a numerical back analysis with this model to <strong>in</strong>-situ measurements, us<strong>in</strong>g swell<strong>in</strong>g parameters derivedfrom laboratory swell<strong>in</strong>g tests.rocks” are geomaterials which»“<strong>Swell<strong>in</strong>g</strong><strong>in</strong>crease <strong>in</strong> volume if water is allowedto <strong>in</strong>filtrate. The most prom<strong>in</strong>ent rock typesexhibit<strong>in</strong>g swell<strong>in</strong>g behaviour are certa<strong>in</strong> typesof claystone and anhydrite-bear<strong>in</strong>g rocks, whichcan be commonly found <strong>in</strong> northern Switzerlandand southern Germany. Tunnell<strong>in</strong>g <strong>in</strong> suchmaterials is notoriously difficult: If a flexible<strong>in</strong>vert l<strong>in</strong><strong>in</strong>g is <strong>in</strong>stalled, large <strong>in</strong>vert heaveevolves after tunnel excavation. In case thesedeformations are prevented by a rigid supportconcept, large swell<strong>in</strong>g pressures may developat the tunnel l<strong>in</strong><strong>in</strong>g. It is well known that swell<strong>in</strong>gdeformations – at least <strong>in</strong> claystone – reducewith the logarithm of stress, and that swell<strong>in</strong>gdeformations can be completely suppressed bysufficiently high pressure. The chemical processes<strong>in</strong> anhydrite swell<strong>in</strong>g, on the other hand, arecompletely different, and the semi-logarithmicrelationship between swell<strong>in</strong>g stra<strong>in</strong>s and stresslevel (Grob 1972) is not universally accepted forthese materials. Evolution of swell<strong>in</strong>g with time<strong>in</strong> both claystone and anhydrite depends onthe availability of water, which is governed bythe permeability of the material, layer<strong>in</strong>g of thesubsoil and the amount of water recharge. Assome of these factors relate to characteristics ofthe specific boundary value problem rather thanthe material itself, parameters determ<strong>in</strong><strong>in</strong>g thetime-swell behaviour cannot be transferred fromlaboratory tests to large-scale problems.Constitutive modelThe constitutive model used <strong>in</strong> this paper hasbeen implemented by T. Benz (NTNU Norway) asa user-def<strong>in</strong>ed soil model for PLAXIS. The modelemploys four parameters for strength and stiffnessand three parameters for swell<strong>in</strong>g. f’ and c’ arethe well-known Mohr-Coulomb friction angle andcohesion, E and n are the isotropic elastic Young’smodulus and Poisson’s ratio, respectively. Crossanisotropicelasticity can also be considered but isnot used <strong>in</strong> this study. The mean<strong>in</strong>g of the swell<strong>in</strong>gparameters is shown <strong>in</strong> Figure 1 and Figure 2. Themaximum swell<strong>in</strong>g pressure s q0is the axial stressbeyond which no swell<strong>in</strong>g occurs, the swell<strong>in</strong>gpotential k qgives the <strong>in</strong>cl<strong>in</strong>ation of the swell<strong>in</strong>gcurve <strong>in</strong> semi-logarithmic scale and the parameterh qis related to the time until the f<strong>in</strong>al swell<strong>in</strong>gstra<strong>in</strong> has developed (Wittke & Wittke 2005).Cross-anisotropic swell<strong>in</strong>g can be considered <strong>in</strong>the model, but aga<strong>in</strong> this feature is not used here.(1)If necessary the time-swell behaviour can be relatedto elastic and plastic volumetric stra<strong>in</strong>s, e velande vpl, by us<strong>in</strong>g parameters A eland A plto def<strong>in</strong>e thetime swell<strong>in</strong>g parameter h q:Positive volumetric stra<strong>in</strong>s (loosen<strong>in</strong>g of thematerial) result <strong>in</strong> faster approach of the f<strong>in</strong>alswell<strong>in</strong>g stra<strong>in</strong>, while negative volumetric stra<strong>in</strong>sdelay or may even stop the evolution of the swell<strong>in</strong>gstra<strong>in</strong>s. This approach accounts for the dependencyof the swell<strong>in</strong>g rate on the penetration rate of water.Construction of the PfändertunnelThe 6.7 km long first tube of the Pfaendertunnelnear Bregenz (Austria) was constructed <strong>in</strong> 1976-1980accord<strong>in</strong>g to the pr<strong>in</strong>ciples of the New AustrianTunnell<strong>in</strong>g method (NATM). While top head<strong>in</strong>gand bench excavation were carried out withoutmajor difficulties, significant <strong>in</strong>vert heave of upto 30 cm was observed after about 75% of thetunnel length was excavated. These observationslead to detailed laboratory <strong>in</strong>vestigations of theswell<strong>in</strong>g characteristics of the Pfaenderstockmaterial, an extensive monitor<strong>in</strong>g program and tothe <strong>in</strong>stallation of additional anchors <strong>in</strong> the tunnel<strong>in</strong>vert.(2)www.plaxis.nl l Spr<strong>in</strong>g issue 2013 l <strong>Plaxis</strong> Bullet<strong>in</strong> 5
Laboratory swell<strong>in</strong>g testsThe Pfaenderstock consists of various layers ofsandstone, conglomerate, claystone and marl,which are summarized as upper freshwatermolasse. The marl (claystone) layers wereidentified as the rock type caus<strong>in</strong>g the swell<strong>in</strong>gdue to their high content of Montmorillonite(Weiss et al. 1980). Czurda & G<strong>in</strong>ther (1983)dist<strong>in</strong>guished between undisturbed molasse marl(series A, Figure 4) and the fault zone material(series B, Figure 5). Series A samples showedhigher swell<strong>in</strong>g potential, but lower maximumswell<strong>in</strong>g pressures than the samples of seriesB. This notable difference was attributed torelaxation and swell<strong>in</strong>g of the series B samplesbefore the samples could be tested.For the back analysis two swell<strong>in</strong>g parametersets are considered, which represent the upperand lower boundary of the test results. The timeswell<strong>in</strong>g parameters A 0, A eland A plare calibratedto match the <strong>in</strong> situ time-swell<strong>in</strong>g curve.Numerical model and material parametersThe 2D f<strong>in</strong>ite element model used <strong>in</strong> this studyis shown <strong>in</strong> Figure 6. Tunnel geometry and basicmaterial parameters of the marl layer (E = 2.5 GPa,f’ = 34°, c’ = 1000 kPa) have been taken from Johnet al. (2009). Tunnel overburden is ~200 m abovethe tunnel crown, which is representative of thecross section at km 5+373. L<strong>in</strong>ear elastic plateelements are used for the shotcrete l<strong>in</strong><strong>in</strong>g, with E =7.5 GPa for the young and E = 15 GPa for the curedshotcrete. The f<strong>in</strong>al concrete l<strong>in</strong><strong>in</strong>g is modelledwith volume elements assum<strong>in</strong>g l<strong>in</strong>ear elasticbehaviour and a stiffness of E = 30 GPa. The f<strong>in</strong>all<strong>in</strong><strong>in</strong>g thickness varies between 50 cm at the <strong>in</strong>vertand 25 cm at the crown.<strong>Swell<strong>in</strong>g</strong> parameters are listed <strong>in</strong> Table 1. Sets 1a,1b and 2a only employ A 0for the time dependencyof swell<strong>in</strong>g, while <strong>in</strong> set 2b evolution of swell<strong>in</strong>gwith time is entirely governed by elastic volumetricstra<strong>in</strong>s.Fig. 1: Semi-logarithmic swell<strong>in</strong>g law (Grob 1972)Figure 2: Influence of h qon evolution of swell<strong>in</strong>g stra<strong>in</strong>sFigure 3: Pfaendertunnel cross section 1st tube (after John & Pilser 2011)Figure 4: <strong>Swell<strong>in</strong>g</strong> test results, series AFigure 5: <strong>Swell<strong>in</strong>g</strong> test results, series B6 <strong>Plaxis</strong> Bullet<strong>in</strong> l Spr<strong>in</strong>g issue 2013 l www.plaxis.nl
Figure 6: F<strong>in</strong>ite element model (dimensions <strong>in</strong> m)Figure 7: Development of <strong>in</strong>vert heave with timeFigure 8: Profile of vertical displacements, a) numerical analysis at t = 7180 d, b) measurements km5+820 (after John 1982)Figure 9: Development of pressure on the l<strong>in</strong><strong>in</strong>g (set 1b)Parameter Set 1a Set 1b Set 2a Set 2b<strong>Swell<strong>in</strong>g</strong> potential k q[%] 3.0 3.0 0.75 0.75Max. swell<strong>in</strong>g stress s q0[kPa] 1000 1500 4000 4000Table 1: <strong>Swell<strong>in</strong>g</strong> parametersA 05.0e -3 2.5e -3 3.0e -3 0.0A el0.0 0.0 0.0 9.0A pl0.0 0.0 0.0 0.0Calculation phasesAfter top head<strong>in</strong>g / <strong>in</strong>vert excavation (assum<strong>in</strong>gpre-relaxation factors of 75% and 37.5%,respectively), the concrete <strong>in</strong>vert arch is <strong>in</strong>stalled.<strong>Swell<strong>in</strong>g</strong> is conf<strong>in</strong>ed <strong>in</strong> the model to an area of 15m x 15 m below the tunnel <strong>in</strong>vert. After a swell<strong>in</strong>gphase of 65 days, the f<strong>in</strong>al l<strong>in</strong><strong>in</strong>g is activated,followed by another swell<strong>in</strong>g phase of 115 days.John (1982) reported that the decision on <strong>in</strong>vertanchor<strong>in</strong>g and pre-stress<strong>in</strong>g was based on theswell heave deformations observed up to thispo<strong>in</strong>t. In the cross section considered here thisresulted <strong>in</strong> an anchor pattern of 2.2 m spac<strong>in</strong>g.Evolution of <strong>in</strong>vert heave with timeFigure 9 compares the time-swell<strong>in</strong>g curvescalculated with the different parameter setswith the measured <strong>in</strong>vert heave <strong>in</strong> km 5+373.The measurements plot close to a straightl<strong>in</strong>e <strong>in</strong> logarithmic time scale, which cannot bereproduced exactly by the exponential approachemployed <strong>in</strong> the model. The match with themeasured <strong>in</strong>vert heave is, however, sufficient froma practical po<strong>in</strong>t of view.Set 1a delivers too little <strong>in</strong>vert heave (10mm), andthe development of deformations completelystops after activat<strong>in</strong>g the prestressed anchors.Increas<strong>in</strong>g the maximum swell<strong>in</strong>g stress by 50%(set 1b) yields ~50% more deformation and abetter match with the measurements. While such asignificant <strong>in</strong>fluence may be expected, it should benoted that experimental results for these two setsplot so close to each other that either of the twoparameter sets appears justified (Figure 4).Surpris<strong>in</strong>gly, sets 2a and 2b – which representmuch smaller free-swell deformations – delivermore <strong>in</strong>vert heave than sets 1a and 1b. This is aresult of the higher maximum swell<strong>in</strong>g stress <strong>in</strong>sets 2a and 2b, which activates swell<strong>in</strong>g <strong>in</strong> deeperrock layers, yet with a small swell<strong>in</strong>g potential.<strong>Swell<strong>in</strong>g</strong> deformations are thus more widelydistributed with set 2a and 2b.<strong>Modell<strong>in</strong>g</strong> the evolution of swell<strong>in</strong>g with timeentirely <strong>in</strong> dependence on elastic volumetricstra<strong>in</strong>s (set 2b) results <strong>in</strong> a slightly more prolongedtime-swell-curve than us<strong>in</strong>g a constant value of A 0(set 2a). In set 2b the rate of swell<strong>in</strong>g does not onlydecrease due to the convergence with the f<strong>in</strong>alswell<strong>in</strong>g stra<strong>in</strong>, but also due to negative elasticvolumetric stra<strong>in</strong>s. The large positive volumetricstra<strong>in</strong>s after tunnel excavation are graduallyreduced <strong>in</strong> the swell<strong>in</strong>g phases by the <strong>in</strong>creas<strong>in</strong>gswell<strong>in</strong>g pressure.www.plaxis.nl l Spr<strong>in</strong>g issue 2013 l <strong>Plaxis</strong> Bullet<strong>in</strong> 7
<strong>Modell<strong>in</strong>g</strong> <strong>Swell<strong>in</strong>g</strong> <strong>Rock</strong> <strong>Behaviour</strong> <strong>in</strong> Tunnell<strong>in</strong>gFigure 10: Variation of maximum swell<strong>in</strong>g stressFigure 11: Variation of time swell<strong>in</strong>g parameters (set 1b)Figure 12: Variation of rock stiffness (set 1b)Figure 13: Variation of stress pre-relaxationDistribution of swell<strong>in</strong>g stra<strong>in</strong>s over depthThe proportion of the rock mass which is affectedby swell<strong>in</strong>g depends primarily on the maximumswell<strong>in</strong>g stress. For set 1b (s q0= 1500 kPa) theswell<strong>in</strong>g zone is conf<strong>in</strong>ed to about 2 m below thetunnel <strong>in</strong>vert, which matches well with the slid<strong>in</strong>gmicrometer measurements <strong>in</strong> the neighbour<strong>in</strong>gcross section km 5+820 (Figure 8). The swell<strong>in</strong>gzone with set 2a (s q0= 4000 kPa) is much deeperdue to the higher maximum swell<strong>in</strong>g pressure,even though similar <strong>in</strong>vert heave is obta<strong>in</strong>ed withboth parameter sets. These results <strong>in</strong>dicate thatthe maximum <strong>in</strong> situ swell<strong>in</strong>g pressure is rather<strong>in</strong> the range of 1000-2000 kPa than close to the<strong>in</strong>-situ stresses.<strong>Swell<strong>in</strong>g</strong> pressureFigure 9 shows the distribution of swell<strong>in</strong>gpressure on the tunnel <strong>in</strong>vert l<strong>in</strong><strong>in</strong>g for differentstages <strong>in</strong> time for parameter set 1b. Thecircumferential distance L is measured from thetunnel <strong>in</strong>vert, such that L = 0 m is directly at the<strong>in</strong>vert and L = 5 m is the end of the swell<strong>in</strong>g area.No pressure measurements are available.Due to the stiffer support provided to the tunnell<strong>in</strong><strong>in</strong>g at the sides of the tunnel, the maximumswell<strong>in</strong>g pressure does not occur at the tunnel<strong>in</strong>vert but at a distance of ~3.8 m.Anchor prestress<strong>in</strong>g <strong>in</strong>creases the normal stresson the l<strong>in</strong><strong>in</strong>g by about 90 kPa. The difference tothe distributed prestress<strong>in</strong>g force of (0.8*640kN / 2.2 m / 2.2. m) = 106 kN/m 2 is a result of thealready closed f<strong>in</strong>al l<strong>in</strong><strong>in</strong>g, which distributes partof the applied load <strong>in</strong> circumferential direction.Compar<strong>in</strong>g the <strong>in</strong>crease <strong>in</strong> pressure to the swell<strong>in</strong>gl<strong>in</strong>e of set 1b at 200-300 kPa (Figure 4) expla<strong>in</strong>s thelimited <strong>in</strong>fluence of prestress<strong>in</strong>g <strong>in</strong> the numericalcalculations. Even though anchor prestress<strong>in</strong>g<strong>in</strong>creases the pressure by ~45%, reduction of f<strong>in</strong>alswell<strong>in</strong>g stra<strong>in</strong> is only about 18% due to the semilogarithmicswell<strong>in</strong>g law. Additionally, the effectof prestress<strong>in</strong>g dim<strong>in</strong>ishes rapidly with <strong>in</strong>creas<strong>in</strong>gdistance to the tunnel, and the deeper rock layersrema<strong>in</strong> virtually unaffected.Variation of maximum swell<strong>in</strong>g pressureThe calculated <strong>in</strong>vert heave is notably sensitiveto the maximum swell<strong>in</strong>g pressure s q0assumed<strong>in</strong> the numerical analysis. As the variation of thisparameter <strong>in</strong> the laboratory swell<strong>in</strong>g tests israther large– albeit concealed by the logarithmicstress scale – s q0has been varied from 500 kPato 2000 kPa (A 0= 2.5e -3 ). Results <strong>in</strong>dicate a l<strong>in</strong>ear<strong>in</strong>crease of <strong>in</strong>vert heave with s q0(Figure 10). Thisis primarily the result of the <strong>in</strong>creas<strong>in</strong>g depth ofthe swell<strong>in</strong>g zone below the tunnel <strong>in</strong>vert (Figure8), and not so much due to higher swell<strong>in</strong>g stra<strong>in</strong>sdirectly underneath the tunnel <strong>in</strong>vert.Influence of other material parametersThe <strong>in</strong>fluence of other material parameters onswell<strong>in</strong>g deformations is limited. As expected, thetime swell<strong>in</strong>g parameter A 0has a notable <strong>in</strong>fluenceon the evolution of swell<strong>in</strong>g deformations, butnot on f<strong>in</strong>al deformations (Figure 11). Vary<strong>in</strong>g theelastic rock stiffness had virtually no effect onswell<strong>in</strong>g deformations after tunnel excavation(Figure 12), but naturally changed deformationsdur<strong>in</strong>g tunnel excavation. Variation of the 2Dpre-relaxation factors – which <strong>in</strong> most practicalcases are an educated guess rather than athoroughly derived parameter – also had nonotably <strong>in</strong>fluence on swell<strong>in</strong>g deformation (Figure13). As no temporary <strong>in</strong>vert l<strong>in</strong><strong>in</strong>g was <strong>in</strong>stalledafter top head<strong>in</strong>g excavation, stresses <strong>in</strong> the rockmass at the tunnel <strong>in</strong>vert drop to ~0 dur<strong>in</strong>g tunnelexcavation, <strong>in</strong>dependent of the pre-relaxationfactors applied <strong>in</strong> the excavation phases.8 <strong>Plaxis</strong> Bullet<strong>in</strong> l Spr<strong>in</strong>g issue 2013 l www.plaxis.nl
Conclud<strong>in</strong>g remarksThis article presented the results of a backanalysis of measured swell<strong>in</strong>g deformations <strong>in</strong> thePfaendertunnel (Austria). A constitutive modelbased on Grob’s swell<strong>in</strong>g law and exponentialconvergence with f<strong>in</strong>al swell<strong>in</strong>g stra<strong>in</strong>s over timewas used for the numerical calculations. Inputswell<strong>in</strong>g parameters were derived from laboratoryswell<strong>in</strong>g tests. Due to the large variation oflaboratory test results, the sensitivity of modelpredictions on the <strong>in</strong>put swell<strong>in</strong>g parameters was<strong>in</strong>vestigated.Different sets of swell<strong>in</strong>g potential k qandmaximum swell<strong>in</strong>g stress s q0delivered verysimilar swell<strong>in</strong>g deformations at the tunnell<strong>in</strong><strong>in</strong>g, as <strong>in</strong>creas<strong>in</strong>g s q0is roughly equivalentto <strong>in</strong>creas<strong>in</strong>g k q. However, good match withthe measured displacement profile below thetunnel <strong>in</strong>vert was only obta<strong>in</strong>ed with s q0= 1500kPa, which represents the upper edge of theexperimental results on undisturbed molassemarl. Us<strong>in</strong>g higher values of s q0(and lower valuesof k q) delivers too large swell<strong>in</strong>g zones. The <strong>in</strong>vertheave measurements plot close to a straight l<strong>in</strong>e<strong>in</strong> logarithmic time scale, which cannot be exactlyreproduced by the exponential approach of theconstitutive model. The match with the measuredevolution of swell<strong>in</strong>g, however, is sufficient from apractical po<strong>in</strong>t of view.References• Czurda, K. A., and G<strong>in</strong>ther, G. (1983) “Quellverhaltender Molassemergel im Pfänderstock beiBregenz, Österreich“, Mitt. österr. geolog. Ges.,76, pp. 141-160.• Grob, H. (1972) “Schwelldruck im Belchentunnel“,Proc. Int. Symp. für Untertagebau, Luzern,pp. 99-119.• John, M. (1982) “Anwendung der neuen österreichischenTunnelbauweise bei quellendemGebirge im Pfändertunnel“ Proc. of the 31stGeomechanik Kolloquium, Salzburg, Austria.• John, M., Marcher, T., Pilser, G., and Alber, O.(2009) “Considerations of swell<strong>in</strong>g for the 2ndbore of the Pfändertunnel”, Proc. of the WorldTunnel Congress 2009, Budapest, Hungary, pp.50-61.• John, M., and Pilser, G. (2011) “Criteria forselect<strong>in</strong>g a tunnell<strong>in</strong>g method us<strong>in</strong>g the firstand the second tube of the Pfänder tunnel asexample”, Geomechanics and Tunnell<strong>in</strong>g, 4(11),pp. 527-533.• Weiss, E. H., Müller, H. M., Riedmüller, G.,and Schwaighofer, B. (1980) “Zum Problemquellfähiger Geste<strong>in</strong>e im Tunnelbau“, Geolog.Paläont. Mitt. Innsbruck, 10(5), pp. 207-210.• Wittke, W., and Wittke, M. (2005) “Design, constructionand supervision of tunnels <strong>in</strong> swell<strong>in</strong>grock”, Proc. 31st ITA World Tunnell<strong>in</strong>g Congress2005, pp. 1173-1178.www.plaxis.nl l Spr<strong>in</strong>g issue 2013 l <strong>Plaxis</strong> Bullet<strong>in</strong> 9