Beer's Law & Swimming Pool Chemistry
Beer's Law & Swimming Pool Chemistry
Beer's Law & Swimming Pool Chemistry
- No tags were found...
You also want an ePaper? Increase the reach of your titles
YUMPU automatically turns print PDFs into web optimized ePapers that Google loves.
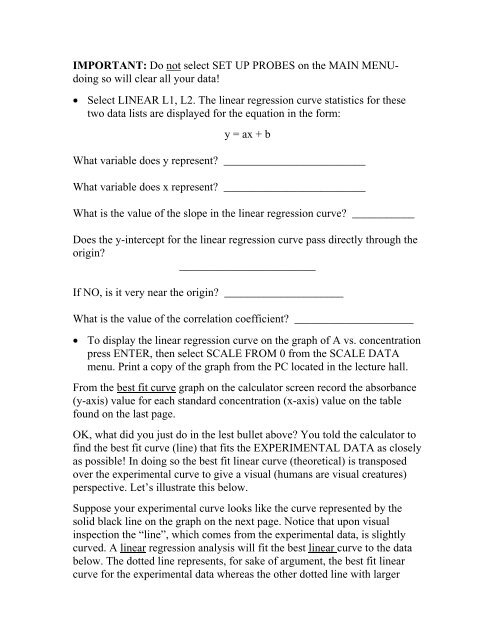
IMPORTANT: Do not select SET UP PROBES on the MAIN MENUdoingso will clear all your data!• Select LINEAR L1, L2. The linear regression curve statistics for thesetwo data lists are displayed for the equation in the form:y = ax + bWhat variable does y represent? _________________________What variable does x represent? _________________________What is the value of the slope in the linear regression curve? ___________Does the y-intercept for the linear regression curve pass directly through theorigin?________________________If NO, is it very near the origin? _____________________What is the value of the correlation coefficient? _____________________• To display the linear regression curve on the graph of A vs. concentrationpress ENTER, then select SCALE FROM 0 from the SCALE DATAmenu. Print a copy of the graph from the PC located in the lecture hall.From the best fit curve graph on the calculator screen record the absorbance(y-axis) value for each standard concentration (x-axis) value on the tablefound on the last page.OK, what did you just do in the lest bullet above? You told the calculator tofind the best fit curve (line) that fits the EXPERIMENTAL DATA as closelyas possible! In doing so the best fit linear curve (theoretical) is transposedover the experimental curve to give a visual (humans are visual creatures)perspective. Let’s illustrate this below.Suppose your experimental curve looks like the curve represented by thesolid black line on the graph on the next page. Notice that upon visualinspection the “line”, which comes from the experimental data, is slightlycurved. A linear regression analysis will fit the best linear curve to the databelow. The dotted line represents, for sake of argument, the best fit linearcurve for the experimental data whereas the other dotted line with larger


