Beer's Law & Swimming Pool Chemistry
Beer's Law & Swimming Pool Chemistry
Beer's Law & Swimming Pool Chemistry
- No tags were found...

Create successful ePaper yourself
Turn your PDF publications into a flip-book with our unique Google optimized e-Paper software.
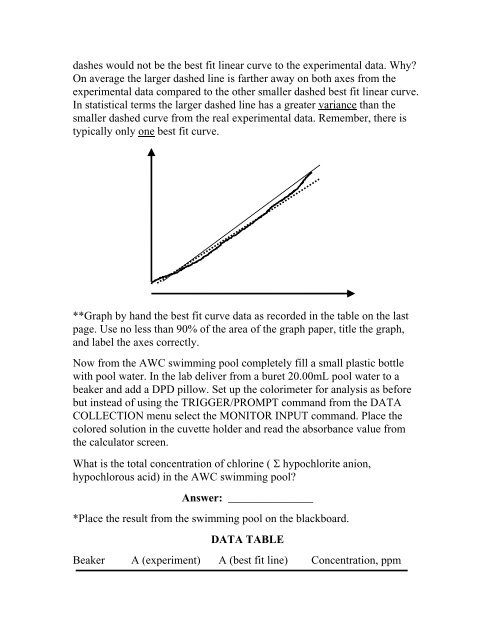
dashes would not be the best fit linear curve to the experimental data. Why?On average the larger dashed line is farther away on both axes from theexperimental data compared to the other smaller dashed best fit linear curve.In statistical terms the larger dashed line has a greater variance than thesmaller dashed curve from the real experimental data. Remember, there istypically only one best fit curve.**Graph by hand the best fit curve data as recorded in the table on the lastpage. Use no less than 90% of the area of the graph paper, title the graph,and label the axes correctly.Now from the AWC swimming pool completely fill a small plastic bottlewith pool water. In the lab deliver from a buret 20.00mL pool water to abeaker and add a DPD pillow. Set up the colorimeter for analysis as beforebut instead of using the TRIGGER/PROMPT command from the DATACOLLECTION menu select the MONITOR INPUT command. Place thecolored solution in the cuvette holder and read the absorbance value fromthe calculator screen.What is the total concentration of chlorine ( Σ hypochlorite anion,hypochlorous acid) in the AWC swimming pool?Answer: _______________*Place the result from the swimming pool on the blackboard.DATA TABLEBeaker A (experiment) A (best fit line) Concentration, ppm