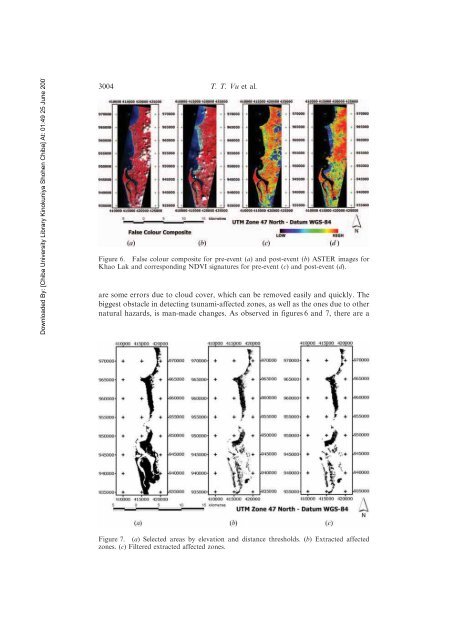
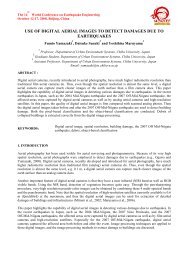
Downloaded By: [Chiba University Library Kinokuniya Shohen Chiba] At: 01:49 25 June 20073004 T. T. Vu et al.Figure 6. False colour composite <strong>for</strong> pre-event (a) and post-event (b) ASTER images <strong>for</strong>Khao Lak and corresponding NDVI signatures <strong>for</strong> pre-event (c) and post-event (d).are some errors due to cloud cover, which can be removed easily and quickly. Thebiggest obstacle in detecting <strong>tsunami</strong>-<strong>affected</strong> zones, as well as the ones due to othernatural hazards, is man-made changes. As observed in figures 6 and 7, there are aFigure 7. (a) Selected <strong>areas</strong> by elevation and distance thresholds. (b) Extracted <strong>affected</strong>zones. (c) Filtered extracted <strong>affected</strong> zones.
Downloaded By: [Chiba University Library Kinokuniya Shohen Chiba] At: 01:49 25 June 2007Remote Sensing <strong>of</strong> Sumatra Tsunami <strong>of</strong> 26 December 2004 3005few detected polygons not due to <strong>tsunami</strong>. They are usually far away from theseashore. If not, these cannot be distinguished automatically; in such cases visualinspection is required. To eliminate the detected polygons due to man-made changesand far away from the seashore, proximity is checked as follows. Let Z be the set <strong>of</strong>detected polygons, i.e. Z5{Z i } and S is the sea class. The newly detected set <strong>of</strong><strong>affected</strong> zones is given by:A~ fZ i jZ i is neighbour <strong>of</strong> Sg ð6ÞThe extraction <strong>affected</strong> <strong>areas</strong> from the pre-event and post-event ASTER images <strong>of</strong>Patong, Phuket, however, showed no clear differences between the images eventhough Patong is one <strong>of</strong> the <strong>areas</strong> hit hardest by the <strong>tsunami</strong>. It means that ASTERis unable to detect <strong>affected</strong> <strong>areas</strong> in Patong <strong>using</strong> medium resolution satellite imagesor, in other words, macro-<strong>scale</strong>. There are a lot <strong>of</strong> buildings and other structuresalong the coastline catering <strong>for</strong> tourism. The <strong>tsunami</strong> was blocked by thosestructures and could not reach too far inland. Although the <strong>tsunami</strong> destroyed thosestructures, this was not observed in the moderate-resolution satellite images, i.e. topview.Micro-<strong>scale</strong> mapping might provide more in<strong>for</strong>mation. The selected extentfrom the ASTER image <strong>for</strong> searching high-resolution satellite images were (421 700,874 100) at the top-left corner and (424 400, 872 300) at the bottom-right corner. Thecoordinates were presented in UTM projection, zone 47 North.5. Micro-<strong>scale</strong> processingFollowing the extracted extent above, pre-event and post-event QuickBird images <strong>of</strong>Patong were purchased as listed in table 2. These two images were acquired in thesame dry season. However, there is a three-year difference in acquisition time duringwhich some man-made changes may have taken place. Furthermore, cloud coveralso limits the corresponding extent between the two images. Because <strong>of</strong> the complexand detailed in<strong>for</strong>mation observed on micro-<strong>scale</strong>, both, visual and automatedinterpretation methods were introduced assisted by area morphology (see §3.2).Prior to that, pan-sharpening was carried out to exploit multi-spectral in<strong>for</strong>mationat the better spatial resolution <strong>of</strong> 0.6 m instead <strong>of</strong> 2.4 m.As pointed out by Zhang (2002), conventional pan-sharpening algorithms such asIHS fusion, PCA fusion, etc. were developed <strong>for</strong> the satellite images whosepanchromatic channel covers only the visible regions <strong>of</strong> the electromagneticspectrum. Thus, such algorithms do not work well <strong>for</strong> high-resolution satelliteimages like QuickBird and IKONOS. An improvement can be achieved by adjustingthe contribution from the panchromatic band when pan-sharpening other multispectralband images, depending on sensor characteristics and the covered area.However, it is quite difficult to clearly analyse the contribution from thepanchromatic band to each multi-spectral band due to inter-correlation amongTable 2. QuickBird images used during micro-<strong>scale</strong> analysis.Patong, PhuketPre-event 23 March 2002Post-event 02 January 2005