Dual-scale approach for detection of tsunami-affected areas using ...
Dual-scale approach for detection of tsunami-affected areas using ...
Dual-scale approach for detection of tsunami-affected areas using ...

You also want an ePaper? Increase the reach of your titles
YUMPU automatically turns print PDFs into web optimized ePapers that Google loves.
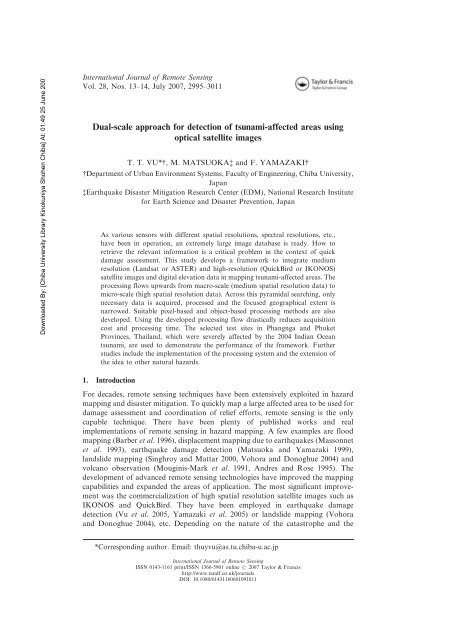
Downloaded By: [Chiba University Library Kinokuniya Shohen Chiba] At: 01:49 25 June 2007International Journal <strong>of</strong> Remote SensingVol. 28, Nos. 13–14, July 2007, 2995–3011<strong>Dual</strong>-<strong>scale</strong> <strong>approach</strong> <strong>for</strong> <strong>detection</strong> <strong>of</strong> <strong>tsunami</strong>-<strong>affected</strong> <strong>areas</strong> <strong>using</strong>optical satellite imagesT. T. VU*{, M. MATSUOKA{ and F. YAMAZAKI{{Department <strong>of</strong> Urban Environment Systems, Faculty <strong>of</strong> Engineering, Chiba University,Japan{Earthquake Disaster Mitigation Research Center (EDM), National Research Institute<strong>for</strong> Earth Science and Disaster Prevention, JapanAs various sensors with different spatial resolutions, spectral resolutions, etc.,have been in operation, an extremely large image database is ready. How toretrieve the relevant in<strong>for</strong>mation is a critical problem in the context <strong>of</strong> quickdamage assessment. This study develops a framework to integrate mediumresolution (Landsat or ASTER) and high-resolution (QuickBird or IKONOS)satellite images and digital elevation data in mapping <strong>tsunami</strong>-<strong>affected</strong> <strong>areas</strong>. Theprocessing flows upwards from macro-<strong>scale</strong> (medium spatial resolution data) tomicro-<strong>scale</strong> (high spatial resolution data). Across this pyramidal searching, onlynecessary data is acquired, processed and the focused geographical extent isnarrowed. Suitable pixel-based and object-based processing methods are alsodeveloped. Using the developed processing flow drastically reduces acquisitioncost and processing time. The selected test sites in Phangnga and PhuketProvinces, Thailand, which were severely <strong>affected</strong> by the 2004 Indian Ocean<strong>tsunami</strong>, are used to demonstrate the per<strong>for</strong>mance <strong>of</strong> the framework. Furtherstudies include the implementation <strong>of</strong> the processing system and the extension <strong>of</strong>the idea to other natural hazards.1. IntroductionFor decades, remote sensing techniques have been extensively exploited in hazardmapping and disaster mitigation. To quickly map a large <strong>affected</strong> area to be used <strong>for</strong>damage assessment and coordination <strong>of</strong> relief ef<strong>for</strong>ts, remote sensing is the onlycapable technique. There have been plenty <strong>of</strong> published works and realimplementations <strong>of</strong> remote sensing in hazard mapping. A few examples are floodmapping (Barber et al. 1996), displacement mapping due to earthquakes (Massonnetet al. 1993), earthquake damage <strong>detection</strong> (Matsuoka and Yamazaki 1999),landslide mapping (Singhroy and Mattar 2000, Vohora and Donoghue 2004) andvolcano observation (Mouginis-Mark et al. 1991, Andres and Rose 1995). Thedevelopment <strong>of</strong> advanced remote sensing technologies have improved the mappingcapabilities and expanded the <strong>areas</strong> <strong>of</strong> application. The most significant improvementwas the commercialization <strong>of</strong> high spatial resolution satellite images such asIKONOS and QuickBird. They have been employed in earthquake damage<strong>detection</strong> (Vu et al. 2005, Yamazaki et al. 2005) or landslide mapping (Vohoraand Donoghue 2004), etc. Depending on the nature <strong>of</strong> the catastrophe and the*Corresponding author. Email: thuyvu@as.tu.chiba-u.ac.jpInternational Journal <strong>of</strong> Remote SensingISSN 0143-1161 print/ISSN 1366-5901 online # 2007 Taylor & Francishttp://www.tandf.co.uk/journalsDOI: 10.1080/01431160601091811
Downloaded By: [Chiba University Library Kinokuniya Shohen Chiba] At: 01:49 25 June 20072996 T. T. Vu et al.availability <strong>of</strong> satellite data, one or some kinds <strong>of</strong> satellite images are acquired andanalysed. In addition, the selection <strong>of</strong> the relevant satellite image also depends onthe analyser’s expertise; ‘which satellite data must be used?’ and ‘which methodologyis suitable?’ are very crucial.Advancements in remote sensing technologies have resulted in an increase in thesize and complexity <strong>of</strong> image databases. There<strong>for</strong>e, choosing the relevant image datais not a simple task. In the context <strong>of</strong> damage mapping, two image datasets must beretrieved. They are the pre-event dataset and the post-event dataset. It is noted here,that there is also a damage mapping <strong>approach</strong> concerning only post-event datasets(Mitomi et al. 2001). Although research on retrieval <strong>of</strong> images from large databaseshas been a focus <strong>for</strong> the computer vision community <strong>for</strong> some time it has recentlybecome a focus <strong>for</strong> the remote sensing community (Castelli et al. 1998, Agouris et al.1999). The content-based <strong>approach</strong> is found to be more suitable <strong>for</strong> dealing withgeographical in<strong>for</strong>mation contained in the images. These <strong>approach</strong>es can beemployed to retrieve the inventory image data. However, the present study focuseson retrieval <strong>of</strong> image data after a catastrophe occurs when the content has beenchanged. The only available clue is the geographical in<strong>for</strong>mation, i.e. location andsome extents. In addition, computational time is essential <strong>for</strong> quick damageassessment. A simple but efficient <strong>approach</strong> to retrieve less redundant in<strong>for</strong>mationis required and the appropriate solution depends on the type <strong>of</strong> disaster, in ourcase the paper focuses on the Indian Ocean <strong>tsunami</strong> which was caused by anearthquake.A magnitude M w 59.0 earthquake (US Geological Survey) occurred <strong>of</strong>f the coast<strong>of</strong> Sumatra, Indonesia on 26 December 2004 and the triggered <strong>tsunami</strong> causedmassive devastation in vast <strong>areas</strong> along the coastlines <strong>of</strong> the Indian Ocean. For thisawful catastrophe, all the existing satellites – coarse resolution like MODIS, mediumresolution like ASTER, and high resolution like QuickBird – tried to capture images<strong>of</strong> the <strong>affected</strong> <strong>areas</strong>. Consequently, the question about the availability <strong>of</strong> one kind<strong>of</strong> satellite image did not need to be concerned. The problem was turned into findingan efficient solution to quickly grasp the necessary in<strong>for</strong>mation, i.e. the maps <strong>of</strong> the<strong>affected</strong> <strong>areas</strong>. Obviously, there is a trade-<strong>of</strong>f between the total cost including dataacquisition and computational time and the level <strong>of</strong> detail. Based on the facts <strong>of</strong> thismassive <strong>tsunami</strong> and the experiences from previous catastrophes such as the 1995Kobe, Japan earthquake (Matsuoka and Yamazaki 1999), the 1999 Kocaeli, Turkeyearthquake (Eguchi et al. 2000, Estrada et al. 2000), the 2001 Gujarat, Indiaearthquake (Mitomi et al. 2001, Saito et al. 2004), the 2003 Bam, Iran earthquake(Vu et al. 2005, Yamazaki et al. 2005), it was realized that <strong>scale</strong> was a crucial factor.It is also after considering other studies on retrieval <strong>of</strong> images from large database(Castelli et al. 1998). Exploiting the <strong>scale</strong> properties in developing an integratedframework can be a cost-effective solution to <strong>using</strong> remotely sensed data in quickhazard mapping and damage assessment.An integrated processing framework <strong>for</strong> medium spatial resolution opticalsatellite images (Landsat or ASTER), high spatial resolution optical satellite images(QuickBird or IKONOS) and digital elevation data in <strong>detection</strong> <strong>of</strong> <strong>tsunami</strong>-<strong>affected</strong><strong>areas</strong> is developed. The processing flow moves upwards from macro-<strong>scale</strong> (mediumresolution data) to micro-<strong>scale</strong> (high resolution data). The key point <strong>of</strong> thisframework lies in processing only necessary data to provide just enoughin<strong>for</strong>mation. High-resolution data is required only when analysed results onmacro-<strong>scale</strong> could not provide enough in<strong>for</strong>mation or the site is <strong>of</strong> a specific
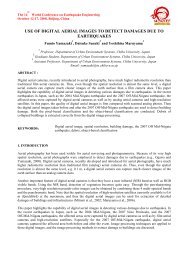
Downloaded By: [Chiba University Library Kinokuniya Shohen Chiba] At: 01:49 25 June 2007Remote Sensing <strong>of</strong> Sumatra Tsunami <strong>of</strong> 26 December 2004 2997concern. The following section describes the idea <strong>of</strong> dual-<strong>scale</strong> mapping applied inmapping <strong>tsunami</strong>-<strong>affected</strong> <strong>areas</strong>. It is followed by descriptions <strong>of</strong> detailed processingon macro- and micro-<strong>scale</strong>s <strong>using</strong> satellite images acquired over the <strong>tsunami</strong>-<strong>affected</strong><strong>areas</strong> in the south <strong>of</strong> Thailand. It should be noted that the developed framework inthis study is limited to optical satellite images. Radar images might be included infuture developments <strong>of</strong> the framework.2. <strong>Dual</strong>-<strong>scale</strong> mapping <strong>of</strong> <strong>tsunami</strong>-<strong>affected</strong> <strong>areas</strong>Objects in the world appear in ways that depend on the <strong>scale</strong> <strong>of</strong> observation(Lindeberg 1993). Satellite images present the overlaying objects on the Earth’ssurface depending on the design <strong>of</strong> satellite sensors. There<strong>for</strong>e, satellite imagesacquired by different sensors present an object in different ways. As a result, thelevel <strong>of</strong> detail and the extent <strong>of</strong> a scene differ. For instance, a Landsat multispectralscene covers an area <strong>of</strong> 1856172 km 2 with 30 m spatial resolution anda QuickBird scene covers an area <strong>of</strong> 16.5616.5 km 2 with 2.4 m spatial resolution.It is fast and easy to figure out the extent <strong>of</strong> a catastrophe by <strong>using</strong> coarserimages but not in detail. On the contrary, it is very costly and time consuming tocover the entire <strong>affected</strong> <strong>areas</strong> only by high spatial resolution images. For quickmapping, the trade-<strong>of</strong>f between these factors should be considered. A frameworkto integrate data on two different <strong>scale</strong>s is proposed as described below. Becausethe study focuses on processing satellite images, data also means image in thispaper.Figure 1 demonstrates the simple idea <strong>of</strong> dual-<strong>scale</strong> mapping. Starting from amacro-<strong>scale</strong>, a set <strong>of</strong> algorithms to search data and to detect <strong>affected</strong> <strong>areas</strong> isapplied. Let S be a detected set on a macro-<strong>scale</strong> and B be a subset <strong>of</strong> S, i.e. B # S.Because B is with specific concern <strong>for</strong> more detailed mapping, its geographic extentis mapped in micro-<strong>scale</strong> in order to search <strong>for</strong> the corresponding data on this <strong>scale</strong>.Subsequently, micro-<strong>scale</strong> <strong>detection</strong> algorithms are applied. It is obvious to estimatehow much the acquisition cost can be reduced by <strong>using</strong> this dual-<strong>scale</strong> link.Moreover, the micro-<strong>scale</strong> algorithms are generally much more complicated thanthe macro-<strong>scale</strong> ones. The dual-<strong>scale</strong> mapping carries out such complicated micro<strong>scale</strong>algorithms to a smaller extent.Theoretically, a <strong>tsunami</strong> is triggered by a big earthquake <strong>of</strong> magnitude higherthan M w 56.5 which generates displacement <strong>of</strong> seabed. It attacks the coastal zoneFigure 1. Schematic plot <strong>of</strong> the dual-<strong>scale</strong> mapping idea. B is the selected area <strong>for</strong> micro<strong>scale</strong>analysis out <strong>of</strong> the area S <strong>for</strong> macro-<strong>scale</strong> analysis.
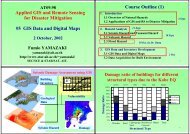
Downloaded By: [Chiba University Library Kinokuniya Shohen Chiba] At: 01:49 25 June 20072998 T. T. Vu et al.and washes away buildings, trees, etc. along the coastline. The extent <strong>of</strong> <strong>affected</strong><strong>areas</strong> depends on the topography <strong>of</strong> the coastal zone as well as the three-dimensional(3D) configuration <strong>of</strong> seabed. From these observations, the dual-<strong>scale</strong> mapping <strong>of</strong><strong>tsunami</strong>-<strong>affected</strong> <strong>areas</strong> was designed as shown in figure 2. Firstly, medium resolutionsatellite images <strong>of</strong> the <strong>affected</strong> coverage are acquired. The pre-event scene is used todetect the coastline. It can be easily done solely by thresholding the near-infrared(NIR) band or applying the K-mean unsupervised classification followed by theextraction <strong>of</strong> water class. Using the detected coastline, a proximity analysis with 8-connectivity is carried out to generate a ‘less than 1.5 km distance’ map. This is dueto past experiences, i.e. a <strong>tsunami</strong> does not go up farther than this distance once itreaches land. But we must be careful to remember that <strong>tsunami</strong> may go up muchfarther along rivers. A 90 m digital elevation model (DEM) grid derived fromShuttle Radar Topography Mission (SRTM) is also employed. The <strong>areas</strong> lower than20 m are selected as potentially <strong>affected</strong> <strong>areas</strong>. These two selected classes <strong>for</strong>m thefirst draft geographic extent.The macro-<strong>scale</strong> analysis is designed to use all remotely sensed data between 10 mand 30 m spatial resolution like ASTER, Landsat and SPOT. As mentioned above,<strong>tsunami</strong> is usually restricted in a thin belt along the coastline; coarser spatialresolution satellite imagery like MODIS will not clearly present the <strong>affected</strong> <strong>areas</strong>.The geographic extent <strong>for</strong>med by the distance map and elevation threshold narrowsthe processing space <strong>of</strong> the medium resolution satellite images. Comparison <strong>of</strong>Normalized Difference Vegetation Index (NDVI) is the main processing on this<strong>scale</strong> and the details are presented in §4.Figure 2.Flow-chart <strong>of</strong> proposed dual-<strong>scale</strong> image processing.
Downloaded By: [Chiba University Library Kinokuniya Shohen Chiba] At: 01:49 25 June 2007Remote Sensing <strong>of</strong> Sumatra Tsunami <strong>of</strong> 26 December 2004 2999On micro-<strong>scale</strong>, high spatial resolution satellite images such as QuickBird andIKONOS are employed. For a ,1m resolution image <strong>of</strong> a small focused extent,visual interpretation is applicable. However, an automatic object-based <strong>approach</strong>was also developed <strong>for</strong> this detailed mapping. Detailed micro-<strong>scale</strong> processing isdescribed in §5. In both, macro- and micro-<strong>scale</strong> processing, several algorithms weredeveloped based on area morphology. Its theory and employment in our imageprocessing are presented in §3.3. Area morphology in image processingSerra (1982) first introduced mathematical morphology. Conventional morphologicaloperations include dilation, erosion, opening, closing, etc. applying a structureelement with a specific shape and size to an image in order to filter out the unwantedor obtain the wanted in<strong>for</strong>mation. Such morphological operations and theircombination can accomplish many tasks <strong>of</strong> image processing. However, as theobject shapes are <strong>of</strong>ten unknown and diverse in an analysed image, especially inremotely sensed images, this operation is hardly applied in every case. One solutionis applying a series <strong>of</strong> operations but it is computationally intensive. Also ‘grey<strong>scale</strong>reconstruction’ or ‘geodesic method’ is a possible solution to overcome the problem(Lantuejoul and Maisonneuve 1984, Vincent 1992). Initiated from this, Vincent(1992) introduced the idea <strong>of</strong> area openings and closings.3.1 Area morphological filteringArea opening filtering removes the components with an area smaller than aparameter s from a binary image. Similarly, area closing filtering fills the holes withan area smaller than a parameter s. The binary area opening is defined as follows.Let X be a subset <strong>of</strong> set M # R 2 and {X i } is all the connected components <strong>of</strong> X. Thearea opening <strong>of</strong> parameter s (s>0) <strong>of</strong> X is the union <strong>of</strong> the connected components <strong>of</strong>X with area greater than s:c a s (X)~| f X iji[I,area(X i )§sg ð1ÞThe area closing <strong>of</strong> parameter s (s > 0) <strong>of</strong> X is then defined as:w a s (X)~ ca s (X C C)ð2Þwhere X C denotes the complement <strong>of</strong> X in MVincent (1992) then extended the definition <strong>of</strong> binary area opening or closing togrey<strong>scale</strong> area opening or closing. A grey<strong>scale</strong> image can be defined as a mapping f:M R R. The grey<strong>scale</strong> opening <strong>of</strong> f is given by:(c a s (f ))(x)~ _ hƒf (x)jx[ca s (T h(f ))ð3Þwhere ~ stands <strong>for</strong> supermum, i.e. a lowest upper bound, and T h is the threshold <strong>of</strong> fat value h.T h (f )~ fx[Mjf (x)§hg ð4ÞIn other words, the image M is firstly threshold with all the possible h and the binaryopening c a s ð T hðfÞÞ is found. Subsequently, ~ is applied to all the recently foundc a s ð T hðfÞÞ. It is similarly extended to grey<strong>scale</strong> closing by duality. Areamorphological filtering does not depend on the shape <strong>of</strong> structural elements as
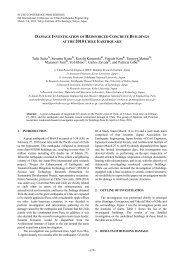
Downloaded By: [Chiba University Library Kinokuniya Shohen Chiba] At: 01:49 25 June 20073000 T. T. Vu et al.the conventional ones. There<strong>for</strong>e, it can effectively remove noise and simultaneouslyretain thin or elongated objects.3.2 Area morphological classification and feature extractionThe area opening and closing <strong>for</strong> grey<strong>scale</strong> images are flat increasing mapping whichcan be used <strong>for</strong> image simplification (Soille and Pesaresi 2002). An example <strong>of</strong> imagesimplification is shown in figure 3, where a grey<strong>scale</strong> area opening followed by agrey<strong>scale</strong> area closing opening was applied to a QuickBird image with parameter <strong>of</strong>1000 pixels. This filtered image can assist visual interpretation or can be extended toclassification or feature extraction.The conventional classification methods, either supervised or unsupervised,categorize the spectral signatures into different groups. Only statistical in<strong>for</strong>mation<strong>of</strong> spectral signatures is included. The <strong>for</strong>m and structure <strong>of</strong> objects are notconsidered. As a result, the classified images represent a number <strong>of</strong> sets <strong>of</strong> pixelsassigned to different classes. For further usage <strong>of</strong> the result, e.g. input to GISdatabase, post-processing is required. These conventional methods can generate <strong>areas</strong>onably classified result <strong>for</strong> coarse to medium spatial resolution images becausethese images do not possess enough structural in<strong>for</strong>mation either. However, highspatial resolution satellite images possess very detailed in<strong>for</strong>mation. More signaturesshould be included in their classification.Area morphology is exploited to classify high spatial resolution satellite imagesacross the <strong>scale</strong> space. Morphological in<strong>for</strong>mation <strong>of</strong> an object depends on <strong>scale</strong>property. Classification across the <strong>scale</strong> space is the solution to integratemorphological in<strong>for</strong>mation with spectral in<strong>for</strong>mation. K-mean clustering algorithm(Tou and Gonzalez 1974) is employed to group the pixels across the <strong>scale</strong> spaceand the spectral space. Step-by-step <strong>scale</strong> space clustering classification is describednext.Theoretically, the <strong>scale</strong> space is generated by an infinite number <strong>of</strong> <strong>scale</strong>s. Forthe discrete dimension <strong>of</strong> an image, the number <strong>of</strong> <strong>scale</strong>s increases one each asa window (area) size increases from one pixel to an image size. However, it isFigure 3. An example <strong>of</strong> image simplification by grey<strong>scale</strong> area opening and closing;original false colour composite image (a) and filtered false colour composite image with <strong>scale</strong>parameter s51 000 (b).
Downloaded By: [Chiba University Library Kinokuniya Shohen Chiba] At: 01:49 25 June 2007Remote Sensing <strong>of</strong> Sumatra Tsunami <strong>of</strong> 26 December 2004 3001time-consuming to concern all the area values. Practically, a scene contains alimited number <strong>of</strong> sizes. There<strong>for</strong>e, in the first step, horizontal and verticalgranulometry analyses (Vincent 1994) are carried out to find the potential patternscontained in an image as illustrated in figure 4. The local maximum found inhorizontal and vertical dimensions can be used to compute the possible <strong>areas</strong> <strong>of</strong>objects in the image. Computed <strong>areas</strong> are parameters <strong>for</strong> <strong>scale</strong> space generation. If asingle-band image is analysed, granulometry analysis runs on this image. Alternatively,when a multi-spectral image is analysed, to be simplified, granulometryanalysis runs on the first component image derived from Principle ComponentAnalysis (PCA).Secondly, area opening followed by area closing with the above defined areaparameters is carried out on each band. This step is extremely time consuming ifthere are many <strong>scale</strong>s to be analysed and the pixel values are in a wide range.Parallel processing is a good solution since the processing can independently run<strong>for</strong> each grey value and also each band. Moreover, narrowing the range <strong>of</strong>grey value can also reduce the computational time. To maintain the distribution <strong>of</strong>grey value well, division <strong>of</strong> a band by its standard deviation is employed. The secondstep opens a single-band image to its <strong>scale</strong> space. The products <strong>of</strong> this step in truecolour composite or false colour composite are useful in assisting visualinterpretation.The third step is to cluster the spectral signatures by K-mean algorithm (Tou andGonzalez 1974). K-mean algorithm is an iterative process which minimizes thedistance from an entity to the centre <strong>of</strong> a cluster. At every step <strong>of</strong> the iteration,the centres <strong>of</strong> the clusters are recomputed. The attributes used <strong>for</strong> this clustering areFigure 4.Illustration <strong>of</strong> the horizontal and vertical granulometry analyses.
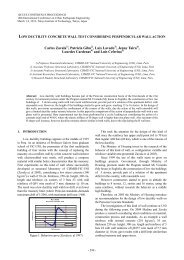
Downloaded By: [Chiba University Library Kinokuniya Shohen Chiba] At: 01:49 25 June 20073002 T. T. Vu et al.the spectral signatures. Let I is be the grey value <strong>of</strong> pixel i at channel s (s 51, 2, … ,the number <strong>of</strong> channels). I i 5{I is } is called the spectral vector <strong>of</strong> pixel i. Theclustering compares and assigns classes according to similarity <strong>of</strong> this spectral vector<strong>of</strong> every pixel. It should be noted that not all the <strong>scale</strong>s should be clustered.Generally, very coarse <strong>scale</strong>s reflect ground objects which are assumed to bebackground. In classification or segmentation <strong>of</strong> buildings, trees, etc., those <strong>scale</strong>smight be excluded. In addition, a very fine <strong>scale</strong> might also be excluded if it stands<strong>for</strong> very small objects which can be assumed noise. This step separately generatesclustered objects on each chosen <strong>scale</strong>.Across the <strong>scale</strong> space from fine to coarse <strong>scale</strong>, an object with a certain area isabsorbed into a bigger one. Starting from a very coarse <strong>scale</strong> and moving upwardsto finer ones, as soon as a new object appears inside a current one, it is the cue toextract this new small object. For illustration, an example <strong>of</strong> the segmented resultsfrom an original image (figure 5(a)) in false colour composite on three consecutive<strong>scale</strong>s is presented from finer to coarser <strong>scale</strong>s in figure 5(b) to5(d).Depending on the defined <strong>scale</strong> parameters and assigned numbers <strong>of</strong> classes, thefinal classified image represents the objects with an assigned class rather than a set <strong>of</strong>pixels by conventional classification. The classification or segmentation based onarea morphology analyses spectral signatures in a morphological frame. It maintainsstructural in<strong>for</strong>mation in the neighbour while analysing spectral in<strong>for</strong>mation. Verycomplex scenes in urban <strong>areas</strong>, such as complex structures including many smallparts with diverse spectral signatures or a street partly hidden by trees, might not besegmented as one. Post-processing, either by visual inspection or knowledge-basedfrom a current database, is required <strong>for</strong> such cases.4. Macro-<strong>scale</strong> processingTwo ASTER pairs <strong>of</strong> Khao Lak, Phangnga Province and Patong, Phuket Provinceare used to demonstrate the macro-<strong>scale</strong> processing. Their acquisition dates areshown in table 1. The pre-event and post-event Khao Lak ASTER images in falsecolour composite are shown in figure 6(a) and 6(b), respectively. It is easy to observethe <strong>affected</strong> <strong>areas</strong> due to massive devastation <strong>of</strong> vegetation along the coastline. Thecorresponding NDVI signatures were computed and they are shown in figure 6(c)and 6(d), respectively. Computation was carried out <strong>for</strong> a smaller extent defined bythe window generated by elevation and distance thresholds (figure 7(a)). Asvegetation was washed away by the <strong>tsunami</strong>, the NDVI values <strong>of</strong> the <strong>affected</strong>zones were reduced. There<strong>for</strong>e, thresholding the difference between pre-NDVI andpost-NDVI values shows the potentially <strong>affected</strong> zones. Let preNDVI andpostNDVI are the computed NDVI values from the pre-event and post-eventimages, respectively. The potentially <strong>affected</strong> zones pZ are defined by:pZ~fZ i j(Z i [DIFF)andðval(Z i )vMean(DIFF){Std(DIFF) Þg ð5Þwhere DIFF is the set generated by postNDVI– preNDVI, Z i is a pixel, val(Z i ) is itsvalue and Mean(DIFF) and Std(DIFF) are the average and standard deviationvalues <strong>of</strong> DIFF, respectively.The <strong>affected</strong> zones that were extracted by the above statistical threshold areshown figure 7(b). Then, binary area opening and closing filtering with a parameter<strong>of</strong> 100 was applied to figure 7(b) and the <strong>affected</strong> zones were extracted as shown infigure 7(c). The detected zones, which were in raster <strong>for</strong>mat, were then converted tovector <strong>for</strong>mat <strong>for</strong> further usages.
Downloaded By: [Chiba University Library Kinokuniya Shohen Chiba] At: 01:49 25 June 2007Remote Sensing <strong>of</strong> Sumatra Tsunami <strong>of</strong> 26 December 2004 3003Figure 5. Illustration <strong>of</strong> segmentation; (a) is the original false colour composite andsegmented results on three parameter <strong>scale</strong>s from fine to coarse are shown in (b) <strong>for</strong> s59, (c)<strong>for</strong> s5300 and (d) <strong>for</strong> s5510 (black is the background and grey<strong>scale</strong> code <strong>for</strong> different spectralclasses).Two scenes acquired over Khao Lak were in the same season. There<strong>for</strong>e, simplecomparison <strong>of</strong> NDVI was successful. Searching the archive data to retrieve the preeventscene, which is in the same season as the post-event scene, is required. ThereTable 1. ASTER images used during macro-<strong>scale</strong> analysis.Khao Lak, Phangnga Patong, PhuketPre-event 15 November 2002 28 February 2003Post-event 31 December 2004 31 December 2004
Downloaded By: [Chiba University Library Kinokuniya Shohen Chiba] At: 01:49 25 June 20073004 T. T. Vu et al.Figure 6. False colour composite <strong>for</strong> pre-event (a) and post-event (b) ASTER images <strong>for</strong>Khao Lak and corresponding NDVI signatures <strong>for</strong> pre-event (c) and post-event (d).are some errors due to cloud cover, which can be removed easily and quickly. Thebiggest obstacle in detecting <strong>tsunami</strong>-<strong>affected</strong> zones, as well as the ones due to othernatural hazards, is man-made changes. As observed in figures 6 and 7, there are aFigure 7. (a) Selected <strong>areas</strong> by elevation and distance thresholds. (b) Extracted <strong>affected</strong>zones. (c) Filtered extracted <strong>affected</strong> zones.
Downloaded By: [Chiba University Library Kinokuniya Shohen Chiba] At: 01:49 25 June 2007Remote Sensing <strong>of</strong> Sumatra Tsunami <strong>of</strong> 26 December 2004 3005few detected polygons not due to <strong>tsunami</strong>. They are usually far away from theseashore. If not, these cannot be distinguished automatically; in such cases visualinspection is required. To eliminate the detected polygons due to man-made changesand far away from the seashore, proximity is checked as follows. Let Z be the set <strong>of</strong>detected polygons, i.e. Z5{Z i } and S is the sea class. The newly detected set <strong>of</strong><strong>affected</strong> zones is given by:A~ fZ i jZ i is neighbour <strong>of</strong> Sg ð6ÞThe extraction <strong>affected</strong> <strong>areas</strong> from the pre-event and post-event ASTER images <strong>of</strong>Patong, Phuket, however, showed no clear differences between the images eventhough Patong is one <strong>of</strong> the <strong>areas</strong> hit hardest by the <strong>tsunami</strong>. It means that ASTERis unable to detect <strong>affected</strong> <strong>areas</strong> in Patong <strong>using</strong> medium resolution satellite imagesor, in other words, macro-<strong>scale</strong>. There are a lot <strong>of</strong> buildings and other structuresalong the coastline catering <strong>for</strong> tourism. The <strong>tsunami</strong> was blocked by thosestructures and could not reach too far inland. Although the <strong>tsunami</strong> destroyed thosestructures, this was not observed in the moderate-resolution satellite images, i.e. topview.Micro-<strong>scale</strong> mapping might provide more in<strong>for</strong>mation. The selected extentfrom the ASTER image <strong>for</strong> searching high-resolution satellite images were (421 700,874 100) at the top-left corner and (424 400, 872 300) at the bottom-right corner. Thecoordinates were presented in UTM projection, zone 47 North.5. Micro-<strong>scale</strong> processingFollowing the extracted extent above, pre-event and post-event QuickBird images <strong>of</strong>Patong were purchased as listed in table 2. These two images were acquired in thesame dry season. However, there is a three-year difference in acquisition time duringwhich some man-made changes may have taken place. Furthermore, cloud coveralso limits the corresponding extent between the two images. Because <strong>of</strong> the complexand detailed in<strong>for</strong>mation observed on micro-<strong>scale</strong>, both, visual and automatedinterpretation methods were introduced assisted by area morphology (see §3.2).Prior to that, pan-sharpening was carried out to exploit multi-spectral in<strong>for</strong>mationat the better spatial resolution <strong>of</strong> 0.6 m instead <strong>of</strong> 2.4 m.As pointed out by Zhang (2002), conventional pan-sharpening algorithms such asIHS fusion, PCA fusion, etc. were developed <strong>for</strong> the satellite images whosepanchromatic channel covers only the visible regions <strong>of</strong> the electromagneticspectrum. Thus, such algorithms do not work well <strong>for</strong> high-resolution satelliteimages like QuickBird and IKONOS. An improvement can be achieved by adjustingthe contribution from the panchromatic band when pan-sharpening other multispectralband images, depending on sensor characteristics and the covered area.However, it is quite difficult to clearly analyse the contribution from thepanchromatic band to each multi-spectral band due to inter-correlation amongTable 2. QuickBird images used during micro-<strong>scale</strong> analysis.Patong, PhuketPre-event 23 March 2002Post-event 02 January 2005
Downloaded By: [Chiba University Library Kinokuniya Shohen Chiba] At: 01:49 25 June 20073006 T. T. Vu et al.them. We propose an improved pan-sharpening method based on PCA namedPCPANfit as follows.First, multi-spectral scenes are re-sampled <strong>using</strong> the same spatial resolution as thecorresponding panchromatic scenes. They are then extracted in the same extent.Second, <strong>for</strong>ward PCA trans<strong>for</strong>mation is applied to the multi-spectral channelimages. The histogram <strong>of</strong> the panchromatic channel image is adjusted to be the same<strong>scale</strong> as that <strong>of</strong> the first component by PCA. The adjusted panchromatic channelthen replaces the first component. Third, reverse PCA trans<strong>for</strong>mation is carried out.Subsequently, a regression analysis is applied to find out a possible relationshipbetween each newly <strong>for</strong>med channel and each original multi-spectral channel. Last,the grey value <strong>of</strong> each channel is adjusted following the relationship to obtain thefinal pan-sharpened image. All the steps are developed in one module and a user isrequired to input only original panchromatic and multi-spectral channel images. Atest <strong>of</strong> this PCPANfit <strong>for</strong> a 1200 pixel61200 pixel QuickBird scene with four multispectralbands on a Windows-based desktop PC with 3.06GHz CPU and 2GB RAMtook only 15 second. It generated a good-look pan-sharpened image with less colourdistortion. The correlation coefficients between this pan-sharpened image and theoriginal multi-spectral images were 0.86, 0.85, 0.85 and 0.90 <strong>for</strong> blue, green, red andNIR bands, respectively.The panchromatic scene described above was used in granulometry analysis toinvestigate potential pattern <strong>areas</strong> in the scene. The analysis on the pre-eventpanchromatic scene showed that the possible area parameters are 9, 300, 510, 1 167,17 000 and 38 700. These six area parameters were used to generate the <strong>scale</strong> space.The post-event scene, due to the effect <strong>of</strong> the <strong>tsunami</strong> attack, was expected tocontain more object classes. In addition, possible man-made changes might alsointroduce several different area parameters. As the scene has not completelychanged, the area parameters found from the pre-event scene still represent the <strong>areas</strong>in the post-event scene. The same parameters, hence, were used <strong>for</strong> both scenes. It isalso meaningful to apply a predefined set <strong>of</strong> parameters derived from archive data,i.e. pre-event data, to a newly acquired post-event scene in the context <strong>of</strong> quickdamage assessment.For illustration, figure 8 shows a selected <strong>affected</strong> area in false colour compositeimages on <strong>scale</strong>s s59, 510 and 17 000 compared to its original false colourcomposite. Human perception can easily understand and map the <strong>affected</strong> <strong>areas</strong> inthe spatial resolution <strong>of</strong> 0.6 m. However, extraction is made easier with theassistance <strong>of</strong> in<strong>for</strong>mation across the <strong>scale</strong> space. For example, trees can be extractedon <strong>scale</strong> 9 and inundated <strong>areas</strong> with mud or sand brought by <strong>tsunami</strong> can beextracted on <strong>scale</strong> 510. Based on this, <strong>affected</strong> zones can be extracted and overlaidon other layers in further assessment. In this processing framework on micro-<strong>scale</strong>,we also employed the area morphological classification as described in §3.2. Itprovides a higher level <strong>of</strong> automation.The treated area morphological classification entity is the object whose propertiesare spectral class and the range <strong>of</strong> size rather than the pixel by conventionalmethods. Objects were extracted from the pre-event scene depending on theirspectral and structural in<strong>for</strong>mation. The segmented results from the pre-event imagewere all converted to vector <strong>for</strong>mat. Each segmented object became a polygon withrange <strong>of</strong> sizes and spectral class as its attributes. They are readily used to update ordevelop a GIS database. To segment a post-event scene, new sets <strong>of</strong> parameters mustbe derived by granulometry analysis and the same scheme as applied to the pre-event
Downloaded By: [Chiba University Library Kinokuniya Shohen Chiba] At: 01:49 25 June 2007Remote Sensing <strong>of</strong> Sumatra Tsunami <strong>of</strong> 26 December 2004 3007Figure 8. Area morphology <strong>scale</strong>-space assists visual interpretation. a) original false colourcomposite image, b) false colour composite image on <strong>scale</strong> s59, c) s5510, and d) s517000.Upper plots are from the pre-event image and the lower plots from the post-event image.scene is repeated. However, the goal here is to map the changes due to the <strong>tsunami</strong>attack.For change <strong>detection</strong> between two scenes, the pre-event appearance <strong>of</strong> an objectwas compared to the classified results <strong>of</strong> the post-event scene on the same <strong>scale</strong>. Allthe properties like shape, size and spectral reflectance that might be changed areshown through this comparison. The same set <strong>of</strong> parameters applied to the posteventscene produced a very messy classified result, especially along the coastline. Astreet object along Patong Beach, which was segmented between <strong>scale</strong>s 510 and 1167, is picked up <strong>for</strong> illustration in figure 9. It is presented as a vector polygonoverlaying on the pre-event image (figure 9(a)). The classified result <strong>of</strong> the post-eventimage on the same range <strong>scale</strong>, i.e. between 510 and 1167, is shown in figure 9(b).This street was covered by mud or sand and hence disappeared in the post-eventscene except <strong>for</strong> the horizontal branch which was retained, i.e. the long thin greenobject in the middle <strong>of</strong> figure 9(b).Another example is a big vegetation object which is actually an area covered bygrass and many trees in a resort (figure 10(a)). Grassland was completely washedaway while several trees still stood. As shown in figure 10(b), a big part <strong>of</strong> this objectwhich is blue and in the middle <strong>of</strong> the figure shows the same spectral class <strong>of</strong> mud orsand. Farther inland, the segmented objects showed almost no change such as avegetation object segmented both from the pre-event and post-event scene(figure 11). This location was confirmed as the farthest point where the <strong>tsunami</strong>ran up from interviewing local people. For easy-to-observe illustration, eachsuccessfully segmented object, as shown in figures 9(a), 10(a) and 11(a) and 11(b), ispresented as a transparent polygon with thick and darker coloured boundariesoverlaid on a false colour composite image.
Downloaded By: [Chiba University Library Kinokuniya Shohen Chiba] At: 01:49 25 June 20073008 T. T. Vu et al.Figure 9. A street object was changed due to the <strong>tsunami</strong>: (a) extracted objects from the preeventscene (yellow object overlaid on false colour composite pre-event image) and (b)extracted results from the post-scene on the same <strong>scale</strong> (between s5510 and s51167) (black<strong>for</strong> background and colour codes <strong>for</strong> different spectral classes).6. ConclusionThe dual-<strong>scale</strong> mapping idea is introduced and applied in order to map 2004Indian Ocean <strong>tsunami</strong>-<strong>affected</strong> <strong>areas</strong>. <strong>Dual</strong>-<strong>scale</strong> mapping targets the reduction <strong>of</strong>cost and processing time <strong>for</strong> a quick response after a catastrophe or to <strong>of</strong>fer acost-effective solution. While macro-<strong>scale</strong> mapping can provide an <strong>affected</strong> extentin a large rural area or in a totally devastated area, micro-<strong>scale</strong> mapping can providea detailed change <strong>of</strong> each object because the method possesses higher spatialresolutions.Figure 10. A vegetation object that was changed due to the <strong>tsunami</strong>: (a) extracted objectsfrom the pre-event scene (green object overlaid on false colour composite pre-event image)and (b) extracted results from the post-event scene on the same <strong>scale</strong> (between s5510 ands51 167) (black <strong>for</strong> background and colour codes <strong>for</strong> different spectral classes).
Downloaded By: [Chiba University Library Kinokuniya Shohen Chiba] At: 01:49 25 June 2007Remote Sensing <strong>of</strong> Sumatra Tsunami <strong>of</strong> 26 December 2004 3009Figure 11. A vegetation object that was retained after the <strong>tsunami</strong>: (a) extracted from thepre-event scene (green object overlaid on false colour composite pre-event image) and (b)extracted from the post-event scene (green object overlaid on false colour composite posteventimage) on the same <strong>scale</strong> (between s5510 and s51 167).Several new image-processing <strong>approach</strong>es were also developed and applied inproposed dual-<strong>scale</strong> processing. These are area morphological filtering, areamorphological classification/segmentation, and pan-sharpening PCPANfit. Each<strong>of</strong> them plays a vital role in the proposed processing flow and is applicable to imageprocessing in general. For a further development <strong>of</strong> the dual-<strong>scale</strong> mapping system,a GIS-based environment would be essential allowing users to connect to web-baseddata catalogues in order to search <strong>for</strong> satellite images prior to processing. Userscould search local user databases or other agencies’ databases. The idea would alsobe applicable to mapping or monitoring other natural hazards like floods andearthquakes, etc.AcknowledgementThe QuickBird scenes used in this study are owned by DigitalGlobe Co., Ltd and theSRTM DEM was provided by the US Geological Survey (USGS).ReferencesAGOURIS, P., CARSWELL, J. and STEFANIDIS, A., 1999, An environment <strong>for</strong> content-basedimage retrieval from large spatial database. ISPRS Journal <strong>of</strong> Photogrammetry andRemote Sensing, 54, pp. 263–272.ANDRES, R.J. and ROSE, W.I., 1995, Detection <strong>of</strong> thermal anomalies at Guatemalanvolcanoes <strong>using</strong> Landsat TM images. Photogrametric Engineering and RemoteSensing, 61, pp. 775–782.BARBER, D.G., HOCHHEIM, K.P., DIXON, R., MOSSCROP, D.R. and MCMULLAN, M.J., 1996,The Role <strong>of</strong> Earth Observation Technologies in Flood Mapping: A Manitoba CaseStudy. Canadian Journal <strong>of</strong> Remote Sensing, 22, pp. 137–143.CASTELLI, V., BERGMAN, L., KONTOYIANNIS, I., LI, C.-S., ROBINSON, J. and TUREK, J., 1998,Progressive search and retrieval in large image archives. IBM Journal <strong>of</strong> Research andDevelopment, 42, pp. 253–268.EGUCHI, R.T., HUYCK, C.K., HOUSHMAND, B., MANSOURI, B., SHINOZUKA, M.,YAMAZAKI, F. and MATSUOKA, M., 2000, The Marmara earthquake: a view fromspace: the Marmara, Turkey earthquake <strong>of</strong> August 17, 1999: Reconnaissance Report.Technical Report MCEER-00-0001 (Buffalo, NY: MCEER), pp. 151–169.
Downloaded By: [Chiba University Library Kinokuniya Shohen Chiba] At: 01:49 25 June 20073010 T. T. Vu et al.ESTRADA, M., YAMAZAKI, F. and MATSUOKA, M., 2000, Use <strong>of</strong> Landsat images <strong>for</strong> theidentification <strong>of</strong> damage due to the 1999 Kocaeli, Turkey earthquake. In Proceeding<strong>of</strong> the 21st Asian Conference on Remote Sensing, 4–8 December 2000, Singapore, pp.1185–1190.LANTUEJOUL, C. and MAISONNEUVE, F., 1984, Geodesic methods in image analysis. PatternRecognition, 17, pp. 117–187.LINDEBERG, T., 1993, Discrete derivative approximations with <strong>scale</strong>-space properties: a basis<strong>for</strong> low-level feature extraction. Journal <strong>of</strong> Mathematical Imaging and Vision, 3, pp.349–376.MASSONNET, D., ROSSI, M., CARMONA, C., ADRAGNA, F., PELTZER, G., FEIGL, K. andRABAUTE, T., 1993, The displacement field <strong>of</strong> the Landers earthquake mapped byradar interferometry. Nature, 364, pp. 138–142.MATSUOKA, M. and YAMAZAKI, F., 1999, Characteristics <strong>of</strong> satellite images <strong>of</strong> damaged <strong>areas</strong>due to the 1995 Kobe earthquake. In Proceedings <strong>of</strong> the 2nd Conference on theApplications <strong>of</strong> Remote Sensing and GIS <strong>for</strong> Disaster Management, 19–21 January1999, The George Washington University, CD-ROM (Washington DC: GeorgeBernard Shaw University).MITOMI, H., SAITA, J., MATSUOKA, M. and YAMAZAKI, F., 2001, Automated damage<strong>detection</strong> <strong>of</strong> buildings from aerial television images <strong>of</strong> the 2001 Gujarat, Indiaearthquake. In Proceedings <strong>of</strong> the IEEE 2001 International Geoscience and RemoteSensing Symposium, 9–13 July, IEEE, CD-ROM, 3p (Piscataway, NJ: IEEE).MOUGINIS-MARK, P., ROWLAND, S., FRANCIS, P., FRIEDMAN, T., GRADIE, J., SELF, S.,WILSON, L., CRISP, J., GLAZE, L., JONES, K., KAHLE, A., PIERI, D., ZEBKER, H.A.,KREUGER, A., WALTER, L., WOOD, C., ROSE, W., ADAMS, J. and WOLFF, R., 1991,Analysis <strong>of</strong> active volcanoes from the Earth Observing System. Remote Sensing <strong>of</strong>Environment, 36, pp. 1–12.SAITO, K., SPENCE, R.J.S., GOING, C. and MARKUS, M., 2004, Using high-resolution satelliteimages <strong>for</strong> post-earthquake building damage assessment: a study following the 26January 2001 Gujarat earthquake. Earthquake Spectra, 20, pp. 145–169.SERRA, J., 1982, Image Analysis and Mathematical Morphology (London: Academic Press).SINGHROY, V. and MATTAR, K.E., 2000, SAR image techniques <strong>for</strong> mapping <strong>areas</strong> <strong>of</strong>llandslides. In Proceedings <strong>of</strong> ISPRS Congress, Amsterdam, 16–22 July 2000,(Enschede: ISPRS), pp. 1395–1402.SOILLE, P. and PESARESI, M., 2002, Advances in mathematical morphology applied togeoscience and remote sensing. IEEE Transactions on Geoscience and Remote Sensing,40, pp. 2042–2055.TOU, J.T. and GONZALEZ, R.C., 1974, Pattern Recognition Principles (Reading, MA: AddisonWesley).VINCENT, L., 1992, Morphological area opening and closings <strong>for</strong> grey<strong>scale</strong> images. InProceedings NATO Shape in Picture workshop, 7–11 September 1992, Driebergen, TheNetherlands (Berlin, Heidelberg: Springer-Verlag), pp. 197–208.VINCENT, L., 1994, Fast gray<strong>scale</strong> granulometry algorithms. In Proceeding EURASIPWorkshop ISMM’94, Mathematical Morphology and its Applications to ImageProcessing, 5–9 September 1994, Fontainebleau, France (Dordercht: KluwerAcademic), pp. 265–272.VOHORA, V.K. and DONOGHUE, S.L., 2004, Application <strong>of</strong> remote sensing data to landslidemapping in Hong Kong. In Proceeding <strong>of</strong> ISPSRS Congress, 12–23 July 2004,Istanbul, Turkey, DVD-ROM (Ottawa: ISPRS).VU, T.T., MATSUOKA, M. and YAMAZAKI, F., 2005, Detection and animation <strong>of</strong> damage<strong>using</strong> very high-resolution satellite data following the 2003 Bam, Iran, earthquake.Earthquake Spectra, 21 (S1), pp. S319–S327.YAMAZAKI, F., YANO, Y. and MATSUOKA, M., 2005, Visual damage interpretation <strong>of</strong>buildings <strong>using</strong> QuickBird images following the 2003 Bam, Iran, earthquake.Earthquake Spectra, 21 (S1), pp. S329–S336.
Downloaded By: [Chiba University Library Kinokuniya Shohen Chiba] At: 01:49 25 June 2007Remote Sensing <strong>of</strong> Sumatra Tsunami <strong>of</strong> 26 December 2004 3011ZHANG, Y., 2002, Problems in the fusion <strong>of</strong> commercial high-resolution satellite images aswell as Landsat 7 images and initial solutions. In Proceeding <strong>of</strong> Joint InternationalSymposium on GeoSpatial Theory, Processing and Applications, 8–12 July, 2002,Ottawa, Canada.