
You also want an ePaper? Increase the reach of your titles
YUMPU automatically turns print PDFs into web optimized ePapers that Google loves.
Agenda●●●●●●●●SafetyOre bodyMining methodsProductionOperating costsCapital expenditureHuman resourcesKey business issues
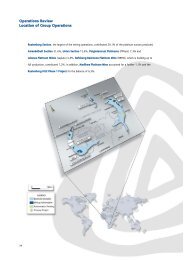
Locality – Modikwa <strong>Platinum</strong> MineBRAKFONTEIN464 KSAVOCA472 KSKLIPFONTEIN465 KSDE KAMP507 KSZWARTKOPPIES413 KSPASCHASKRAAL466 KSTWICKENHAM114 KTWATERKOP113 KTMECKLENBURG112 KTSURBITON115 KTCROYDON120 KTBushveld ComplexAmplats MinesImpala Mines - GencorLonrho MinesGoldfields Mines - NorthamBAFOKENGIMPALARPM. RUSTENBURGRustenburgSOUTHRPM. AMANDELBULTNORTHAMRPM. UNIONWESTERN ANDEASTERN PLATSAFRICAAFRICAPP RUSTPotgietersrustWarmbathsBARPLATSCROCODILE RIVERPRETORIAMaandagshoekfarm25 O Republic of South AfricaBarplatsKennedys Vale25 O LydenburgLEBOWABALMORAL508 KSQUARTZHILL542 KSMAGNETS -VLAKTE541 KSDINGAANS -KOPFERN543 KS KLOOF539 KS3 000mHACKNEY116 KTDSJATE249 KTDE KOMZWEM - 252 KTKLOOF283 KT2 000mGROOT -VYGEBOOM284 KTWINNAARSHOEK250 KTGENOKAKOP285 KTGARA -TOUW282 KTHOOGSTE -PUNT290 KTHOUTBOSCH323 KT1 000mFOREST HILL117 KTCLAPHAM118 KTDRIEKOP253 KTMAANDAGSHOEK254 KTHOEPA -KRANZ291 KTNOOITVERWACHT -324 KTTWYFE -LAAR119 KTONVERWACHT292 KTEERSTE GELUK322 KTMerensky ReefTHE SHELTER121 KTMOOIHOEK255 KTGROOTHOEK256 KTHENDRIKSPLAATS281 KTWINTERVELD293 KTDOORNBOSCH294 KTUG 2WitbankB U S H V E L DC O M P L E XEASTERNBUSHVELD
LocationJV area
Lost time injury frequency rate5.004.504.003.503.002.502.001.501.000.500.002002 2003 2004 YTDAct/F_cast 1.51 3.39 4.56 2.79
Fatalities3.503.002.502.001.501.000.500.002002 2003 2004 YTDAct/F_cast 1 3 3 1
GeologyResources/reserves
Modikwa <strong>Platinum</strong> Mine – lease areaN24.8 kmTotal lease area 14 278 haNot to scaleMpumalanga Province
Modikwa <strong>Platinum</strong> Mine – mining areaBase casePhase 1Phase 2Phase 3North shaftextensionSouth shaftextension• Deepening of North shaft declines by 1 levelcommenced in 2005.
Stratigraphic column in proximity of UG215m10mUG 3AUG3HW12cm12cm5cmTriplet 3Triplet 2Triplet 1TRC● Outcropping Merensky & UG2 ,Westerly Dip ~11°● Merensky to UG2 separationapproximately 260m● Variable middling of triplets andLeuconorite Parting Plane (LPP) toTop Reef Contact (TRC) on UG2● Norite-Fsp Pyroxenite contact 40-60cm above MR0UG 258cmUG2ChannelStopingProfile- L E G E N D -NORITEFW15 to70cmBRC17cmSPOTTED ANORTHOSITEMOTTLED ANORTHOSITEPYROXENITEPORPHYRITIC PYROXENITEPEGMATOIDAL PYROXENITE91mUG1HARZBURGITECHROMITITE STRINGERCHROMITITE
Optimal Stoping Cut(per shaft area)TRC50417218Leuconorite Unit101030 25735884UG2107 Planned58 61101 Planned5697 PlannedBRC20 -451020 1621 21 21NORTH SHAFT SOUTH SHAFT HILL ADITS• Mine average planned at 102 cm – Currently 105cm
Vertical grade distribution in UG2North ShaftSouth ShaftAverage g/t 4E: North 5.65 South 5.99 Total 5.81Reef channelHanging wallFoot wall
2004 UG2 resourcecategories(Data Mine model)Measured ResourceIndicated ResourceInferred Resource
2004 Merenskyresource categories(Data Mine model)117 boreholesIndicated ResourceInferred Resource
Resource & reserve statement - 2004
Exploration status• Phase 1 foot<strong>print</strong> complete by end 2006• Phase 2 drilling commenced in line with currentexploration programme• 3D seismic will be conducted in 2006 over a target areaon North and South Shafts• Merensky Exploration continuing – trial mining tocommence in 2006
Drilling programme 2005-2008Phase 1 Phase 220052005 S#200620072005 N#2008 2006 Infill
On-mine - Exploration drillingSurface Drillingmetres4500040000350003000025000200001500010000500002003 2004 2005 2006
Mining methods
Original design• Twin decline shaft systems– Vehicle access decline– Belt decline• Main strike development on-reef• Conventional down-dip stoping• Twin raises separated by 5m pillar• 90 cm stoping width• Mechanised development and tramming• Flat management / supervisory structures• Self directed, multi-skilled work teams• No night shift, two panel cycle• Continuous operations (Conops)• Fully autogenous milling• 200 ktpm, 162 kozpa• Onverwacht Hill and Mid Shaft areas included
Changes to original design• Chairlift decline access• Main strike development in the footwall• Stoping changed from down-dip to breast• 102 cm stoping width• Introduced night shift• Traditional management structure• Ball milling to increase capacity• 240 ktpm, 162 kozpa
Reef DriveDiagonalMuck BayDip PillarTwin Reef RaiseMiningDirectionMined Out AreaUnmined Area200 m210m70mReef DriveDowndip Twin Raise Reef Drive layout
Reef DriveDiagonalMuck BayStrike PillarDip PillarSingle Reef RaiseMiningDirectionMined Out AreaUnmined AreaEnlargement210 m210m200 m6m3m80°2m70m4mSee Enlargement30 mReef DriveDowndip Single Raise Reef Drive layout
Footwall DriveMiningDirectionMiningDirectionASG105 mPILLARSMined Out AreaUnmined AreaSee Enlargement200 m210 m10 mEnlargement8 m4 mFootwall DriveBreast Footwall layout30 mMuck Bay4 mCross CutTravelling Way & SO
Breast Footwall layout
Current mine design
Current mine design – North shaft
Production sources(000’s tons per month)Production area20052006SteadystateNorth Shaft80100120South Shaft6081120Hill3538-Mid Shaft1014-Low grade dev.25--TOTAL21023324029
Production
Conversion to footwall strikedevelopment & breast stopingDevelopment required to generate ore reservesBreast miningFootwall drivesm²/metreRequired toreplace 50 000m²Dip miningTwin raise & reefdrivesm²/metreRequired toreplace 50 000m²m²/ Total Dev53935172 874m²/ Prim.- R/W, TW,BH & Diag108463222 272m²/ Prim.- Large Ends10647283602• 60% of stoping on breast by end 2006, 95% by end 2007• 100% reef drives in footwall by end 200831
Total primary development metres / month(Excludes # Sinking)3,5003,0002,500Metres2,0001,5001,0005000'03 '04 H1 05History 3,184 2,002 2,108• 2003 to 2004 reduction due to single raise dip mining• At steady state breast requires less development thandip to generate the same ore reserves
Immediately Available Reserves (Raises Holed)20181617.317.81814months121012.1867.742020042005 *2006 2007 2008* Revised dip method increased rate of ore reserve build up• Includes depletion of Hill and mid shaft areas• Transition to 100% underground production
Face length build-upMetres10,0009,0008,0007,0006,0005,0004,0003,0002,0001,0000'Jun '07'Sep '06'Mar '06Aug '05Immediately available (Holed)Available for equipping (Holed + Ledged)Immediately stopable (Holed + Led. + Equip.)Resourced ( Stoping)• Planned ratio – stopable: stoping 1,5:1 by end 2006
Monthly area mined (m 2 )40,00035,00030,00025,000m²20,00015,00010,0005,0000'03 '04 H1 05History 22,195 34,842 37,486• Planned steady state – 100% underground at 50 000m 2 / month
Stoping width115110105cm10095908580'03 '04 H1 05History 113 103 105• Steady state mine average planned at 102 cm by end 2006
Average Tons Milled per month250,000200,000Tons m ille d150,000100,00050,000-2002 2003 2004 H1 05Other Sources 75,545 44,323 22,886 38,124HG UG2 119,455 157,427 174,114 181,543
Grade5.004.00g/t 4E3.002.001.000.002002 2003 2004 H1 05Built Up Grade 2.52 3.23 4.09 4.13• Includes low grade ‘other’ sources – depleted by end 2005• Current underground average grade 4,45 g/t
Plant 4E Recovery90.00%% Recovery 4E85.00%80.00%75.00%70.00%2002 2003 2004 H1 054E Recovery 80.50% 83.60% 84.00% 84.09%● Steady state planned recovery 86%● Achieved 240 ktpm in May 2005● Expert systems in place – circuit optimisation ongoing
Equivalent refined Pt Oz / month11.0010.5010.00Pt Oz's (000's)9.509.008.508.007.507.006.506.00'03 '04 H1 05History 7.67 9.52 10.69
Operating costs
Cash cost / ton milledCash cost / Ton milledR / Ton Milled4003503002502001501005002002 2003 2004 H1 05Cash cost / ton milled 185 303 363 355
Cash cost / equivalent refined Pt ozCash cost / Equivalent Pt oz refinedR / Pt oz9,0008,0007,0006,0005,0004,0003,0002,0001,00002002 2003 2004 H1 05Cash cost / Pt oz 6,598 8,057 7,515 7,283• Lower platinum content of Modikwa ore results in higher unitcost per Pt oz, comparable cost per PGM oz
Operating costs● Current cash costs per ton milled and Pt oz high asbuild up continues.● Drivers of cost reduction● Volume increase● 4 mining areas to 2● 1,5m of equipped face per m face blasted● Novice workforce moving up learning curve● Less development required● Cost reduction initiatives
Capital expenditure
Capital expenditure (R000’s)1,200,000Total Modikwa1,000,000800,000600,000400,000200,000-2002 2003 2004 H1 05Total Modikw a 1,077,952 438,241 147,212 111,628• Approximately R 160 m to be spent on average on LOM ongoing / replacement capital• Approximately R 100 m additional to be spent per year during decline deepening
Capital expenditureMain Items for 2005●Burgersfort Housing Project R 125 million●Flag Boshielo Damwall R 19 million●Ore reserve development R60 million - andcommencement of North Shaft deepening by 1 level●Off mine capex largely complete
Human resources
Employee relations● Community and employee expectations high● Non-procedural workplace disruptions – higher thannormal● Significant management effort and focus to educateand mentor workforce and improve relationships● Mining Charter Compliance Strategy in place.
Human resources development• Underground and surface training centres.• Increased training of supervisors.• Fall Of Ground competency compliant by Dec2005.
Key business issues• Improved safety performance• Achieve planned volume increase• Smooth transition from down dip to breast stoping and movingdrives into footwall• Further improve efficiency of the mechanised development andtramming• Improve efficiencies of stoping teams• Major transition commenced, complete in 2006
Facility visit11 October 2005


![[PDF] Mogalakwena Mine - Anglo Platinum](https://img.yumpu.com/43065142/1/184x260/pdf-mogalakwena-mine-anglo-platinum.jpg?quality=85)