THE EFFECT OF DIFFERENT COOLING TECHNIQUES ON THE ...
THE EFFECT OF DIFFERENT COOLING TECHNIQUES ON THE ...
THE EFFECT OF DIFFERENT COOLING TECHNIQUES ON THE ...

You also want an ePaper? Increase the reach of your titles
YUMPU automatically turns print PDFs into web optimized ePapers that Google loves.
P.O. Box 1390, Skulagata 4120 Reykjavik, Iceland Final Project 2010<strong>THE</strong> <strong>EFFECT</strong> <strong>OF</strong> <strong>DIFFERENT</strong> <strong>COOLING</strong> <strong>TECHNIQUES</strong> <strong>ON</strong> <strong>THE</strong>MICROBIAL QUALITY AND SENSORY SHELF LIFE <strong>OF</strong> ICELANDICGOLDEN REDFISH (Sebastes marinus) FILLETSNathan M. SemwangaMakerere UniversityP.O. Box 7062 Kampala UgandaEmail: nsemwanga18@yahoo.comSupervisors:Hélène L. Lauzonhelene.l.lauzon@matis.isBjörn Margeirssonbjorn.margeirsson@matis.isSigurjón Arasonsigurjon.arason@matis.isABSTRACTInnovations in the application of different fish cooling techniques have been developed in order to delayspoilage, thus extending shelf life. In the study, effects of different in-process cooling techniques on microbial,chemical and sensory properties of redfish fillets during storage and distribution simulations were evaluatedusing five treatments. Cooling techniques included the use of slurry ice as a fillet cooling medium (SIC) and/orCombined Blast and Contact (CBC) technique to superchill the fillets. Storage temperature was monitored usingI-button loggers. Growth of specific spoilage organisms (SSO), total viable psychrotrophic counts (TVC) andproduction of microbial metabolites were determined by conventional and molecular microbial and chemical(TVB-N, TMA, pH, salt content) methods. The study showed that superchilling by CBC for skin-on filletsefficiently reached a product temperature of -1°C but resulted in a reduced shelf life of 8-9 days and 10 days forCBC and SIC-CBC treatments, respectively, due to their poorer microbial quality. Skipping the slurry icecooling step prior to CBC treatment proved undesirable to this fatty product as the sensory results suggested thatother deteriorative changes, in addition to microbial changes, contributed to faster quality loss. A shelf life of 11-12 days was obtained for the skinless fillets that were not CBC treated. SIC treatment did not provide sufficientcooling to achieve a measurable freshness and shelf life extension compared to untreated fillets. H 2 S-producingbacteria were the dominant SSO and were more resistant to superchilling than Photobacterium phosphoreumand pseudomonads. The level of TVB-N in differently treated redfish fillets reached 12-15 mgN/100 g at the endof shelf life, being lower than the EC limit of 25 mgN/100 g. Indeed, low SSO counts (
SemwangaTABLE <strong>OF</strong> C<strong>ON</strong>TENTS1. INTRODUCTI<strong>ON</strong>......................................................................................................................... 41.1 Background ............................................................................................................................. 41.2 Rationale of the study ............................................................................................................ 52 STATE <strong>OF</strong> ART............................................................................................................................. 72.1 Fish spoilage ............................................................................................................................ 72.2 Shelf life of fresh fish .............................................................................................................. 82.3 On board cooling .................................................................................................................... 92.4 In-process cooling ................................................................................................................. 113 MATERIALS AND METHODS ................................................................................................ 123.1 Experimental design and raw material .............................................................................. 123.2 Sensory evaluation................................................................................................................ 123.3 Microbial examination ......................................................................................................... 133.4 Chemical analyses ................................................................................................................ 133.5 Data analysis ......................................................................................................................... 144 RESULTS ..................................................................................................................................... 154.1 Temperature monitoring...................................................................................................... 154.2 Shelf life of redfish fillets ..................................................................................................... 174.3 Microbial analyses ................................................................................................................ 204.3.1 Total viable counts (TVC) ................................................................................. 204.3.2 H 2 S-producing bacteria ...................................................................................... 204.3.3 Pseudomonads.................................................................................................... 204.3.4 Photobacterium phosphoreum ........................................................................... 214.4 Total Volatile Basic Nitrogen (TVB-N) and Trimethylamine (TMA) .............................. 224.5 pH and salt content .............................................................................................................. 234.6 Overall analysis of microbial and chemical data ............................................................... 235 DISCUSSI<strong>ON</strong> .............................................................................................................................. 256 C<strong>ON</strong>CLUSI<strong>ON</strong> ........................................................................................................................... 28ACKNOWLEDGEMENTS ............................................................................................................... 29REFERENCES .................................................................................................................................... 30APPENDIX 1 – Torry scheme and QDA attributes ......................................................................... 35APPENDIX 2 – Mean data with statistical analysis ........................................................................ 37UNU-Fisheries Training Programme2
SemwangaLIST <strong>OF</strong> FIGURESFigure 1: Temperature fluctuation in the fillets for treatments (NC, SIC, SIC-CBC, CBC, SF-SIC) at different positions in EPS boxes over storage time. Data shown is a mean value oftwo temperature data loggers positioned in two EPS boxes. ................................................... 16Figure 2: Torry freshness score for differently treated redfish fillets as a function of storagetime. ......................................................................................................................................... 17Figure 3: Mean QDA score of sour odour (a), table cloth odour (b), TMA odour (c), sourflavour (d), TMA flavour (e) and off-flavour (f) for the differently treated redfish fillets (n=7-11 panellists receiving duplicate samples). .............................................................................. 18Figure 4: Principle component analysis (PCA) describing sensory quality, odour (o-),appearance (a-), flavour (f-) and texture (t-) of the sample treatments (NC, SIC, SIC-CBC,CBC) with storage time (d1 to d13). PC1 vs PC2 (X-expl.: 86% and 5%). Bi-plot of scores(samples, above) and loadings (sensory attributes, below)...................................................... 19Figure 5: Growth of total culturable psychrotrophic microbiota (TVC, a), H 2 S-producingbacteria (b), pseudomonads (c) and P. phosphoreum (d) in differently treated redfish fillets. 21Figure 6: Trimethylamine (a) and Total Volatile Basic Nitrogen (b) as a function of storagetime for differently treated redfish fillets. ................................................................................ 22Figure 7: Variations in pH (a) and salt content (b) for differently treated redfish fillets. ........ 23Figure 8: Principle component analysis (PCA) relating microbial and chemical data of thesample treatments (NC, SIC, SIC-CBC, CBC, SF-SIC) with storage time (d1 to d13). PC1 vsPC2 (X-expl: 71% and 22%). Bi-plot of scores (samples in blue) and loadings (chemical andmicrobial parameters in red). ................................................................................................... 24LIST <strong>OF</strong> TABLESTable 1: Variations in pH with odour threshold (Castell and Triggs, 1955) .............................. 8Table 2: The influence of packaging condition and habitat on the dominance of specificspoilage bacteria in chilled (
Semwanga1. INTRODUCTI<strong>ON</strong>1.1 BackgroundThe golden redfish (Sebastes marinus) is one of the most commercially important fish inIceland’s fisheries. It is a slow growing species that attains an average total length of 35-40cm though centennial individuals grow up to 100 cm and 15 kg in weight (Jonsson andPalsson, 2006). Redfish is a typical zooplanktivore that mainly feeds on Calanushyperboreus, euphausiids, capelin (Mallotus villosus) and herring (Clupea harengus)(Jaworski and Ragnarsson, 2006). Redfish is found all around Iceland in the mid watercolumn but the main fishing grounds are at the edge of the continental shelf at 200 to 400 mdepth south and west of Iceland.Fishing of redfish takes place all year round with peaks of catches in the late winter. Bottomtrawling is the exclusive method used in this fishery (Jonsson and Palsson, 2006). Initially thegolden redfish had no commercial value for Iceland and was always discarded in the codcatches but with time fish meal and oil production developed and finally redfish gainedrecognition as a good food fish. About 50% of the redfish catch is now processed and frozenat sea and the rest is iced and exported fresh in containers or by air. The main market forIcelandic redfish is Germany although a considerable percentage is also exported to otherwestern European countries. The market for redfish in eastern Asia is expanding and Japan isnow the second largest importer of the golden redfish (Jonsson and Palsson, 2006).In Uganda, Nile perch (Lates niloticus) dominates the international export market in the formof skinless fresh and frozen fillets. Both Nile perch and golden redfish are fatty fish species,0.6-1.8% lipids for Nile perch (Okeyo et al., 2009; E-Covima, 2007) and 1.4-6.8% lipids forredfish (Matis, ISGEM, retrieved 18.02.2011) and contain trimethylamine oxide (TMAO).Reported TMAO levels are 155-201 mgN/100 g for Nile perch (Anthoni et al., 1990) and 60-120 mgN/100g for redfish flesh (Mausse, 2000; Etienne, 2005). Despite the biochemicalsimilarities between the two species, taxonomically they are different. Nile perch is afreshwater fish belonging to the family Latidae while golden redfish is a marine fish in thefamily Sebastidae (Fish base, retrieved 01.03.2011). Ocean perch is a synonymous name forgolden redfish that is used for commercial purposes to market the redfish products. Theredfish is normally sold either with skin-on or as skinless fillets (HB Grandi, retrieved18.02.2011) but a longer shelf life is envisaged when the skin and fat layer underneath areremoved.The dominant fishing methods in Uganda for commercial Nile perch fish are gill netting andlong line. Lack of fish bleeding in Uganda makes it hard to control the initial quality of fishflown into the European market despite the use of flake ice in plastic chests after hauling thecatch and during transport. “The physical damage and stress during capture, the structure andcomposition of fish and storage temperature greatly influence the spoilage of fish” (Church,1998). Immediate cooling of fish catches and maintenance of low temperature is a commonprerequisite throughout the distribution chain for good quality fish destined for humanconsumption. This implies that the cooling technique has to be efficient to effectively slowdown deteriorative changes in fish.Innovations in the application of different ice forms to cool down fish have been developedand new techniques are emerging, either intended for on board or in-process cooling. Forinstance, the use of liquid ice prepared from brine has been documented to cause a rapidinitial cooling of fish, but use of brine may create a favourable condition for growth of theUNU-Fisheries Training Programme4
Semwangaactive spoiler Photobacterium phosphoreum which becomes dominant under extendedstorage of cold water marine fish species (Reynisson et al., 2010). Therefore, an evaluation ofthe various new cooling techniques to effectively reduce the effects of spoilage on fishproducts, hence extending shelf life, is needed as this influences their acceptance on themarket.1.2 Rationale of the studyRedfish fillets are currently being exported from Iceland by sea freight to European marketsin expanded polystyrene (EPS) boxes that have drainage holes at the bottom and a layer ofconventional ice on top of the fillets. Export by air freight is conducted in closed EPS boxes,generally with cooling mats placed on top of the fillets. Sea freight is more economical andenvironmentally friendly than air freight, but due to the time factor involved in delivery ofproducts, new methods are being sought to ensure high quality products at delivery.Skinned redfish fillets are commonly pre-cooled in a slurry ice medium prior to packaging tolower their temperature. Brine absorption by fillets may stimulate microbial growth andcatalyse oxidative reactions, hence leading to a lower quality product. An alternative methodto effectively cool down the product before packaging and ensure a shelf life extension istherefore needed. Combined Blast and Contact (CBC) cooling, a cooling technologydeveloped by Skaginn hf (Iceland), rapidly cools down fillet temperature to a desiredsuperchilled condition. It currently uses a liquid pre-cooling step based on a salt-containingmedium. However, the need for such liquid cooling prior to the CBC treatment should beinvestigated as avoiding salt uptake in redfish fillets could be favourable. Further, the use ofsea freight boxes with drainage holes could be replaced by totally closed, well-insulated EPSboxes to maintain as low and steady product temperature as possible during distribution.The innovations in the form of ice used for cooling fish largely determine the efficiency ofthe cooling techniques. The rate of heat transfer (cooling rate) from fish to ice depends on theinitial temperature of the fish, size of individual fish, percentage of fat and the amount orform of ice (flake, plate, block or flow/slurry ice) used. The application or testing of suchinnovative ice media to maintain fish freshness and extend their shelf life has not yet beenapproached in Uganda. Better knowledge on the effects of such novel cooling techniques onthe quality of fatty fish is of great interest. The study therefore aimed at evaluating the effectsof different in-process cooling techniques on the microbiological, chemical and sensoryproperties of redfish fillets during storage and distribution. The cooling techniques impliedthe use of slurry ice as a fillet pre-cooling medium and/or CBC technique to superchill thefillets before packaging.To achieve this aim, five groups were investigated; (1) skinned fillets that were not cooledwith slurry ice before packaging, stored in closed EPS boxes with a cooling mat, (2) skinnedfillets pre-cooled in slurry ice before packaging, stored in closed EPS boxes with a coolingmat, (3 and 4) CBC-treated skin-on fillets with and without a slurry ice pre-cooling step,stored in closed EPS boxes with a cooling mat, (5) skinned fillets, pre-cooled in slurry icebefore packaging, stored with a top ice layer in sea freight EPS boxes with drainage holes atthe bottom. Group 1 is considered untreated (control), while group 5 represents the currentpractice of HB Grandi for redfish export by surface.UNU-Fisheries Training Programme5
SemwangaSpecific objectives were set to evaluate the efficacy of the different cooling methods;1. To evaluate the effect of different cooling treatments on the microbial development inredfish fillets compared to fillets in the control treatment. Enumeration of total culturablepsychrotrophic microbiota (total viable counts, TVC) as well as pseudomonads, hydrogensulphide (H 2 S) producing bacteria and Photobacterium phosphoreum was carried out.2. To investigate the effect of the different cooling treatments, storage time and storagetemperature on the sensory properties and the formation of microbial metabolites (totalvolatile basic nitrogen, TVB-N and trimethylamine, TMA, both influencing pH development)in redfish fillets compared to the control treatment.3. To establish the predominant spoilage bacteria and shelf life of redfish fillets among thedifferent cooling treatments.UNU-Fisheries Training Programme6
Semwanga2STATE <strong>OF</strong> ART2.1 Fish spoilageSpoilage of fresh fish is typically initiated by microbial activities (Gram and Huss, 1996)whereas fatty fish spoilage is also characterised by oxidative rancidity of the lipids.Interestingly, it has been shown that blood, more precisely haemoglobin, can induceoxidation (Wang et al., 2010). Therefore proper bleeding of fatty fish should be emphasisedas one of the prerequisite handling procedures because this not only influences the shelf lifeof fresh fish products but also greatly affects the texture of the fish (Pacific SardineAssociation, 2001).Quality deterioration of fresh fish can be characterised using a sensory scheme. Initially,newly caught fish loses its fresh fish flavour after a few days of chilled storage (Dalgaard,2006; Gram and Huss, 1996). The fresh, sweet flavour is attributed to inosine monophosphate(IMP), an ATP degradation product caused by enzymatic autolysis (Huss, 1995). After aperiod when fish is described as neutral, off-flavours and off-odours are detected. Indeed,further degradation of ATP products results in the loss of freshness characteristics andformation of hypoxanthine (Hx), the cause of bitter off-flavours (Huss, 1995). Ammonia-like,sulphurous and rancid odours become more intense with time and lead to rejection of the fish(Gram and Huss, 1996). It is noteworthy that the rate of formation of hypoxanthine in icedfish differs according to species, being more rapid in redfish than cod (Huss, 1995). Thissuggests that it may prove more difficult to extend the freshness period of redfish than cod.The time to spoilage has been linked to storage temperature that influences the microbiotagrowth. Therefore, understanding the spoilage process of fish by specific spoilage organisms(SSO) facilitates the development of methods to determine, predict and extend product shelflife (Dalgaard, 2006; Gram and Huss, 1996). It also allows for the development of propercooling methods to delay spoilage caused by SSO, like H 2 S-producing bacteria, P.phosphoreum and pseudomonads under aerobic storage (Olafsdottir et al., 2006).High water temperature generally corresponds to high concentration of micro-organisms onfish but water salinity has little effect on the total concentration though it influences thecomposition of microbial species on fish. The catching methods have an effect too, forexample trawled finfish may have higher concentration of micro-organisms than similarfishes caught by long line (Dalgaard, 2006). Heat labile and sodium-requiring microorganismsare common in sea and brackish waters as well as seafoods. Thus, isolation ofmicro-organisms with these characteristics should be performed by spread plating but notpour plating with hot agar. For various fresh and lightly preserved seafoods, Dalgaard (2006)therefore recommended the use of cooled diluent and spread plating on pre-chilled plates ofLong and Hammer’s agar.P. phosphoreum is a bioluminescent bacterium responsible for spoilage of different marinefish, and due to its ability to produce biogenic amines, it may have a potential to causehistamine fish poisoning (Dalgaard, 2006). P. phosphoreum is a psychrotolerant bacteriumgrowing at 0 o C and typically inactivated above 25-30 o C. This bacterium dominates in theintestinal content of aquatic animals in cold seawater between 0 and 15 o C. Luminous variantsof P. phosphoreum can grow to high concentrations during normal chilled storage of fish(Dalgaard, 2006). Many marine finfish contain TMAO that stimulates microbial growth.Aeromonas, Alteromonas, most Enterobacteriaceae, Shewanella and all marine luminousbacteria, particularly P. phosphoreum, reduce TMAO to TMA under anaerobic conditions.“TMA contributes to the typical ammonia-like and fishy off-odours and off-flavours inUNU-Fisheries Training Programme7
Semwangaspoiled seafoods, particularly in products with pH above 6.5” (Dalgaard, 2006). Indeed,Castell and Triggs (1995) demonstrated the variability of the odour threshold of TMAaccording to pH, as indicated by Table 1. It is also reported that both Shewanella putrefaciensand P. phosphoreum can reduce TMAO to TMA in marine fish (van Spreekens 1974; Huss,1995; Gram and Huss, 1996). Pseudomonas species are not able to reduce TMAO and theirgrowth is considerably reduced under oxygen limited conditions. Table 2 lists reported SSOas influenced by the fishing areas and atmospheric storage conditions.Table 1: Variations in pH with odour threshold (Castell and Triggs, 1955)pHOdour of 20 ppm TMA solution< 6.7 no odour6.7 - 7.4 "fishy" odour> 7.4 ammonia-like odourTable 2: The influence of packaging condition and habitat on the dominance of specificspoilage bacteria in chilled (
Semwangacompounds and abundance of nutrients which favour faster microbial growth (Huss, 1995).Storage at superchilled temperature may increase shelf life of food due to slower bacterialgrowth (Kaale et al., 2010) but the temperature has to be well controlled. Below -2°C, threequarters of the water in fish is frozen, slowly causing critical damage to fish tissue structureby large ice crystals formed which enhance enzymatic spoilage (Graham et al., 1992; Galart-Jornet et al., 2007).The colour and odour of raw fish flesh are important indices for consumers to evaluate thefreshness and quality of fish (Sohn et al., 2007), hence these attributes are “shelf lifepredictors” used by consumers. Shelf life of fish and fishery products is a key factor in thefish industry because it allows processors to plan how to process and transport products todifferent markets (Huynh et al., 2007). Handling practices, processing contamination andstorage conditions affect the shelf life of fish and fishery products (Doyle, 1995; Huss, 1995).Further, temperature fluctuation is a key factor that greatly affects quality and shelf life offish products during processing, transportation and storage in retail shops (Huynh et al.,2007). Different cooling techniques and packaging methods have been developed tocounteract temperature fluctuations. Some of these cooling techniques have beendemonstrated to extend shelf life, for example superchilling in brine at 0 to -4 o C and use ofslurry ice or liquid ice among others. These cooling techniques basically lower producttemperature before packaging, hence retarding the growth of spoilage bacteria and extendingshelf life (Huss, 1995). Undesirable effects of superchilling could be the slow formation ofice crystals and increased enzyme activity at temperatures between -1 to -6 o C (Robinson,1985). The achievable extension of shelf life depends on fish species and condition, fat/watercontent, initial microbial population, atmospheric condition and storage temperature (Huss,1995). Therefore, the cooling technique to be used will always depend on fish species andcharacteristics of the product, storage conditions and means of transport from producers tomarkets.2.3 On board coolingTemperature of newly caught fish is generally representative of the water temperature wherefishing took place. Temperature may vary due to seasons and fishing areas. For instance,close to Iceland seawater temperature in the south ranges from 2 - 6°C in winter and 8 - 12°Cin summer, while lower temperatures are seen in the north, 1 - 4°C in winter and 6 - 8°C insummer months (Matis, retrieved 18.02.2011). This implies that different cooling methodsand amounts of ice are needed to suit the cooling requirements.Flake ice is conventionally used in the fish industry due to its flat shape that gives a largecontact surface and a more rapid heat transfer from fish than block and tube ice forms. It isalso more easily stored, handled, transported and does moderate physical damage to the fish.However, flake ice has a higher melting rate and requires more storage space than block ice.The air pockets created between flake ice and the top of the fish reduces the flow of heat fromfish to ice (Graham et al., 1992).Slurry ice is a mixture of ice particles, water and salt (1.0-2.5% NaCl) which decreases thefish’s freezing point and achieves a subzero temperature. However, cooling in slurry iceshould not trigger freezing of fish products (Pineiro et al., 2004). The fluid nature of slurryice makes it easily manageable by both pipes and pumps. Slurry ice with a high degree offluidity has a faster cooling capacity than flake ice and its flexibility offers great efficiency.Slurry ice systems have been installed on board fishing vessels and have demonstratedadvantages for on board storage of fish, thus gaining popularity. Use of slurry ice reduces theUNU-Fisheries Training Programme9
Semwangaphysical damage to fish and its products due to its microscopic particles compared to thesharp edges of flake ice particles (Pineiro et al., 2004). Slurry ice melts faster than flake icebut has a higher contact surface area to fish than flake ice, thus covers fish completely duringapplication. However, the initial investment cost is high for use of slurry ice and the qualitybenefits are species dependent (Pineiro et al., 2004). Due to the presence of salt in slurry ice,fish may have a shorter shelf life since salt uptake apparently enhances growth of specificspoilage organisms (Reynisson et al., 2010; Cakli et al., 2006). This is most likely true formarine TMAO-containing fish species from cold and temperate waters as the presence of theactive TMA spoiler P. phosphoreum can be expected. The formation of volatile compounds,like TVB-N and TMA, was reported to be higher in haddock after storage in slurry ice thanflake ice. Further the predominant spoilage microbiota in haddock stored in slurry ice or flakeice differed (Reynisson et al., 2010). In contrast, other reports have indicated the advantageof slurry ice to extend the shelf life of other fish species. Kilinc et al. (2007) reported twodays extension of shelf life for a 2 hour pre-treatment of sea bream and sea bass with slurryice while Rodriguez et al. (2004) reported seven days of shelf life extension for Europeanhake stored in slurry ice. Although much is documented on the use of slurry ice on wholefish, comparatively little is documented regarding its usage on fish fillets, more preciselyredfish fillets.UNU-Fisheries Training Programme10
Semwanga2.4 In-process coolingCombined Blast and Contact (CBC) cooling, the new cooling technology developed bySkaginn hf (Iceland) for fish processing, involves superchilling the skin side of the skin-onfillets through a freezing tunnel on a Teflon-coated aluminium conveyor belt at a temperatureof about -8oC and simultaneously blasting air over the fillets. Using this technology, rapidlowering of fillet temperature down to between -0.5 to -1oC is achieved before packaging.During this process, 10-15% of the water in lean fish muscle is frozen (Rha, 1975) whenpackaged, thus extra energy is needed to melt this partly frozen water in the CBC–treatedproduct. Pre-cooling has been found to be important for products subjected to thermal loadsduring transportation and storage (Magnusson et al., 2009; Gao, 2007). Before CBC cooling,the fillets go through liquid cooling (about 1.0-2.5% salt in solution or slurry ice) allowing aslight salt uptake in the fillets to avoid freezing of the flesh in the tunnel. Automated skinningof CBC fillets is easily performed, generally leading to higher product yields than inconventional fillets (Arnthórsdóttir et al., 2008). CBC-treated cod fillets have shown a slowerquality deterioration rate at early storage compared to traditionally processed fish, henceextending the freshness period and shelf life (Olafsdottir et al., 2006). This has beenattributed to the cold shock experienced by specific spoilage organisms (SSO) during earlystorage, slowing down their development in well-controlled thermal conditions. The briningstep has been identified as a critical point, contaminating the fillets with bacteriaaccumulating from the skin-on fillets when the brine medium is not renewed or the filletsproperly rinsed before their introduction to the brine bath. In addition the salt and wateruptake of fish muscle from a microbially contaminated cooling medium contributes to therapid growth of fish spoilage bacteria in a conducive environment such as a poorly controlledchill chain. Thus the salt concentration in the cooling medium should be in strict quantitiesbecause the salt uptake by fish muscle depends on the concentration and the cooling time inthis medium. Salt plays the role of lowering the initial freezing point of the fish muscle. Thealternative to this would be to skip the pre-cooling of fillets in the salted medium prior to awell-controlled CBC cooling. Owing to this, there is a need to study further other associatedquality defects of fish fillets produced by this technique.UNU-Fisheries Training Programme11
Semwanga3MATERIALS AND METHODS3.1 Experimental design and raw materialRedfish used for this study was obtained from HB Grandi fishing company in Reykjavik(Iceland) in December 2010. The fish was obtained from the deep sea zone of the AtlanticOcean by trawling and kept on ice in insulated tubs for three days on board the fishing vesselbefore delivery to the processing plant for filleting and packaging under five differenttreatments. In total 38 EPS boxes with an average weight of 3 kg of fillets were used and thebox size was 35.6 x 21.6 x 6.5 cm.The five treatments of the experiment were;‣ NC, no cooling of fillets during processing. Skinned fillets packed at HB Grandi 1 witha cooling mat in EPS boxes. Fillets considered as untreated (control).‣ SIC, slurry ice cooling of skinned fillets performed at HB Grandi followed bypackaging with a cooling mat.‣ CBC, CBC treated skin-on fillets superchilled in a CBC cooler at Eskja 2 and packedwith a cooling mat.‣ SIC-CBC, slurry ice cooled for 10 min and CBC treated skin-on fillets at Eskjafollowed by packaging with a cooling mat.‣ SF-SIC, sea freight boxes used for slurry ice cooled skinned fillets at HB Grandi witha crushed plate ice layer at the top of the fillets. SF EPS boxes have holes at their baseto drain off water.The CBC cooling technique was performed at Eskja ehf (Hafnarfjorður, Iceland), a companythat owns a CBC cooler. Calibrated temperature loggers were inserted in two EPS boxes foreach treatment before storage, three positioned inside to monitor fish temperature at bottomcorner, middle/center layer and top center of the box, and one positioned externally on thebox. All boxes were stored in a chamber at Matis 3 for almost 6 days at -1 o C followed bystorage at 2 o C for 7 days, simulating sea freight export and storage at wholesaler/retailer.Three fillets (pooled as one sample) from each box were used for microbiological andmicrobial metabolites analyses, and 11 fillets for sensory evaluation. These fillets were takenbelow the top layer of fillets. Sampling was carried out on days 1, 6, 10 and 13 of storage,analysing duplicate samples (two boxes per treatment). The mean weight of skin-on andskinned fillets was 149.3 ±18.7 g and 101.4 ± 4.9 g, respectively.3.2 Sensory evaluationFour groups of redfish fillets were examined by sensory evaluation (NC, SIC, SIC-CBC andCBC). Group SF-SIC was not evaluated to minimise costs since a maximum of 4 samples persession can be assessed. The aim was to study the effect of the cooling treatments on theredfish quality deterioration and shelf life according to sensory evaluation by a team oftrained panellists.Quantitative Descriptive Analysis (QDA) by Stone and Sidel (2004) and Torry freshnessscore sheet (Shewan et al., 1953) were used to assess cooked samples. A group of 7 to 111 Fishing company in Iceland2 Fishing company in Iceland3 Food research institute in IcelandUNU-Fisheries Training Programme12
Semwangaboric acid solution, then titrated with sulphuric acid. TMA in TCA extract was measured byadding 20 ml of 35% formaldehyde before distillation. TMA was collected in boric acidsolution that was titrated with sulphuric acid solution.The pH was determined in about 5 g of the mince which was mixed with 5 ml of deionisedwater using the Radiometer PHM 80. The pH meter was calibrated using the buffer solutionsof pH 7.00 ± 0.01 and 4.01 ± 0.01 (25 o C Radiometer Analytical A/S, Bagsvaerd, Denmark).The salt content was measured with the Volhard Titrino method according to AOAC ed. 19from 2000 (no.976.18).3.5 Data analysisGraphical presentation and calculation of means and standard deviations were done usingMicrosoft Excel 2010. Statistical analysis of data was done using NCSS 2000 (Utah, USA) tocarry out an analysis of variance, ANOVA for sensory data and one-way ANOVA for otherdata. Comparison of data with respect to treatments was done using the Duncan’s multiplecomparison test. The threshold level for significance was 0.05. A Pearson correlation matrixwas also obtained to evaluate the relationship between the parameters evaluated, specificallycomparing Torry score to chemical and microbial data. Multivariate analysis was conductedin the statistical program Unscrambler (Version 9.7, CAMO software AS, Oslo, Norway) withprincipal component analysis (PCA), assessing on one hand QDA data determined from 30attributes in 4 sample groups and on the other hand comparing chemical and microbial dataobtained for 5 sample groups. Full cross validation was used. The chemical and microbialdata was standardised with 1/SD.UNU-Fisheries Training Programme14
Semwanga4RESULTSThe study aimed at evaluating the effects of different in-process cooling techniques on themicrobial, chemical and sensory properties of redfish fillets during storage and distributionby simulation trials. The cooling techniques included the use of slurry ice as a fillet precoolingmedium and/or CBC technique to superchill the fillets before packaging.4.1 Temperature monitoringInitial mean product temperature of untreated (NC) and SIC fillets was 1 - 2°C (Figure 1) butslightly lower for SF-SIC (0 - 1°C). SIC-CBC and CBC-treated fillets had the lowest initialtemperature (-1°C). It took about 2 - 3 days for the NC and SIC fillets to approach the storagetemperature of -1°C as opposed to only 1 day for SF-SIC fillets stored in the boxes withdrainage holes. In all treatments, the bottom corner of the EPS boxes recorded the lowesttemperature for the first 6 days of storage, after which it slowly surpassed the temperature atother box positions in concordance with higher storage temperature (2°C). Fillet temperatureof 0°C was then rapidly reached in NC and SIC treatments (within 9 days), but more slowlyin the other treatments (around days 10-11). In fact, the temperature of fillets treated by theCBC technique was the most steady, maintaining -1°C for about 10-11 days. The temperatureof the SF-SIC fillets (especially at center and top center) positions was rather stable over thestorage period due to the presence of the ice layer.The mean ambient temperature of the storage chamber recorded by data loggers that werefixed on the external surface of two EPS boxes for each treatment is shown in Figure 1**.Similar fluctuations in temperature were observed for all the treatments. Large fluctuationsseen during early storage were due to the sensitivity of the cooling chamber after its opening.Any slight temperature increase triggered a strong cooling in the chamber.Table 3 compares the mean temperature of the fillets at different positions in the boxes,indicating the bottom corner as being the most sensitive area in an EPS box and responding toits ambient temperature. This is shown by the generally higher product temperature and/or thelargest standard deviation. Similar product temperature was observed for the center and topcenter positions. The lowest mean external temperature of the SIC-CBC treatment could beexplained by its lowest product temperature influencing the outer wall of the boxes whereloggers were fixed.UNU-Fisheries Training Programme15
Semwanga4.2 Shelf life of redfish filletsAssessment of quality deterioration of cooked redfish fillets was done by two methods, usingthe Torry freshness and QDA schemes. The skinned fish fillets that received no extra coolingduring process (NC) or were subjected to the slurry ice cooling (SIC) prior to packaging hada similar shelf life of 11-12 days, as determined by the Torry scheme (Figure 2). The shelf lifeof CBC and SIC-CBC fillets was 8-9 and 10 days, respectively. Despite this difference,significant difference between CBC treatments and NC or SIC treatment was only observedon day 13 (p
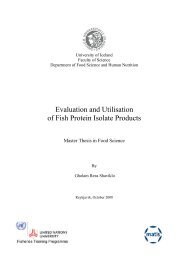
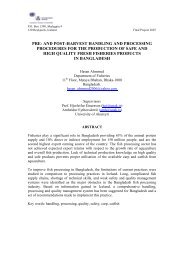
QDA Score:TMA flavourQDA Score: Off flavourQDA Score:TMA odourQDA Score: Sour flavourQDA Score: Spoilage sour odourQDA Score: Table cloth odourSemwanga10080aNCSIC10080b60SIC-CBCCBC604040202000 2 4 6 8 10 12Storage time (days )00 2 4 6 8 10 12Storage time (days)100c100d808060604040202000 2 4 6 8 10 1200 2 4 6 8 10 12Storage time (days)Storage time (days)100e100f808060604040202000 2 4 6 8 10 1200 2 4 6 8 10 12Storage time (days)Storage time (days)Figure 3: Mean QDA score of sour odour (a), table cloth odour (b), TMA odour (c), sourflavour (d), TMA flavour (e) and off-flavour (f) for the differently treated redfish fillets (n=7-11 panellists receiving duplicate samples).In order to analyse all sensory attributes with time a multivariate analysis by PCA was done(Figure 4). The two principal components (PC1 and PC2) explain 91% of the sensoryvariation with the main variation being due to the difference caused by the storage time in allthe treatments (PC1, 86%), going from right to left for fresh to spoiled fish based on theloadings (sensory attributes) shown. The position of sample CBC-d10 in the area of d13-samples indicates its faster deterioration compared to the other treatments. PC2 accounts forUNU-Fisheries Training Programme18
Semwanga5% of the sensory variation among the samples, with TMA and table cloth odours being themost influential variables in the downward direction and appearance characteristics (colour,heterogeneity and white precipitation) in the upward direction. It is therefore observed thatCBC samples developed a negative appearance with storage time, while spoilage odours weremostly apparent in SIC-CBC samples. Sensory attributes characteristic for redfish duringearly stages of storage like sweet, metallic and cod liver flavour, shellfish, vanilla/warm milk,cod liver and sweet odour are positioned on the right in the upper part of the figure. After astorage period of 6 days, these attributes became less intense. Towards the end of storage, agrouping of treatments is seen on the bi-plot, differentiating between SIC-CBC and othertreatments. The position of NC-d13 and SIC-d13 suggests a similar spoilage pattern, whilethat of CBC is positioned further upwards.Day 13D Day 10 1010100010Day 10Day 66Day666666Day 1DDdday10FreshnessattributesSpoilageattributesFigure 4: Principle component analysis (PCA) describing sensory quality, odour (o-),appearance (a-), flavour (f-) and texture (t-) of the sample treatments (NC, SIC, SIC-CBC,CBC) with storage time (d1 to d13). PC1 vs PC2 (X-expl.: 86% and 5%). Bi-plot of scores(samples, above) and loadings (sensory attributes, below).UNU-Fisheries Training Programme19
Semwanga4.3 Microbial analysesTo evaluate the effect of different cooling treatments on the microbial development with timein redfish fillets, enumeration of total culturable psychrotrophic microbiota (total viablecounts, TVC) as well as pseudomonads, hydrogen sulphide (H 2 S) producing bacteria andPhotobacterium phosphoreum was done.4.3.1 Total viable counts (TVC)The microbiological analysis conducted 1 day post-packaging indicated that skin-on fillets(SIC-CBC and CBC) had a slightly higher microbial load (about 0.5 log CFU/g) than skinlessfillets (NC, SIC, SF-SIC) (Figure 5a) (p>0.05). Microbial development progressed similarlyfor all groups but significantly higher counts were observed on skin-on fillets compared toskinless fillets on days 6 and 10 (p0.05). However untreated(NC) and SF-SIC fillets generally had the lowest counts compared to other treatments. After13 days of storage, slightly higher counts were obtained for both CBC treatments comparedto the 3 other ones, but the difference was insignificant (p>0.05). Correlation of Torry scoreto TVC gave an R value of -0.906.4.3.2 H 2 S-producing bacteriaThe slurry ice used to pre-cool the SIC-CBC treatment had a H 2 S-producing bacteria count oflog 4.0 CFU ml -1 . After day 1 of storage, the H 2 S-producing bacteria counts of the differenttreatments ranged from log 1.3 to 3.0 CFU/g, being significantly lower for NC skinless filletsthan skin-on CBC-treated groups (p
Log cfu /gLog cfu/gLog cfu/gLog cfu/gSemwanga4.3.4 Photobacterium phosphoreumThere was no P. phosphoreum to be detected in the slurry ice used to pre-cool the SIC-CBCtreatment. The number of P. phosphoreum increased in the fillets with storage time for all thecooling treatments (Figure 5d). SF-SIC treatment had similar low counts as the control (NC)on day 6. Significant difference among groups was first observed on day 10, with SIC filletshaving higher counts than their NC and SIC-CBC counterparts (p
TMA (mgN/100g)TVB-N ( mgN/100g )Semwanga4.4 Total Volatile Basic Nitrogen (TVB-N) and Trimethylamine (TMA)TVB-N content and formation of TMA in the flesh of the fillets was measured during storage.No significant change was observed in the TMA and TVB-N content for the first 10 days ofstorage in all treatments (Figures 6a and b), but a significant increase was noticed on day 13(p50%) over other basic compounds.161412108aNCSIC-CBCSICCBC24211815b642SF-SIC12900 2 4 6 8 10 12Storage time (days)60 2 4 6 8 10 12Storage time (days)Figure 6: Trimethylamine (a) and Total Volatile Basic Nitrogen (b) as a function of storagetime for differently treated redfish filletsThe values indicate mean of 2 samples obtained from two EPS boxes for each treatment.Table 4: P-ratio of TMA to TVB-N (mgN/100g) for the differently treated redfish fillets atdifferent storage timeTime (days) NC SIC SIC-CBC CBC SF-SIC1 0.109 0.101 0.079 0.0876 NA6 0.068 0.089 0.099 0.048 0.06910 0.211 0.156 0.089 0.165 0.09613 0.161 0.521 0.575 0.511 0.333UNU-Fisheries Training Programme22
pH (units)NaCl %Semwanga4.5 pH and salt contentVariation in pH with storage time for the differently treated redfish fillets is shown in Figure7a. Generally the pH in all treatments gradually decreased as the storage time increased untilday 10 when it increased in SIC, SIC-CBC and CBC treatments but did fall slightly for NCand SF-SIC. On the last sampling day, the pH value for SIC-CBC fillets was significantlyhigher than that obtained for NC, SIC and SF-SIC fillets (p
SemwangaFigure 8: Principle component analysis (PCA) relating microbial and chemical data of thesample treatments (NC, SIC, SIC-CBC, CBC, SF-SIC) with storage time (d1 to d13). PC1 vsPC2 (X-expl: 71% and 22%). Bi-plot of scores (samples in blue) and loadings (chemical andmicrobial parameters in red).UNU-Fisheries Training Programme24
Semwanga5DISCUSSI<strong>ON</strong>The study describes the microbial quality, chemical and sensory characteristics of redfishskinless or skin-on fillets processed three days post catch as influenced by different inprocesscooling techniques. It further shows the behaviour of specific spoilage organisms(SSO) during slow and fast superchilling of the skinless and skin-on fillets, respectively, overthe storage period simulating distribution and storage. The cooling techniques implied the useof slurry ice as a fillet pre-cooling medium and/or CBC technique to superchill the filletsbefore packaging. However, mechanical problems with the deskinning machine at the CBCprocessing site did not allow for production of superchilled skinless fillets as intended.Instead, two groups of superchilled skin-on fillets (CBC+/-SIC treatments) were compared toskinless fillets prepared as three groups; untreated (no in-process cooling) or cooled by slurryice and then stored in closed EPS boxes or sea freight boxes with drainage holes. Table 5summarises the main findings for the differently treated redfish fillets at their sensoryrejection point.Table 5: Microbial and chemical indicators of spoilage for differently treated redfish fillets atthe end of shelf life according to the Torry schemeTreatment NC SIC SIC-CBC CBCSensory shelf life 11-12 11-12 10 8-9(days)Product Temp (°C)* -0.4±0.7 -0.4±0.7 -1.1±0.3 -0.9±0.2TVC (log CFU/g) 6.4 6.9 7.8 6.3H 2 S-prod. bacteria 6.0 6.6 6.7 5.8Pseudomonads 5.4 5.1 5.2 4.9P. phosphoreum 4.9 >5.5 4.8 3.6TVB-N (mgN/100g) 12.3 14.7 14.2 13.5TMA (mgN/100g) 2.3 5.6 1.3 1.7P-ratio 0.187 0.381 0.091 0.126pH (units) 6.8 6.8 6.8 6.8*Mean product temperature of redfish fillets over the maximum shelf life period indicatedThe results indicate that H 2 S-producing bacteria were the most dominant spoilage organismsin all treatments. P. phosphoreum and H 2 S-producing bacteria counts were observed to behigher in slurry ice cooled fillets (SIC, SIC-CBC) than in NC and CBC treated fillets,respectively at the end of sensory shelf life. This further demonstrates the effect salt uptakehad on SSO growth. By lowering the muscle freezing point, salt uptake in SIC and SIC-CBCtreatments may have provided some protection for SSO in superchilled fillets and allowedthem to grow faster than at a similar temperature with a lower salt level as in NC and CBCproducts. Similar findings were reported by Reynisson et al., (2010) and Lauzon et al.,(2009). In addition to that, salt uptake may have shielded the SIC-CBC fillets fromdeteriorative changes caused by freezing damages to some extent, in comparison to CBCfillets as demonstrated by the shorter shelf life of CBC fillets. H 2 S-producing bacteria wereobserved to be more tolerant to superchilling conditions than P. phosphoreum. This agreeswith what Olafsdottir et al., (2006) reported during aerobic storage of cod fillets.Pseudomonads were apparently the least affected by the treatments applied among the SSOevaluated.UNU-Fisheries Training Programme25
SemwangaOverall, SIC-CBC and CBC treatments maintained the lowest fillet temperature over thestorage period, followed by NC and SIC (Table 5). Despite the lowest product temperaturemaintained, shelf life extension was not observed in the SIC-CBC and CBC-treated filletscompared to NC and SIC treated fillets. Higher SSO counts, especially H 2 S-producingbacteria for the skin-on CBC-treated fillets may have caused the faster deterioration rateobserved, as demonstrated by the more rapid formation of bacterial metabolites (TVB-N andTMA) and a poorer sensory quality. It is therefore recommended to remove the skin toenhance the quality of the product or at least package the fillets in EPS boxes with fleshfacing flesh side of fillets and vice versa for the skin side. This was not done in thisexperiment because the skinning machine had a mechanical failure during the experiment.Despite the similar microbial development of CBC and SIC-CBC fillets, sensory defectsrelating to the colour and heterogeneous appearance of the cooked flesh, as well as strongerrancidity odour and flavour, were attributed to CBC-treated (superchilled) fillets, especiallythose not previously cooled in slurry ice. These characteristics suggest that oxidative changescontributed to the shorter shelf life of CBC fillets compared to non CBC treatments. Goingbeyond the initial freezing point of fish muscle, slow freezing and temperature fluctuationscan damage fish tissues, causing water loss, protein denaturation and enzymatic changes(Huss, 1995). Other quality changes at subzero conditions include non-enzymatic reactionslike oxidation and protein insolubilisation (Fennema, 1985). The reason for the shorter shelflife seen in CBC than SIC-CBC fillets could be explained by the freezing damages occurringin lower salt-containing CBC fillets than in SIC-CBC treated ones. It is therefore concludedthat the SIC treatment before CBC processing may be a preferable step to reduce freezingdamage, especially for fatty fish species, or the CBC tunnel conditions should be adjusted tosuit better the small fillet size of redfish compared to cod for which it was already adjusted.The purpose of in-process slurry ice cooling is to reduce the product temperature beforepackaging. This is a critical processing step since improper cooling and fillet microbialcontamination may speed up spoilage during storage and distribution of the product. The NCand SIC treated redfish fillets had a similar initial temperature which explains why SICtreatment did not enhance the sensory shelf life of the fillets. However, salt uptake by thefillets during slurry ice application led to a faster growth of SSO in SIC fillets compared toNC fillets. Despite this microbial relationship with salt, SIC treatment did not shorten theshelf life of the fillets in comparison to NC treatment. The observed higher levels of basicvolatile compounds (TMA and TVB-N) in SIC than NC fillets at a later stage of storage aredue to increased microbial growth, particularly TMA producers (H 2 S-producing bacteria andP. phosphoreum). This agrees with what Malle and Poumeyrol (1989) reported that these areindicators of spoilage at an advanced stage. Therefore, no evident efficacy of SIC treatment atHB Grandi with respect to cooling was observed compared to NC treatment.TMA formation in fresh fish is an indicator of microbial spoilage. Its formation istemperature and oxygen level dependent. It is known to be a proper indicator for iced/chilledfish stored in air. A P-ratio of 50% would indicate that all produced TVB-N from the initialvalue would be TMA. The percentage itself does not really indicate whether spoilage isreached. It depends on the initial TVB-N value of the product. The study gave a TVB-N valueof 12-15 mgN/100g of redfish fillets at the sensory rejection. This is lower than the TVB-Nvalue of 25 mgN/100 g reported by Masette (1999), and corresponds to the EuropeanCommission regulation limit for unprocessed redfish suitable for human consumption (ECNo.2074/2005). However this lower value is explained by the low microbial loads, generally< log 7 CFU/g, detected at sensory rejection (Table 5). The initial low and fluctuatingenvironmental temperature may have as well favoured other deteriorative changes than thoseUNU-Fisheries Training Programme26
Semwangaof microbial origin. Indeed, the initial low storage temperature may have affected the activityof spoilage microbiota. Further it should be envisaged that the spoilage pattern of wholeredfish may differ to that of fillets where more complex deteriorative changes may take placeunder aerobic storage. In addition, the different in-process treatments led to differentmicrobial loads which in turn are expressed in the metabolite profile observed. According toMalle and Poumeyrol (1989) a P value above 40%, representing the ratio of TMA to TVB-N,is an indicator of advanced stage of fish tissue degradation. This study showed that P-ratiovaries with the cooling method applied to redfish fillets, with SIC treatment leading to thehighest value. This is because of the difference in SSO loads accumulating in the differentlytreated fillets as storage progressed. This suggests that spoilage of redfish fillets was notentirely microbial hence the lower levels of TVB-N than the EC recommended limit.The fall in pH during the first 10 days of storage is due to breakdown of residual glycogen viaglycolysis to pyruvic acid and then lactic acid production as reported by Huss (1995). Despitethis drop, it was still above 6.7, implying that the fillet texture was still reasonably firm. Thisagrees with the sensory results of the study according to texture attribute. The rise in pH after10 days of storage can be explained by the increased production of basic volatile compoundsin the deteriorating fish due to increased microbial activity.The study clearly showed that bottom corners of EPS boxes are weak points since theyrespond faster to the ambient temperature. This implies that redfish fillets stored in the sameEPS box may be of varying quality depending on the position they are, especially underextreme thermal load. This creates a need to develop EPS boxes with better insulatingproperties. The sea freight EPS boxes with drainage holes were observed to respond fast anddirectly to the fluctuations in ambient temperature during storage. This makes redfish filletsgreatly susceptible to fast microbial and quality deterioration in case the ambient temperatureof the storage chamber or distribution vessel is abused. However, in well monitoredtemperatures, sea freight EPS boxes should perform as well as closed EPS boxes.UNU-Fisheries Training Programme27
Semwanga6C<strong>ON</strong>CLUSI<strong>ON</strong>The study showed that skinning of redfish fillets contributed to a longer shelf life and that inprocesscooling of skinless fillets did not enhance freshness nor shelf life of the product. CBCtreatment did not delay spoilage of redfish fillets despite the fact that this cooling techniqueled to the lowest product temperature. The shorter shelf life was caused by the highestmicrobial contamination due to the presence of the skin on the fillets. CBC treatment of fattyskin-on fillets apparently requires a slurry ice pre-cooling step prior to CBC to reducefreezing damages and oxidative flesh deterioration in the superchilled state as well asdeskinning of fillets before packaging.Despite the insignificant salt uptake observed in fillets pre-cooled in slurry ice, it contributedto a faster growth of specific spoilage organisms, particularly the TMA producers, H 2 S-producing bacteria and P. phosphoreum. The low counts (
SemwangaACKNOWLEDGEMENTSI extend my gratitude to UNU-FTP directors (Dr. Tumi Tómasson, Þór Ásgeirsson) andSigríður Kr. Ingvarsdóttir for the training invitation and continued guidance during thetraining.I thank HB Grandi hf (Reykjavik, Iceland) for their generous supply of redfish fillets as wellas their financial support for sensory analysis. Eskja hf (Hafnarfjörður, Iceland) is alsoacknowledged for allowing access to their CBC cooler.I greatly thank my supervisors Hélène Liette Lauzon, Björn Margeirsson, Sigurjón Arasonand not forgetting María Guðjónsdóttir.Further, I am indebted for the invaluable assistance by a group of specialists at Matís duringthe project work, like Páll Steinþórsson (Microbiology), Eyjólfur Reynisson, Árni R.Rúnarsson and Nadine Knocke (qPCR analysis), Aðalheidur Ólafsdóttir (Sensory analysis)and the sensory panel team as well as the staff from the chemistry lab (Ingibjörg RósaÞorvaldsdóttir, Alicja Obuchowska, Helgi Sigurjónsson, Svanhildur Hauksdóttir).Last but not least, great support by Eis Purwaamidjaja during the experimental preparationand sampling was appreciated.UNU-Fisheries Training Programme29
SemwangaLIST <strong>OF</strong> REFERENCESAnthoni,E.,Bǿrrese,T.,Christophersen,C.,Gram,L.,Nielsen,H.P. (1990). Is trimethylamineoxide a reliable indicator for the marine origin of fish? Comparative Biochemistry andPhysiology. 97 (3):569-571AOAC. Association of Official Analytical Chemists. (2000). Official methods of analysis17th ed. Washington DC (no 976.18).Arnthórsdóttir, M.G., Arason S., Margeirsson, B. (2008). Combined Blast and Contactcooling - Effects on physiochemical characteristics of fresh haddock (Melanogrammusaeglefinus) fillets. Report/Skýrsla Matís 14-08, 39 p.Aune, E. (2003). Super chilling of food stuff. A review 21st Congress, ICR, August 17-22,2003, Washington, DC.Bonilla, A.C., Sveinsdottir, K., Martinsdottir, E. (2007). Development of quality indexmethod (QIM) scheme for fresh cod (Gadus morhua) fillets and application in shelf lifestudy. Food control 18(4):.352-358.Cakli, S., Kilin, B., Dincer, T. (2006). Effects of using slurry ice during transportation on themicrobiological, chemical and sensory assessment of aquaculture Sea bass (Dicentrarchuslabax) stored at 4°C. Critical Reviews in Food Science and Nutrition 46 (6): 453-458.Castell, H.C.andTriggs, E.R. (1995). Spoilage of haddock in the trawlers at sea: Themeasurement of spoilage and standards of quality. Canadian Journal of Fisheries andAquatic Science 12 (3): 329-341.Church, N. (1998). Feature MAP fish and crustaceans- sensory enhancement. Food Scienceand Technology Today 12 (2): 73-82.Dalgaard, P., Mejlholm, O., Huss, H.H. (1996). Conductance method for quantitativedetermination of Photobacterium phosphoreum in fish products. Journal of AppliedBacteriology. 81: 57-64.Dalgaard, P. (2006). Microbiology of marine muscle food. In: Handbook of Food Science,Technology and Engineering. Hui, Y.H (ed.), CRC, Boca Raton, FL, USA, Chapter 53: 53-1,53-20.Doyle,J.P. (1995). Seafood shelf life a function of temperature.[ Electronic version]..E-Covima. (2007). [Available on line], ; retrieved 18.02.2011.EC. (2005). Commission regulation No.2074/2005. Official Journal of the European Union,pp 1-33.UNU-Fisheries Training Programme30
SemwangaEtienne M. (2005). SEAFOODplus – Traceability – Valid – Methods for chemical qualityassessment: Volatile amines as criteria for chemical quality assessment. Ifremer, Nantes,France, Feb. 2005. [Available online],.Fennema, O.R. (1985). Food chemistry,2 nd ed.New York: Marcel Dekker,Inc.1985, 991p.Fishbase. (2011). [Available on line] Gallart-Jornet,L., Rustad, T., Barat, M.J., Fito,P., Escriche, I. (2007). Effect of superchilledstorage on the freshness and salting behaviour of Atlantic salmon (Salmo salar) fillets.Journal of Food Chemistry 103: 1268-1281.Gao, H. Y. (2007). Methods of pre-cooling for fresh cod (Gadus morhua) and influences onquality during chilled storage at -1.5 o C. United Nations University–Fisheries TrainingProgramme-Final report. 27 p.Graham, J., Johnston, W.A., Nicholson, F.J. (1992). Ice in Fisheries. FAO Fisheries TechnicalPaper no.331. 75 p. Rome . Food and Agriculture Organisation of the United Nations.Gram, L. Trolle, G., Huss, H.H. (1987). Detection of specific spoilage bacteria from fishstored at low (0 oC) and high (20 oC) temperatures. Internationational Journal of FoodMicrobiology 4: 65-72.Gram, L., Wedell-Neergaard, C., Huss, H.H. (1990). The bacteriologyof fresh and spoiling Lake Victoria Nile perch (Lates niloticus). International Journal ofFood Microbiology 10: 303-316.Gram, L. Wedeel-Neergaard, C and Huss, H.H.1990. The bacteriology of fresh and spoilinglake Victorian Nile Perch (Lates niloticus), Int. J. Food Microbiol. 10,103-316.Gram, L. and Huss, H.H. (1996). Microbiological spoilage of fish and fish products.International Journal of Food Microbiology 33: 121-137.HB Grandi. (2011). Golden redfish (Sebastes marinus),[Available on line],,retrieved 18.02.2011.Huynh, N.D.B., Arason, S., Thorarinsdottir, K.A. (2007). Effects of dry ice and superchillingon quality and shelf life of Arctic Char (Salvelinus alpinus) fillets. International Journal ofFood Engineering 3 (3): 1-29.Huss, H.H. (1995). Quality and quality changes in fresh fish. FAO Fisheries Technical PaperNo. 348. 195 p. Rome. Food and Agriculture Organisation of the United Nations.ISO 8586ss (1993). Sensory analysis general guidance for the selection, training andmonitoring of assessors. Part 1: Selected assessors. Geneva, Switzerland: The InternationalOrganisation for standardisation.UNU-Fisheries Training Programme31
SemwangaJaworski, A., Ragnarsson, A.S. (2006). Feeding habits of demersal fish in Icelandic waters: amultivariate approach. ICES Journal of Marine Science 63 (9): 1682-1694.Jonsson and Palsson. (2006). Deep sea and Oceanic Red fish [Retrieved December 03 2010].. Ministry of Agriculture and Fisheries,Iceland.Kaale, L.D., Eikevik, T.M., Rustad, T. (2010). Review of super chilling of food. Abstract inthe proceedings of the 40th Annual WEFTA meeting. October 4-7th 2010, Cesme-Izmi,Turkey.Kilinc B, Cakli S, Cadun A, Dincer T, Tolasa S. 2007. Comparison of effects of slurry ice andflake ice pretreatments on the quality of aquacultured sea bream (Sparus aurata) and sea bass(Dicentrarchus labrax) stored at 4°C. Food Chem. 104, 1611-1617.Lauzon, H.L., Magnusson, H., Sveinsdottir, K., Gudjonsdottir, M., Martinsdottir, E. (2009).Effect of brining, modified atmosphere packaging and superchilling on the shelf life of cod(Gadus morhua) loins. Journal of Food Science 74 (6): 1-10.Magnusson, H., Martinsdottir, E. (1995). Storage quality of fresh and frozen-thawed fish inice. Journal of Food Science 60 (2): 273-278.Magnússon H, Sveinsdóttir K, Lauzon HL, Thorkelsdóttir Á, Martinsdóttir, E. (2006).Keeping quality of desalted cod fillets in consumer packs. J ournal of Food Science 71 (2),69-76.Magnússon, H., Lauzon, H.L., Sveinsdóttir, K., Margeirsson, B., Reynisson, E., Rúnarsson,Á.R., Guðjónsdóttir, M., Thórarinsdóttir, K.A., Arason, S., Martinsdóttir, E. (2009). Theeffect of different cooling techniques and temperature fluctuations on the storage life of codfillets (Gadus morhua). Report/Skýrsla Matís 23-09, Reykjavík, Iceland, 37 p.Malle, P., Poumeyrol, M. (1989). A new chemical criterion for the quality control of fish:Trimethylamine, Total volatile Basic Nitrogen. Journal of Food Protection 52 (6): 419- 423.Masette, M. (1999). A comparative study of storage time of warm and cold water fish in viewof the current market demand. UNU-FTP Final project report. 42pMausse, E.C. J. (2000).Shelf life of redfish stored in ice and modified atmosphere (MA) and aspects on thedevelopment of Quality Index Method (QIM) scheme for redfish stored in MA. 30p.[Electronic version]., retrieved20.02.2011.Matis (2011). Redfish/ ocean perch (Sebastes marinus) [Available online]., retrieved 18.02.2011.Matis. (2011). Fishing gear-Seasonal variation-Fishing ground;retrieved 18.02.2011.UNU-Fisheries Training Programme32
SemwangaMausse, E. C.J., 2000. Shelf life of red fish stored in ice and Modified admosphere (MA) andsome aspects on the development of a Quality Index Method (QIM) scheme for red fishstored in MA. UNU-Fisheries Training Programme.http://www.unuftp.is/static/fellows/document/estela3.pdfOkeyo, G.O., Lokuruka, M.N.I and Matofari, J.W. 2009. Nutritional composition and shelflife of the lake Victoria Nile perch (Lates niloticus) stored in ice. African Journal of FoodAgriculture Nutrition and Development 9(3): 901-919.Olafsdottir, G., Lauzon, H.L., Martinsdottir, E., Oehlenschlager, J., Kristbergsson, K. (2006).Evaluation of shelf life of superchilled cod (Gadus morhua) fillets and influence oftemperature fluctuations during storage on microbial and chemical quality indicators. Journalof Food Science 71 (2): 97-109.Pacific Sardine Association. (2001). Quality and standards in sardines. Manual de calidadpara el proceso de sardine congelada. 37 p.Pineiro, C., Velazquez, J.B., Aubourg, S.P. (2004). Effects of newer slurry ice systems on thequality of aquatic food products: a comparative review versus flake ice chilling methods.Trends in Food Science and Technology 15 (12): 575-582.Rehbein, H., Martinsdottir, E., Blomsterberg, F., Valdimarsson, G., Oehlenschlaeger, J.(1994). Shelf life of ice stored redfish. International Journal of Food Science and Technology29 (3): 303-313. Abstract.Reynisson, E., Lauzon, H.L., Magnússon, H., Hreggviðsson, G.Ó., Marteinsson, V.Þ. (2008).Rapid quantitative monitoring method for the fish spoilage bacteria Pseudomonas. Journal ofEnvironmental Monitoring 10 (11): 1357-1362.Reynisson, E., Lauzon, H.L., Thorvaldsson, L., Margeirsson, B., Runarsson, R.A,Marteinsson, V.Þ .(2010). Effects of different cooling techniques on bacterial succession andother spoilage indicators during storage of whole, gutted haddock (Melanogrammusaeglefinus). European Food Research Technology 231 (2): 237-246.Rha, C. (1975). Thermal properties of food, In RHA, C (Ed).Theory, Determination andcontrol of physical properties of food materials. Dordrecht, Reidel Boston publishing.Robinson, R.K. (1985). Microbiology of frozen food. Elservier Applied Science PublisherLtd. England. 290 p.Rodriguez, O., Losada,V., Aubourg, P. S., Baros-Velazques, J. (2004). Enhanced shelf life ofchilled European hake (Merluccius merluccius) stored in slurry ice as determined by sensoryanalysis and assessment of microbiological activity. Journal of Food Research International37: 749-757.Shewan, J.M., Macintosh, R.G., Tucker, C.G., Ehrenberg, A.S.C. (1953). The development ofa numerical scoring system for sensory assessment of the spoilage of wet white fish stored inice. Journal of the Science Food and Agriculture 4 (6): 283-298.UNU-Fisheries Training Programme33
SemwangaSohn, J.H., Ushio, H., Ishida, N., Yamashita, M., Terayama, M., Ohshima, M. (2007). Effectof bleeding treatment and perfusion of yellow tail on lipid oxidation in post mortem muscle.Journal of Food Chemistry 104 (3): 962-970.Stanbridge, L.H., Board, R.G. (1994). A modification of the pseudomonas selective medium,CFC that allows differentiation between meat pseudomonads and Enterobacteriacae. Lettersin Applied Microbiology 18: 327-328.Stone, H., Sidel J.L. (2004). Descriptive analysis. In Sensory Evaluation Practices, 3rd Ed.(H. Stone and J.L. Sidel, eds.), pp. 201–244, Elsevier, Amsterdam, the Netherlands.Van Spreekens, K.J.A. (1974). The suitability of a modification of Long and Hammer’smedium for the enumeration of more fastidious bacteria from fresh fishery products. AntonieLeuwenhoek 25: 213-219.Wang, T., Jonsdottir, R., Kristinsson, G.H., Thorkelsson, G., Jacobsen, C., Hamaguchi, Y.P.,Olafsdottir, G. (2010). Inhibition of haemoglobin –mediated lipid oxidation in washed codmuscle and cod protein isolates by Fucus vesiculosus extract and fractions. Food Chemistry123: 321-330.UNU-Fisheries Training Programme34
SemwangaAPPENDIX 1 – Torry scheme and QDA attributesTable A – Torry freshness schemeScore Odour FlavourInitially weak odour of boiled Boiled cod liver,10 cod liver, fresh oil, starchy watery, metallic.Shellfish, seaweed,Oily, boiled cod liver,9 boiled meat, oil, cod liver sweet, meaty characteristic.Loss of odour,Sweet/ characteristic flavours8 neutral odour but reduced in intensity.Woodshavings, woodsap,7 vanillinCondensed milk,6 boiled potatoNeutralInsipidMilk jug odours,Slight sourness, trace of5 boiled clothes- like "off"-flavours, rancidLactic acid, sour milkSlight bitterness, sour,4 TMA "off"-flavours, TMA, rancidLower fatty acids (eg acetic or Strong bitter, rubber,3 butyric acid) composed grass, slight sulphide, rancidsoapy, turnipy, tallowyUNU-Fisheries Training Programme35
SemwangaTable B – List of QDA attributes evaluatedSensory attributescaledefinitionODOURsweet odour none much Sweet odour of fresh redfishcod liver none much Boiled cod livershellfish, algae none much Characteristic, fresh odourvanilla/warm milk none much Vanilla, sweet warm milkboiled potatoes none much Whole, hot, boiled potatoes in a saucepanrancid none much Rancid odourtable cloth none much Dirty damp dish cloth from the kitchen (left for 36 hrs. )TMA none much TMA odour, reminds of dried salted fish, aminequeasy sweet none much Spoilage odour, queasy sweet, overripe fruitsspoilage sour none much Spoilage sour, sour odour, sour milk, acetic acidsulphur none much Sulphur, matchstick, boiled cabbageAPPEARANCEcolour light dark Light: white colour. Dark: yellowish, brownish, greyheterogeneous homogeneous heterogeneous Homogeneous: even colour. Heterogeneous: stains, uneven colourwhite precipitation none much White precipitation on the sample surfaceflakiness none much The fish sample slides into flakes when pressed with a forkFLAVOURcod liver none much Boiled cod livermetallic none much Characteristic metallic flavour of fresh redfishsweet none much Characteristic sweet flavour of fresh redfishrancid none much Rancid flavourpungent none much Pungent flavourqueasy sweet none much Spoilage flavour queasy sweet, overripe fruitssour none much Spoilage sour, sour tasteTMA none much TMA flavour, reminds of dried salted fish, amineoff-flavour none much Intensity of off-flavour (spoilage flavour)TEXTUREsoft firm soft Softness in first bitejuicy dry juicy Dry: draws liquid from mouth. Juicy: releases liquid when chewntender tough tender Tenderness when chewnmushy none much Mushy, porridge like texturemeaty mouthfeel none much Reminds of meat texture, rough fiberssticky none much Glues together teeth when biting the fishUNU-Fisheries Training Programme36
SemwangaAPPENDIX 2 – Mean data with statistical analysisTable C - One –way ANOVA by NCSS, Duncan’s Multiple–Comparison TestSample Torry TVC H2S-prod. Pp Pseud. pH* TVB-N TMA Saltlog cfu/g log cfu/g log cfu/g log cfu/g mgN/100g mgN/100g %P value 0.0000 0.0000 0.0000 0.0000 0.0000 0.0355 0.0013 0.0007 0.0005abbccabbccabcefaabdefabcefabcffabcefNC-d1 8.7 3.8 1.9 2.0 3.0NC-d6 6.6 4.7 4.0de2.2a3.4NC-d10 5.7 5.6 5.2f4.7c4.5NC-d13 5.2 7.2 6.7g5.0c6.2SIC-d1 8.7 3.7 2.3ab2.0a2.9SIC-d6 6.8 4.4 3.6cd3.4ac3.1SIC-d10 5.9 6.4 6.3g5.5d4.4SIC-d13 5.1 7.3 6.9gNA 5.8SF-SIC-d6 NA 4.2 2.7ab2.2a2.9SF-SIC-d10 NA 5.8 5.3f3.9ad4.0SF-SIC-d13 NA 7.2 6.6g5.5d6.3SIC-CBC-d1 8.4a4.3 3.0bc2.0a3.5SIC-CBC-d6 6.7b5.5 4.8ef3.1ac4.2SIC-CBC-d10 5.4cd7.8 6.7g4.8c5.2SIC-CBC-d13 4.5d7.8 7.1g6.2e5.7CBC-d1 8.3a4.4 3.0bc1.8a3.8CBC-d6 6.7b5.3 4.8ef2.5ab4.3CBC-d10 4.9cd6.9 6.4g4.3b5.2CBC-d13 4.4d7.7 7.3g6.0e7.6* Fisher's LSD Multiple-Comparison Test used for pH comparison; NA, not availableaaabacdfhaabdeghacehaccefgghbddegi6.916.816.816.766.936.816.796.866.766.776.766.896.846.827.006.926.836.776.87ceadadadeadacadaababbadadedeadabae11.811.310.714.212.810.611.418.011.611.514.710.810.314.223.511.211.914.523.3aaaaaaaabaaaaaabaaab1.30.82.32.31.31.01.89.40.81.14.90.91.01.313.50.90.62.411.9aaaaaaacaaacaaadaaabd0.40.20.20.50.50.30.30.6NANANA0.60.40.40.70.20.20.20.4abaaacacababbcbcababcaaaabUNU-Fisheries Training Programme37
SemwangaTable D – QDA mean data with statistical significance from days 1, 6, 10 and 13ANOVA by NCSS, Duncan’s Multiple–Comparison TestDay 1 Day 6Sensory attribute ms NC SIC SIC-CBC CBC p value ms NC SIC SIC-CBC CBC p valueODOURsweet odour 48 46 46 43 0.523 39 39 39 36 0.705cod liver 39 38 40 36 0.595 27 26 24 30 0.284shellfish, algae 28 29 29 24 0.259 26 27 23 26 0.677vanilla/warm milk 35 33 32 30 0.501 27 25 27 22 0.479boiled potatoes 17 22 21 22 0.096 29 25 b 30 33 a 0.058rancid 0 1 1 0 0.234 1 1 1 3 0.305table cloth * 1 b 3 4 7 a 0.032 6 7 9 6 0.695TMA 0 0 0 1 0.499 3 1 1 2 0.478queasy sweet 3 2 2 3 0.898 7 10 11 7 0.164spoilage sour * 0 b 1 a 0 0 0.015 1 1 0 1 0.657sulphur 0 0 0 0 0.404 0 0 1 2 0.549APPEARANCEcolour ** 26 b 27 b 27 b 40 a 0.009 32 28 27 35 0.130heterogeneous * 30 b 33 b 31 b 43 a 0.018 40 38 35 42 0.679white precipitation *** 32 b 32 b 25 b 44 a 0.001 ** 43 a 33 c 33 bc 40 ab 0.002flakiness 46 47 42 44 0.481 48 46 44 45 0.735FLAVOURcod liver 46 45 42 44 0.424 29 29 27 31 0.720metallic * 38 a 35 33 32 b 0.017 27 28 23 29 0.188sweet 40 44 46 40 0.226 23 27 30 28 0.323rancid ** 1 b 0 b 0 b 2 a 0.002 2 1 1 4 0.188pungent 3 2 1 2 0.512 11 6 9 11 0.221queasy sweet 2 2 2 3 0.977 10 12 9 9 0.598sour 0 0 0 1 0.658 1 2 0 1 0.577TMA 0 0 0 1 0.480 2 3 1 3 0.272off-flavour 0 0 0 0 0.206 1 0 0 1 0.309TEXTUREsoft 42 42 45 45 0.634 38 35 39 34 0.190juicy 49 49 51 47 0.513 44 47 44 42 0.292tender 51 48 51 48 0.445 47 48 49 44 0.201mushy 19 18 21 19 0.826 22 21 25 20 0.333meaty mouthfeel 27 28 26 27 0.888 21 21 16 21 0.064sticky 34 33 30 32 0.212 27 26 26 27 0.908ms (marginal significance, p = 0.05 - 0.0); * (p < 0.05); ** (p < 0.01); *** (p < 0.001)UNU-Fisheries Training Programme38
SemwangaDay 10 Day 13Sensory attribute ms NC SIC SIC-CBC CBC p value ms NC SIC SIC-CBC CBC p valueODOURsweet odour 28 24 24 20 0.281 * 21 22 a 13 b 15 0.027cod liver 20 22 16 15 0.190 13 15 10 11 0.129shellfish, algae 17 19 13 14 0.188 * 13 a 13 8 b 10 0.026vanilla/warm milk * 17 a 18 a 13 9 b 0.013 13 13 9 10 0.143boiled potatoes 28 26 25 29 0.733 29 27 24 22 0.165rancid * 6 3 1 b 10 a 0.034 7 5 7 11 0.393table cloth 12 12 17 16 0.260 * 20 b 21 b 29 a 22 b 0.019TMA * 4 b 4 b 12 a 13 a 0.001 *** 9 b 8 b 22 a 17 a 0.001queasy sweet 11 8 9 11 0.620 16 16 19 16 0.771spoilage sour * 2 b 8 a 8 a 10 a 0.013 * 8 9 b 16 15 a 0.026sulphur 4 2 3 5 0.306 3 4 7 6 0.222APPEARANCEcolour * 39 a 35 28 b 40 a 0.028 *** 36 b 34 b 40 b 48 a 0.001heterogeneous ** 49 a 41 bc 34 c 50 ab 0.001 42 45 43 51 0.212white precipitation 39 39 34 42 0.214 * 46 a 43 36 b 43 a 0.017flakiness 41 44 44 39 0.437 * 49 a 46 45 42 b 0.041FLAVOURcod liver * 28 28 a 19 17 b 0.024 17 16 10 14 0.147metallic * 26 a 20 22 16 b 0.038 15 14 11 10 0.110sweet 21 21 22 14 0.298 13 16 12 9 0.133rancid 5 8 2 9 0.121 11 8 9 14 0.486pungent 12 11 10 20 0.083 ** 13 b 12 b 21 a 19 0.009queasy sweet 9 11 14 13 0.591 * 14 12 20 20 0.036sour 3 7 5 7 0.526 8 7 11 12 0.155TMA * 3 b 6 10 a 10 a 0.020 ** 7 b 6 b 18 a 15 a 0.001off-flavour 3 6 5 8 0.351 * 7 b 7 14 16 a 0.025TEXTUREsoft 43 45 47 42 0.814 41 42 44 40 0.487juicy ** 43 a 45 a 46 a 35 b 0.007 42 42 43 42 0.969tender 48 53 51 44 0.061 52 54 50 49 0.216mushy 28 26 32 27 0.600 22 24 25 22 0.780meaty mouthfeel 25 25 29 22 0.354 28 26 25 27 0.566sticky 37 35 39 35 0.162 27 28 28 25 0.497ms (marginal significance, p = 0.05 - 0.0); * (p < 0.05); ** (p < 0.01); *** (p < 0.001)UNU-Fisheries Training Programme39
SemwangaTable E – Pearson correlation matrix with R values for Torry, microbial and chemicaldataPearson Correlations Section (Row-Wise Deletion)TVC H2S Pseud. Pp pH TVB-N salt TMA TorryC2 C3 C4 C5 C6 C7 C9 C11 C12C2 1.000 0.970 0.893 0.879 -0.154 0.633 0.262 0.558 -0.906C3 0.970 1.000 0.878 0.877 -0.255 0.557 0.166 0.513 -0.940C4 0.893 0.878 1.000 0.782 -0.102 0.687 0.239 0.629 -0.832C5 0.879 0.877 0.782 1.000 -0.133 0.622 0.290 0.628 -0.852C6 -0.154 -0.255 -0.102 -0.133 1.000 0.424 0.401 0.474 0.232C7 0.633 0.557 0.687 0.622 0.424 1.000 0.516 0.956 -0.582C9 0.262 0.166 0.239 0.290 0.401 0.516 1.000 0.525 -0.125C11 0.558 0.513 0.629 0.628 0.474 0.956 0.525 1.000 -0.558C12 -0.906 -0.940 -0.832 -0.852 0.232 -0.582 -0.125 -0.558 1.000Pp- Photobactecterium phosphoreumUNU-Fisheries Training Programme40