Vibrio in seafood - FAO.org
Vibrio in seafood - FAO.org
Vibrio in seafood - FAO.org

Create successful ePaper yourself
Turn your PDF publications into a flip-book with our unique Google optimized e-Paper software.
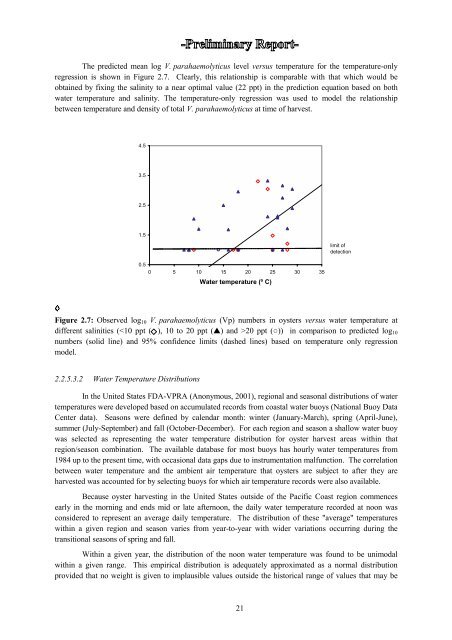
The predicted mean log V. parahaemolyticus level versus temperature for the temperature-onlyregression is shown <strong>in</strong> Figure 2.7. Clearly, this relationship is comparable with that which would beobta<strong>in</strong>ed by fix<strong>in</strong>g the sal<strong>in</strong>ity to a near optimal value (22 ppt) <strong>in</strong> the prediction equation based on bothwater temperature and sal<strong>in</strong>ity. The temperature-only regression was used to model the relationshipbetween temperature and density of total V. parahaemolyticus at time of harvest.4.53.52.51.50.50 5 10 15 20 25 30 35Water temperature (º C)limit ofdetectionFigure 2.7: Observed log 10 V. parahaemolyticus (Vp) numbers <strong>in</strong> oysters versus water temperature atdifferent sal<strong>in</strong>ities (20 ppt (○)) <strong>in</strong> comparison to predicted log 10numbers (solid l<strong>in</strong>e) and 95% confidence limits (dashed l<strong>in</strong>es) based on temperature only regressionmodel.2.2.5.3.2 Water Temperature DistributionsIn the United States FDA-VPRA (Anonymous, 2001), regional and seasonal distributions of watertemperatures were developed based on accumulated records from coastal water buoys (National Buoy DataCenter data). Seasons were def<strong>in</strong>ed by calendar month: w<strong>in</strong>ter (January-March), spr<strong>in</strong>g (April-June),summer (July-September) and fall (October-December). For each region and season a shallow water buoywas selected as represent<strong>in</strong>g the water temperature distribution for oyster harvest areas with<strong>in</strong> thatregion/season comb<strong>in</strong>ation. The available database for most buoys has hourly water temperatures from1984 up to the present time, with occasional data gaps due to <strong>in</strong>strumentation malfunction. The correlationbetween water temperature and the ambient air temperature that oysters are subject to after they areharvested was accounted for by select<strong>in</strong>g buoys for which air temperature records were also available.Because oyster harvest<strong>in</strong>g <strong>in</strong> the United States outside of the Pacific Coast region commencesearly <strong>in</strong> the morn<strong>in</strong>g and ends mid or late afternoon, the daily water temperature recorded at noon wasconsidered to represent an average daily temperature. The distribution of these "average" temperatureswith<strong>in</strong> a given region and season varies from year-to-year with wider variations occurr<strong>in</strong>g dur<strong>in</strong>g thetransitional seasons of spr<strong>in</strong>g and fall.With<strong>in</strong> a given year, the distribution of the noon water temperature was found to be unimodalwith<strong>in</strong> a given range. This empirical distribution is adequately approximated as a normal distributionprovided that no weight is given to implausible values outside the historical range of values that may be21