A combined discreteâcontinuous model describing the lag phase of ...
A combined discreteâcontinuous model describing the lag phase of ...
A combined discreteâcontinuous model describing the lag phase of ...

You also want an ePaper? Increase the reach of your titles
YUMPU automatically turns print PDFs into web optimized ePapers that Google loves.
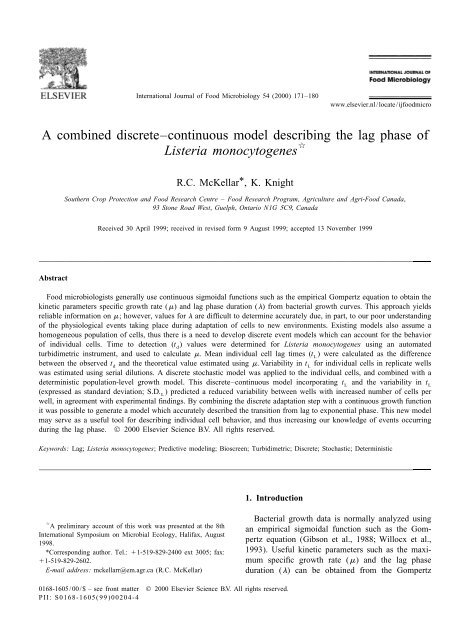
International Journal <strong>of</strong> Food Microbiology 54 (2000) 171–180<br />
www.elsevier.nl/locate/ijfoodmicro<br />
A <strong>combined</strong> discrete–continuous <strong>model</strong> <strong>describing</strong> <strong>the</strong> <strong>lag</strong> <strong>phase</strong> <strong>of</strong><br />
q<br />
Listeria monocytogenes<br />
*<br />
R.C. McKellar , K. Knight<br />
Sou<strong>the</strong>rn Crop Protection and Food Research Centre – Food Research Program, Agriculture and Agri-Food Canada,<br />
93 Stone Road West, Guelph, Ontario N1G 5C9, Canada<br />
Received 30 April 1999; received in revised form 9 August 1999; accepted 13 November 1999<br />
Abstract<br />
Food microbiologists generally use continuous sigmoidal functions such as <strong>the</strong> empirical Gompertz equation to obtain <strong>the</strong><br />
kinetic parameters specific growth rate (m) and <strong>lag</strong> <strong>phase</strong> duration (l) from bacterial growth curves. This approach yields<br />
reliable information on m; however, values for l are difficult to determine accurately due, in part, to our poor understanding<br />
<strong>of</strong> <strong>the</strong> physiological events taking place during adaptation <strong>of</strong> cells to new environments. Existing <strong>model</strong>s also assume a<br />
homogeneous population <strong>of</strong> cells, thus <strong>the</strong>re is a need to develop discrete event <strong>model</strong>s which can account for <strong>the</strong> behavior<br />
<strong>of</strong> individual cells. Time to detection (t ) values were determined for Listeria monocytogenes using an automated<br />
d<br />
turbidimetric instrument, and used to calculate m. Mean individual cell <strong>lag</strong> times (t ) were calculated as <strong>the</strong> difference<br />
L<br />
between <strong>the</strong> observed td<br />
and <strong>the</strong> <strong>the</strong>oretical value estimated using m. Variability in tL<br />
for individual cells in replicate wells<br />
was estimated using serial dilutions. A discrete stochastic <strong>model</strong> was applied to <strong>the</strong> individual cells, and <strong>combined</strong> with a<br />
deterministic population-level growth <strong>model</strong>. This discrete–continuous <strong>model</strong> incorporating tL<br />
and <strong>the</strong> variability in tL<br />
(expressed as standard deviation; S.D.<br />
L) predicted a reduced variability between wells with increased number <strong>of</strong> cells per<br />
well, in agreement with experimental findings. By combining <strong>the</strong> discrete adaptation step with a continuous growth function<br />
it was possible to generate a <strong>model</strong> which accurately described <strong>the</strong> transition from <strong>lag</strong> to exponential <strong>phase</strong>. This new <strong>model</strong><br />
may serve as a useful tool for <strong>describing</strong> individual cell behavior, and thus increasing our knowledge <strong>of</strong> events occurring<br />
during <strong>the</strong> <strong>lag</strong> <strong>phase</strong>. © 2000 Elsevier Science B.V. All rights reserved.<br />
Keywords: Lag; Listeria monocytogenes; Predictive <strong>model</strong>ing; Bioscreen; Turbidimetric; Discrete; Stochastic; Deterministic<br />
1. Introduction<br />
q<br />
A preliminary account <strong>of</strong> this work was presented at <strong>the</strong> 8th<br />
International Symposium on Microbial Ecology, Halifax, August<br />
1998.<br />
*Corresponding author. Tel.: 11-519-829-2400 ext 3005; fax:<br />
11-519-829-2602.<br />
E-mail address: mckellarr@em.agr.ca (R.C. McKellar)<br />
Bacterial growth data is normally analyzed using<br />
an empirical sigmoidal function such as <strong>the</strong> Gompertz<br />
equation (Gibson et al., 1988; Willocx et al.,<br />
1993). Useful kinetic parameters such as <strong>the</strong> maximum<br />
specific growth rate (m) and <strong>the</strong> <strong>lag</strong> <strong>phase</strong><br />
duration (l) can be obtained from <strong>the</strong> Gompertz<br />
0168-1605/00/$ – see front matter © 2000 Elsevier Science B.V. All rights reserved.<br />
PII: S0168-1605(99)00204-4
172 R.C. McKellar, K. Knight / International Journal <strong>of</strong> Food Microbiology 54 (2000) 171 –180<br />
function; however, <strong>the</strong>re are some limitations to <strong>the</strong> Some <strong>of</strong> <strong>the</strong> fundamentals <strong>of</strong> this approach have<br />
use <strong>of</strong> this type <strong>of</strong> function. For example, it can be been discussed by McMeekin et al. (1993). These<br />
shown ma<strong>the</strong>matically that <strong>the</strong> Gompertz rate is authors and o<strong>the</strong>rs emphasized <strong>the</strong> limits <strong>of</strong> this<br />
always <strong>the</strong> maximum rate and occurs at an arbitrary method, <strong>the</strong> most severe <strong>of</strong> which is <strong>the</strong> fact that OD<br />
point <strong>of</strong> inflection (Garthright, 1991, 1997). The methods are comparative only, and cannot be used to<br />
Gompertz equation tends to overestimate m as it fits predict viable counts unless some attempt at calia<br />
sigmoidal curve to a straight line. In addition, <strong>the</strong> l bration is made (McMeekin et al., 1993; Baranyi and<br />
calculated with <strong>the</strong> Gompertz is always at a defined Roberts, 1995). McClure et al. (1993) used a simple<br />
point relative to <strong>the</strong> upper and lower asymptotes quadratic equation to relate OD to viable counts.<br />
(Garthright, 1991, 1997). Thus, empirical equations Dalgaard et al. (1994) used two equivalent methods<br />
have a limited ability to enhance our knowledge for calibration: one in which stationary <strong>phase</strong> cells<br />
concerning <strong>the</strong> physiological stages <strong>of</strong> bacterial were diluted to <strong>the</strong> appropriate OD, and <strong>the</strong> o<strong>the</strong>r in<br />
adaptation to new environment and subsequent which samples for OD and viable count were taken<br />
growth. during growth. Predicted generation times were<br />
It has been suggested that connecting <strong>the</strong> behavior lower with viable count data (Dalgaard et al., 1994),<br />
<strong>of</strong> a single cell to that <strong>of</strong> <strong>the</strong> whole population is <strong>the</strong> and this factor has been taken into account in later<br />
next stage in developing a more mechanistic ap- studies (Miles et al., 1997). Similar methods have<br />
proach to predictive food microbiology (Baranyi, been used to relate turbidimetric and viable count<br />
1997). While <strong>the</strong>re have been some attempts to data (Chorin et al., 1997).<br />
develop mechanistic <strong>model</strong>s for bacterial growth In some studies, <strong>the</strong> Gompertz equation was fitted<br />
(Baranyi and Roberts, 1994, 1995; Hills and Wright, directly to OD data; however, no data was available<br />
1994; Hills and Mackey, 1995), <strong>the</strong>se <strong>model</strong>s tend to<br />
7<br />
at below <strong>the</strong> minimum detectable OD (ca. 10 cfu/<br />
view bacteria as a homogeneous population, and ml) thus <strong>the</strong> estimates for l and m should be<br />
<strong>the</strong>re have been few attempts to <strong>model</strong> bacterial questioned (Hudson, 1994; Hudson and Mott, 1994).<br />
adaptation and growth on <strong>the</strong> basis <strong>of</strong> single cells. A form <strong>of</strong> calibration was achieved by relating l<br />
Recently, a <strong>model</strong> was proposed in which <strong>the</strong> using OD measurements to that determined with<br />
bacterial population was divided into non-growing viable counts by a regression equation (Hudson and<br />
and growing cells (McKellar, 1997). This <strong>model</strong> was Mott, 1994). McMeekin et al. (1993) have discussed<br />
expressed in <strong>the</strong> form <strong>of</strong> differential equations, and <strong>the</strong> correct way to fit <strong>the</strong> Gompertz function to %<br />
<strong>the</strong> behavior <strong>of</strong> <strong>the</strong> two types <strong>of</strong> cells was <strong>model</strong>ed transmittance data, and this method has been used to<br />
independently. Buchanan et al. (1997) have proposed calculate generation times (Neumeyer et al., 1997).<br />
a <strong>model</strong> which takes into account <strong>the</strong> variation in O<strong>the</strong>r studies have been carried out without any<br />
adaptation (or <strong>lag</strong>) time <strong>of</strong> individual cells. Simula- apparent calibration (Huchet et al., 1995). l values<br />
tions with this <strong>model</strong> gave rise to ‘‘traditional’’ have been estimated from OD data by extrapolation<br />
growth curves; however, <strong>the</strong>se authors did not pro- <strong>of</strong> <strong>the</strong> exponential portion <strong>of</strong> <strong>the</strong> curve back to <strong>the</strong><br />
vide experimental evidence for <strong>the</strong>ir <strong>model</strong>. More initial cell numbers (Breand et al., 1997); however,<br />
recently, Baranyi and Pin (1999) and Baranyi (1998) this method may be inaccurate since <strong>the</strong> growth rate<br />
have proposed a <strong>lag</strong> <strong>model</strong> based on behavior <strong>of</strong> estimated from <strong>the</strong> OD data may be lower than that<br />
individual cells.<br />
obtained during <strong>the</strong> period <strong>of</strong> maximum growth<br />
Construction <strong>of</strong> <strong>model</strong>s using viable count data is (McMeekin et al., 1993).<br />
time consuming and expensive, and researchers have Interestingly, <strong>the</strong> time to detection (t<br />
d) approach<br />
explored o<strong>the</strong>r, more rapid, methods for accumulat- has not been used to any great extent. The td<br />
for a<br />
ing sufficient data for <strong>model</strong>ing. One <strong>of</strong> <strong>the</strong> simplest turbidimetric instrument can be defined as <strong>the</strong> time<br />
method is <strong>the</strong> use <strong>of</strong> optical density (OD), where required for an initial measurable increase in OD.<br />
growth can be related to <strong>the</strong> increase in turbidity <strong>of</strong> a The difference between td<br />
for serial two-fold dilu-<br />
bacterial culture. This method lends itself particu- tions gives <strong>the</strong> doubling time, from which <strong>the</strong> m can<br />
larly well to automation, and a number <strong>of</strong> studies be determined (Cuppers and Smelt, 1993). The l can<br />
have used automated turbidmetric instruments such be calculated subsequently by <strong>the</strong> difference between<br />
as <strong>the</strong> Bioscreen (McClure et al., 1993; Huchet et al., <strong>the</strong> predicted td<br />
based on <strong>the</strong> m, and <strong>the</strong> observed td<br />
1995). (Cuppers and Smelt, 1993). This method was used to
R.C. McKellar, K. Knight / International Journal <strong>of</strong> Food Microbiology 54 (2000) 171 –180 173<br />
estimate individual cell <strong>lag</strong> times (Pin and Baranyi, t (h), that is, <strong>the</strong> time required for <strong>the</strong> Bioscreen to<br />
d<br />
1998). Given <strong>the</strong> limitations and inherent inac- record a 0.05 increase in optical density from t .<br />
0<br />
curacies <strong>of</strong> <strong>the</strong> calibration method, <strong>the</strong> td<br />
approach Duplicate wells for each dilution were used for <strong>the</strong><br />
would seem to be <strong>the</strong> only valid one.<br />
preparation <strong>of</strong> a standard curve <strong>of</strong> log OD against<br />
The purpose <strong>of</strong> <strong>the</strong> present study was to (1) obtain cfu/ml. For <strong>the</strong> determination <strong>of</strong> m, five replicate<br />
data on <strong>the</strong> <strong>lag</strong> <strong>phase</strong> experienced by single cells <strong>of</strong> wells were used for each dilution, with 20 replicate<br />
Listeria monocytogenes using <strong>the</strong> Bioscreen and (2) wells being used for dilutions which were close to 0<br />
develop a discrete–continuous <strong>model</strong> which com- cfu/ml.<br />
bines cell adaptation as a property <strong>of</strong> individual cells Viable cells were enumerated for each two-fold<br />
(discrete activity) with a continuous <strong>model</strong> for dilution by spread plating 0.1 ml <strong>of</strong> appropriate serial<br />
bacterial growth.<br />
dilutions in duplicate onto tryptic soy agar (TSA;<br />
Difco Labs.). The plates were incubated at 308C for<br />
48 h and colonies were counted using a Quebec<br />
Colony Counter (Model 15; American Optical, Buf-<br />
2. Materials and methods<br />
2.1. Strains and culture conditions<br />
Dynamic <strong>model</strong>s were created using<br />
©<br />
ModelMaker Version 3.0 (Cherwell Scientific Pub-<br />
lishing, Oxford, UK).<br />
The Gompertz and heterogeneous population<br />
(HPM) (McKellar, 1997) <strong>model</strong>s were fit to growth<br />
data (obtained ei<strong>the</strong>r from actual or simulated cell<br />
®<br />
counts) using Scientist (Micromath Scientific S<strong>of</strong>t-<br />
ware, Salt Lake City, UT, USA). A modified Powell<br />
algorithm was used to minimize <strong>the</strong> sum <strong>of</strong> squared<br />
deviation between observed data and <strong>model</strong> calcula-<br />
tions. Initial parameter estimates were obtained using<br />
simplex optimization. Differential equations were<br />
solved numerically by <strong>the</strong> method <strong>of</strong> Runge–Kutta,<br />
since <strong>the</strong> s<strong>of</strong>tware does not require analytical forms<br />
<strong>of</strong> equations.<br />
Prism Version 2.0 (GraphPad S<strong>of</strong>tware for Intuitive<br />
Science, San Diego, CA, USA) was used to<br />
create plots.<br />
Listeria monocytogenes Scott A (human clinical<br />
isolate) was obtained from <strong>the</strong> culture collection at<br />
<strong>the</strong> Food Research Program (Guelph, Canada). The<br />
culture was grown for 24 h at 308C in tryptic soy<br />
broth (TSB; Difco Labs., Detroit, MI, USA). Stock<br />
cultures were prepared in TSB plus 15% glycerol<br />
(BDH, Toronto, Canada) and were frozen in 0.3-ml<br />
aliquots in cyrovials at 2 258C.<br />
The contents <strong>of</strong> one cyrovial was transferred to 10<br />
ml <strong>of</strong> TSB, incubated for 24 h at 308C in a shaking<br />
waterbath (New Brunswick Scientific, Edison, NJ,<br />
USA) at 1500 rpm. The culture was transferred (1%)<br />
to 10 ml fresh TSB and incubated under <strong>the</strong> same<br />
conditions. The resulting culture was used as <strong>the</strong><br />
inoculum for experiments. API Listeria spp. Identifi-<br />
cation Strip (BioMerieux Canada, St. Laurent,<br />
Canada) was used to confirm <strong>the</strong> identity <strong>of</strong> <strong>the</strong><br />
culture.<br />
2.2. Bioscreen growth experiments<br />
falo, NY, USA).<br />
2.3. Modeling<br />
Serial two-fold dilutions <strong>of</strong> <strong>the</strong> inoculum were 3. Results<br />
made using fresh TSB to obtain a range <strong>of</strong> dilutions<br />
5<br />
representing approximately 10 to 0 cfu/ml. From Kinetic parameters <strong>describing</strong> bacterial growth can<br />
each <strong>of</strong> <strong>the</strong> two-fold dilutions, 0.35 ml was trans- be determined from turbidity data (Cuppers and<br />
ferred to wells <strong>of</strong> a Bioscreen plate (Labsystems, Smelt, 1993). Plots <strong>of</strong> td<br />
obtained from serial dilu-<br />
Helsinki, Finland). The filled plates were placed in tions <strong>of</strong> <strong>the</strong> original inoculum against ln cfu/ml (Fig.<br />
<strong>the</strong> Bioscreen (Labsystems) at an incubation temslope<br />
1) gave straight lines, and m was calculated from <strong>the</strong><br />
perature <strong>of</strong> 308C. Measurements were taken using a<br />
by Eq. (1):<br />
wide band filter, with pre-shaking at medium intensity<br />
for 10 s prior to OD reading; measurements were<br />
1<br />
m 52 ]]<br />
taken every 4 min for 25 h. Results were reported as<br />
Slope<br />
(1)
174 R.C. McKellar, K. Knight / International Journal <strong>of</strong> Food Microbiology 54 (2000) 171 –180<br />
Table 1<br />
Kinetic parameters for Listeria monocytogenes determined using<br />
a<br />
<strong>the</strong> Bioscreen<br />
Trial t m t S.D. % Growth<br />
d L L<br />
(n520)<br />
A 20.35 1.04 5.86 0.783 60<br />
B 21.32 0.876 4.12 0.814 65<br />
a 21<br />
t<br />
d, Time to detection (h); m, specific growth rate (h ); t<br />
L,<br />
mean individual cell <strong>lag</strong> <strong>phase</strong> duration (h); S.D.<br />
L, standard<br />
deviation <strong>of</strong> <strong>the</strong> mean individual <strong>lag</strong> <strong>phase</strong> duration; % growth,<br />
percent <strong>of</strong> wells showing growth.<br />
single cell per well can be calculated from a Poisson<br />
Fig. 1. Determination <strong>of</strong> specific growth rate (m) and <strong>lag</strong> <strong>phase</strong><br />
duration (t<br />
L) for Listeria monocytogenes using time to detection<br />
distribution:<br />
(t ) data obtained from <strong>the</strong> Bioscreen. Experimental data (d),<br />
2b i<br />
d<br />
e b<br />
simulated data (j). P(X 5 i) 5 ]]<br />
i!<br />
(2)<br />
where P(X5i) is <strong>the</strong> probability <strong>of</strong> finding i cells in<br />
It is also possible to calculate m from cell counts a randomly chosen well, and b is <strong>the</strong> expected value<br />
obtained by using ei<strong>the</strong>r quadratic (McClure et al., <strong>of</strong> that cell number.<br />
1993) or cubic (Stephens et al., 1997) calibration Using <strong>the</strong> observation that 12/20 or 60% <strong>of</strong> wells<br />
curves to convert Bioscreen absorbance data; how- contain one or more cells, <strong>the</strong> value <strong>of</strong> b may be<br />
ever, this method was not employed in <strong>the</strong> present calculated from <strong>the</strong> following equation:<br />
study.<br />
Calculation <strong>of</strong> m using a serial dilution method is<br />
independent <strong>of</strong> <strong>the</strong> absolute numbers <strong>of</strong> cells present.<br />
2b<br />
P(X . 0) 5 1 2 e 5 0.6 (3)<br />
However, it is more difficult to calculate <strong>the</strong> in- Substituting b (0.916) in Eq. (2), it is possible to<br />
dividual cell <strong>lag</strong> <strong>phase</strong> duration (t<br />
L). It was assumed calculate <strong>the</strong> probability <strong>of</strong> finding one (37%) or two<br />
that <strong>the</strong> dilution giving <strong>the</strong> largest td<br />
was equal to ln (17%) cells per well. Thus, as many as five <strong>of</strong> <strong>the</strong> 12<br />
cfu/well50 (Fig. 1). The calculated m was used in wells showing growth could have arisen from more<br />
<strong>the</strong> HPM to predict <strong>the</strong> time required to detect than one cell. This suggests that <strong>the</strong> S.D.<br />
L<br />
values<br />
growth from a defined number <strong>of</strong> cells where <strong>the</strong> must be considered only as estimates for single cells.<br />
6<br />
detection limit <strong>of</strong> <strong>the</strong> Bioscreen is 3.510 cfu/well. A more direct method (such as microscopic examina-<br />
The detection limit was confirmed by means <strong>of</strong> a tion) is needed to obtain accurate distributions <strong>of</strong><br />
calibration curve (data not shown). Fig. 1 shows that single cell tL<br />
values.<br />
©<br />
simulated values for t underestimated <strong>the</strong> ex- The simulation s<strong>of</strong>tware, ModelMaker , was used<br />
d<br />
perimental td<br />
by an amount equivalent to t<br />
L. Note to develop a <strong>combined</strong> discrete–continuous <strong>model</strong><br />
that for each dilution, tL<br />
was constant, thus was which can account for <strong>the</strong> behavior <strong>of</strong> individual<br />
independent <strong>of</strong> cell numbers. Replicate values <strong>of</strong> t cells, and is described in <strong>the</strong> diagram in Fig. 2. Note<br />
L<br />
were calculated from 20 wells by subtracting <strong>the</strong> that <strong>the</strong> various blocks in Fig. 2 are <strong>of</strong> different<br />
simulated value for td<br />
from <strong>the</strong> replicate experimen- shape depending on <strong>the</strong>ir function: compartment<br />
tal values, and <strong>the</strong> resulting mean tL<br />
and standard blocks are rectangular, and <strong>the</strong> values change with<br />
deviations (S.D. ) are given in Table 1 for two trials. time according to user-defined differential equations;<br />
L<br />
S.D.<br />
L<br />
values are based on ,20 wells giving growth; variable blocks have rounded ends, and values are<br />
in <strong>the</strong> two trials reported here 12 and 13 wells, calculated at each time interval according to userrespectively,<br />
showed growth.<br />
defined explicit equations; defined value blocks have<br />
The S.D.<br />
L<br />
values in trial A (Table 1) are based on pointed ends, and values are assigned at t0<br />
or at<br />
<strong>the</strong> supposition that all 12 wells showing growth particular times during <strong>the</strong> simulation; independent<br />
arise from a single cell. The probability <strong>of</strong> finding a<br />
event blocks are hexagonal, and are activated at a
R.C. McKellar, K. Knight / International Journal <strong>of</strong> Food Microbiology 54 (2000) 171 –180 175<br />
©<br />
Fig. 2. Discrete–continuous <strong>model</strong> designed with ModelMaker to simulate td<br />
and standard deviation <strong>of</strong> individual cell <strong>lag</strong> times (S.D.<br />
L)<br />
based on kinetic parameters derived from Bioscreen data.<br />
pre-defined time; and component event blocks are variation in individual cell <strong>lag</strong> times, t<br />
L, whereas<br />
square, and are activated in response to o<strong>the</strong>r com- S.D. refers to <strong>the</strong> variation between wells observed<br />
ponents in <strong>the</strong> <strong>model</strong>.<br />
with any defined number <strong>of</strong> cells per well.<br />
When <strong>the</strong> <strong>model</strong> run is initiated, <strong>the</strong> AssignLag The <strong>model</strong> described in Fig. 2 was extended to<br />
block (an independent event block activated at t<br />
0)<br />
allow <strong>the</strong> simulation <strong>of</strong> a complete growth curve.<br />
uses a random number generator based on a trun- The discrete adaptation function was retained, and<br />
cated (positive values only) normal distribution with <strong>combined</strong> with <strong>the</strong> HPM to provide <strong>the</strong> continuous<br />
mean tL and S.D.<br />
L<br />
from Table 1 to assign tL<br />
values growth function (Fig. 4). In this <strong>model</strong>, <strong>the</strong> Adaptato<br />
each <strong>of</strong> up to 64 cells. These values are stored in tion block moves one cell from <strong>the</strong> NonGrowing to<br />
<strong>the</strong> defined value Triggers block. The Adaptation <strong>the</strong> Growing compartment at each <strong>of</strong> <strong>the</strong> Trigger<br />
block reads <strong>the</strong>se values, and adds a single cell to <strong>the</strong> times. This preserves <strong>the</strong> initial number <strong>of</strong> cells in<br />
Growing compartment at each time corresponding to <strong>the</strong> <strong>model</strong>. The blocks to calculate <strong>the</strong> log <strong>of</strong> <strong>the</strong> cell<br />
an individual cell t<br />
L. Once in <strong>the</strong> Growing compart- numbers are provided to assist in <strong>the</strong> visualization <strong>of</strong><br />
ment, cells start growing immediately according to a <strong>the</strong> growth curve.<br />
logistic equation (McKellar, 1997):<br />
The output <strong>of</strong> this <strong>model</strong> for a total <strong>of</strong> 64 cells is<br />
shown in Fig. 5. Note that values <strong>of</strong> <strong>the</strong> <strong>the</strong> Growing<br />
dG G compartment are not shown where <strong>the</strong> number <strong>of</strong><br />
] 5 Gm S1 2 ]] D (4)<br />
dx N max<br />
cells was zero. These results show that <strong>the</strong> simulated<br />
values for <strong>the</strong> NonGrowing cells decreased as <strong>the</strong><br />
where G is <strong>the</strong> number <strong>of</strong> cells in <strong>the</strong> Growing numbers <strong>of</strong> Growing cells increased. When <strong>the</strong> total<br />
compartment and Nmax<br />
is <strong>the</strong> maximum population<br />
density.<br />
The LogGrowing block calculates <strong>the</strong> log cfu, and<br />
at each time increment <strong>the</strong> component event Monitor<br />
block tests to see if <strong>the</strong> value <strong>of</strong> LogGrowing has<br />
6<br />
exceeded <strong>the</strong> detection limit (defined as 3.510<br />
cfu/well). The defined value TimetoDetection block<br />
holds <strong>the</strong> calculated t<br />
d.<br />
The <strong>model</strong> in Fig. 2 was used to simulate values<br />
for td<br />
corresponding to up to 32 cells per well. The<br />
simulated S.D. values were derived from a total <strong>of</strong><br />
20 simulations for each <strong>of</strong> 1, 2, 4, 8, 16 or 32 cells<br />
per well. Fig. 3 shows that both <strong>the</strong> simulated td<br />
and<br />
S.D. values are in close agreement with <strong>the</strong> ex- Fig. 3. Comparison <strong>of</strong> t<br />
d<br />
(s) and S.D.<br />
L<br />
(h) from experimental<br />
perimental findings. Note that S.D. refers to <strong>the</strong> data (open symbols) or simulated data (closed symbols).<br />
L
176 R.C. McKellar, K. Knight / International Journal <strong>of</strong> Food Microbiology 54 (2000) 171 –180<br />
©<br />
Fig. 4. Discrete–continuous <strong>model</strong> designed with ModelMaker<br />
to simulate a complete bacterial growth curve.<br />
Fig. 5. Output <strong>of</strong> discrete–continuous <strong>model</strong> showing number <strong>of</strong><br />
cells present in <strong>the</strong> NonGrowing (s) and Growing (d) compartments,<br />
and <strong>the</strong> total <strong>of</strong> both compartments (h).<br />
(McKellar, 1997). The results in Table 2 show good<br />
agreement between <strong>the</strong> simulated growth curves<br />
based on Bioscreen data, and <strong>the</strong> actual growth<br />
curves derived from plate count data. Values for m<br />
were lower with <strong>the</strong> HPM (0.918–1.09) as compared<br />
to <strong>the</strong> Gompertz (1.03–1.26), and were similar for<br />
Bioscreen (0.918–1.26) and viable count data (1.03–<br />
1.26). The l values were larger with <strong>the</strong> Bioscreen<br />
as compared to viable counts, with <strong>the</strong> HPM giving<br />
shorter l times than <strong>the</strong> Gompertz with <strong>the</strong> exception<br />
<strong>of</strong> Trial D. Fig. 6 shows a comparison between one<br />
experimental and one simulated growth curve both fit<br />
with <strong>the</strong> Gompertz function. When discussing <strong>lag</strong><br />
times, it should be noted that <strong>the</strong> symbol l is<br />
reserved for <strong>the</strong> population <strong>lag</strong> <strong>phase</strong> duration calcu-<br />
lated from growth curves (ei<strong>the</strong>r viable count or<br />
number <strong>of</strong> cells in <strong>the</strong> <strong>model</strong> was calculated, <strong>the</strong><br />
Table 2<br />
resulting curve represents <strong>the</strong> transition from <strong>the</strong> <strong>lag</strong> Kinetic parameters for Listeria monocytogenes determined using<br />
<strong>phase</strong> to <strong>the</strong> exponential <strong>phase</strong>.<br />
non-linear regression<br />
The ability <strong>of</strong> <strong>the</strong> discrete–continuous <strong>model</strong> to<br />
a<br />
Trial Method Gompertz HPM<br />
simulate actual growth curves was fur<strong>the</strong>r tested by<br />
c d<br />
comparing <strong>the</strong> simulated output with growth curves<br />
m l m l<br />
derived from plate count data. Simulated growth A Bioscreen 1.26 6.55 1.09 5.86<br />
curves were created using <strong>the</strong> values for t and S.D. B Bioscreen 1.03 4.71 0.918 4.25<br />
L<br />
L<br />
C Counts 1.03 3.02 0.932 2.92<br />
from Table 1 (with N0 and Nmax being set at 64 and<br />
9<br />
D Counts 1.10 2.22 1.02 2.40<br />
10 cells, respectively), and were fit with <strong>the</strong> Gom- b<br />
Reference Counts 1.04 2.79 0.882 1.89<br />
pertz and <strong>the</strong> HPM (Table 2, trials A and B).<br />
a Heterogeneous population <strong>model</strong>.<br />
Experimental growth curves at 308C were also fit b Data taken from a previous study (McKellar, 1997).<br />
with <strong>the</strong> Gompertz and <strong>the</strong> HPM (Table 2, trials C<br />
c 21<br />
m, specific growth rate (h ).<br />
d<br />
and D). The reference trial is from a previous study l, Population <strong>lag</strong> <strong>phase</strong> duration (h).
R.C. McKellar, K. Knight / International Journal <strong>of</strong> Food Microbiology 54 (2000) 171 –180 177<br />
Fig. 8. Replicate simulations using <strong>the</strong> discrete–continuous <strong>model</strong><br />
Fig. 6. Comparison <strong>of</strong> simulated (s) and experimental (d)<br />
(Fig. 2) with three different random seed numbers for normal<br />
growth curves fit with <strong>the</strong> Gompertz function.<br />
(open symbols) and exponential (closed symbols) distributions. t d<br />
values were simulated for a total <strong>of</strong> 20 wells at each <strong>of</strong> 1, 2, 4, 8,<br />
16 or 32 cells per well, with tL<br />
and S.D.<br />
L<br />
values taken from trial A<br />
(Table 1).<br />
simulated) using a non-linear curve fitting routine,<br />
while <strong>the</strong> symbol tL<br />
refers to <strong>the</strong> mean individual cell<br />
<strong>lag</strong> times determined using <strong>the</strong> Bioscreen.<br />
or an exponential (Baranyi, 1998) distribution for 20<br />
The influence <strong>of</strong> <strong>the</strong> S.D. at constant t on <strong>the</strong> l replicate wells each containing 1, 2, 4, 8, 16 or 32<br />
L<br />
L<br />
is shown in Fig. 7. When <strong>the</strong> S.D. is small (open cells. A different random number seed was used for<br />
L<br />
circles) <strong>the</strong> adaptation is rapid, as all <strong>the</strong> cells adapt each replicate simulation. tL and S.D.<br />
L<br />
values (nor-<br />
at approximately <strong>the</strong> same time. As <strong>the</strong> S.D. L<br />
mal distributions) were taken from trial A in Table 1,<br />
increases to a maximum (open triangles), <strong>the</strong> number and tL<br />
values for <strong>the</strong> exponential distributions were<br />
<strong>of</strong> cells adapting earlier than <strong>the</strong> majority increases. adjusted lower in order to separate <strong>the</strong> two data sets.<br />
These cells quickly dominate, and <strong>the</strong> result is a Fig. 8 shows that, with an exponential distribution,<br />
shorter l.<br />
<strong>the</strong> td<br />
values deviate from linearity when <strong>the</strong> number<br />
The influence <strong>of</strong> distribution type was also ex- <strong>of</strong> cells per well ,4. Mean individual cell td<br />
values<br />
amined. Replicate simulations were performed with (1 cell per well) varied considerably depending on<br />
<strong>the</strong> discrete–continuous <strong>model</strong> using ei<strong>the</strong>r a normal <strong>the</strong> random number seed. In contrast, simulations<br />
using normal distributions were linear over <strong>the</strong> whole<br />
range <strong>of</strong> cell numbers, and random number seed had<br />
little apparent effect.<br />
4. Discussion<br />
Fig. 7. Effect on S.D.<br />
L<br />
on apparent population <strong>lag</strong> <strong>phase</strong> duration<br />
(l), where S.D.<br />
L<br />
is: 0.0 (s); 0.3 (d); 0.6 (h); 0.9 (j); and 1.2<br />
(^).<br />
A discrete–continuous <strong>model</strong> has been developed<br />
which improves our understanding <strong>of</strong> <strong>the</strong> behavior <strong>of</strong><br />
cells during <strong>the</strong> period <strong>of</strong> adaptation generally referred<br />
to as <strong>the</strong> ‘‘<strong>lag</strong> <strong>phase</strong>’’. In this <strong>model</strong> <strong>the</strong> <strong>lag</strong><br />
<strong>phase</strong> is described by two parameters, <strong>the</strong> mean<br />
individual cell <strong>lag</strong> time, t<br />
L, and <strong>the</strong> standard deviation<br />
<strong>of</strong> <strong>the</strong> variation between tL<br />
values, S.D.<br />
L. When<br />
<strong>the</strong>se two parameters are used with m, N<br />
0, and N<br />
max,<br />
a complete growth curve can be simulated. It should<br />
be noted that a key assumption <strong>of</strong> this <strong>model</strong> is that
178 R.C. McKellar, K. Knight / International Journal <strong>of</strong> Food Microbiology 54 (2000) 171 –180<br />
<strong>the</strong> tL<br />
is independent <strong>of</strong> cell number. The substance limited fitting <strong>of</strong> <strong>the</strong> discrete–continuous <strong>model</strong> to<br />
<strong>of</strong> <strong>the</strong> present study was presented previously (McK- experimental data, and will form <strong>the</strong> basis <strong>of</strong> a later<br />
ellar, 1998).<br />
publication.<br />
The present study also reports, for <strong>the</strong> first time, Baranyi and Pin (1999) have also recently pro<strong>the</strong><br />
inclusion <strong>of</strong> a discrete step into <strong>the</strong> <strong>model</strong>ing <strong>of</strong> posed a method for calculating l and m from t<br />
d.<br />
bacterial growth; all o<strong>the</strong>r published <strong>model</strong>s are Their method is based on <strong>the</strong> biological interpretabased<br />
on continuous functions only. This improve- tion <strong>of</strong> <strong>the</strong> initial physiological state <strong>of</strong> <strong>the</strong> cells,<br />
ment is critical to <strong>the</strong> <strong>model</strong>ing <strong>of</strong> single cell where <strong>the</strong> suitability for growth is represented by a<br />
behavior during <strong>the</strong> adaptation period prior to initia- fraction <strong>of</strong> <strong>the</strong> initial cell population. This interpretation<br />
<strong>of</strong> growth, and is facilitated by <strong>the</strong> use <strong>of</strong> an tion is similar to <strong>the</strong> one suggested by McKellar<br />
object-oriented programing environment such as (1997) who attributed <strong>the</strong> potential for growth to a<br />
®<br />
ModelMaker . Individual-based <strong>model</strong>s (IBMs) sub-population <strong>of</strong> <strong>the</strong> inoculum. The Baranyi and Pin<br />
have been used extensively in ecological <strong>model</strong>ing approach uses an analysis <strong>of</strong> variance (ANOVA)<br />
situations (Grimm, 1999; Lomnicki, 1999), but have method to deal with variability <strong>of</strong> low cell populayet<br />
to be applied in food microbiology. Providing a tions to estimate a value for m. Values for tL<br />
are<br />
dynamic environment for <strong>the</strong> simulation <strong>of</strong> bacterial calculated using <strong>the</strong> m and <strong>the</strong> physiological state <strong>of</strong><br />
growth based on <strong>the</strong> use <strong>of</strong> differential ra<strong>the</strong>r than <strong>the</strong> inoculum. In <strong>the</strong> present study, values for m are<br />
explicit equations is also considered important for estimated using a wider range <strong>of</strong> dilutions than<br />
<strong>the</strong> future development <strong>of</strong> bacterial growth <strong>model</strong>s reported by Baranyi and Pin, thus minimizing <strong>the</strong><br />
(Baranyi, 1997). Common s<strong>of</strong>tware packages which influence <strong>of</strong> higher variance.<br />
are generally used for non-linear regression do not Buchanan et al. (1997) describe <strong>the</strong> <strong>lag</strong> <strong>phase</strong> by<br />
have this capability, thus <strong>the</strong> use <strong>of</strong> s<strong>of</strong>tware such as <strong>the</strong> following equation:<br />
®<br />
ModelMaker leads to <strong>the</strong> development <strong>of</strong> more<br />
tLag 5 ta 1 t<br />
m<br />
complex <strong>model</strong>s incorporating <strong>the</strong> multiple steps<br />
(5)<br />
involved in adaptation and growth.<br />
where ta<br />
is <strong>the</strong> time required for <strong>the</strong> cells to adapt to<br />
A <strong>the</strong>oretical <strong>model</strong> which accounts for <strong>the</strong> be- <strong>the</strong>ir new environment, and tm<br />
is <strong>the</strong> generation time.<br />
havior <strong>of</strong> individual cells has been suggested by The present <strong>model</strong> assumes that growth starts imme-<br />
Buchanan et al. (1997), who were <strong>the</strong> first to propose diately after <strong>the</strong> adaptation step, thus t (this study)<br />
L<br />
that <strong>the</strong> transition between <strong>lag</strong> and exponential is equivalent to t<br />
a.<br />
<strong>phase</strong>s resulted from biological variation among<br />
Baranyi (1998) has recently compared stochastic<br />
and deterministic concepts <strong>of</strong> <strong>the</strong> <strong>lag</strong> <strong>phase</strong>, and has<br />
suggested that <strong>the</strong> l is always less than <strong>the</strong> t<br />
L. This<br />
individual cells. These workers provided a <strong>the</strong>oretical<br />
basis for <strong>describing</strong> <strong>the</strong> <strong>lag</strong> <strong>phase</strong> in terms <strong>of</strong><br />
individual cells; however, <strong>the</strong>y proposed a simpler, seems reasonable, since increased S.D.<br />
L<br />
at constant<br />
three-<strong>phase</strong> <strong>model</strong> for general use which did not tL<br />
resulted in a shorter l in <strong>the</strong> present study (Fig. 7)<br />
account for inter-cell variation. The present <strong>model</strong> and also in <strong>the</strong> @RISK simulations reported by<br />
builds on this foundation by <strong>the</strong> addition <strong>of</strong> tur- Buchanan et al. (1997). It is intuitively obvious that<br />
bidimetric data which provides evidence for indi- l can only be equal to tL<br />
in <strong>the</strong> special case where<br />
vidual cell behavior, and incorporates this variability <strong>the</strong> cells all adapt simultaneously (e.g., S.D.<br />
L50). In<br />
into <strong>the</strong> <strong>model</strong> as a distinct parameter (S.D.<br />
L).<br />
<strong>the</strong> present study using simulated growth curves, l<br />
Buchanan et al. (1997) used <strong>the</strong> risk analysis s<strong>of</strong>t- was greater than tL<br />
when determined by <strong>the</strong> Gom-<br />
ware, @RISKE, to simulate <strong>the</strong> variability between pertz function, and identical to tL<br />
in one <strong>of</strong> two trials<br />
cells, but fit only <strong>the</strong> three-<strong>phase</strong> linear <strong>model</strong> to using <strong>the</strong> HPM. This may be due to <strong>the</strong> inherent<br />
error associated with estimations <strong>of</strong> l from fitting<br />
data with non-linear regression functions. It is also<br />
worth mentioning that nei<strong>the</strong>r <strong>the</strong> Gompertz nor <strong>the</strong><br />
HPM are intended for fitting data derived from<br />
distributions <strong>of</strong> individual cell properties, since nei-<br />
<strong>the</strong>r <strong>of</strong> <strong>the</strong>se <strong>model</strong>s can account for changes in<br />
curvature between <strong>lag</strong> and exponential <strong>phase</strong>s under<br />
experimental data. Since <strong>the</strong> present <strong>model</strong> contains<br />
a random number generator, it was not possible to fit<br />
experimental data using <strong>the</strong> optimization algorithms<br />
®<br />
in ModelMaker , thus optimization must be performed<br />
manually. It will be possible, however, to<br />
construct tables <strong>of</strong> distributions with varied S.D.<br />
L<br />
which can be read into <strong>the</strong> <strong>model</strong>. This will allow
R.C. McKellar, K. Knight / International Journal <strong>of</strong> Food Microbiology 54 (2000) 171 –180 179<br />
<strong>the</strong> control <strong>of</strong> <strong>the</strong> S.D.<br />
L<br />
parameter. An example <strong>of</strong> possibility that some cells do not grow has not been<br />
this is evident in Fig. 6; <strong>the</strong> Gompertz function fit to considered. Thus <strong>the</strong> S.D.<br />
L<br />
must be considered an<br />
a discrete–continuous <strong>model</strong> simulation shows sys- estimate <strong>of</strong> <strong>the</strong> value for single cell variability. In<br />
tematic deviations. Systematic differences between l spite <strong>of</strong> this limitation, <strong>the</strong> discrete–continuous<br />
predicted by several <strong>model</strong>s including <strong>the</strong> three- <strong>model</strong> based on estimated tL<br />
and S.D.<br />
L<br />
values gives<br />
<strong>phase</strong> linear <strong>model</strong> <strong>of</strong> Buchanan and <strong>the</strong> Baranyi a good fit to <strong>the</strong> experimental data. More accurate<br />
<strong>model</strong> have been reported (Buchanan et al., 1997). estimates <strong>of</strong> single cell variance might be obtained<br />
These observations may even suggest that once using improved methods <strong>of</strong> single cell analysis (e.g.,<br />
individual cell behavior can be <strong>model</strong>ed accurately, microscopy).<br />
<strong>the</strong> traditional concept <strong>of</strong> population <strong>lag</strong> (l) as a<br />
<strong>model</strong>ing parameter will be <strong>of</strong> limited fur<strong>the</strong>r value<br />
to predictive microbiology.<br />
It is difficult to compare <strong>the</strong> discrete–continuous<br />
Acknowledgements<br />
<strong>model</strong> with <strong>the</strong> Baranyi <strong>model</strong> since <strong>the</strong> latter does The authors would like to thank J. Baranyi for<br />
not include a parameter <strong>describing</strong> <strong>the</strong> influence <strong>of</strong> helpful criticism <strong>of</strong> <strong>the</strong> manuscript.<br />
variation in tL<br />
on l. Baranyi (1998) has suggested<br />
that <strong>the</strong> mean population <strong>lag</strong> [l(N)] increases with<br />
lower inoculum, assuming tL<br />
values are exponentially<br />
distributed. In <strong>the</strong> present study a normal distribution<br />
References<br />
was assumed for t<br />
L, and with that <strong>the</strong>re was<br />
no evidence to support an increased t at lower Baranyi, J., 1997. Simple is good as long as it is enough. Food<br />
L<br />
Microbiol. 14, 189–192.<br />
inocula using ei<strong>the</strong>r simulations or experimental Baranyi, J., 1998. Comparison <strong>of</strong> stochastic and deterministic<br />
results. Additional simulations using exponential concepts <strong>of</strong> bacterial <strong>lag</strong>. J. Theor. Biol. 192, 403–408.<br />
ra<strong>the</strong>r than normal distributions for tL<br />
resulted in Baranyi, J., Pin, C., 1999. Estimating bacterial growth parameters<br />
predictions in which t values deviated from linearid<br />
by means <strong>of</strong> detection times. Appl. Environ. Microbiol. 65,<br />
ty, and changed depending on <strong>the</strong> random number 732–736.<br />
Baranyi, J., Roberts, T.A., 1994. A dynamic approach to predictseed.<br />
These simulations support <strong>the</strong> suggestion that ing bacterial growth in food. Int. J. Food Microbiol. 23,<br />
tL<br />
values are normally distributed. Fur<strong>the</strong>r experi- 277–294.<br />
ments are required to establish <strong>the</strong> correct distribu- Baranyi, J., Roberts, T.A., 1995. Ma<strong>the</strong>matics <strong>of</strong> predictive food<br />
tion.<br />
microbiology. Int. J. Food Microbiol. 26, 199–218.<br />
It must be emphasized that while <strong>the</strong> t decreases Breand, S., Fardel, G., Flandrois, J.P., Rosso, L., Tomassone, R.,<br />
d<br />
1997. A <strong>model</strong> <strong>describing</strong> <strong>the</strong> relationship between <strong>lag</strong> time<br />
with increasing cell number, <strong>the</strong> tL<br />
remains constant and mild temperature increase duration. Int. J. Food Microbiol.<br />
(Fig. 1). Similarly, S.D.<br />
L<br />
is constant, and <strong>the</strong> appar- 38, 157–167.<br />
ent decrease in variability between wells with in- Buchanan, R.L., Whiting, R.C., Damert, W.C., 1997. When is<br />
creasing cell numbers per well is a consequence <strong>of</strong> simple good enough: a comparison <strong>of</strong> <strong>the</strong> Gompertz, Baranyi,<br />
<strong>the</strong> majority <strong>of</strong> <strong>the</strong> cells having a t close to <strong>the</strong> and three-<strong>phase</strong> linear <strong>model</strong>s for fitting bacterial growth<br />
L<br />
curves. Food Microbiol. 14, 313–326.<br />
mean. As numbers <strong>of</strong> cells per well increase, <strong>the</strong> Chorin, E., Thuault, D., Cleret, J.J., Bourgeois, C.M., 1997.<br />
observed td<br />
for each well becomes less dependent on Modelling Bacillus cereus growth. Int. J. Food Microbiol. 38,<br />
<strong>the</strong> td<br />
for individual cells, and starts to reflect <strong>the</strong> 229–234.<br />
mean t value.<br />
Cuppers, H.G.A.M., Smelt, J.P.P.M., 1993. Time to turbidity<br />
d<br />
There are some limitations to <strong>the</strong> use <strong>of</strong> <strong>the</strong> measurement as a tool for <strong>model</strong>ing spoi<strong>lag</strong>e by Lactobacillus.<br />
J. Ind. Microbiol. 12, 168–171.<br />
Bioscreen for indirectly estimating single cell be- Dalgaard, P., Ross, T., Kamperman, L., Neumeyer, K., McMeekin,<br />
havior. It is difficult to clearly identify <strong>the</strong> dilution T.A., 1994. Estimation <strong>of</strong> bacterial growth rates from turcorresponding<br />
to single cells; it is assumed to be <strong>the</strong> bidimetric and viable count data. Int. J. Food Microbiol. 23,<br />
dilution giving <strong>the</strong> greatest average t . In addition, 391–404.<br />
d<br />
assuming that cells follow a Poisson distribution, Garthright, W.E., 1991. Refinements in <strong>the</strong> prediction <strong>of</strong> microbial<br />
growth curves. Food Microbiol. 8, 239–248.<br />
some wells which are assumed to have single cells Garthright, W.E., 1997. The three-<strong>phase</strong> linear <strong>model</strong> <strong>of</strong> bacterial<br />
might have two or more cells. Wells which show no growth: a response. Food Microbiol. 14, 193–195.<br />
growth are assumed to have no cells; however, <strong>the</strong> Gibson, A.M., Bratchell, N., Roberts, T.A., 1988. Predicting
180 R.C. McKellar, K. Knight / International Journal <strong>of</strong> Food Microbiology 54 (2000) 171 –180<br />
microbial growth: growth responses <strong>of</strong> salmonellae in a McKellar, R.C., 1997. A heterogeneous population <strong>model</strong> for <strong>the</strong><br />
laboratory medium as affected by pH, sodium chloride and analysis <strong>of</strong> bacterial growth kinetics. Int. J. Food Microbiol. 36,<br />
storage temperature. Int. J. Food Microbiol. 6, 155–178. 179–186.<br />
Grimm, V., 1999. Ten years <strong>of</strong> individual-based <strong>model</strong>ling in McKellar, R.C., 1998. A discrete adaptation <strong>model</strong> <strong>describing</strong> <strong>the</strong><br />
ecology: what have we learned and what could we learn in <strong>the</strong> <strong>lag</strong> <strong>phase</strong> <strong>of</strong> Listeria monocytogenes. 8th International Symfuture<br />
Ecol. Model. 115, 129–148.<br />
posium on Microbial Ecology.<br />
Hills, B.P., Mackey, B.M., 1995. Multi-compartment kinetic McMeekin, T.A., Olley, J.N., Ross, T., Ratkowsky, D.A., 1993.<br />
<strong>model</strong>s for injury, resuscitation, induced <strong>lag</strong> and growth in Predictive Microbiology – Theory and Application, Wiley,<br />
bacterial cell populations. Food Microbiol. 12, 333–346.<br />
New York.<br />
Hills, B.P., Wright, K.M., 1994. A new <strong>model</strong> for bacterial growth Miles, D.W., Ross, T., Olley, J., McMeekin, T.A., 1997. Developin<br />
heterogeneous systems. J. Theor. Biol. 168, 31–41.<br />
ment and evaluation <strong>of</strong> a predictive <strong>model</strong> for <strong>the</strong> effect <strong>of</strong><br />
Huchet, V., Thuault, D., Bourgeois, C.M., 1995. Development <strong>of</strong> a temperature and water activity on <strong>the</strong> growth rate <strong>of</strong> Vibrio<br />
<strong>model</strong> predicting <strong>the</strong> effects <strong>of</strong> pH, lactic acid, glycerol and parahaemolyticus. Int. J. Food Microbiol. 38, 133–142.<br />
sodium chloride content on <strong>the</strong> growth <strong>of</strong> vegetative cells <strong>of</strong> Neumeyer, K., Ross, T., McMeekin, T.A., 1997. Development <strong>of</strong><br />
Clostridium tyrobutyricum in a culture medium. Lait 75, 585– a predictive <strong>model</strong> to describe <strong>the</strong> effects <strong>of</strong> temperature and<br />
593. water activity on <strong>the</strong> growth <strong>of</strong> spoi<strong>lag</strong>e pseudomonads. Int. J.<br />
Hudson, J.A., 1994. Comparison <strong>of</strong> response surface <strong>model</strong>s for Food Microbiol. 38, 45–54.<br />
Listeria monocytogenes strains under aerobic conditions. Food Pin, C., Baranyi, J., 1998. Predictive <strong>model</strong>s as means to quantify<br />
Res. Int. 27, 53–59.<br />
<strong>the</strong> interactions <strong>of</strong> spoi<strong>lag</strong>e organisms. Int. J. Food Microbiol.<br />
Hudson, J.A., Mott, S.J., 1994. Comparison <strong>of</strong> <strong>lag</strong> times obtained 41, 59–72.<br />
from optical density and viable count data for a strain <strong>of</strong> Stephens, P.J., Joynson, J.A., Davies, K.W., Holbrook, R., Lappin-<br />
Pseudomonas fragi. J. Food Safety 14, 329–339.<br />
scott, H.M., Humphrey, T.J., 1997. The use <strong>of</strong> an automated<br />
Lomnicki, A., 1999. Individual-based <strong>model</strong>s and <strong>the</strong> individual- growth analyser to measure recovery times <strong>of</strong> single heatbased<br />
approach to population ecology. Ecol. Model. 115, 191– injured Salmonella cells. J. Appl. Microbiol. 83, 445–455.<br />
198. Willocx, F., Mercier, M., Hendrickx, M., Tobback, P., 1993.<br />
McClure, P.J., Cole, M.B., Davies, K.W., Anderson, W.A., 1993. Modelling <strong>the</strong> influence <strong>of</strong> temperature and carbon dioxide<br />
The use <strong>of</strong> automated tubidimetric data for <strong>the</strong> construction <strong>of</strong> upon <strong>the</strong> growth <strong>of</strong> Pseudomonas fluorescens. Food Microbiol.<br />
kinetic <strong>model</strong>s. J. Ind. Microbiol. 12, 277–285. 10, 159–173.