- Page 1 and 2: Forty is an important number. At fo
- Page 3 and 4: Singapore Technologies Engineering
- Page 5 and 6: Singapore Technologies Engineering
- Page 7 and 8: Singapore Technologies Engineering
- Page 9 and 10: Singapore Technologies Engineering
- Page 11 and 12: Singapore Technologies Engineering
- Page 13 and 14: Singapore Technologies Engineering
- Page 15 and 16: Singapore Technologies Engineering
- Page 17: Singapore Technologies Engineering
- Page 20 and 21: 18Group turnover, PBT and PATMI ros
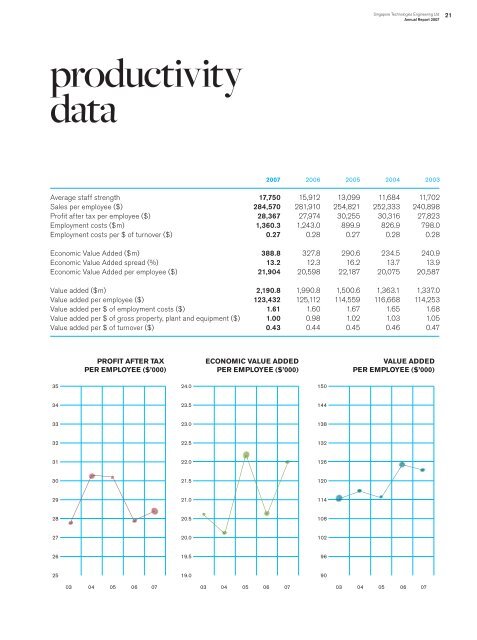
- Page 24 and 25: 22FY 07FY 06FY 05FY 04FY 03388.8327
- Page 26 and 27: 24The names of the directors holdin
- Page 28 and 29: 2678910111213Illustrated by Kristal
- Page 31 and 32: Singapore Technologies Engineering
- Page 33 and 34: Singapore Technologies Engineering
- Page 35 and 36: Singapore Technologies Engineering
- Page 37 and 38: Singapore Technologies Engineering
- Page 39 and 40: Singapore Technologies Engineering
- Page 41 and 42: Singapore Technologies Engineering
- Page 43 and 44: Singapore Technologies Engineering
- Page 45 and 46: Singapore Technologies Engineering
- Page 47 and 48: Singapore Technologies Engineering
- Page 49 and 50: Singapore Technologies Engineering
- Page 51 and 52: Singapore Technologies Engineering
- Page 53 and 54: Singapore Technologies Engineering
- Page 55 and 56: Singapore Technologies Engineering
- Page 57 and 58: 56 Group Overview57 Entering a New
- Page 59 and 60: Singapore Technologies Engineering
- Page 61 and 62: Singapore Technologies Engineering
- Page 63 and 64: Singapore Technologies Engineering
- Page 65 and 66: Singapore Technologies Engineering
- Page 68 and 69: 66ILLUSTRATION STYLEIllustrated by
- Page 70 and 71: 68ST Aerospace broke ground for STA
- Page 72 and 73:
70ILLUSTRATION STYLEIllustrated by
- Page 74 and 75:
72Digital animation projects fuelST
- Page 76 and 77:
Illustrated by Adeline Tan
- Page 78 and 79:
76ST Kinetics launched the hybridel
- Page 80 and 81:
78Illustrated by Don Low
- Page 82 and 83:
80(from left to right)Delivery of t
- Page 84 and 85:
82The Group’s diversified busines
- Page 86 and 87:
84i) Interest Rate RiskThe Group ha
- Page 88 and 89:
86Total Shareholder Return forST En
- Page 90 and 91:
88PROSPECTS FOR 2008The world econo
- Page 92 and 93:
90We, the undersigned directors, on
- Page 94 and 95:
92DIRECTORS’ INTERESTS IN SHARES
- Page 96 and 97:
94DIRECTORS’ INTERESTS IN SHARES
- Page 98 and 99:
96DIRECTORS’ INTERESTS IN SHARES
- Page 100 and 101:
98DIRECTORS’ INTERESTS IN SHARES
- Page 102 and 103:
100SHARE PLANS (continued)(a) Optio
- Page 104 and 105:
102AUDIT COMMITTEEThe Audit Committ
- Page 106 and 107:
104INDEPENDENT AUDITORS’ REPORT T
- Page 108 and 109:
106GroupNote 2007 2006$’000 $’0
- Page 110 and 111:
108Share Capital Other Retained Min
- Page 112 and 113:
1102007 2006$’000 $’000(Restate
- Page 114 and 115:
112Summary of effect on disposal of
- Page 116 and 117:
1142. SUMMARY OF SIGNIFICANT ACCOUN
- Page 118 and 119:
1162. SUMMARY OF SIGNIFICANT ACCOUN
- Page 120 and 121:
1182. SUMMARY OF SIGNIFICANT ACCOUN
- Page 122 and 123:
1202. SUMMARY OF SIGNIFICANT ACCOUN
- Page 124 and 125:
1222. SUMMARY OF SIGNIFICANT ACCOUN
- Page 126 and 127:
1242. SUMMARY OF SIGNIFICANT ACCOUN
- Page 128 and 129:
1262. SUMMARY OF SIGNIFICANT ACCOUN
- Page 130 and 131:
1282. SUMMARY OF SIGNIFICANT ACCOUN
- Page 132 and 133:
1303. SHARE CAPITAL (continued)The
- Page 134 and 135:
1323. SHARE CAPITAL (continued)(ii)
- Page 136 and 137:
1343. SHARE CAPITAL (continued)2006
- Page 138 and 139:
1363. SHARE CAPITAL (continued)(iii
- Page 140 and 141:
1383. SHARE CAPITAL (continued)Sing
- Page 142 and 143:
1405. OTHER RESERVES (continued)Gro
- Page 144 and 145:
1427. PROPERTY, PLANT AND EQUIPMENT
- Page 146 and 147:
1447. PROPERTY, PLANT AND EQUIPMENT
- Page 148 and 149:
1467. PROPERTY, PLANT AND EQUIPMENT
- Page 150 and 151:
1487. PROPERTY, PLANT AND EQUIPMENT
- Page 152 and 153:
1507. PROPERTY, PLANT AND EQUIPMENT
- Page 154 and 155:
1528. SUBSIDIARIES (continued)Effec
- Page 156 and 157:
1548. SUBSIDIARIES (continued)Effec
- Page 158 and 159:
1568. SUBSIDIARIES (continued)Count
- Page 160 and 161:
1588. SUBSIDIARIES (continued)Count
- Page 162 and 163:
1608. SUBSIDIARIES (continued)Count
- Page 164 and 165:
1628. SUBSIDIARIES (continued)Count
- Page 166 and 167:
1648. SUBSIDIARIES (continued)Name
- Page 168 and 169:
1669. ASSOCIATED COMPANIES AND JOIN
- Page 170 and 171:
1689. ASSOCIATED COMPANIES AND JOIN
- Page 172 and 173:
1709. ASSOCIATED COMPANIES AND JOIN
- Page 174 and 175:
17210. INVESTMENTSGroupNote 2007 20
- Page 176 and 177:
17411. INTANGIBLE ASSETS (continued
- Page 178 and 179:
17612. INVESTMENT PROPERTIESGroup20
- Page 180 and 181:
17813. LONG-TERM RECEIVABLES(b) Inc
- Page 182 and 183:
18015. DEFERRED TAX ASSETSGroup2007
- Page 184 and 185:
18218. DUE FROM RELATED CORPORATION
- Page 186 and 187:
18425. CREDITORS AND ACCRUALSGroupC
- Page 188 and 189:
18628. LEASE OBLIGATIONS (continued
- Page 190 and 191:
18832. LONG-TERM BANK LOANSEffectiv
- Page 192 and 193:
19037. PROFIT FROM CONTINUING OPERA
- Page 194 and 195:
19242. TAXATIONGroup2007 2006$’00
- Page 196 and 197:
19444. EARNINGS PER SHAREGroup2007
- Page 198 and 199:
19647. COMMITMENTS (continued)(d) I
- Page 200 and 201:
19849. SEGMENT INFORMATION (continu
- Page 202 and 203:
20049. SEGMENT INFORMATION (continu
- Page 204 and 205:
20250. FINANCIAL RISK MANAGEMENT OB
- Page 206 and 207:
20451. FAIR VALUE OF FINANCIAL INST
- Page 208 and 209:
20651. FAIR VALUE OF FINANCIAL INST
- Page 210 and 211:
20851. FAIR VALUE OF FINANCIAL INST
- Page 212 and 213:
21052. CAPITAL MANAGEMENTThe primar
- Page 214 and 215:
21253. COMPARATIVE FIGURES (continu
- Page 216 and 217:
214SHARE CAPITALPaid-Up Capital : S
- Page 218 and 219:
216STATEMENT OF PROFIT AND LOSS2007
- Page 220 and 221:
218STATEMENT OF CASH FLOWS2007 2006
- Page 222 and 223:
220FINANCIAL HIGHLIGHTS2007 2006 20
- Page 224 and 225:
222BALANCE SHEET2007 2006$’000 $
- Page 226 and 227:
224VALUE ADDED STATEMENT2007 2006 2
- Page 228 and 229:
226STATEMENT OF PROFIT AND LOSS2007
- Page 230 and 231:
228STATEMENT OF CASH FLOWS2007 2006
- Page 232 and 233:
230FINANCIAL HIGHLIGHTS2007 2006 20
- Page 234 and 235:
232BALANCE SHEET2007 2006$’000 $
- Page 236 and 237:
234VALUE ADDED STATEMENT2007 2006 2
- Page 238 and 239:
236Singapore Technologies Aerospace
- Page 240 and 241:
238ST Electronics (Satcom & Sensor
- Page 242 and 243:
240STSE Engineering Services Pte Lt
- Page 244 and 245:
Singapore Technologies Engineering
- Page 246 and 247:
IMPORTANT1. For investors who have
- Page 248 and 249:
surveylife begins atf rtyST ENGINEE
- Page 250:
SINGAPORE TECHNOLOGIES ENGINEERING