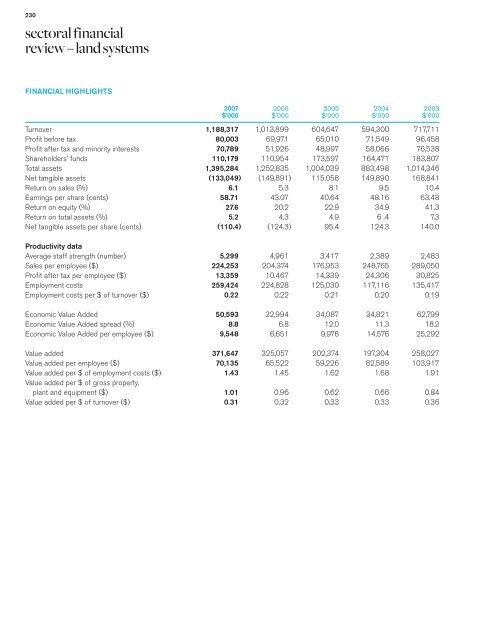
230FINANCIAL HIGHLIGHTS2007 2006 2005 2004 2003$’000 $’000 $’000 $’000 $’000Turnover 1,188,317 1,013,899 604,647 594,300 717,711Profit before tax 80,003 69,971 65,010 71,549 96,458Profit after tax and minority interests 70,789 51,926 48,997 58,066 76,538Shareholders’ funds 110,179 110,954 173,597 164,471 183,807Total assets 1,395,284 1,252,835 1,004,039 883,498 1,014,346Net tangible assets (133,049) (149,891) 115,058 149,890 168,841Return on sales (%) 6.1 5.3 8.1 9.5 10.4Earnings per share (cents) 58.71 43.07 40.64 48.16 63.48Return on equity (%) 27.6 20.2 22.9 34.9 41.3Return on total assets (%) 5.2 4.3 4.9 6 .4 7.3Net tangible assets per share (cents) (110.4) (124.3) 95.4 124.3 140.0Productivity dataAverage staff strength (number) 5,299 4,961 3,417 2,389 2,483Sales per employee ($) 224,253 204,374 176,953 248,765 289,050Profit after tax per employee ($) 13,359 10,467 14,339 24,306 30,825Employment costs 259,424 224,828 125,030 117,116 135,417Employment costs per $ of turnover ($) 0.22 0.22 0.21 0.20 0.19Economic Value Added 50,593 32,994 34,087 34,821 62,799Economic Value Added spread (%) 8.8 6.8 12.0 11.3 18.2Economic Value Added per employee ($) 9,548 6,651 9,976 14,576 25,292Value added 371,647 325,057 202,374 197,304 258,027Value added per employee ($) 70,135 65,522 59,226 82,589 103,917Value added per $ of employment costs ($) 1.43 1.45 1.62 1.68 1.91Value added per $ of gross property,plant and equipment ($) 1.01 0.96 0.62 0.66 0.84Value added per $ of turnover ($) 0.31 0.32 0.33 0.33 0.36
<strong>Singapore</strong> <strong>Technologies</strong> <strong>Engineering</strong> LtdAnnual Report 2007 231STATEMENT OF PROFIT AND LOSS2007 2006$’000 $’000Turnover 864,594 702,868Cost of sales (757,254) (602,581)Gross profit 107,340 100,287Other operating income 25,898 13,851Distribution and selling expenses (3,733) (5,532)Administration expenses (24,211) (20,067)Other operating expenses (6,188) (6,341)Profit from continuing operations before taxation,other income and financial expenses 99,106 82,198Other income, net 845 481Financial expenses (3,430) (3,519)96,521 79,160Share of results of associated companies and joint ventures 46 340Profit from continuing operations before taxation 96,567 79,500Taxation (21,303) (11,677)Profit from continuing operations after taxation 75,264 67,823Attributable to:Shareholder of the Company 75,264 67,823Minority interests – –75,264 67,823
- Page 1 and 2:
Forty is an important number. At fo
- Page 3 and 4:
Singapore Technologies Engineering
- Page 5 and 6:
Singapore Technologies Engineering
- Page 7 and 8:
Singapore Technologies Engineering
- Page 9 and 10:
Singapore Technologies Engineering
- Page 11 and 12:
Singapore Technologies Engineering
- Page 13 and 14:
Singapore Technologies Engineering
- Page 15 and 16:
Singapore Technologies Engineering
- Page 17:
Singapore Technologies Engineering
- Page 20 and 21:
18Group turnover, PBT and PATMI ros
- Page 22 and 23:
202007 2006 2005 2004 2003Sharehold
- Page 24 and 25:
22FY 07FY 06FY 05FY 04FY 03388.8327
- Page 26 and 27:
24The names of the directors holdin
- Page 28 and 29:
2678910111213Illustrated by Kristal
- Page 31 and 32:
Singapore Technologies Engineering
- Page 33 and 34:
Singapore Technologies Engineering
- Page 35 and 36:
Singapore Technologies Engineering
- Page 37 and 38:
Singapore Technologies Engineering
- Page 39 and 40:
Singapore Technologies Engineering
- Page 41 and 42:
Singapore Technologies Engineering
- Page 43 and 44:
Singapore Technologies Engineering
- Page 45 and 46:
Singapore Technologies Engineering
- Page 47 and 48:
Singapore Technologies Engineering
- Page 49 and 50:
Singapore Technologies Engineering
- Page 51 and 52:
Singapore Technologies Engineering
- Page 53 and 54:
Singapore Technologies Engineering
- Page 55 and 56:
Singapore Technologies Engineering
- Page 57 and 58:
56 Group Overview57 Entering a New
- Page 59 and 60:
Singapore Technologies Engineering
- Page 61 and 62:
Singapore Technologies Engineering
- Page 63 and 64:
Singapore Technologies Engineering
- Page 65 and 66:
Singapore Technologies Engineering
- Page 68 and 69:
66ILLUSTRATION STYLEIllustrated by
- Page 70 and 71:
68ST Aerospace broke ground for STA
- Page 72 and 73:
70ILLUSTRATION STYLEIllustrated by
- Page 74 and 75:
72Digital animation projects fuelST
- Page 76 and 77:
Illustrated by Adeline Tan
- Page 78 and 79:
76ST Kinetics launched the hybridel
- Page 80 and 81:
78Illustrated by Don Low
- Page 82 and 83:
80(from left to right)Delivery of t
- Page 84 and 85:
82The Group’s diversified busines
- Page 86 and 87:
84i) Interest Rate RiskThe Group ha
- Page 88 and 89:
86Total Shareholder Return forST En
- Page 90 and 91:
88PROSPECTS FOR 2008The world econo
- Page 92 and 93:
90We, the undersigned directors, on
- Page 94 and 95:
92DIRECTORS’ INTERESTS IN SHARES
- Page 96 and 97:
94DIRECTORS’ INTERESTS IN SHARES
- Page 98 and 99:
96DIRECTORS’ INTERESTS IN SHARES
- Page 100 and 101:
98DIRECTORS’ INTERESTS IN SHARES
- Page 102 and 103:
100SHARE PLANS (continued)(a) Optio
- Page 104 and 105:
102AUDIT COMMITTEEThe Audit Committ
- Page 106 and 107:
104INDEPENDENT AUDITORS’ REPORT T
- Page 108 and 109:
106GroupNote 2007 2006$’000 $’0
- Page 110 and 111:
108Share Capital Other Retained Min
- Page 112 and 113:
1102007 2006$’000 $’000(Restate
- Page 114 and 115:
112Summary of effect on disposal of
- Page 116 and 117:
1142. SUMMARY OF SIGNIFICANT ACCOUN
- Page 118 and 119:
1162. SUMMARY OF SIGNIFICANT ACCOUN
- Page 120 and 121:
1182. SUMMARY OF SIGNIFICANT ACCOUN
- Page 122 and 123:
1202. SUMMARY OF SIGNIFICANT ACCOUN
- Page 124 and 125:
1222. SUMMARY OF SIGNIFICANT ACCOUN
- Page 126 and 127:
1242. SUMMARY OF SIGNIFICANT ACCOUN
- Page 128 and 129:
1262. SUMMARY OF SIGNIFICANT ACCOUN
- Page 130 and 131:
1282. SUMMARY OF SIGNIFICANT ACCOUN
- Page 132 and 133:
1303. SHARE CAPITAL (continued)The
- Page 134 and 135:
1323. SHARE CAPITAL (continued)(ii)
- Page 136 and 137:
1343. SHARE CAPITAL (continued)2006
- Page 138 and 139:
1363. SHARE CAPITAL (continued)(iii
- Page 140 and 141:
1383. SHARE CAPITAL (continued)Sing
- Page 142 and 143:
1405. OTHER RESERVES (continued)Gro
- Page 144 and 145:
1427. PROPERTY, PLANT AND EQUIPMENT
- Page 146 and 147:
1447. PROPERTY, PLANT AND EQUIPMENT
- Page 148 and 149:
1467. PROPERTY, PLANT AND EQUIPMENT
- Page 150 and 151:
1487. PROPERTY, PLANT AND EQUIPMENT
- Page 152 and 153:
1507. PROPERTY, PLANT AND EQUIPMENT
- Page 154 and 155:
1528. SUBSIDIARIES (continued)Effec
- Page 156 and 157:
1548. SUBSIDIARIES (continued)Effec
- Page 158 and 159:
1568. SUBSIDIARIES (continued)Count
- Page 160 and 161:
1588. SUBSIDIARIES (continued)Count
- Page 162 and 163:
1608. SUBSIDIARIES (continued)Count
- Page 164 and 165:
1628. SUBSIDIARIES (continued)Count
- Page 166 and 167:
1648. SUBSIDIARIES (continued)Name
- Page 168 and 169:
1669. ASSOCIATED COMPANIES AND JOIN
- Page 170 and 171:
1689. ASSOCIATED COMPANIES AND JOIN
- Page 172 and 173:
1709. ASSOCIATED COMPANIES AND JOIN
- Page 174 and 175:
17210. INVESTMENTSGroupNote 2007 20
- Page 176 and 177:
17411. INTANGIBLE ASSETS (continued
- Page 178 and 179:
17612. INVESTMENT PROPERTIESGroup20
- Page 180 and 181:
17813. LONG-TERM RECEIVABLES(b) Inc
- Page 182 and 183: 18015. DEFERRED TAX ASSETSGroup2007
- Page 184 and 185: 18218. DUE FROM RELATED CORPORATION
- Page 186 and 187: 18425. CREDITORS AND ACCRUALSGroupC
- Page 188 and 189: 18628. LEASE OBLIGATIONS (continued
- Page 190 and 191: 18832. LONG-TERM BANK LOANSEffectiv
- Page 192 and 193: 19037. PROFIT FROM CONTINUING OPERA
- Page 194 and 195: 19242. TAXATIONGroup2007 2006$’00
- Page 196 and 197: 19444. EARNINGS PER SHAREGroup2007
- Page 198 and 199: 19647. COMMITMENTS (continued)(d) I
- Page 200 and 201: 19849. SEGMENT INFORMATION (continu
- Page 202 and 203: 20049. SEGMENT INFORMATION (continu
- Page 204 and 205: 20250. FINANCIAL RISK MANAGEMENT OB
- Page 206 and 207: 20451. FAIR VALUE OF FINANCIAL INST
- Page 208 and 209: 20651. FAIR VALUE OF FINANCIAL INST
- Page 210 and 211: 20851. FAIR VALUE OF FINANCIAL INST
- Page 212 and 213: 21052. CAPITAL MANAGEMENTThe primar
- Page 214 and 215: 21253. COMPARATIVE FIGURES (continu
- Page 216 and 217: 214SHARE CAPITALPaid-Up Capital : S
- Page 218 and 219: 216STATEMENT OF PROFIT AND LOSS2007
- Page 220 and 221: 218STATEMENT OF CASH FLOWS2007 2006
- Page 222 and 223: 220FINANCIAL HIGHLIGHTS2007 2006 20
- Page 224 and 225: 222BALANCE SHEET2007 2006$’000 $
- Page 226 and 227: 224VALUE ADDED STATEMENT2007 2006 2
- Page 228 and 229: 226STATEMENT OF PROFIT AND LOSS2007
- Page 230 and 231: 228STATEMENT OF CASH FLOWS2007 2006
- Page 234 and 235: 232BALANCE SHEET2007 2006$’000 $
- Page 236 and 237: 234VALUE ADDED STATEMENT2007 2006 2
- Page 238 and 239: 236Singapore Technologies Aerospace
- Page 240 and 241: 238ST Electronics (Satcom & Sensor
- Page 242 and 243: 240STSE Engineering Services Pte Lt
- Page 244 and 245: Singapore Technologies Engineering
- Page 246 and 247: IMPORTANT1. For investors who have
- Page 248 and 249: surveylife begins atf rtyST ENGINEE
- Page 250: SINGAPORE TECHNOLOGIES ENGINEERING