Europe in figures - Eurostat yearbook 2009 (with CD-ROM) - Europa
Europe in figures - Eurostat yearbook 2009 (with CD-ROM) - Europa
Europe in figures - Eurostat yearbook 2009 (with CD-ROM) - Europa

Create successful ePaper yourself
Turn your PDF publications into a flip-book with our unique Google optimized e-Paper software.
ISSN 1681-4789Statistical books<strong>Europe</strong> <strong>in</strong> <strong>figures</strong><strong>Eurostat</strong> <strong>yearbook</strong> <strong>2009</strong>(<strong>with</strong> <strong>CD</strong>-<strong>ROM</strong>)
Statistical books<strong>Europe</strong> <strong>in</strong> <strong>figures</strong><strong>Eurostat</strong> <strong>yearbook</strong> <strong>2009</strong>(<strong>with</strong> <strong>CD</strong>-<strong>ROM</strong>)
ForewordOfficial statistics play a fundamental role <strong>in</strong> today’s society. Public adm<strong>in</strong>istrations,policy-makers, economic operators, markets, researchers and citizensrely on high quality statistics to describe developments <strong>in</strong> the economic,social, environmental and cultural spheres as accurately as possible. Statisticalauthorities respond to the needs of these users who require easy and timelyaccess to such high quality <strong>in</strong>formation.Impartial and objective statistical <strong>in</strong>formation is essential <strong>in</strong> order to enablewell <strong>in</strong>formed decisions based on an accurate and relevant picture of society.Statistical <strong>in</strong>formation underp<strong>in</strong>s transparency and openness of policy decisions;official statistics therefore are a public good and a basis for the smoothfunction<strong>in</strong>g of democracy.At a <strong>Europe</strong>an level, statistics are <strong>in</strong>creas<strong>in</strong>gly important for the def<strong>in</strong>ition,implementation, monitor<strong>in</strong>g and evaluation of policies. <strong>Europe</strong> needs a plethoraof statistical data which meet the highest possible standards <strong>in</strong> terms of quality. For example, reliablestatistics are needed to assess macro-economic developments such as <strong>in</strong>flation, employment, governmentf<strong>in</strong>ances, economic growth and the bus<strong>in</strong>ess cycle <strong>in</strong> general: <strong>in</strong> order to facilitate economic policycoord<strong>in</strong>ation among Member States, which is especially important <strong>in</strong> the current economic situation; tokeep <strong>Europe</strong> on the path to susta<strong>in</strong>able development; and f<strong>in</strong>ally, to re<strong>in</strong>force a commitment to solidarityand social justice. <strong>Europe</strong>an statistics thus constitute an essential <strong>in</strong>formation tool that may helpmonitor <strong>Europe</strong>an Union strategic objectives, as well as susta<strong>in</strong><strong>in</strong>g underly<strong>in</strong>g policies and support<strong>in</strong>g<strong>in</strong>struments.<strong>Eurostat</strong>, the Statistical Office of the <strong>Europe</strong>an Communities, ensures the development, production anddissem<strong>in</strong>ation of harmonised statistics at <strong>Europe</strong>an level. <strong>Eurostat</strong> gets most of its data from the nationalstatistical authorities <strong>in</strong> the Member States. It then processes, analyses and publishes that data at a <strong>Europe</strong>anlevel, follow<strong>in</strong>g common statistical concepts, methods and standards. <strong>Eurostat</strong> also supports andencourages the development of similar statistical systems <strong>with</strong><strong>in</strong> countries neighbour<strong>in</strong>g the <strong>Europe</strong>anUnion, driv<strong>in</strong>g thereby a process of statistical harmonisation.This year, <strong>2009</strong>, is the <strong>Europe</strong>an year of Creativity and Innovation; therefore, the spotlight (open<strong>in</strong>g)chapter of this publication reflects this by focus<strong>in</strong>g on statistics relevant to these topics. I hope this publicationwill encourage you to use <strong>Eurostat</strong>’s data for your <strong>in</strong>formation needs and daily work. Pleaseconsult our website at http://ec.europa.eu/eurostat which offers you free access to nearly all <strong>Eurostat</strong> dataand publications.Walter RadermacherDirector-General, <strong>Eurostat</strong>
AcknowledgementsAcknowledgementsThe editor-<strong>in</strong>-chief and the editorial team of the <strong>Eurostat</strong> <strong>yearbook</strong> would like to thankall those who were <strong>in</strong>volved <strong>in</strong> its preparation. The <strong>yearbook</strong> could only be publishedthanks to the support of the follow<strong>in</strong>g colleagues:<strong>Eurostat</strong>, the Statistical Office of the <strong>Europe</strong>an CommunitiesDirectorate C: National and <strong>Europe</strong>an accountsC1 National accounts – methodology and analysis: Paul Konijn, Lars SvennebyeC2 National accounts – production: Jukka Jalava, Andreas Krüger, Jenny RunessonC3 Public f<strong>in</strong>ance: Lena Frej-OhlssonC4 Balance of payments: Franca Faes-Cannito, Merja Hult, Mushtaq Hussa<strong>in</strong>,Maria Isabel Lazaro, Luca PappalardoC5 Validation of public accounts: Peter Parlasca, Gilles Thouven<strong>in</strong>,John Verr<strong>in</strong>der, Monika WozowczykDirectorate D: Economic and regional statisticsD1 Key <strong>in</strong>dicators for <strong>Europe</strong>an policies: Graham Lock, Gian Luigi Mazzi,Rosa Ruggeri Cannata, Andrea Scheller, V<strong>in</strong>cent TronetD2 Regional <strong>in</strong>dicators and geographical <strong>in</strong>formation: Teodóra Brandmüller,Berthold Feldmann, Pedro Jorge Mart<strong>in</strong>s Ferreira, Baudou<strong>in</strong> Quennery,Åsa ÖnnerforsD3 Short-term statistics: Digna Amil, Anastassios Giannoplidis, Liselott ÖhmanD4 Price statistics: Tatiana Mrlianova, Christ<strong>in</strong>e WirtzDirectorate E: Agriculture and environment statistics; statistical cooperationE1 Farms, agro-environment and rural development: Cather<strong>in</strong>e Coyette,Johan SeleniusE2 Agricultural and fisheries statistics: Steffie Bos, Cél<strong>in</strong>e Ollier, Ole Olsen,Iulia Paula Pop, Franco ZampognaE3 Environmental statistics and accounts: Julio Cabeça, Jürgen Förster, Julie Hass,Christian Heidorn, Jean Kle<strong>in</strong>, Wilhelmus Kloek, Daniel Rase, Ute Roewer,Marilise Wolf-CrowtherEUROPE IN FIGURES — <strong>Eurostat</strong> <strong>yearbook</strong> <strong>2009</strong>3
AcknowledgementsDirectorate F: Social statistics and <strong>in</strong>formation societyF1 Demographic and migration statistics: Anthony Albert<strong>in</strong>elli, Veronica Cors<strong>in</strong>i,Piotr Juchno, Anne Herm, Gregor Kyi, Rosemarie Olsson, Giampaolo LanzieriF2 Labour market statistics: Luis Biedma, Simone Casali, Didier Dupré,Arturo de la Fuente Nuño, Sab<strong>in</strong>e Gagel, Ingo Kuhnert, Fabrice RomansF3 Liv<strong>in</strong>g conditions and social protection statistics: Teresa Bento, Peter Borg,Antonella Puglia, Laura Wahrig, Pascal WolffF4 Education, science and culture statistics: Bernard Felix, Sylva<strong>in</strong> Jouhette,Agnieszka Litwińska, Lene Mejer, Tomas Meri, Reni Petkova, Sergiu Pârvan,Fernando Reis, Veijo Ritola, Tomas Uhlar, Håkan WilenF5 Health and food safety statistics: Lucian Agafiței, Hartmut Buchow,Bart De Norre, Elodie CayotteF6 Information society and tourism statistics: Christophe Demunter,Giuseppe di Giacomo, Heidi Seybert, Ulrich Spörel, Albrecht WirthmannDirectorate G: Bus<strong>in</strong>ess statisticsG1 Structural bus<strong>in</strong>ess statistics: Aleksandra Stawińska, Brian WilliamsG2 International trade statistics – methodology and classifications: Aleš ČapekG3 International trade statistics – production: Gilberto Gamb<strong>in</strong>iG4 Energy statistics: Antigone GikasG5 Transport statistics: Giuliano Amer<strong>in</strong>i, Anna Białas-Motyl,Luis Antonio De La Fuente, Yves Mahieu, Jonas Noreland, Simo Pasi,Hans Strelow<strong>Europe</strong>an Free Trade Association (EFTA)Richard RagnarsonDirectorate-General for Translation of the <strong>Europe</strong>an CommissionOffice for official publications of the <strong>Europe</strong>an Communities4 EUROPE IN FIGURES — <strong>Eurostat</strong> <strong>yearbook</strong> <strong>2009</strong>
ContentsContentsIntroduction 8The <strong>Eurostat</strong> <strong>yearbook</strong> 8<strong>Eurostat</strong> – the Statistical Office of the <strong>Europe</strong>an Communities 12A practical guide to access<strong>in</strong>g <strong>Europe</strong>an statistics 141. Science, technology, <strong>in</strong>novation and entrepreneurship:<strong>2009</strong>, the year of creativity and <strong>in</strong>novation 211.1 Education 231.2 Research and development 301.3 Science and technology personnel 351.4 Innovation 431.5 Patents 531.6 Bus<strong>in</strong>ess start-ups and entrepreneurship 561.7 Factors of bus<strong>in</strong>ess success 622. Economy 652.1 National accounts 662.2 Government f<strong>in</strong>ances 832.3 Exchange rates and <strong>in</strong>terest rates 922.4 Wages and labour costs 972.5 Consumer prices and comparative price levels 1042.6 Balance of payments – current account 1112.7 Balance of payments – foreign direct <strong>in</strong>vestment 1162.8 Development aid 1213. Population 1273.1 EU population compared <strong>with</strong> other regions of the world 1283.2 EU-27 population 1333.3 Components of population change 1453.4 Families and births 1493.5 Life expectancy 1583.6 Migration and asylum 1624. Education 1754.1 School enrolment and levels of education 1774.2 Foreign language learn<strong>in</strong>g 1864.3 Tertiary education 1894.4 Lifelong learn<strong>in</strong>g and vocational tra<strong>in</strong><strong>in</strong>g 1964.5 Educational expenditure 201EUROPE IN FIGURES — <strong>Eurostat</strong> <strong>yearbook</strong> <strong>2009</strong>5
Contents5. Health 2055.1 Healthy life years 2065.2 Health problems 2095.3 Healthcare 2145.4 Causes of death and <strong>in</strong>fant mortality 2225.5 Safety at work 2296. Liv<strong>in</strong>g conditions and welfare 2336.1 Liv<strong>in</strong>g conditions 2346.2 Household consumption expenditure 2436.3 Hous<strong>in</strong>g 2526.4 Social protection 2546.5 Good governance 2617. Labour market 2657.1 People <strong>in</strong> the labour market – employment 2667.2 People <strong>in</strong> the labour market – unemployment 2787.3 Job vacancies 2857.4 Labour market policy <strong>in</strong>terventions 2888. Industry and services 2938.1 Bus<strong>in</strong>ess structures 2948.2 Industry and construction 3078.3 Services 3198.4 Tourism 3259. Agriculture, forestry and fisheries 3339.1 Agriculture – farm structure and land use 3349.2 Agricultural output, price <strong>in</strong>dices and <strong>in</strong>come 3419.3 Agricultural products 3479.4 Agriculture and the environment 3549.5 Forestry 3589.6 Fisheries 36410. External trade 37110.1 Share <strong>in</strong> world trade 37210.2 External trade <strong>in</strong> services 37510.3 External trade <strong>in</strong> goods 38411. Transport 39511.1 Modal breakdown 39611.2 Passenger transport 40011.3 Freight transport 4086 EUROPE IN FIGURES — <strong>Eurostat</strong> <strong>yearbook</strong> <strong>2009</strong>
Contents12. Environment 41512.1 Climate change 41612.2 Air pollution 42212.3 Water 42712.4 Waste 43312.5 Environment and economy 44012.6 Biodiversity 44513. Energy 44913.1 Energy production and imports 45013.2 Electricity generation 45813.3 Consumption of energy 46213.4 Energy prices 47014. Science and technology 47514.1 Personnel 47614.2 Expenditure 48614.3 Patents 49114.4 Information society 49514.5 Telecommunications 51015. <strong>Europe</strong>’s regions 51716. L<strong>in</strong>k<strong>in</strong>g statistics to <strong>Europe</strong>an policies 533Annexes 541NUTS (classification of territorial units for statistics) 541NACE Rev. 1.1 (classification of economic activities <strong>in</strong> the <strong>Europe</strong>an Community) 546SITC Rev. 4 (standard <strong>in</strong>ternational trade classification) 546ISCED (<strong>in</strong>ternational standard classification of education) 547Statistical symbols, abbreviations and acronyms 547Subject <strong>in</strong>dex 552Selection of <strong>Eurostat</strong> publications 559EUROPE IN FIGURES — <strong>Eurostat</strong> <strong>yearbook</strong> <strong>2009</strong>7
The <strong>Eurostat</strong> <strong>yearbook</strong>The <strong>Eurostat</strong> <strong>yearbook</strong><strong>Europe</strong> <strong>in</strong> <strong>figures</strong> – <strong>Eurostat</strong> <strong>yearbook</strong><strong>2009</strong> provides users of official statistics<strong>with</strong> an overview of the wealth of <strong>in</strong>formationthat is available on <strong>Eurostat</strong>’swebsite and <strong>with</strong><strong>in</strong> its onl<strong>in</strong>e databases. Itbelongs to a set of general compendiumpublications and, of these, it provides themost extensive set of analyses and detaileddata. <strong>Europe</strong> <strong>in</strong> <strong>figures</strong> has beenconceived as a publication that providesa balanced set of <strong>in</strong>dicators, <strong>with</strong> a broadcross-section of <strong>in</strong>formation.EUROSTAT DATA CODES – EASY ON-LINE ACCESS TO THE FRESHEST DATA<strong>Eurostat</strong> data codes (such as ‘tps00001’ and ‘nama_gdp_c’) (*) allow the reader toeasily access the most recent data on the <strong>Eurostat</strong> website. In this <strong>yearbook</strong> they aregiven below the tables and graphs (<strong>figures</strong>) <strong>in</strong> the source field whenever <strong>Eurostat</strong>data is presented.Note that the data on the website is frequently updated and may also be more detailedor be available <strong>in</strong> a variety of different measurement units. Please note alsothat this description presents the situation <strong>in</strong> February <strong>2009</strong> and that the brows<strong>in</strong>gtools described underneath are evolv<strong>in</strong>g. The latest <strong>in</strong>formation concern<strong>in</strong>g the datacode can be found on the <strong>Eurostat</strong> website at http://epp.eurostat.ec.europa.eu/portal/page/portal/publications/datacode.In the PDF version of this <strong>yearbook</strong> the reader is led directly to the relevant tablewhen click<strong>in</strong>g on a hyper-l<strong>in</strong>k formed by the data code <strong>in</strong> the source of each tableor figure. The brows<strong>in</strong>g tool for a collection of ma<strong>in</strong> tables is called TGM (Tables,Graphs and Maps), where data can be visualised <strong>with</strong> graphs and maps <strong>in</strong> addition toa standard, tabular presentation. For the other type of code, complete data sets canbe viewed us<strong>in</strong>g a brows<strong>in</strong>g tool called the Data Explorer.Readers of the paper version can access the tables either:• directly <strong>with</strong> the default brows<strong>in</strong>g tool (TGM or Data Explorer depend<strong>in</strong>gon the type (*) of data code) by us<strong>in</strong>g the l<strong>in</strong>k, http://ec.europa.eu/eurostat/product?code=&mode=view (where is to be replacedby the data code <strong>in</strong> question), or;• by choos<strong>in</strong>g a brows<strong>in</strong>g tool (TGM, Data Explorer, EVA, EVA Java) and thenselect<strong>in</strong>g which tools to use to filter and download <strong>in</strong>formation <strong>in</strong> variousformats (HTML, TAB, TXT, XML, DFT and TSV)) by us<strong>in</strong>g the l<strong>in</strong>k, http://ec.europa.eu/eurostat/product?code= (where is to be replacedby the data code <strong>in</strong> question).(*) There are two types of data codes:Ma<strong>in</strong> tables have 8-character data codes which consist of 3 or 5 letters – the first of which is‘t’ – followed by 5 or 3 digits, e.g. ‘tps00001’ and ‘tsdph220’.Other data sets are stored as complete databases and have data codes that use an underscore‘_’ <strong>with</strong><strong>in</strong> the syntax of the code, e.g. ‘nama_gdp_c’ and ‘proj_08c2150p’.8 EUROPE IN FIGURES — <strong>Eurostat</strong> <strong>yearbook</strong> <strong>2009</strong>
The <strong>Eurostat</strong> <strong>yearbook</strong>Structure of the publication<strong>Europe</strong> <strong>in</strong> <strong>figures</strong> is divided <strong>in</strong>to an <strong>in</strong>troduction,16 ma<strong>in</strong> chapters and a set ofannexes. The ma<strong>in</strong> chapters conta<strong>in</strong> dataand/or background <strong>in</strong>formation relat<strong>in</strong>gto particular topics, start<strong>in</strong>g <strong>with</strong> a spotlightchapter on creativity and <strong>in</strong>novation– the theme of the <strong>Europe</strong>an year <strong>2009</strong>.Each subchapter starts <strong>with</strong> an <strong>in</strong>troductionconta<strong>in</strong><strong>in</strong>g background <strong>in</strong>formationand policy relevance, followed by somedetails regard<strong>in</strong>g def<strong>in</strong>itions and dataavailability and then a commentary onthe ma<strong>in</strong> f<strong>in</strong>d<strong>in</strong>gs. The ma<strong>in</strong> focus of eachsubchapter is a set of tables and graphsthat have been selected to show the widevariety of data available for that particulartopic; often these <strong>in</strong>clude <strong>in</strong>formationon how important benchmark <strong>in</strong>dicatorshave developed dur<strong>in</strong>g recent years <strong>with</strong><strong>in</strong>the EU, its Member States and the euroarea. Users will f<strong>in</strong>d a great deal more <strong>in</strong>formationwhen consult<strong>in</strong>g the <strong>Eurostat</strong>website, which conta<strong>in</strong>s subject-specificpublications and onl<strong>in</strong>e databases. Theannexes at the end of the publicationconta<strong>in</strong> details of classifications, a list ofstatistical symbols, abbreviations and acronyms,and a subject <strong>in</strong>dex.<strong>CD</strong>-<strong>ROM</strong> and web files on the<strong>Eurostat</strong> websiteThe paper version of the <strong>yearbook</strong> is accompaniedby a <strong>CD</strong>-<strong>ROM</strong> which conta<strong>in</strong>sthe full <strong>yearbook</strong> content <strong>in</strong> PDFformat, as well as all tables and graphs<strong>in</strong> Excel spreadsheet format. In addition,the <strong>Eurostat</strong> website dedicates a specificsection to the <strong>yearbook</strong>, which conta<strong>in</strong>sthe PDF version of the publication as wellas all tables and graphs <strong>in</strong> Excel format.The PDF version of the publication allowsdirect access to all databases used <strong>in</strong> theproduction of tables and graphs (http://epp.eurostat.ec.europa.eu/portal/page/portal/publications/eurostat_<strong>yearbook</strong>).Data extraction, coverageand presentationThe statistical data presented <strong>in</strong> the <strong>yearbook</strong>were extracted dur<strong>in</strong>g September2008 and represent data availability atthat time. The accompany<strong>in</strong>g text wasdrafted dur<strong>in</strong>g September and October2008.In time-series, the data are generally presentedfor the latest 11 years for which <strong>in</strong>formationis available. Longer time-serieswill usually be available when consult<strong>in</strong>g<strong>Eurostat</strong>’s onl<strong>in</strong>e databases. Please notethat the <strong>Eurostat</strong> website is constantlyupdated, therefore new data becomesavailable dur<strong>in</strong>g the production of thispublication. Often, due to its complexnature, the data production or collectionmight require longer periods between thereference period of the data and the dataavailability. Please consult the <strong>Eurostat</strong>website for more <strong>in</strong>formation on the productioncalendar (normally vary<strong>in</strong>g bydata set).The tables and graphs generally show allof the country <strong>in</strong>formation that has beencollected for each particular <strong>in</strong>dicator.This publication generally presents <strong>in</strong>formationfor the 27 Member States of theEU (EU-27), the euro area (based on 15members), as well as the <strong>in</strong>dividual MemberStates. The EU-27 and euro area aggregatesare only provided when <strong>in</strong>formationfor all of the countries is available, orif an estimate has been made for miss<strong>in</strong>g<strong>in</strong>formation. Any partial totals that arecreated are systematically footnoted <strong>with</strong>respect to the miss<strong>in</strong>g components of thegeographical aggregate <strong>in</strong> question.EUROPE IN FIGURES — <strong>Eurostat</strong> <strong>yearbook</strong> <strong>2009</strong>9
The <strong>Eurostat</strong> <strong>yearbook</strong>Information on EU policies andother activitiesThe <strong>yearbook</strong> aims at provid<strong>in</strong>g statistical<strong>in</strong>formation on the <strong>Europe</strong>an Union,its Member States and some other countries.It also provides <strong>in</strong>formation on relatedEU policies and activities. Such <strong>in</strong>formationdoes not necessarily reflect theofficial views of <strong>Eurostat</strong> or the <strong>Europe</strong>anCommission. Further <strong>in</strong>formation aboutsuch policies and activities may be foundon the website of the <strong>Europe</strong>an Commissionat http://ec.europa.eu.Statistical symbolsStatistical data are often accompanied byadditional <strong>in</strong>formation <strong>in</strong> the form of statisticalsymbols (also called ‘flags’) to <strong>in</strong>dicatemiss<strong>in</strong>g <strong>in</strong>formation or some othermeta-data. In this <strong>yearbook</strong>, the use ofstatistical symbols has been restricted toa m<strong>in</strong>imum. The follow<strong>in</strong>g symbols are<strong>in</strong>cluded where necessary:Italic Value is a forecast, provisional oran estimate and is therefore likelyto change: Not available, confidential or unreliablevalue– Not applicable or zero by default0 Less than half the f<strong>in</strong>al digit shownand greater than real zeroBreaks <strong>in</strong> series are <strong>in</strong>dicated <strong>in</strong> thefootnotes provided <strong>with</strong> each table andgraph.In the case of the EU Member States, evenwhen data are not available, all countrieshave been <strong>in</strong>cluded <strong>in</strong> tables (use hasbeen made of the colon (:) to <strong>in</strong>dicate thatdata are not available), while <strong>in</strong> graphsfootnotes are used to <strong>in</strong>dicate thosecountries for which data are not available.For non-member countries outsideof the EU, when data are not availablefor a particular <strong>in</strong>dicator the country hasbeen removed from the table or graph <strong>in</strong>question.EUROPE IN FIGURES — <strong>Eurostat</strong> <strong>yearbook</strong> <strong>2009</strong>11
<strong>Eurostat</strong> – the Statistical Office of the <strong>Europe</strong>an Communities<strong>Eurostat</strong> – the Statistical Officeof the <strong>Europe</strong>an Communities<strong>Eurostat</strong> is the Statistical Office of the <strong>Europe</strong>anCommunities, situated <strong>in</strong> Luxembourg.Its task is to provide the <strong>Europe</strong>anUnion (EU) <strong>with</strong> statistics at a <strong>Europe</strong>anlevel that enable comparisons betweencountries and regions. <strong>Eurostat</strong>’s missionis ‘to provide the <strong>Europe</strong>an Union <strong>with</strong>a high-quality statistical <strong>in</strong>formationservice’. To meet this challenge, <strong>Eurostat</strong>aims:• to implement a set of standards,methods and organisational structureswhich allow comparable, reliable andrelevant statistics to be producedthroughout the Community, <strong>in</strong> l<strong>in</strong>e<strong>with</strong> the pr<strong>in</strong>ciples of the <strong>Europe</strong>anstatistics code of practice;• to provide the <strong>Europe</strong>an <strong>in</strong>stitutionsand the governments of the MemberStates <strong>with</strong> the <strong>in</strong>formation neededto implement, monitor and evaluateCommunity policies;• to dissem<strong>in</strong>ate statistics to the<strong>Europe</strong>an public and enterprises andto all economic and social agents<strong>in</strong>volved <strong>in</strong> decision-mak<strong>in</strong>g, and;• to facilitate the improvement of thestatistical systems of the MemberStates and support develop<strong>in</strong>gcountries, as well as the countriesmov<strong>in</strong>g towards a market economy.As one of the Directorate-Generals of the<strong>Europe</strong>an Commission, <strong>Eurostat</strong> is headedby a Director-General. Under him areseven Directors responsible for differentareas of activity (Directorates as of November2008):• A. Resources;• B. Statistical methods and tools;dissem<strong>in</strong>ation;• C. National and <strong>Europe</strong>an accounts;• D. Economic and regional statistics;• E. Agriculture and environmentstatistics; statistical cooperation;• F. Social statistics and <strong>in</strong>formationsociety;• G. Bus<strong>in</strong>ess statistics.In 2008, <strong>Eurostat</strong> had around 890 posts;of these some 75 % were civil servants,8 % were seconded national experts,and 17 % had other types of contract.<strong>Eurostat</strong>’s executed budget was aroundEUR 66 million <strong>in</strong> 2008 (exclud<strong>in</strong>g costsof statutory staff and adm<strong>in</strong>istrative expenses)of which EUR 48 million werebudgeted for the implementation of thestatistical programme. In addition, abudget of EUR 18 million was sub-delegatedto <strong>Eurostat</strong> by other Directorates-General.12 EUROPE IN FIGURES — <strong>Eurostat</strong> <strong>yearbook</strong> <strong>2009</strong>
<strong>Eurostat</strong> – the Statistical Office of the <strong>Europe</strong>an CommunitiesS<strong>in</strong>ce the early days of the <strong>Europe</strong>anCommunities, there was a realisationthat the plann<strong>in</strong>g and implementationof Community policies must be basedon reliable and comparable statistics. Asa result, the <strong>Europe</strong>an statistical system(ESS) was built-up gradually to providecomparable statistics at an EU level. Forthis purpose, <strong>Eurostat</strong> does not workalone. The ESS comprises <strong>Eurostat</strong> andthe statistical offices, m<strong>in</strong>istries, agenciesand central banks that collect official statistics<strong>in</strong> the EU Member States, Iceland,Liechtenste<strong>in</strong>, Norway and Switzerland(you can f<strong>in</strong>d the contact details and Internetaddresses of all members of theESS by choos<strong>in</strong>g the l<strong>in</strong>k to the ‘<strong>Europe</strong>anStatistical System (ESS)’ from the listof activities presented on the right-handmenu of the <strong>Eurostat</strong> homepage and thenselect<strong>in</strong>g the l<strong>in</strong>k to ‘National StatisticalInstitutes’).The ESS functions as a network <strong>in</strong> which<strong>Eurostat</strong>’s role is to lead the way <strong>in</strong> theharmonisation of statistics <strong>in</strong> close cooperation<strong>with</strong> the national statisticalauthorities. At the heart of the ESS is theStatistical Programme Committee (SPC),which br<strong>in</strong>gs together the heads of MemberStates’ national statistical offices andis chaired by <strong>Eurostat</strong>. The SPC discussesjo<strong>in</strong>t actions and programmes to be carriedout to meet EU <strong>in</strong>formation requirements.It agrees a five-year programme,which is implemented by the national authoritiesand monitored by <strong>Eurostat</strong>.Information for a modern society –impartiality and objectivityTo actively participate <strong>in</strong> a democratic<strong>Europe</strong>, public adm<strong>in</strong>istrations, researchers,trade unions, bus<strong>in</strong>esses and politicalparties, among others, need high-quality,impartial, reliable and comparablestatistical data. These actors need to beable to access data <strong>with</strong>out exclusion: <strong>in</strong>other words, no key <strong>in</strong>formation shouldbe <strong>with</strong>held from particular citizens, enterprisesor public bodies. Rather, each ofthese should have equal access to the dataavailable. <strong>Eurostat</strong> and its partners <strong>in</strong> theESS provide equal opportunities to accessa wide range of comprehensive <strong>in</strong>formationon social, economic and environmentaldevelopments <strong>in</strong> <strong>Europe</strong>, throughprovid<strong>in</strong>g free access to data on the <strong>Eurostat</strong>website.Today’s <strong>in</strong>formation society is characterisedby the rapid transfer and sheerscale of data flows. While access to andthe transfer of <strong>in</strong>formation has grownexponentially, the reliability of <strong>in</strong>formationcannot always be guaranteed. Accessto reliable and high-quality statistics and<strong>Eurostat</strong>’s obligation for trustworth<strong>in</strong>essis enshr<strong>in</strong>ed <strong>in</strong> law, as Article 285(2) ofthe EC Treaty says: ‘The production ofCommunity statistics shall conform toimpartiality, reliability, objectivity, scientific<strong>in</strong>dependence, cost-effectivenessand statistical confidentiality; it shall notentail excessive burdens on economic operators’.These are pr<strong>in</strong>ciples upon which<strong>Eurostat</strong>’s day-to-day work is based.EUROPE IN FIGURES — <strong>Eurostat</strong> <strong>yearbook</strong> <strong>2009</strong>13
A practical guide to access<strong>in</strong>g <strong>Europe</strong>an statisticsA practical guide to access<strong>in</strong>g<strong>Europe</strong>an statisticsIt is easier for people to understand eachother if they know about each other’s conditionsof life and work, and they have <strong>in</strong>formationon trends that are develop<strong>in</strong>g<strong>with</strong><strong>in</strong> society as a whole. Comparisons,however, require comparable statisticsthat, <strong>in</strong> turn, demand the use of a common‘statistical language’. This commonlanguage has to embrace concepts, methodsand def<strong>in</strong>itions, as well as technicalstandards and <strong>in</strong>frastructures, often referredto by statisticians as harmonisation.This is <strong>Eurostat</strong>’s raison d’être – andsums up what the ESS is all about.The data that are collected, harmonisedand reported upon by <strong>Eurostat</strong> have beenagreed through a well-def<strong>in</strong>ed politicalprocess at the <strong>Europe</strong>an level <strong>in</strong> whichthe Member States are deeply <strong>in</strong>volved.Most surveys and data collection exercisesare based on <strong>Europe</strong>an regulationsor directives that are legally b<strong>in</strong>d<strong>in</strong>g.The simplest way of access<strong>in</strong>g <strong>Eurostat</strong>’sbroad range of statistical <strong>in</strong>formationis through the <strong>Eurostat</strong> website (http://ec.europa.eu).<strong>Eurostat</strong> provides users <strong>with</strong> free accessto its Internet databases and all of itspublications <strong>in</strong> PDF format. The websiteis updated twice daily and provides directaccess to the latest and most comprehensivestatistical <strong>in</strong>formation available onthe EU, its Member States, its candidatecountries and EFTA countries. The <strong>in</strong>formationpublished on the website isavailable <strong>in</strong> German, English and French.<strong>Eurostat</strong> is cont<strong>in</strong>uously work<strong>in</strong>g on improvementsto the website <strong>in</strong> terms offunctionality and design.For full access to all of the services availablethrough the website, it is recommendedthat users should take a few momentsto register from the homepage. Registrationis free of charge and allows access to:• tailor-made e-mail alerts <strong>in</strong>form<strong>in</strong>gyou of new publications as soon asthey are onl<strong>in</strong>e;• access enhanced functionalities ofthe databases (save queries and makebulk downloads).14 EUROPE IN FIGURES — <strong>Eurostat</strong> <strong>yearbook</strong> <strong>2009</strong>
A practical guide to access<strong>in</strong>g <strong>Europe</strong>an statisticsThe <strong>in</strong>formation on the website is structuredaccord<strong>in</strong>g to a set of ‘themes’, whichmay be accessed from the menu bar of thehomepage, provid<strong>in</strong>g access to:• general and regional statistics;• economy and f<strong>in</strong>ance;• population and social conditions;• <strong>in</strong>dustry, trade and services;• agriculture and fisheries;• external trade;• transport;• environment and energy;• science and technology.With<strong>in</strong> each of these themes the user is<strong>in</strong>itially presented <strong>with</strong> the possibilityof access<strong>in</strong>g <strong>in</strong>formation relat<strong>in</strong>g to tables,data(bases), methodology or publications,by means of a series of tabbedpages. Those users who are not able tolimit their search by statistical theme canenter the website through a series of tabson the homepage which provide access tothe full range of tables, data, methodologyand publications.Tables, graphs and maps (TGM)The most important <strong>in</strong>dicators may befound <strong>in</strong> the form of tables, graphs andmaps. They can be accessed through the<strong>Eurostat</strong> database or from the homepagefor each of the n<strong>in</strong>e statistical themes detailedabove. Ma<strong>in</strong> tables are generallypresented for a s<strong>in</strong>gle <strong>in</strong>dicator, <strong>with</strong> <strong>Europe</strong>anaggregates and data for the MemberStates on the y-axis and time on thex-axis (they can be accessed by click<strong>in</strong>gon this icon, ). The data are selectedfrom key EU policy <strong>in</strong>dicators, <strong>in</strong>clud<strong>in</strong>gshort-term economic data, long-term<strong>in</strong>dicators, structural <strong>in</strong>dicators, and susta<strong>in</strong>abledevelopment <strong>in</strong>dicators. The newtables, graphs and maps <strong>in</strong>terface (TGM)allows, <strong>in</strong> addition to tables, for customisablegraphs and maps of the same <strong>in</strong>dicators(the <strong>in</strong>terface can be accessed byclick<strong>in</strong>g on this icon, ).Some of the most important <strong>in</strong>dicatorsthat are produced <strong>in</strong> this format are listedbelow. Chapter 16 ‘L<strong>in</strong>k<strong>in</strong>g statistics to<strong>Europe</strong>an policies’ gives more <strong>in</strong>formationon some of these <strong>in</strong>dicators.Euro-Indicators – this is a collectionof the freshest, monthly and quarterlydata, used to evaluate the economicsituation <strong>with</strong><strong>in</strong> the euro area and theEU. Euro-Indicators are updated dailyand the publication of key <strong>figures</strong> is announcedas part of <strong>Eurostat</strong>’s release calendar(1) and is available on the <strong>Eurostat</strong>website at: http://ec.europa.eu/eurostat/euro<strong>in</strong>dicators.Structural <strong>in</strong>dicators – these are usedto assess the longer-term progress be<strong>in</strong>gmade <strong>with</strong><strong>in</strong> the EU <strong>in</strong> the doma<strong>in</strong>s ofemployment, <strong>in</strong>novation and research,economic reform, social cohesion, andthe environment, as well as the generaleconomic background; they are most relevantfor political debate <strong>with</strong> respect tothe revised Lisbon objectives.Susta<strong>in</strong>able development <strong>in</strong>dicators –a susta<strong>in</strong>able development strategy wasadopted by the <strong>Europe</strong>an Council <strong>in</strong>Gothenburg <strong>in</strong> June 2001, and renewed <strong>in</strong>June 2006; it aims to reconcile economicdevelopment, social cohesion and protectionof the environment. Monitor<strong>in</strong>gprogress towards this goal is an essentialpart of the strategy, while a parallelobjective is to <strong>in</strong>form the general publicabout progress <strong>in</strong> atta<strong>in</strong><strong>in</strong>g the commonlyagreed objectives of susta<strong>in</strong>abledevelopment.(1) http://epp.eurostat.ec.europa.eu/portal/pls/portal/ddis.release_calendar.xml.EUROPE IN FIGURES — <strong>Eurostat</strong> <strong>yearbook</strong> <strong>2009</strong>15
A practical guide to access<strong>in</strong>g <strong>Europe</strong>an statisticsThe bus<strong>in</strong>ess cycle clock – the bus<strong>in</strong>esscycle clock (BCC) is a new <strong>in</strong>teractive ITtool that shows how many economic <strong>in</strong>dicatorsevolve <strong>in</strong> close proximity to oneanother. Mov<strong>in</strong>g as a ’cloud’ of <strong>in</strong>dicators,some have a clear lead <strong>in</strong> development –e.g. economic sentiment – whereas otherslag beh<strong>in</strong>d. These and other dynamicpatterns can be visually observed, andcan help the user to understand today’sand yesterday’s economics. The BCC toolcan be consulted via the follow<strong>in</strong>g l<strong>in</strong>k:http://epp.eurostat.ec.europa.eu/cache/BCC2.Country profiles <strong>in</strong>terface – this offersthe possibility to visualise majorstatistical <strong>in</strong>dicators, of differentcountries and/or EU aggregates, <strong>in</strong> auser-friendly map-based presentation(regional data should be available afterthe summer of <strong>2009</strong>). The <strong>in</strong>terfacecan be accessed via the follow<strong>in</strong>g l<strong>in</strong>k:http://epp.eurostat.ec.europa.eu/cache/BCC2.DataMore detailed statistics and larger volumesof data can be downloaded fromdatabases. The easiest way to accessthese is to use the new data explorer( ) that provides an <strong>in</strong>tuitive way to selectand organise data. Alternatively, userscan click on the follow<strong>in</strong>g icon ( )to select <strong>in</strong>formation of <strong>in</strong>terest througha number of selection screens for eachdimension of the data set; the data canbe extracted <strong>in</strong> a variety of formats (textfiles, HTML, Excel, etc.). Databases canbe accessed via the follow<strong>in</strong>g l<strong>in</strong>k onthe <strong>Eurostat</strong> homepage: http://epp.eurostat.ec.europa.eu/portal/page/portal/statistics/search_database.Reference metadataFrom December 2008 onwards, the ESMS(Euro SDMX Metadata Structure) is progressivelybe<strong>in</strong>g used to replace the SDDSformat. This new format is based on aStatistical Data and Metadata eXchange<strong>in</strong>itiative (SDMX), carried out by seven<strong>in</strong>ternational organisations at a worldwidelevel, which was adopted <strong>in</strong> January<strong>2009</strong>. The ESMS uses a subset of 21 crossdoma<strong>in</strong> concepts (plus sub-concepts) andwill become the new standard for referencemetadata <strong>in</strong> the <strong>Europe</strong>an StatisticalSystem. It also puts more emphasis onquality-related <strong>in</strong>formation (conta<strong>in</strong><strong>in</strong>gconcepts such as accuracy, comparability,coherence and timel<strong>in</strong>ess).Reference Metadata may be accessed eitherfrom the head<strong>in</strong>g ‘Reference Metadata’or directly from the data navigationtree, where an icon ( ) is used to signifythe availability of additional metadata<strong>in</strong>formation.For more <strong>in</strong>formation on SDMX, pleaserefer to: http://www.sdmx.org/.16 EUROPE IN FIGURES — <strong>Eurostat</strong> <strong>yearbook</strong> <strong>2009</strong>
A practical guide to access<strong>in</strong>g <strong>Europe</strong>an statisticsPublications<strong>Eurostat</strong> produces a variety of publications,both for non-experts and specialists.All of these are available on the<strong>Eurostat</strong> website <strong>in</strong> PDF format, free ofcharge. As <strong>with</strong> the data, the publicationsare organised under <strong>Eurostat</strong>’s n<strong>in</strong>e statisticalthemes. There are a variety of differenttypes of publication, rang<strong>in</strong>g fromnews and data releases to more <strong>in</strong>-depthanalyses <strong>in</strong> the form of the statisticalbooks collection. Among the most <strong>in</strong>terest<strong>in</strong>gcollections are:• News releases – rapid updatesprovid<strong>in</strong>g <strong>in</strong>formation about therelease of new key data on the EU;• Statistics <strong>in</strong> focus and Data <strong>in</strong> focus –these are relatively short publicationswhich present up-to-date summariesof the ma<strong>in</strong> results of statisticalsurveys, studies and analyses;• Pocketbooks – these handy, pocketsizedpublications present ma<strong>in</strong><strong>in</strong>dicators for a particular theme <strong>in</strong> aconcise format;• Statistical books – a collectionof comprehensive studies; thesepublications are usually quite lengthyand provide analyses, tables andgraphs for one or more statisticaldoma<strong>in</strong>s;• Methodologies and work<strong>in</strong>gpapers – <strong>in</strong>tended for specialistswho want to consult methodologies,nomenclatures, or specific studies fora particular data set.All PDF versions of these products areavailable for consultation and downloadvia the <strong>Eurostat</strong> website. Alternatively,some <strong>Eurostat</strong> publications are alsopr<strong>in</strong>ted or made available on <strong>CD</strong>-<strong>ROM</strong>or DVD; these can be ordered from thewebsite of the EU bookshop (http://bookshop.europa.eu)or through sales agents<strong>in</strong> the Member States. The bookshop ismanaged by the Office for Official Publicationsof the <strong>Europe</strong>an Communities(http://publications.europa.eu).Support for users<strong>Eurostat</strong> and the other members of the<strong>Europe</strong>an statistical system, have setupa system of user support centres forInternet users. These exist <strong>in</strong> 22 of theMember States, Croatia, Norway, Switzerlandand Turkey. In order to offer thebest possible and personalised support,requests should, whenever possible, beaddressed to the relevant national supportcentre. The mission of each centre isto provide additional help and guidanceto users who are hav<strong>in</strong>g difficulty <strong>in</strong> f<strong>in</strong>d<strong>in</strong>gthe statistical data they require. More<strong>in</strong>formation (requires users to be logged<strong>in</strong>) is available on the <strong>Eurostat</strong> website at:https://ec.europa.eu/eurostat/xtnetassist/log<strong>in</strong>.htm.EUROPE IN FIGURES — <strong>Eurostat</strong> <strong>yearbook</strong> <strong>2009</strong>17
A practical guide to access<strong>in</strong>g <strong>Europe</strong>an statistics<strong>Eurostat</strong>’s service for journalistsStatistics make news and they are essentialto many stories, features and <strong>in</strong>-depthanalyses. Pr<strong>in</strong>ted media, as well as radioand TV, use <strong>Eurostat</strong> data <strong>in</strong>tensively. <strong>Eurostat</strong>’spress office puts out user-friendlynews releases on a key selection of datacover<strong>in</strong>g the EU, the euro area, the MemberStates and their partners. All <strong>Eurostat</strong>news releases are available free of chargeon the <strong>Eurostat</strong> website at 11 a.m. (C.E.T.)on the day they are released. Just under200 press releases were published <strong>in</strong> thelast year, of which three quarters werebased on monthly or quarterly Euro-Indicators. Other releases covered major<strong>in</strong>ternational events and important <strong>Eurostat</strong>publications.<strong>Eurostat</strong>’s media support centre helpsprofessional journalists f<strong>in</strong>d data on allk<strong>in</strong>ds of topics. Journalists can contactmedia support for further <strong>in</strong>formationon news releases and other data (tel. (352)4301-33408; e-mail: <strong>Eurostat</strong>-mediasupport@ec.europa.eu).18 EUROPE IN FIGURES — <strong>Eurostat</strong> <strong>yearbook</strong> <strong>2009</strong>
Science, technology, <strong>in</strong>novationand entrepreneurship:<strong>2009</strong>, the year of creativityand <strong>in</strong>novationEach year a subject is chosen to be the focus of attention for a campaign <strong>with</strong><strong>in</strong> the<strong>Europe</strong>an Union: the year <strong>2009</strong> is the <strong>Europe</strong>an Year of Creativity and Innovation. Theaim for <strong>2009</strong> is to promote creativity and capacity for <strong>in</strong>novation as key competences forall, to help meet challenges by rais<strong>in</strong>g public awareness, dissem<strong>in</strong>ate <strong>in</strong>formation aboutgood practices, stimulate education and research, creativity and <strong>in</strong>novation, and promotepolicy debate and change. By comb<strong>in</strong><strong>in</strong>g actions at Community, national, regional andlocal levels, it is hoped that this can ‘generate synergies and help to focus policy debate onspecific issues’.The <strong>Europe</strong>an Year of Innovation and Creativity is proposed as a cross-cutt<strong>in</strong>g <strong>in</strong>itiativecover<strong>in</strong>g not only education and culture, but also other policy doma<strong>in</strong>s such as enterprise,media, research, social and regional policy and rural development. As such, theactivities of the Year should focus on creat<strong>in</strong>g an environment favourable to creativityand <strong>in</strong>novation and become a strong impetus for long-term policy priorities. All forms of<strong>in</strong>novation <strong>in</strong>clud<strong>in</strong>g social and entrepreneurial <strong>in</strong>novation should be taken <strong>in</strong>to account.Artistic creation and new approaches <strong>in</strong> culture should also receive due attention, as importantmeans of communication between people <strong>in</strong> <strong>Europe</strong> and <strong>in</strong> the follow-up to the2008 <strong>Europe</strong>an Year of Intercultural Dialogue.Modern economies place <strong>in</strong>creas<strong>in</strong>g emphasis on add<strong>in</strong>g value by means of better useof knowledge and <strong>in</strong>novation. Most analysts agree that education and tra<strong>in</strong><strong>in</strong>g can bea determ<strong>in</strong><strong>in</strong>g factor <strong>in</strong> enhanc<strong>in</strong>g creativity, <strong>in</strong>novation performance and competitiveness– the ‘knowledge triangle’ compris<strong>in</strong>g education, research and <strong>in</strong>novation. However,creativity and <strong>in</strong>novation are also l<strong>in</strong>ked to personal attributes, based on cultural and<strong>in</strong>terpersonal skills and values. Creativity is a human characteristic that manifests itself<strong>in</strong> many contexts, from works of art, design and craft, to scientific breakthroughs andentrepreneurship. Creativity and <strong>in</strong>novation have the potential to lead to new products,services, processes, strategies and organisations that arise from new ideas and associations,irrespective of whether the doma<strong>in</strong> is economic, social or artistic. As such, creativityand <strong>in</strong>novation can be stimulated through a broad, creative, skills base, as well as thedevelopment of motivation and a sense of <strong>in</strong>itiative.EUROPE IN FIGURES — <strong>Eurostat</strong> <strong>yearbook</strong> <strong>2009</strong>21
1Science, technology, <strong>in</strong>novation and entrepreneurship:<strong>2009</strong>, the year of creativity and <strong>in</strong>novationIn October 2006, the <strong>Europe</strong>anParliament and the Council adopted adecision (No 1639/2006/CE) establish<strong>in</strong>ga competitiveness and <strong>in</strong>novation frameworkprogramme (CIP) (1) . The CIP runsfrom 2007 to 2013, and aims to promotethe competitiveness of <strong>Europe</strong>an enterprises.With small and medium-sizedenterprises (SMEs) as its ma<strong>in</strong> target, theprogramme aims to support <strong>in</strong>novationactivities (<strong>in</strong>clud<strong>in</strong>g eco-<strong>in</strong>novation), providebetter access to f<strong>in</strong>ance and deliverbus<strong>in</strong>ess support services <strong>in</strong> the regions.It is hoped that it will encourage a bettertake-up and use of <strong>in</strong>formation and communicationstechnologies (ICT) and helpto develop the <strong>in</strong>formation society, whilealso promot<strong>in</strong>g the <strong>in</strong>creased use of renewableenergies and energy efficiency.In December 2006, the seventh frameworkprogramme of the <strong>Europe</strong>anCommunity for research and technologicaldevelopment for the period 2007to 2013 (FP7) was established (2) . FP7will be implemented through specificprogrammes correspond<strong>in</strong>g to the ma<strong>in</strong>themes of <strong>Europe</strong>an research policy,<strong>with</strong> fund<strong>in</strong>g amount<strong>in</strong>g to around EUR53 billion. In April 2007, the <strong>Europe</strong>anCommission adopted a Green paper titled‘The <strong>Europe</strong>an Research Area: NewPerspectives’ (3) . This opens discussionson a number of issues, notably the mobilityof researchers, develop<strong>in</strong>g research<strong>in</strong>frastructure and <strong>in</strong>stitutions, as wellas improvements <strong>in</strong> the circulation andshar<strong>in</strong>g of knowledge, research programmes,and global research cooperation.It aims to tackle under<strong>in</strong>vestment,and fragmentation. The pr<strong>in</strong>ciples ofthe overall governance of the <strong>Europe</strong>anResearch Area (ERA) are known as the‘Ljubljana Process’ stemm<strong>in</strong>g from discussions<strong>in</strong> Ljubljana and Brdo (Slovenia)<strong>in</strong> April 2008. Five <strong>in</strong>itiatives for the developmentof ERA have been foreseen,<strong>with</strong> several already adopted <strong>in</strong> 2008;these concern researchers, research <strong>in</strong>frastructure,knowledge shar<strong>in</strong>g, jo<strong>in</strong>tprogramm<strong>in</strong>g, and <strong>in</strong>ternational scienceand technology cooperation.In a wider context, by plac<strong>in</strong>g competitivenessat the heart of the <strong>Europe</strong>an politicalagenda, the re<strong>in</strong>vigorated Lisbonprocess aims to make <strong>Europe</strong> a moreattractive place to <strong>in</strong>vest, by boost<strong>in</strong>gentrepreneurial <strong>in</strong>itiative and creat<strong>in</strong>ga productive environment where <strong>in</strong>novationcapacity can grow and develop.In October 2005 and September 2006the <strong>Europe</strong>an Commission adopted twoCommunications titled ‘More Researchand Innovation - Invest<strong>in</strong>g for Growthand Employment: A Common Approach’and ‘Putt<strong>in</strong>g knowledge <strong>in</strong>to practice: Abroad-based <strong>in</strong>novation strategy for theEU’. These po<strong>in</strong>t the way forward to accompany<strong>in</strong>dustry-led and society-driven<strong>in</strong>novation <strong>with</strong> competitiveness andpublic policies at all levels. The secondof these Communications s<strong>in</strong>gles out tenpriority actions, notably to encouragethe emergence of ‘lead markets’ wherepublic authorities create conditions for asuccessful market uptake of <strong>in</strong>novativeproducts and services <strong>in</strong> a focused way <strong>in</strong>areas such as e-health, <strong>in</strong>ternal security,eco-<strong>in</strong>novation and eco-construction.(1) http://ec.europa.eu/cip/<strong>in</strong>dex_en.htm.(2) http://cordis.europa.eu/fp7/home_en.html.(3) http://ec.europa.eu/research/era/<strong>in</strong>dex_en.html.22 EUROPE IN FIGURES — <strong>Eurostat</strong> <strong>yearbook</strong> <strong>2009</strong>
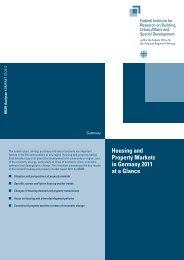
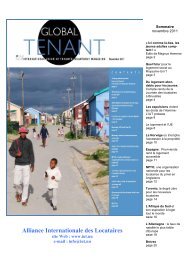
Science, technology, <strong>in</strong>novation and entrepreneurship:<strong>2009</strong>, the year of creativity and <strong>in</strong>novation 1In two recent Communications (4) , the<strong>Europe</strong>an Commission has set out itsvision for improv<strong>in</strong>g the patent system<strong>in</strong> <strong>Europe</strong>. A strong <strong>in</strong>dustrial propertyrights system is seen as one driv<strong>in</strong>gforce for <strong>in</strong>novation, stimulat<strong>in</strong>g R&D<strong>in</strong>vestment and facilitat<strong>in</strong>g the transferof knowledge from the laboratory to themarketplace. The latest Communication<strong>in</strong>cludes <strong>in</strong>itiatives on enforcement, <strong>in</strong>novationsupport for small and mediumsizedenterprises, and the quality of <strong>in</strong>dustrialproperty rights. It complementsa 2007 Communication on the patentsystem, which set out a way forward towardsthe adoption of a Community patentand an <strong>in</strong>tegrated EU-wide jurisdictionfor patents.The overall objective of the <strong>Europe</strong>anYear of Creativity and Innovation is topromote creativity for all, as a driver for<strong>in</strong>novation and as a key factor for thedevelopment of personal, occupational,entrepreneurial and social competencesthrough lifelong learn<strong>in</strong>g. This chapterlooks at some of these specific areasthrough official statistics.1.1 EducationEducation is seen as a key to develop<strong>in</strong>gan <strong>in</strong>novation-orientated society, for thedevelopment of entrepreneurial skills, aswell as literacy, scientific and mathematicalcompetence, languages and digitalliteracy. Lifelong tra<strong>in</strong><strong>in</strong>g and educationoffer an important opportunity for <strong>in</strong>dividualsto ma<strong>in</strong>ta<strong>in</strong> or improve theirskills situation. Education, vocationaltra<strong>in</strong><strong>in</strong>g and lifelong learn<strong>in</strong>g play a vitalrole <strong>in</strong> the economic and social strategyof <strong>Europe</strong>. More general <strong>in</strong>formationon education <strong>in</strong> <strong>Europe</strong> is available <strong>in</strong>Chapter 4.With<strong>in</strong> the EU-27 education participationrates of persons aged 15 to 24slipped back slightly to 59.3 % <strong>in</strong> 2006.Nevertheless, a susta<strong>in</strong>ed period of <strong>in</strong>crease<strong>in</strong> earlier years meant that thisrate was still 6.4 percentage po<strong>in</strong>ts higherthan <strong>in</strong> 1998. The participation rate for femalepupils and students was higher thanfor their male counterparts <strong>with</strong><strong>in</strong> theEU-27 as a whole, and this situation wasrepeated <strong>in</strong> every Member State exceptthe Netherlands and Germany, where therates for females were slightly lower.Public expenditure on tertiary level educationaveraged 1.15 % of GDP <strong>in</strong> theEU-27 <strong>in</strong> 2005, up from 1.05 % <strong>in</strong> 2001.The highest shares were recorded <strong>in</strong> theNordic Member States, and the lowest <strong>in</strong>Romania, Slovakia, Bulgaria and Italy.Maths, science and technology graduatesmade up more than one fifth (22.4 %) ofall graduates <strong>in</strong> the EU-27 <strong>in</strong> 2006, <strong>with</strong>Austria record<strong>in</strong>g a share closer to onethird (32.3 %).Around one third of employees <strong>in</strong> theEU-27 participated <strong>in</strong> cont<strong>in</strong>u<strong>in</strong>g vocationaltra<strong>in</strong><strong>in</strong>g (CVT) courses dur<strong>in</strong>g2005. Among the Member States, theproportion ranged from 50 % or more <strong>in</strong>the Czech Republic and Slovenia to 15 %or less <strong>in</strong> Greece, Lithuania, Latvia andBulgaria.(4) ‘Enhanc<strong>in</strong>g the patent system <strong>in</strong> <strong>Europe</strong>’; ‘An Industrial Property Rights Strategy for <strong>Europe</strong>’; http://ec.europa.eu/<strong>in</strong>ternal_market/<strong>in</strong>dprop/rights/<strong>in</strong>dex_en.htm.EUROPE IN FIGURES — <strong>Eurostat</strong> <strong>yearbook</strong> <strong>2009</strong>23
1Science, technology, <strong>in</strong>novation and entrepreneurship:<strong>2009</strong>, the year of creativity and <strong>in</strong>novationTable 1.1: Students study<strong>in</strong>g <strong>in</strong> secondary and post-secondary non-tertiary education, 2006 (1)(1 000)of which (%):TotalHumanities& artsSocialsciences,bus. & lawScience,maths &comput<strong>in</strong>gEng<strong>in</strong>.,manufac.& constr.Agric. &veter<strong>in</strong>aryHealth &welfare ServicesEU-27 3 282 3.7 20.1 2.9 29.1 3.4 9.1 12.4Euro area 2 269 3.4 20.3 2.2 23.6 2.6 10.7 10.4Belgium 95.7 12.3 16.5 1.3 19.0 1.6 18.4 10.6Bulgaria 37.4 2.4 18.1 1.3 54.8 7.5 0.7 15.1Czech Republic 114.9 8.1 26.6 : 38.8 3.3 5.4 16.9Denmark 64.3 12.4 21.2 25.8 18.4 1.8 14.2 6.2Germany 709.9 2.4 29.9 3.0 28.9 2.3 10.2 11.0Estonia 7.2 3.3 14.6 4.8 44.0 5.1 4.2 24.1Ireland (2) 77.1 2.8 13.2 4.0 30.5 2.4 8.7 13.6Greece (2) 63.5 5.2 22.9 23.2 17.1 1.3 26.6 3.7Spa<strong>in</strong> : : : : : : : :France 516.1 2.2 25.8 : 37.4 4.7 13.3 16.6Italy 437.8 : : : : : : :Cyprus : : : : : : : :Latvia 9.8 5.4 15.0 5.5 42.9 1.9 4.2 25.1Lithuania 10.9 3.3 29.1 : 41.0 1.2 2.4 22.5Luxembourg 2.5 2.7 38.9 2.3 33.1 3.5 7.1 4.9Hungary 55.5 4.5 21.8 8.8 32.0 3.0 7.9 21.1Malta 1.7 8.5 12.4 18.1 32.7 1.2 7.0 19.0Netherlands 132.0 2.2 21.0 5.1 21.0 4.1 26.1 17.4Austria (2) 97.6 : : : : : : :Poland 332.7 2.0 24.7 5.2 38.6 2.7 5.6 21.1Portugal : : : : : : : :Romania 260.9 : 11.2 : 55.4 11.5 : 12.9Slovenia 20.8 0.4 35.9 1.8 31.7 4.4 9.4 13.2Slovakia 63.1 3.2 23.2 4.2 36.4 3.6 4.9 23.4F<strong>in</strong>land 60.2 5.5 19.8 3.4 29.6 5.0 15.7 21.0Sweden 56.0 23.4 6.6 0.2 33.9 5.7 11.5 10.7United K<strong>in</strong>gdom : : : : : : : :FYR of Macedonia 16.7 2.6 20.4 1.0 44.5 6.6 12.2 12.1Iceland 2.7 9.0 15.0 1.7 37.1 3.5 11.8 18.5Liechtenste<strong>in</strong> 0.4 5.7 : : : : : :Norway 26.9 3.9 8.9 2.9 39.3 3.7 25.6 15.6Switzerland 72.2 3.1 32.5 9.1 27.8 3.4 11.3 8.8(1) ISCED levels 3 and 4.(2) 2005.Source: <strong>Eurostat</strong> (educ_grad5)24 EUROPE IN FIGURES — <strong>Eurostat</strong> <strong>yearbook</strong> <strong>2009</strong>
Science, technology, <strong>in</strong>novation and entrepreneurship:<strong>2009</strong>, the year of creativity and <strong>in</strong>novation 1Figure 1.1: Participation <strong>in</strong> education among students aged 15-24 years, 2006 (1)(% share of correspond<strong>in</strong>g age population)1007550250EU-27Euro areaF<strong>in</strong>landPolandSloveniaLithuaniaBelgiumSwedenGreeceDenmarkNetherlandsGermanyLatviaEstoniaHungaryCzech RepublicFranceIrelandItalySpa<strong>in</strong>SlovakiaAustriaRomaniaBulgariaPortugalUnited K<strong>in</strong>gdomLuxembourgMaltaCyprusIcelandNorwaySwitzerlandUnited StatesLiechtenste<strong>in</strong>CroatiaFYR of MacedoniaTurkeyJapanMaleFemale(1) This <strong>in</strong>dicator gives the percentage of all 15-24 year olds who are still <strong>in</strong> education (at any of the ISCED levels). It gives an <strong>in</strong>dicationof the number of young people who have not abandoned their efforts to improve their skills through education. The figure rankscountries based on the average of male and female.Source: <strong>Eurostat</strong> (educ_thpar)Figure 1.2: Public expenditure on tertiary level education, 2005 (1)(% share of GDP)3210EU-27 (2)Euro area (2)DenmarkF<strong>in</strong>landSwedenCyprusAustriaGreeceNetherlandsBelgiumSloveniaUnited K<strong>in</strong>gdomFrancePolandGermanyIrelandMaltaLithuaniaHungaryPortugalSpa<strong>in</strong>EstoniaCzech RepublicLatviaRomaniaSlovakiaBulgariaItalyNorwaySwitzerlandIcelandUnited StatesTurkey (3)CroatiaJapanFYR of Macedonia (4)Liechtenste<strong>in</strong>(1) Generally, the public sector funds education either by bear<strong>in</strong>g directly the current and capital expenses of educational <strong>in</strong>stitutionsor by support<strong>in</strong>g students and their families <strong>with</strong> scholarships and public loans as well as by transferr<strong>in</strong>g public subsidies foreducational activities to private firms or non-profit organisations. Both types of transactions together are reported as total publicexpenditure on education. Luxembourg, not available.(2) Estimate.(3) 2004.(4) 2003.Source: <strong>Eurostat</strong> (educ_figdp)EUROPE IN FIGURES — <strong>Eurostat</strong> <strong>yearbook</strong> <strong>2009</strong>25
1Science, technology, <strong>in</strong>novation and entrepreneurship:<strong>2009</strong>, the year of creativity and <strong>in</strong>novationTable 1.2: Students study<strong>in</strong>g creative or <strong>in</strong>novative subjects <strong>in</strong> tertiary education, 2006 (1)(1 000)of which: (%)Journalism& Life Phys. Maths Comput<strong>in</strong>gEng<strong>in</strong>.& eng<strong>in</strong>.Manuf.& pro-ArchitectureTotal Arts <strong>in</strong>fo. science science & stats.trades cess<strong>in</strong>g & build.EU-27 18 775 3.9 1.6 2.3 2.4 1.2 4.0 8.7 1.2 3.7Euro area 11 191 4.3 1.7 2.3 2.6 1.2 3.9 9.4 0.8 4.2Belgium 394 5.0 2.5 2.2 1.3 0.4 3.0 6.3 0.2 4.0Bulgaria 243 2.3 1.5 0.7 1.6 0.5 2.2 16.8 1.8 2.4Czech Republic 337 2.4 1.1 1.4 1.7 0.8 4.6 9.3 1.9 3.3Denmark 229 3.5 1.2 1.6 1.5 1.1 3.8 5.9 0.7 3.5Germany 2 289 3.7 1.1 2.6 4.4 2.4 5.9 11.0 0.8 3.9Estonia 68 4.5 1.7 1.9 1.8 0.6 5.8 5.7 2.1 4.5Ireland 186 8.5 0.3 3.5 2.3 0.8 5.0 4.8 0.8 4.9Greece (2) 647 1.7 1.2 5.1 3.6 2.9 4.1 5.2 7.8 3.5Spa<strong>in</strong> 1 789 4.6 1.6 1.8 2.2 0.7 6.7 11.7 0.8 5.3France 2 201 4.2 1.4 2.3 3.8 1.6 2.6 6.5 0.8 2.1Italy 2 029 5.7 3.2 3.8 1.5 0.9 1.7 8.9 0.8 5.9Cyprus 21 3.3 2.6 0.2 2.1 1.3 9.1 4.4 0.0 1.7Latvia 131 2.6 1.2 0.4 0.8 0.3 3.6 5.6 1.0 3.5Lithuania 199 2.8 0.8 0.6 1.1 0.9 3.5 11.2 2.2 4.6Luxembourg 3 : : : : : : : : :Hungary 439 1.4 2.6 0.7 1.1 0.4 3.1 8.5 1.2 2.7Malta 9 5.9 2.9 1.1 0.5 2.8 4.0 4.8 0.0 2.8Netherlands 572 4.4 0.8 0.7 0.7 0.2 5.0 4.4 0.4 3.4Austria 253 4.2 2.5 3.2 2.6 1.1 5.6 6.5 1.3 4.1Poland 2 146 1.1 0.9 1.9 1.7 0.8 5.0 6.9 2.7 2.8Portugal 367 4.5 2.2 2.2 2.1 1.0 2.0 13.1 1.1 7.7Romania 835 1.6 1.9 2.4 : 2.3 : 13.6 3.8 0.8Slovenia 115 1.5 0.6 1.1 1.1 0.5 2.8 8.3 3.5 3.9Slovakia 198 1.7 2.0 2.4 1.9 0.7 4.0 10.6 1.8 4.0F<strong>in</strong>land 309 5.4 1.0 1.6 2.6 1.5 5.7 20.9 1.4 3.3Sweden 423 3.6 2.0 2.4 1.9 1.7 3.7 13.0 0.5 2.8United K<strong>in</strong>gdom 2 336 6.7 2.0 3.6 3.5 1.4 5.1 4.3 0.8 3.2Croatia 137 2.5 6.2 1.0 1.7 1.6 3.1 9.5 2.7 4.1FYR of Macedonia 48 1.3 1.2 1.3 2.8 0.7 2.4 10.1 4.9 3.3Turkey 2 343 1.3 4.3 1.0 2.7 1.5 2.4 8.3 2.8 2.2Iceland 16 2.7 1.3 2.4 2.0 0.5 3.1 4.6 0.2 2.5Liechtenste<strong>in</strong> 1 0.0 0.0 0.0 0.0 0.0 0.0 0.0 0.0 25.0Norway 215 3.2 1.9 1.4 1.3 0.9 4.2 4.4 0.3 1.9Switzerland 205 4.0 1.9 3.1 3.4 0.8 3.4 8.7 0.5 4.2Japan 4 085 3.8 : : : : : : : :United States 17 487 3.3 2.8 2.8 1.0 0.6 4.5 4.7 1.4 0.6(1) ISCED levels 5 and 6.(2) 2005.Source: <strong>Eurostat</strong> (educ_enrl5)26 EUROPE IN FIGURES — <strong>Eurostat</strong> <strong>yearbook</strong> <strong>2009</strong>
Science, technology, <strong>in</strong>novation and entrepreneurship:<strong>2009</strong>, the year of creativity and <strong>in</strong>novation 1Table 1.3: Graduates <strong>in</strong> creative or <strong>in</strong>novative subjects, 2006 (1)(1 000)of which: (%)Journalism& Life Phys. Maths Comput<strong>in</strong>gEng<strong>in</strong>.& eng<strong>in</strong>.Manuf.& pro-ArchitectureTotal Arts <strong>in</strong>fo. science science & stats.trades cess<strong>in</strong>g & build.EU-27 3 846 3.9 1.9 2.4 2.1 1.1 3.9 7.8 1.2 2.9Euro area 2 113 4.2 2.1 2.3 2.3 1.2 3.9 9.1 1.0 3.3Belgium 82 4.0 1.8 2.2 1.5 0.5 3.5 6.2 0.3 2.8Bulgaria 45 2.2 1.2 0.9 1.7 0.4 2.4 12.7 1.5 1.4Czech Republic 69 2.7 1.0 1.4 1.8 0.8 3.6 10.3 1.8 2.9Denmark 48 3.3 1.3 1.6 1.3 1.0 3.3 5.7 1.2 4.0Germany 415 3.8 1.1 2.3 3.2 2.0 3.9 8.9 0.9 3.7Estonia 12 4.6 1.7 2.1 1.8 0.6 4.9 5.3 2.1 2.5Ireland (2) 60 4.3 0.3 1.6 1.1 0.5 2.9 2.6 0.5 1.9Greece (2) 60 2.4 0.9 3.4 4.0 2.4 5.2 7.3 1.0 4.0Spa<strong>in</strong> 286 5.0 1.8 1.6 1.8 0.6 6.1 11.5 1.0 4.0France 644 3.7 2.2 2.7 2.8 1.5 4.1 9.4 1.3 2.1Italy 279 6.5 4.7 3.4 1.3 0.9 1.3 10.1 0.7 5.1Cyprus 4 4.3 2.0 0.2 2.2 2.0 5.4 3.1 0.0 1.1Latvia 26 2.2 1.1 0.5 0.7 0.3 3.1 4.3 0.6 1.9Lithuania 43 2.8 0.8 0.7 1.1 0.9 3.3 9.9 1.9 4.1Luxembourg : : : : : : : : : :Hungary 70 1.3 2.8 0.5 0.8 0.3 4.2 3.9 1.4 1.4Malta 3 4.2 0.8 0.9 0.8 0.0 4.5 2.3 0.0 2.5Netherlands 117 4.1 0.6 0.9 0.9 0.3 4.3 4.2 0.4 3.2Austria 35 4.0 3.3 3.5 2.0 0.6 6.4 13.0 2.0 4.8Poland 504 0.9 0.9 2.0 1.3 0.8 4.0 4.7 1.9 1.7Portugal 72 5.3 2.5 2.2 2.9 1.7 5.1 8.0 1.4 5.7Romania 175 1.7 1.8 2.9 : 1.7 : 12.3 3.1 0.4Slovenia 17 1.6 0.6 0.9 0.7 0.5 1.4 7.1 2.6 3.0Slovakia 40 2.2 2.1 2.4 2.2 0.5 3.4 9.5 1.4 4.1F<strong>in</strong>land 40 6.1 1.1 1.3 2.1 0.9 4.4 17.0 1.1 2.4Sweden 61 2.7 1.9 2.4 1.5 0.6 3.6 14.8 0.7 3.0United K<strong>in</strong>gdom 640 6.9 2.4 3.4 3.4 1.3 5.3 4.4 0.7 3.1Croatia 21 2.6 2.2 1.6 1.6 0.8 2.3 6.8 1.7 3.0FYR of Macedonia 7 2.7 0.9 1.5 3.5 1.0 1.4 7.7 3.6 2.5Turkey 373 1.3 4.0 1.0 2.4 1.4 3.0 9.0 3.1 2.2Iceland 3 3.6 1.1 2.8 1.9 0.0 3.2 3.5 0.2 2.9Liechtenste<strong>in</strong> 0 0.0 0.0 0.0 0.0 0.0 0.0 0.0 0.0 34.8Norway 34 3.4 2.1 1.7 1.0 0.4 5.0 4.7 0.3 2.5Switzerland 69 3.1 1.3 2.1 2.4 0.5 5.3 8.2 0.7 3.1Japan 1 068 4.3 : : : : : : : :United States 2 639 3.7 3.7 3.2 1.3 0.8 3.7 4.7 1.1 1.4(1) Graduates from ISCED levels 5 and 6.(2) 2005.Source: <strong>Eurostat</strong> (educ_grad5)EUROPE IN FIGURES — <strong>Eurostat</strong> <strong>yearbook</strong> <strong>2009</strong>27
1Science, technology, <strong>in</strong>novation and entrepreneurship:<strong>2009</strong>, the year of creativity and <strong>in</strong>novationFigure 1.3: Maths, science and technology graduates, 2006 (1)(% share of all graduates)403020100EU-27 (2)Euro areaAustriaF<strong>in</strong>landGreece (3)SwedenSpa<strong>in</strong>PortugalIrelandFranceGermanySlovakiaItalyCzech RepublicLithuaniaUnited K<strong>in</strong>gdomBulgariaRomaniaEstoniaDenmarkBelgiumPolandSloveniaNetherlandsCyprusHungaryLatviaMaltaLiechtenste<strong>in</strong>SwitzerlandTurkeyFYR of MacedoniaJapanCroatiaUnited StatesNorwayIceland(1) This <strong>in</strong>dicator shows the proportion of all graduates (ISCED levels 5 and 6) from both public and private <strong>in</strong>stitutions complet<strong>in</strong>ggraduate and post-graduate studies <strong>in</strong> maths, science and technology fields compared <strong>with</strong> all graduates. Luxembourg, not available.(2) Estimate.(3) 2005.Source: <strong>Eurostat</strong> (educ_grad5)Figure 1.4: Cont<strong>in</strong>u<strong>in</strong>g vocational tra<strong>in</strong><strong>in</strong>g by type of activity received, 2005 (1)(% of participants <strong>in</strong> CVT by type of activity)Job rotation,exchanges orsecondments6%Self-learn<strong>in</strong>g7%Cont<strong>in</strong>u<strong>in</strong>g tra<strong>in</strong><strong>in</strong>g atconferences, workshops,lectures and sem<strong>in</strong>ars17%Learn<strong>in</strong>g/quality circles5%Cont<strong>in</strong>u<strong>in</strong>gvocationaltra<strong>in</strong><strong>in</strong>g courses48%Cont<strong>in</strong>u<strong>in</strong>gvocational tra<strong>in</strong><strong>in</strong>g<strong>in</strong> work situation17%(1) Figures do not sum to 100 % due to round<strong>in</strong>g.Source: <strong>Eurostat</strong> (trng_cvts3_01, trng_cvts3_03)28 EUROPE IN FIGURES — <strong>Eurostat</strong> <strong>yearbook</strong> <strong>2009</strong>
Science, technology, <strong>in</strong>novation and entrepreneurship:<strong>2009</strong>, the year of creativity and <strong>in</strong>novation 1Table 1.4: Adult population aged 25 to 64 participat<strong>in</strong>g <strong>in</strong> education and tra<strong>in</strong><strong>in</strong>g, 2005(%)Proportion ofemployeesProportion ofenterprisesEnterprises provid<strong>in</strong>g CVTcourses by type of courseparticipat<strong>in</strong>g <strong>in</strong>CVT coursesprovid<strong>in</strong>gCVT coursesInternalcoursesExternalcoursesEU-27 33 49 54 89Belgium 40 48 98 99Bulgaria 15 21 58 80Czech Republic 59 63 66 80Denmark 35 81 64 96Germany 30 54 72 90Estonia 24 56 40 94Ireland : : : :Greece 14 19 38 82Spa<strong>in</strong> 33 38 44 88France 46 71 44 92Italy 29 27 48 86Cyprus 30 47 31 94Latvia 15 30 22 97Lithuania 15 26 34 95Luxembourg 49 61 63 87Hungary 16 34 39 94Malta 32 31 63 82Netherlands 34 70 36 95Austria 33 67 43 96Poland 21 24 43 95Portugal 28 32 50 82Romania 17 28 49 74Slovenia 50 61 49 94Slovakia 38 38 37 88F<strong>in</strong>land 39 70 43 94Sweden 46 72 62 93United K<strong>in</strong>gdom 33 67 67 81Norway 29 55 66 79Source: <strong>Eurostat</strong> (trng_cvts3_41, trng_cvts3_05)EUROPE IN FIGURES — <strong>Eurostat</strong> <strong>yearbook</strong> <strong>2009</strong>29
1Science, technology, <strong>in</strong>novation and entrepreneurship:<strong>2009</strong>, the year of creativity and <strong>in</strong>novation1.2 Research and developmentIncreased levels of research and development(R & D) expenditure are seen asone means to achieve the goals set out <strong>in</strong>2000 by the <strong>Europe</strong>an Council <strong>in</strong> Lisbon:<strong>in</strong> 2002 a target that <strong>in</strong>vestment <strong>in</strong> R & Dshould reach 3 % of GDP by 2010 was set.Research and development is def<strong>in</strong>ed ascompris<strong>in</strong>g creative work undertakenon a systematic basis to <strong>in</strong>crease thestock of knowledge (of man, culture andsociety) and the use of this stock to devisenew applications. More <strong>in</strong>formationon the sources and methods concern<strong>in</strong>gR & D expenditure data are available <strong>in</strong>Subchapter 14.2.Government support for R & D represented0.8 % of GDP <strong>in</strong> the EU-27 <strong>in</strong> 2006,<strong>with</strong> the highest shares (1.0 %) recorded<strong>in</strong> France, Spa<strong>in</strong> and F<strong>in</strong>land: all of theMember States that jo<strong>in</strong>ed the EU <strong>in</strong> 2004or 2007 recorded shares below the EU-27average, while Greece, Luxembourg andIreland recorded the lowest shares amongthe EU-15 Member States. Around 30 %of government support for R & D wasallocated to research f<strong>in</strong>anced from generaluniversity funds (GUF), an objectivewhich covers R & D related to variousfields of science: natural, eng<strong>in</strong>eer<strong>in</strong>g,medical, agricultural, social sciences andhumanities. Defence related appropriationsaccounted for 13 % of all governmentappropriations, although this objectivehad a much higher share <strong>in</strong> a smallnumber of Member States, notably theUnited K<strong>in</strong>gdom, France, Sweden andSpa<strong>in</strong>.Extend<strong>in</strong>g the coverage to <strong>in</strong>clude alsoprivate fund<strong>in</strong>g, total R & D expenditure<strong>in</strong> the EU-27 was EUR 213 100 million<strong>in</strong> 2006, equivalent to 1.84 % of GDP.The ratio to GDP is referred to as R & D<strong>in</strong>tensity and this showed high values <strong>in</strong>the Nordic Member States, Germany andAustria, <strong>with</strong> only Sweden and F<strong>in</strong>landabove the 3 % target set for 2010; the lowestlevels of R & D <strong>in</strong>tensity were recorded<strong>in</strong> Cyprus, Romania, Slovakia andBulgaria.Figure 1.5: Government budget appropriations or outlays for research and development, 2007 (1)(% share of GDP)1.251.000.750.500.250.00EU-27Euro areaFranceSpa<strong>in</strong>F<strong>in</strong>landSwedenDenmarkGermanyPortugalUnited K<strong>in</strong>gdomNetherlandsAustriaBelgiumItalyCzech RepublicSloveniaEstoniaIrelandRomaniaLuxembourgHungaryCyprusPolandBulgariaGreeceLatviaLithuaniaSlovakiaMaltaUnited StatesIcelandJapanNorwaySwitzerland(1) Data on government budget appropriations or outlays on R & D (GBAORD) refer to budget provisions, not to actual expenditure,i.e. GBAORD measures government support for R & D us<strong>in</strong>g data collected from budgets. GBAORD are a way of measur<strong>in</strong>g governmentsupport; Estonia, Romania and Iceland, 2008; EU-27, euro area, Belgium, Bulgaria, Spa<strong>in</strong>, France, Italy, Cyprus, Latvia, Malta, Poland,Slovenia, Sweden, the United K<strong>in</strong>gdom, Switzerland and Japan, 2006; Hungary, 2005; EU-27, estimate.Source: <strong>Eurostat</strong> (tsc00007)30 EUROPE IN FIGURES — <strong>Eurostat</strong> <strong>yearbook</strong> <strong>2009</strong>
Science, technology, <strong>in</strong>novation and entrepreneurship:<strong>2009</strong>, the year of creativity and <strong>in</strong>novation 1Table 1.5: Government budget appropriations or outlays for research and development, 2007 (1)Total research and developmentCivil research and development(EUR per<strong>in</strong>habitant)(EURmillion)(EUR per<strong>in</strong>habitant)(EURmillion)(% of totalresearch anddevelopment)EU-27 178.2 87 840 154.7 76 255 86.8Euro area : 66 925 : 59 846 89.4Belgium 185.1 1 946 184.6 1 940 99.7Bulgaria 9.8 75 : : :Czech Republic 75.3 774 73.4 755 97.5Denmark 328.6 1 790 326.7 1 780 99.4Germany 223.6 18 405 209.9 17 274 93.9Estonia 58.8 79 58.2 78 99.0Ireland 230.6 995 230.6 995 100.0Greece 60.3 673 59.9 670 99.5Spa<strong>in</strong> 223.9 9 799 187.6 8 209 83.8France 289.3 18 225 224.6 14 147 77.6Italy 154.9 9 099 152.8 8 975 98.6Cyprus 61.6 47 61.6 47 100.0Latvia 20.1 46 20.0 46 99.7Lithuania 24.2 82 24.0 81 99.2Luxembourg 298.2 142 298.2 142 100.0Hungary 32.6 329 32.5 329 99.9Malta 26.0 11 26.0 11 100.0Netherlands 243.9 3 990 239.0 3 910 98.0Austria 225.3 1 870 225.3 1 870 100.0Poland 22.5 858 22.3 850 99.1Portugal 116.7 1 237 115.9 1 228 99.3Romania 19.2 415 18.8 405 97.6Slovenia 86.5 173 85.2 171 98.4Slovakia 27.8 150 27.2 146 97.8F<strong>in</strong>land 327.8 1 730 320.0 1 689 97.6Sweden 295.7 2 675 245.9 2 225 83.2United K<strong>in</strong>gdom 233.9 14 124 167.7 10 127 71.7Iceland 401.8 124 401.8 124 100.0Norway 423.2 1 981 399.6 1 871 94.4Switzerland 284.7 2 123 283.0 2 111 99.4Japan : 24 478 : 23 221 94.9United States : 102 917 : 42 932 41.7(1) EU-27, euro area, Belgium, Bulgaria, Spa<strong>in</strong>, France, Italy, Cyprus, Latvia, Malta, Poland, Slovenia, Sweden, the United K<strong>in</strong>gdom,Switzerland and Japan, 2006; Hungary, 2005.Source: <strong>Eurostat</strong> (gba_nabsf<strong>in</strong>)EUROPE IN FIGURES — <strong>Eurostat</strong> <strong>yearbook</strong> <strong>2009</strong>31
1Science, technology, <strong>in</strong>novation and entrepreneurship:<strong>2009</strong>, the year of creativity and <strong>in</strong>novationFigure 1.6: Socio-economic objectives of government budget appropriations or outlays forresearch and development, EU-27, 2006 (1)(% share of total)Environment2.5%Energy2.6%Agriculture3.3%Social3.5%Space4.6%Other civilresearch5.2%Humanhealth7.4%Industrial &technology10.4%Research f<strong>in</strong>anced fromuniversity funds30.3%Defence13.2%Non-oriented research17.1%(1) Figures do not sum to 100 % due to round<strong>in</strong>g.Source: <strong>Eurostat</strong> (gba_nabsf<strong>in</strong>)Figure 1.7: Gross domestic expenditure on research and development(% share of GDP)432101996 1997 1998 1999 2000 2001 2002 2003 2004 2005 2006(1) Estimates.(2) Break <strong>in</strong> series, 1996; not available, 2006.(3) Break <strong>in</strong> series, 1998; excludes most or all capital expenditure.Source: <strong>Eurostat</strong> (tsc00001)EU-27 (1)Japan (2)United States (3)32 EUROPE IN FIGURES — <strong>Eurostat</strong> <strong>yearbook</strong> <strong>2009</strong>
Science, technology, <strong>in</strong>novation and entrepreneurship:<strong>2009</strong>, the year of creativity and <strong>in</strong>novation 1Figure 1.8: Gross domestic expenditure on research and development, 2006 (1)(% share of GDP)43210EU-27Euro areaSwedenF<strong>in</strong>landAustriaGermanyDenmarkFranceBelgiumUnited K<strong>in</strong>gdomNetherlandsSloveniaCzech RepublicLuxembourgIrelandSpa<strong>in</strong>EstoniaItalyHungaryPortugalLithuaniaLatviaGreecePolandMaltaBulgariaSlovakiaRomaniaCyprusJapanSwitzerlandIcelandUnited StatesNorwayCroatiaTurkey(1) Ireland, Austria, Slovakia and F<strong>in</strong>land, 2007; Italy, Iceland and Japan, 2005; Switzerland, 2004; EU-27, estimate.Source: <strong>Eurostat</strong> (tsiir020)Figure 1.9: Gross domestic expenditure on research and development, by source of funds, EU-27,2005 (1)(% share of total)Privatenon-profitsector1.5%Highereducationsector0.8%Abroad9.0%Government34.2%Bus<strong>in</strong>essenterprisesector54.5%(1) Estimates.Source: <strong>Eurostat</strong> (rd_e_gerdfund)EUROPE IN FIGURES — <strong>Eurostat</strong> <strong>yearbook</strong> <strong>2009</strong>33
1Science, technology, <strong>in</strong>novation and entrepreneurship:<strong>2009</strong>, the year of creativity and <strong>in</strong>novationTable 1.6: Research and development expenditure, 2006 (1)Research and development expenditureExpenditure by sector of performance (%)(EUR per<strong>in</strong>habitant)(EURmillion)Bus<strong>in</strong>essenterprise GovernmentHighereducationPrivatenon-profitEU-27 432.3 213 127 63.7 13.5 21.9 0.9Euro area : 156 953 63.7 14.6 21.0 0.7Belgium 551.5 5 798 67.9 8.6 22.3 1.2Bulgaria 15.7 121 25.5 64.1 9.6 0.9Czech Republic 171.8 1 761 66.2 17.5 15.9 0.4Denmark 985.5 5 349 66.6 6.7 26.1 0.6Germany 713.8 58 848 69.9 13.8 16.3 0.0Estonia 112.3 151 44.4 13.1 40.6 1.8Ireland 579.4 2 500 66.8 6.8 26.4 0.0Greece 109.9 1 223 30.0 20.8 47.8 1.3Spa<strong>in</strong> 270.0 11 815 55.5 16.7 27.6 0.2France 600.7 37 844 63.3 17.3 18.2 1.3Italy (2) 266.8 15 599 50.4 17.3 30.2 2.1Cyprus 80.7 62 22.3 28.4 41.7 7.6Latvia 49.0 112 50.4 15.1 34.5 0.0Lithuania 56.0 191 27.9 22.8 49.2 0.0Luxembourg 1 059.1 497 84.9 12.6 2.4 0.0Hungary 89.4 900 48.3 25.4 24.4 :Malta 68.0 28 61.8 4.8 33.4 0.0Netherlands 545.5 8 910 57.6 14.1 : :Austria 777.1 6 423 66.7 5.1 26.3 0.4Poland 39.6 1 513 31.5 37.0 31.0 0.4Portugal 122.4 1 294 41.7 : : :Romania 20.6 444 48.5 32.3 17.7 1.5Slovenia 241.5 484 60.2 24.5 15.1 0.2Slovakia 40.2 217 43.1 32.8 24.1 0.1F<strong>in</strong>land 1 140.0 6 016 71.5 9.7 18.7 0.0Sweden 1 292.2 11 691 74.9 4.5 20.4 0.2United K<strong>in</strong>gdom 563.6 34 037 61.7 10.0 26.1 2.2Croatia 67.0 297 36.7 26.5 36.6 0.1Turkey 33.5 2 432 37.0 11.7 51.3 0.0Iceland 1 238.5 364 51.5 23.5 22.0 3.0Norway 877.2 4 071 54.1 15.7 30.2 0.0Japan 953.6 121 831 76.4 8.3 13.4 1.9Russian Federation 59.3 8 466 66.6 27.0 6.1 0.3United States 878.6 260 803 69.6 12.0 14.1 4.3(1) Ireland and F<strong>in</strong>land, 2007; Italy, Iceland, Japan and the United States, 2005.(2) Higher education, break <strong>in</strong> series.Source: <strong>Eurostat</strong> (rd_e_gerdtot)34 EUROPE IN FIGURES — <strong>Eurostat</strong> <strong>yearbook</strong> <strong>2009</strong>
Science, technology, <strong>in</strong>novation and entrepreneurship:<strong>2009</strong>, the year of creativity and <strong>in</strong>novation 11.3 Science and technologypersonnelThe <strong>Europe</strong>an Commission has placedrenewed emphasis on the conversion of<strong>Europe</strong>’s scientific expertise <strong>in</strong>to marketableproducts and services, while alsofocus<strong>in</strong>g on improv<strong>in</strong>g the mobility of<strong>Europe</strong>an researchers, encourag<strong>in</strong>g networksbetween researchers from differentMember States. Researchers areprofessionals engaged <strong>in</strong> the conceptionor creation of new knowledge, products,processes, methods and systems, and<strong>in</strong> the management of the projects concerned.More <strong>in</strong>formation on the sourcesand methods concern<strong>in</strong>g data on humanresources <strong>in</strong> science and technology areavailable <strong>in</strong> Subchapter 14.1.In total there were 3.1 million R & Dpersonnel (head count) <strong>in</strong> the EU-27 <strong>in</strong>2006, represent<strong>in</strong>g 1.3 % of the labourforce. Generally Member States <strong>with</strong> ahigh R & D <strong>in</strong>tensity recorded also a highshare of R & D personnel <strong>in</strong> the labourforce, <strong>with</strong> F<strong>in</strong>land and Sweden aga<strong>in</strong>lead<strong>in</strong>g the way.Restrict<strong>in</strong>g the coverage, across theEU-27 there were 1.9 million researchers(head count) <strong>in</strong> 2006. Approximately halfof all researchers were active <strong>in</strong> the bus<strong>in</strong>essenterprise sector, <strong>with</strong> more thanone third <strong>in</strong> higher education, and mostof the rema<strong>in</strong>der <strong>in</strong> the government sector.With<strong>in</strong> the bus<strong>in</strong>ess enterprise sector,manufactur<strong>in</strong>g enterprises employedjust over 70 % of all bus<strong>in</strong>ess enterpriseresearchers.Human resources <strong>in</strong> science and technology(HRST) is a broader concept and <strong>in</strong>cludes<strong>in</strong>dividuals who have successfullycompleted tertiary-level education and/or work <strong>in</strong> a science and technology occupationas professionals or technicians.In total there were around 85 millionsuch persons <strong>in</strong> the EU-27 <strong>in</strong> 2006, <strong>with</strong>an almost equal split between men andwomen. Around two fifths of these wereconsidered to be core science and technologypersonnel, <strong>in</strong> other words theywere classified as human resources <strong>in</strong>science and technology both <strong>in</strong> terms oftheir level of education and their occupation.In total there were around 10 millionscientists and eng<strong>in</strong>eers <strong>in</strong> the EU-27<strong>in</strong> 2006, of which more than two thirdswere male.Look<strong>in</strong>g at <strong>in</strong>ternational mobility, around5 % of the human resources <strong>in</strong> scienceand technology <strong>in</strong> EU-27 Member Stateswere not nationals of the Member Statewhere they were resident: the share ofnon-nationals exceeded 10 % <strong>in</strong> Estonia,Cyprus and Ireland, and most notably <strong>in</strong>Luxembourg where the share was 45 %.High and medium-high technology manufactur<strong>in</strong>gconcerns the manufacture ofchemicals (NACE Rev. 1.1 Division 24),mach<strong>in</strong>ery and equipment (NACE Rev.1.1 Subsection DK), electrical and opticalequipment (NACE Rev. 1.1 SubsectionDL) and transport equipment (NACERev. 1.1 Subsection DM), and these sectorscomb<strong>in</strong>ed contributed around 10 %of total employment <strong>in</strong> Germany, theCzech Republic and Slovakia, but lessthan 2 % <strong>in</strong> Cyprus, Luxembourg andLatvia, compared <strong>with</strong> an EU-27 averageof 6.6 %. High-technology knowledge-<strong>in</strong>tensiveservices <strong>in</strong>clude post and telecommunications(NACE Rev. 1.1 Division 64),computer and related activities (NACERev. 1.1 Division 72) and research anddevelopment (NACE Rev. 1.1 Division73). These activities contributed 3.3 % oftotal employment <strong>in</strong> the EU-27, rang<strong>in</strong>gfrom 4 % or more <strong>in</strong> the Nordic MemberStates and the United K<strong>in</strong>gdom, to 1.6 %<strong>in</strong> Romania.EUROPE IN FIGURES — <strong>Eurostat</strong> <strong>yearbook</strong> <strong>2009</strong>35
1Science, technology, <strong>in</strong>novation and entrepreneurship:<strong>2009</strong>, the year of creativity and <strong>in</strong>novationTable 1.7: Research and development personnel, 2006Research and development personnel (1 000)of which (%, based on fte) (2)(headcount) (1)(full-timeequivalent) (2)Bus<strong>in</strong>essenterpriseGovernmentHighereducationPrivatenon-profitEU-27 3 112.6 2 167.4 53.3 15.2 30.2 1.2Euro area 2 233.9 1 563.2 54.3 15.3 29.2 1.2Belgium 78.5 55.2 58.4 7.0 33.6 1.0Bulgaria 18.6 16.3 15.1 62.8 21.2 0.9Czech Republic 69.2 47.7 50.5 22.4 26.8 0.3Denmark 67.3 45.2 64.8 7.3 27.3 0.6Germany 678.9 489.1 63.8 15.7 20.4 0.0Estonia 8.7 4.7 34.4 15.1 48.3 2.2Ireland 30.6 17.6 61.2 7.1 31.7 0.0Greece 61.5 35.1 32.4 13.0 53.9 0.6Spa<strong>in</strong> 309.9 189.0 43.9 18.3 37.5 0.3France 432.6 353.6 56.2 14.0 27.9 1.8Italy (3) 277.4 175.2 40.4 18.7 38.2 2.8Cyprus 2.5 1.2 25.4 29.1 38.1 7.4Latvia 10.7 6.5 28.7 17.9 53.4 0.0Lithuania 16.3 11.4 11.2 25.6 63.2 0.0Luxembourg 5.0 4.6 81.7 12.9 5.4 0.0Hungary 50.4 26.0 35.7 31.5 32.8 0.0Malta 1.4 0.8 53.5 5.7 40.8 0.0Netherlands 113.6 94.7 55.8 13.5 : :Austria : 50.3 67.9 4.7 26.8 0.5Poland 121.3 73.6 19.3 24.0 56.5 0.3Portugal 44.6 25.7 23.8 17.6 45.4 13.1Romania 42.2 30.8 44.7 27.2 27.8 0.3Slovenia 13.4 9.8 49.2 29.1 21.4 0.3Slovakia 23.1 15.0 20.9 24.8 54.2 0.1F<strong>in</strong>land 79.9 58.3 56.6 12.7 29.8 0.8Sweden 117.7 78.7 73.2 4.6 21.8 0.4United K<strong>in</strong>gdom : 323.4 45.0 6.3 : 2.0Croatia : 8.5 26.1 31.9 41.9 0.2Turkey 105.0 54.4 33.1 17.8 49.1 0.0Iceland 5.7 3.2 47.4 26.3 23.0 3.3Norway 54.3 31.7 52.1 16.8 31.1 0.0Ch<strong>in</strong>a : 1 502.5 65.7 18.1 16.1 0.0Japan : 921.2 66.2 6.8 25.4 1.6Russian Federation (4) 807.1 916.5 56.2 32.5 11.0 0.3(1) Belgium, Bulgaria, Denmark, Germany, Greece, Italy, Cyprus, Lithuania, Luxembourg, the Netherlands, Portugal, Sweden, Icelandand Norway, 2005.(2) France, Italy, Portugal, the United K<strong>in</strong>gdom, Iceland and Japan, 2005.(3) Higher education, break <strong>in</strong> series.(4) Data <strong>in</strong> head counts are underestimated.Source: <strong>Eurostat</strong> (rd_p_perssci)36 EUROPE IN FIGURES — <strong>Eurostat</strong> <strong>yearbook</strong> <strong>2009</strong>
1Science, technology, <strong>in</strong>novation and entrepreneurship:<strong>2009</strong>, the year of creativity and <strong>in</strong>novationFigure 1.12: Bus<strong>in</strong>ess enterprise researchers, EU, 2005 (1)(% breakdown by activity, based on head counts)Services25.9%Electricity, gasand water supply0.9%Construction0.8%Manufactur<strong>in</strong>g71.4%Agriculture, hunt<strong>in</strong>g,forestry and fish<strong>in</strong>g0.7%M<strong>in</strong><strong>in</strong>g and quarry<strong>in</strong>g0.4%(1) Average composed of those Member States for which data are available; Belgium and the Czech Republic 2006; France and Austria,2004; Bulgaria, 2003; Denmark, Luxembourg, Malta, Slovakia and the United K<strong>in</strong>gdom, not available; <strong>figures</strong> do not sum to 100 % dueto round<strong>in</strong>g.Source: <strong>Eurostat</strong> (rd_p_bempocc)Figure 1.13: Government and higher education researchers, EU, 2006 (1)(% breakdown by field of science, based on full-time equivalents)Agricultural sciences6.6%Humanities12.3%Natural sciences28.9%Social sciences15.1%Medical sciences16.0%Eng<strong>in</strong>eer<strong>in</strong>g andtechnology21.1%(1) Average composed of those Member States for which data are available; the Czech Republic, Estonia, Ireland, Spa<strong>in</strong>, Latvia,Hungary, Malta, Poland, Romania, Slovenia and Slovakia, 2006; Belgium, Bulgaria, Denmark, Germany, Italy, Cyprus, Lithuania,Luxembourg and Portugal, 2005; Greece, France, the Netherlands, Austria, F<strong>in</strong>land, Sweden and the United K<strong>in</strong>gdom, not available.Source: <strong>Eurostat</strong> (rd_p_perssci)38 EUROPE IN FIGURES — <strong>Eurostat</strong> <strong>yearbook</strong> <strong>2009</strong>
Science, technology, <strong>in</strong>novation and entrepreneurship:<strong>2009</strong>, the year of creativity and <strong>in</strong>novation 1Table 1.8: Researchers, 2006Researchers (1 000)of which (%, based on fte) (2)(headcount) (1)(full-timeequivalent) (2)Bus<strong>in</strong>essenterpriseGovernmentHighereducationPrivatenon-profitEU-27 1 891.1 1 301.0 49.3 13.9 35.6 1.3Euro area 1 298.0 895.3 50.3 13.9 34.5 1.3Belgium 48.8 33.9 50.5 7.4 41.4 0.7Bulgaria 11.9 10.3 12.6 59.5 26.7 1.2Czech Republic 39.7 26.3 43.0 25.0 31.8 0.2Denmark 43.5 28.7 60.6 7.6 31.0 0.7Germany 411.8 282.1 60.6 14.2 25.2 :Estonia 6.4 3.5 24.9 14.6 58.1 2.3Ireland 18.6 12.2 57.5 4.1 38.4 :Greece 33.4 19.9 27.1 11.3 60.8 0.7Spa<strong>in</strong> 193.0 115.8 34.5 17.3 47.9 0.3France 253.0 204.5 53.2 12.7 32.4 1.7Italy (3) 125.5 82.5 33.9 17.5 44.9 3.7Cyprus 1.4 0.8 23.2 15.2 57.0 4.6Latvia 7.2 4.0 19.3 14.9 65.8 0.0Lithuania 11.9 8.0 10.9 21.2 67.8 :Luxembourg 2.4 2.3 73.9 16.5 9.6 :Hungary 32.8 17.5 35.6 29.8 34.6 :Malta 1.0 0.5 46.3 3.6 50.1 0.0Netherlands 49.8 45.9 60.6 15.6 : :Austria : 30.5 63.6 4.0 31.9 0.5Poland 96.4 59.6 15.7 20.9 63.2 0.2Portugal 37.8 21.1 19.0 15.8 51.9 13.3Romania 30.1 20.5 37.6 27.2 34.8 0.4Slovenia 8.2 5.8 38.8 30.9 29.8 0.5Slovakia 18.8 11.8 16.1 21.2 62.6 0.1F<strong>in</strong>land 53.3 40.4 56.2 11.1 31.8 0.9Sweden 82.5 55.7 67.6 5.5 26.4 0.4United K<strong>in</strong>gdom : 180.5 51.9 5.2 : 2.1Croatia : 5.2 13.8 31.2 54.9 0.1Turkey 90.1 42.7 26.4 11.0 62.6 :Iceland 3.8 2.2 47.0 23.2 27.1 2.6Norway 37.0 21.7 49.4 15.9 34.7 :Ch<strong>in</strong>a : 1 223.8 63.5 17.2 19.3 :Japan 861.9 704.9 68.3 4.8 25.6 1.3Russian Federation (4) 388.9 464.4 51.0 33.1 15.6 0.4United States : 1 394.7 79.2 : : :(1) Belgium, Bulgaria, Denmark, Germany, Greece, France, Italy, Cyprus, Lithuania, Luxembourg, the Netherlands, Portugal, Sweden,Iceland, Norway and Japan, 2005.(2) France, Italy, Portugal, the United K<strong>in</strong>gdom, Iceland, Norway, Japan and the United States, 2005.(3) Higher education, break <strong>in</strong> series.(4) Data <strong>in</strong> head counts are underestimated.Source: <strong>Eurostat</strong> (rd_p_perssci)EUROPE IN FIGURES — <strong>Eurostat</strong> <strong>yearbook</strong> <strong>2009</strong>39
1Science, technology, <strong>in</strong>novation and entrepreneurship:<strong>2009</strong>, the year of creativity and <strong>in</strong>novationFigure 1.14: Human resources <strong>in</strong> science and technology <strong>with</strong> tertiary education, 2006 (1)(% of human resources <strong>in</strong> science and technology aged 25-64 years <strong>with</strong> a tertiary education <strong>in</strong> the specifiedfi e l d )50403020100EU-27RomaniaGermanyEstoniaCzech RepublicLithuaniaAustriaSlovakiaIrelandPortugalPolandSpa<strong>in</strong>United K<strong>in</strong>gdomBulgariaF<strong>in</strong>landFranceGreeceBelgiumLuxembourgHungaryItalySloveniaCyprusDenmarkSwedenLatviaMaltaNetherlandsSwitzerlandIcelandTurkeyNorway(1) Ireland and Norway, 2005; persons aged 25-64.Source: <strong>Eurostat</strong> (hrst_st_nfiesex)Eng<strong>in</strong>eer<strong>in</strong>g, manufactur<strong>in</strong>g and constructionScience, mathematics and comput<strong>in</strong>gFigure 1.15: Human resources <strong>in</strong> science and technology, 2006 (1)(% of total)100%75%50%25%0%SloveniaRomaniaPolandSlovakiaBulgariaLithuaniaHungaryCzech RepublicLatviaF<strong>in</strong>landNetherlandsPortugalGreeceDenmarkFranceMaltaGermanySwedenUnited K<strong>in</strong>gdomBelgiumAustriaSpa<strong>in</strong>IrelandCyprusEstoniaLuxembourgCroatiaIcelandNorwaySwitzerlandNon-nationalNational(1) Ireland, 2005; Italy, not available; persons aged 25-64.Source: <strong>Eurostat</strong> (hrst_st_nnat)40 EUROPE IN FIGURES — <strong>Eurostat</strong> <strong>yearbook</strong> <strong>2009</strong>
Science, technology, <strong>in</strong>novation and entrepreneurship:<strong>2009</strong>, the year of creativity and <strong>in</strong>novation 1Table 1.9: Human resources <strong>in</strong> science and technology, 2006 (1)Human resources <strong>in</strong>science and technologyCoreScientistsand eng<strong>in</strong>eers(1 000)Male(%)Female(%) (1 000)Male(%)Female(%) (1 000)Male(%)Female(%)EU-27 85 422 49.9 50.1 34 455 48.5 51.5 10 338 68.8 31.2Belgium 2 183 50.5 49.6 919 47.4 52.6 335 51.3 48.7Bulgaria 1 069 40.8 59.2 488 32.6 67.6 96 52.1 46.9Czech Republic 1 736 48.4 51.6 537 54.4 45.6 164 70.1 29.9Denmark 1 333 48.4 51.7 676 44.1 55.9 163 70.6 29.4Germany 16 708 52.9 47.1 6 416 56.5 43.5 2 156 76.7 23.3Estonia 281 37.7 61.9 106 29.2 71.7 26 53.8 46.2Ireland 772 47.4 52.7 324 46.0 54.0 138 50.0 49.3Greece 1 496 51.7 48.3 754 51.1 48.9 194 69.1 30.9Spa<strong>in</strong> 8 442 51.3 48.7 3 519 48.8 51.2 911 59.2 40.8France 11 122 49.6 50.4 4 567 48.1 51.9 1 342 77.0 23.0Italy 8 359 50.9 49.1 2 633 48.8 51.2 713 69.1 30.9Cyprus 143 52.4 48.3 65 52.3 49.2 16 56.3 37.5Latvia 365 37.5 62.7 142 31.7 68.3 37 45.9 54.1Lithuania 588 37.2 62.8 245 28.6 71.4 65 44.6 55.4Luxembourg 89 52.8 47.2 45 53.3 46.7 10 80.0 20.0Hungary 1 402 41.7 58.3 569 43.1 56.9 161 67.7 32.3Malta 44 59.1 40.9 17 52.9 47.1 5 60.0 40.0Netherlands 3 716 51.6 48.4 1 640 52.3 47.7 453 68.4 31.6Austria 1 432 55.0 45.0 443 53.3 46.7 118 76.3 23.7Poland 5 051 41.6 58.4 2 194 39.6 60.4 782 46.7 53.3Portugal 1 105 47.1 52.9 524 39.5 60.5 146 55.5 44.5Romania 2 095 46.1 53.9 935 47.6 52.4 367 62.4 37.6Slovenia 368 45.9 54.3 162 40.1 60.5 50 64.0 34.0Slovakia 797 44.2 55.7 274 49.6 50.4 67 65.7 34.3F<strong>in</strong>land 1 234 45.4 54.5 550 41.3 58.9 166 72.9 26.5Sweden 2 098 48.4 51.6 1 005 40.7 59.2 292 62.0 38.0United K<strong>in</strong>gdom 11 395 52.1 47.9 4 704 48.2 51.8 1 369 80.3 19.6Turkey 4 216 66.6 33.4 1 488 62.8 37.2 317 73.2 26.8Iceland 61 44.3 55.7 22 45.5 54.5 12 50.0 41.7Norway 1 079 49.1 51.0 565 44.1 55.9 111 58.6 41.4Switzerland 1 883 57.6 42.4 763 64.1 35.8 286 83.2 16.4(1) Persons aged 25-64.Source: <strong>Eurostat</strong> (hrst_st_ncat)EUROPE IN FIGURES — <strong>Eurostat</strong> <strong>yearbook</strong> <strong>2009</strong>41
1Science, technology, <strong>in</strong>novation and entrepreneurship:<strong>2009</strong>, the year of creativity and <strong>in</strong>novationFigure 1.16: Persons employed <strong>in</strong> high- and medium high-technology manufactur<strong>in</strong>g, 2006(% of total employment)12840EU-27GermanyCzech RepublicSlovakiaSloveniaHungaryItalyAustriaF<strong>in</strong>landMaltaBelgiumSwedenDenmarkFranceIrelandUnited K<strong>in</strong>gdomRomaniaPolandBulgariaSpa<strong>in</strong>EstoniaPortugalNetherlandsLithuaniaGreeceLatviaLuxembourgCyprusSwitzerlandCroatiaNorwayTurkeyIcelandSource: <strong>Eurostat</strong> (htec_emp_nat)Figure 1.17: Persons employed <strong>in</strong> high-technology knowledge <strong>in</strong>tensive services, 2006(% of total employment)6420EU-27SwedenF<strong>in</strong>landDenmarkUnited K<strong>in</strong>gdomBelgiumFranceIrelandNetherlandsGermanyHungaryLuxembourgMaltaItalySpa<strong>in</strong>Czech RepublicAustriaSloveniaBulgariaSlovakiaEstoniaLatviaPolandLithuaniaGreeceCyprusPortugalRomaniaIcelandNorwaySwitzerlandCroatiaTurkeySource: <strong>Eurostat</strong> (htec_emp_nat)42 EUROPE IN FIGURES — <strong>Eurostat</strong> <strong>yearbook</strong> <strong>2009</strong>
Science, technology, <strong>in</strong>novation and entrepreneurship:<strong>2009</strong>, the year of creativity and <strong>in</strong>novation 11.4 InnovationThe fifth Community Innovation Survey(CIS5) collected <strong>in</strong>formation about bothproduct and process <strong>in</strong>novation and organisationaland market<strong>in</strong>g <strong>in</strong>novation.For the purpose of this survey, ‘<strong>in</strong>novation’is def<strong>in</strong>ed as a new or significantlyimproved product (good or service) <strong>in</strong>troducedto the market, or the <strong>in</strong>troduction<strong>with</strong><strong>in</strong> an enterprise of a new or significantlyimproved process. Innovationsare based on the results of new technologicaldevelopments, new comb<strong>in</strong>ationsof exist<strong>in</strong>g technology, or the utilisationof other knowledge acquired by the enterprise.Innovations may be developed bythe <strong>in</strong>novat<strong>in</strong>g enterprise or by anotherenterprise. However, purely sell<strong>in</strong>g <strong>in</strong>novationswholly produced and developedby other enterprises is not <strong>in</strong>cluded as an<strong>in</strong>novation activity, nor is <strong>in</strong>troduc<strong>in</strong>gproducts <strong>with</strong> purely aesthetic changes.Innovations should be new to the enterpriseconcerned: for product <strong>in</strong>novationsthey do not necessarily have to be new tothe market and for process <strong>in</strong>novationsthe enterprise does not necessarily haveto be the first one to have <strong>in</strong>troduced theprocess.Enterprises <strong>with</strong> <strong>in</strong>novation activity<strong>in</strong>clude all types of <strong>in</strong>novator, namelyproduct <strong>in</strong>novators, process <strong>in</strong>novators,as well as enterprises <strong>with</strong> only on-go<strong>in</strong>gand/or abandoned <strong>in</strong>novation activities.The proportion of enterprises <strong>with</strong> <strong>in</strong>novationactivity may also be referred to asthe propensity to <strong>in</strong>novate.The EU’s Summary Innovation Index (SII)provides an overall assessment of <strong>in</strong>novationperformance. Based on performance<strong>in</strong> 2003 and 2007, four ma<strong>in</strong> group<strong>in</strong>gs ofMember States can be determ<strong>in</strong>ed. Thefirst group can be considered as ‘<strong>in</strong>novationleaders’: Sweden, F<strong>in</strong>land, Denmark,Germany and the United K<strong>in</strong>gdom allreported <strong>in</strong>dices well above the EU-27 average.The second group can be thoughtof as ‘<strong>in</strong>novation followers’, <strong>in</strong>clud<strong>in</strong>gLuxembourg, Ireland, the Netherlands,Austria, Belgium and France (scores belowthose of the <strong>in</strong>novation leaders butequal to or above that of the EU-27).The third group can be termed ‘moderate<strong>in</strong>novators’, <strong>in</strong>clud<strong>in</strong>g Estonia, theCzech Republic, Slovenia, Italy, Cyprusand Spa<strong>in</strong> (<strong>with</strong> scores below the EU-27average). The last group represent thosecountries that are ‘catch<strong>in</strong>g-up’, <strong>in</strong>clud<strong>in</strong>gMalta, Lithuania, Greece, Hungary,Portugal, Slovakia, Poland, Bulgaria,Latvia and Romania (<strong>with</strong> scores significantlybelow the EU-27 average, butmov<strong>in</strong>g towards the EU-27 average overtime).EUROPE IN FIGURES — <strong>Eurostat</strong> <strong>yearbook</strong> <strong>2009</strong>43
1Science, technology, <strong>in</strong>novation and entrepreneurship:<strong>2009</strong>, the year of creativity and <strong>in</strong>novationIn 2006 just under 40 % of the EU-27’senterprises were considered as <strong>in</strong>novative.Germany had the highest propensityto <strong>in</strong>novate <strong>with</strong> almost two thirds(62.6 %) of all enterprises hav<strong>in</strong>g someform of <strong>in</strong>novation activity. Generally,the majority of core <strong>in</strong>novative enterprisesoperated <strong>with</strong><strong>in</strong> the <strong>in</strong>dustrial economy(56.9 % among the 21 Member Statesfor which data are available), a share thatrose to 72.4 % <strong>in</strong> Bulgaria. A breakdownby enterprise size class shows that large(250 and more employees) <strong>in</strong>novative enterpriseswere more <strong>in</strong>cl<strong>in</strong>ed to <strong>in</strong>troduceproducts new to the market: almost half(47.4 %) of all large <strong>in</strong>novative enterprisesdid so <strong>in</strong> the EU-27 <strong>in</strong> 2006. In many ofthe Member States, large <strong>in</strong>novative enterpriseswere also more likely to <strong>in</strong>troduceprocesses <strong>in</strong>novations that they haddeveloped.In many of the Member States, a largemajority of <strong>in</strong>novation expenditure wasspent on the acquisition of mach<strong>in</strong>ery,equipment and software. Otherwise, thebreakdown of <strong>in</strong>novation expenditure<strong>in</strong> 2006 shows that <strong>in</strong>tramural R & Dspend<strong>in</strong>g was generally the next most importantcategory, followed by extramuralR & D expenditure.Us<strong>in</strong>g <strong>in</strong>formation from <strong>with</strong><strong>in</strong> the enterprisewas the most widespread sourceof <strong>in</strong>formation for <strong>in</strong>novation among <strong>in</strong>novativeenterprises <strong>in</strong> 2006 (44.0 % ofenterprises among those countries forwhich data are available). Only a relativelysmall proportion of <strong>in</strong>novativeenterprises used higher education <strong>in</strong>stitutes(4.3 %) or government and publicresearch <strong>in</strong>stitutes (3.7 %) as a source of<strong>in</strong>formation for <strong>in</strong>novation.The most important effect of <strong>in</strong>novationwas the product-oriented effect of improv<strong>in</strong>gthe quality of goods and services;across the EU (data for 20 MemberStates), 35.5 % of <strong>in</strong>novative enterprisesnoted improved quality, while 31.6 %of <strong>in</strong>novative enterprises cited a widerrange of goods and services as an effectof <strong>in</strong>novation. In each of the MemberStates for which data are available (exceptBulgaria), a majority of <strong>in</strong>novative enterprises<strong>in</strong>troduced organisational or market<strong>in</strong>g<strong>in</strong>novations, the most commoneffects of which were reduced customerresponse time and/or the improved qualityof goods and services.Innovative enterprises across the EU protectedtheir <strong>in</strong>tellectual property by register<strong>in</strong>gtrademarks (16.3 % of <strong>in</strong>novativeenterprises), apply<strong>in</strong>g for patents (8.0 %)and register<strong>in</strong>g <strong>in</strong>dustrial designs (7.6 %).Claim<strong>in</strong>g copyrights (3.6 %) was the leastused protection method <strong>in</strong> 2006.Among non-<strong>in</strong>novative enterprises <strong>in</strong> theEU <strong>in</strong> 2006 (data for 19 Member States),around one <strong>in</strong> six (16.7 %) stated that animportant factor <strong>in</strong> not <strong>in</strong>novat<strong>in</strong>g was aperceived lack of demand to do so. A littleunder one <strong>in</strong> every ten (9.0 %) non-<strong>in</strong>novativeenterprises across the EU statedthat they no longer <strong>in</strong>novated due to prior<strong>in</strong>novations.44 EUROPE IN FIGURES — <strong>Eurostat</strong> <strong>yearbook</strong> <strong>2009</strong>
Science, technology, <strong>in</strong>novation and entrepreneurship:<strong>2009</strong>, the year of creativity and <strong>in</strong>novation 1Figure 1.18: Summary Innovation Index (SII), 2003 and 2007 (1)1.000.750.500.250.00EU-27SwedenF<strong>in</strong>landDenmarkGermanyUnited K<strong>in</strong>gdomLuxembourgIrelandNetherlandsAustriaBelgiumFranceEstoniaCzech RepublicSloveniaItalyCyprusSpa<strong>in</strong>MaltaLithuaniaGreeceHungaryPortugalSlovakiaPolandBulgariaLatviaRomaniaSwitzerlandJapanUnited StatesNorwayCroatiaTurkey2003 2007(1) The Summary Innovation Index gives an ‘at a glance’ overview of aggregate national <strong>in</strong>novation performance and is a composite<strong>in</strong>dicator of 25 measures. The SII can range from 0 (worst performance) to 1 (best performance). Countries are categorised as either<strong>in</strong>novation leaders, <strong>in</strong>novation followers, moderate <strong>in</strong>novators or catch<strong>in</strong>g-up countries.Source: <strong>Europe</strong>an Commission, Directorate-General for Enterprise and Industry (<strong>Europe</strong>an Innovation Scoreboard, 2007 -Comparative analysis of <strong>in</strong>novation performance)Figure 1.19: Evolution of the Summary Innovation Index (SII)2007 SII0.80.60.40.20.0SwedenSwitzerlandDenmarkF<strong>in</strong>landGermanyUnited StatesJapanIreland United K<strong>in</strong>gdomBelgiumNetherlandsFrance AustriaNorwaySpa<strong>in</strong>CroatiaGreeceTurkeyItalyLuxembourgEstonia Slovenia Czech RepublicHungary Cyprus LithuaniaMaltaPolandSlovakiaBulgaria PortugalRomania Latvia-4 -3 -2 -1 0 1 2 3 4 5Average growth rate of SII (2003-2007)Source: <strong>Europe</strong>an Commission, Directorate-General for Enterprise and Industry (<strong>Europe</strong>an Innovation Scoreboard, 2007 -Comparative analysis of <strong>in</strong>novation performance)Figure 1.20: Innovative enterprises, 2006 (1)(% of all enterprises)7550250EU-27 (2)GermanyBelgiumF<strong>in</strong>landAustriaLuxembourgEstoniaIrelandDenmarkSwedenPortugalGreeceCyprusUnited K<strong>in</strong>gdomNetherlandsSloveniaCzech RepubicItalySpa<strong>in</strong>MaltaSlovakiaPolandLithuaniaRomaniaBulgariaHungaryLatviaNorwayTurkeyCroatia(1) France, not available.(2) Exclud<strong>in</strong>g France.Source: <strong>Eurostat</strong> (<strong>in</strong>n_cis5_prod)EUROPE IN FIGURES — <strong>Eurostat</strong> <strong>yearbook</strong> <strong>2009</strong>45
1Science, technology, <strong>in</strong>novation and entrepreneurship:<strong>2009</strong>, the year of creativity and <strong>in</strong>novationTable 1.10: Proportion of <strong>in</strong>novative enterprises which <strong>in</strong>troduced products new to the market orown-developed process <strong>in</strong>novations, 2006(% of <strong>in</strong>novative enterprises <strong>with</strong><strong>in</strong> size class or total)Process <strong>in</strong>novations:developed by the enterprise or groupWith10 to 49employeesWith50 to 249employeesWith> 250employeesProduct <strong>in</strong>novations:new to marketWith10 to 49employeesWith50 to 249employeesWith> 250employeesTotalTotalEU-27 (1) : : : : 32.4 29.3 36.9 47.4Belgium 40.0 38.2 43.3 49.8 41.4 38.6 44.1 65.3Bulgaria 37.9 37.3 38.1 41.4 41.3 38.6 46.2 45.7Czech Republic 39.0 37.6 41.8 39.7 38.9 32.5 48.3 51.2Denmark 35.0 32.5 41.3 41.1 33.8 30.9 37.9 50.7Germany 30.9 27.7 32.4 50.1 30.4 25.9 35.3 47.7Estonia 41.3 40.0 41.8 58.5 32.9 32.9 32.1 36.4Ireland 42.4 41.1 42.1 58.8 40.8 38.0 47.0 51.6Greece 48.6 46.7 55.8 47.9 35.8 29.5 55.0 58.6Spa<strong>in</strong> 47.8 46.3 51.8 54.1 18.3 14.8 26.0 39.5France : : : : : : : :Italy : : : : 29.5 26.8 37.2 50.1Cyprus 31.7 33.0 31.5 13.0 34.4 30.7 42.2 52.2Latvia : : : : 44.7 49.8 34.0 41.9Lithuania 35.2 33.2 40.7 36.9 36.0 36.8 32.4 38.5Luxembourg 45.5 42.1 51.7 52.9 58.9 59.3 52.3 74.2Hungary 28.5 28.7 25.6 33.8 30.9 30.1 29.6 38.2Malta 46.7 41.3 52.1 66.7 59.0 57.1 60.4 66.7Netherlands 23.0 22.1 22.4 35.4 48.1 46.1 50.8 59.5Austria 37.2 35.7 37.8 48.0 45.4 42.1 48.8 65.0Poland 47.0 48.1 46.1 46.0 32.7 33.1 30.6 37.5Portugal 46.2 45.8 47.4 46.9 29.8 26.5 37.1 48.5Romania 69.2 70.0 68.0 68.1 24.7 22.1 26.6 33.9Slovenia 39.2 41.2 35.1 40.0 51.1 52.5 44.9 59.4Slovakia 31.8 26.0 38.8 38.4 37.6 34.7 39.8 43.8F<strong>in</strong>land 38.3 38.0 38.1 42.1 44.6 44.3 40.7 58.0Sweden 36.6 36.8 : : 51.3 49.3 55.8 58.3United K<strong>in</strong>gdom : : : : 31.6 31.0 31.7 39.8Croatia 36.0 36.7 34.4 35.8 31.7 28.5 33.1 47.5Turkey 64.3 64.3 62.8 69.9 59.6 62.3 50.5 52.9Norway 29.3 28.5 29.8 36.8 39.9 40.6 37.0 42.0(1) Exclud<strong>in</strong>g France.Source: <strong>Eurostat</strong> (<strong>in</strong>n_cis5_prod)46 EUROPE IN FIGURES — <strong>Eurostat</strong> <strong>yearbook</strong> <strong>2009</strong>
Science, technology, <strong>in</strong>novation and entrepreneurship:<strong>2009</strong>, the year of creativity and <strong>in</strong>novation 1Figure 1.21: Enterprises engaged <strong>in</strong> <strong>in</strong>novation activities, by economic activities, 2006 (1)(% share of <strong>in</strong>novative enterprises)100%75%50%25%0%EU (2)BelgiumBulgariaCzech RepublicDenmarkGermanyEstoniaIrelandGreeceSpa<strong>in</strong>CyprusLithuaniaLuxembourgHungaryMaltaNetherlandsAustriaPolandBus<strong>in</strong>ess activitiesF<strong>in</strong>ancial <strong>in</strong>termediationTransport, storage and communicationWholesale tradeIndustryPortugalRomaniaSloveniaSlovakiaCroatiaTurkeyNorway(1) Data for France, Italy, Latvia, F<strong>in</strong>land and the United K<strong>in</strong>gdom, not available; data for Sweden, <strong>in</strong>complete; the core aggregatecovers enterprises <strong>in</strong> <strong>in</strong>dustry (NACE Sections C, D and E), wholesale trade (NACE Division 51), transport, storage and communication(NACE Section I), f<strong>in</strong>ancial <strong>in</strong>termediation (NACE Section J) and bus<strong>in</strong>ess activities (NACE Division 72 and NACE Groups 74.2 and 74.3).(2) Average based upon data for 21 Member States, exclud<strong>in</strong>g France, Italy, Latvia, F<strong>in</strong>land, Sweden and the United K<strong>in</strong>gdom.Source: <strong>Eurostat</strong> (<strong>in</strong>n_cis5_exp)Figure 1.22: Innovative enterprises hav<strong>in</strong>g received any public fund<strong>in</strong>g, 2006 (1)(% share of <strong>in</strong>novative enterprises)50403020100CyprusGreeceNetherlandsAustriaHungaryBelgiumPolandSpa<strong>in</strong>SloveniaMaltaCzech RepublicLuxembourgSlovakiaGermanyLithuaniaRomaniaPortugalEstoniaBulgariaTurkeyCroatia(1) Denmark, Ireland, France, Italy, Latvia, F<strong>in</strong>land, Sweden and the United K<strong>in</strong>gdom, not available.Source: <strong>Eurostat</strong> (<strong>in</strong>n_cis5_pub)EUROPE IN FIGURES — <strong>Eurostat</strong> <strong>yearbook</strong> <strong>2009</strong>47
1Science, technology, <strong>in</strong>novation and entrepreneurship:<strong>2009</strong>, the year of creativity and <strong>in</strong>novationTable 1.11: Breakdown of <strong>in</strong>novation expenditure by category, 2006(% of total <strong>in</strong>novation expenditure)Expenditure foracquisition ofmach<strong>in</strong>ery,equipment &softwareExpenditure foracquisition ofotherexternalknowledgeExpenditure <strong>in</strong><strong>in</strong>tramural R&DExpenditure <strong>in</strong>extramural R&DBelgium 47.1 22.2 29.4 1.3Bulgaria 5.8 1.2 91.3 1.7Czech Republic 24.0 17.8 55.1 3.2Denmark 59.0 17.2 18.9 5.0Germany : : : :Estonia 8.1 3.4 87.1 1.4Ireland 37.8 6.1 40.7 15.3Greece 35.4 8.4 54.9 1.3Spa<strong>in</strong> 35.6 14.2 33.9 6.3France : : : :Italy : : : :Cyprus 2.4 8.1 84.9 4.7Latvia : : : :Lithuania 24.6 7.7 65.2 2.5Luxembourg 38.9 14.3 36.8 10.0Hungary 17.4 17.7 61.3 3.6Malta 22.4 3.5 63.0 11.1Netherlands 59.3 17.6 20.8 2.3Austria : : : :Poland 8.7 4.4 83.3 3.6Portugal 27.2 7.1 58.9 6.9Romania 14.0 1.9 81.6 2.6Slovenia 32.6 7.4 58.0 2.1Slovakia 7.6 3.9 86.2 2.4F<strong>in</strong>land : : : :Sweden 60.2 19.8 : :United K<strong>in</strong>gdom : : : :Croatia 19.8 7.5 67.9 4.7Turkey 30.2 3.0 62.5 3.9Source: <strong>Eurostat</strong> (<strong>in</strong>n_cis5_exp)48 EUROPE IN FIGURES — <strong>Eurostat</strong> <strong>yearbook</strong> <strong>2009</strong>
Science, technology, <strong>in</strong>novation and entrepreneurship:<strong>2009</strong>, the year of creativity and <strong>in</strong>novation 1Figure 1.23: Sources of <strong>in</strong>formation for <strong>in</strong>novation, average, 2006 (1)(% of enterprises <strong>with</strong> <strong>in</strong>novation activities)50403020100With<strong>in</strong>enterpriseClientsorcustomersSuppliersConf.,trade fairs,exhibitionsJournals &public.CompetitorsConsultantsProfessional& <strong>in</strong>dustryassociationsHighereducation<strong>in</strong>stitutesGovt. orpublicresearch<strong>in</strong>stitutes(1) Note that multiple answers could be given; average based upon data for 18 Member States, exclud<strong>in</strong>g Denmark, Germany, Ireland,France, Italy, Latvia, F<strong>in</strong>land, Sweden and the United K<strong>in</strong>gdom.Source: <strong>Eurostat</strong> (<strong>in</strong>n_cis5_sou)Figure 1.24: Effects of <strong>in</strong>novation, average, 2006 (1)(% of enterprises <strong>with</strong> <strong>in</strong>novation activities)403020100ImprovedqualityWiderrangeof goods& servicesNew marketsor greatermarketshareImprovedflexibilityIncreasedcapacityof productionor serviceprovisionRegulationrequ'mentsmetLower unitlabourcostsLess impacton environ.or betterhealth& safetyLower unitmaterials &energy use(1) Note that multiple answers could be given; average based upon data for 20 Member States, exclud<strong>in</strong>g Belgium, Germany, Ireland,France, Italy, Slovenia and the United K<strong>in</strong>gdom.Source: <strong>Eurostat</strong> (<strong>in</strong>n_cis5_eff)EUROPE IN FIGURES — <strong>Eurostat</strong> <strong>yearbook</strong> <strong>2009</strong>49
1Science, technology, <strong>in</strong>novation and entrepreneurship:<strong>2009</strong>, the year of creativity and <strong>in</strong>novationTable 1.12: Effects of <strong>in</strong>novation, 2006 (1)(% of enterprises <strong>with</strong> <strong>in</strong>novation activities)Widerrange ofgoods &servicesNewmarkets/greatermarketshareIncr.cap. ofprod./serviceprov.LowerunitlabourcostsLower unitmaterials &energy useLess env.impact orbetterhealth &safetyMetregulationsImpr.qualityImpr.flexib.Belgium : : : : : : : : :Bulgaria 38.2 30.1 38.9 21.0 21.7 15.9 13.2 20.9 25.3Czech Republic 39.3 28.8 38.2 25.4 26.1 18.2 14.2 13.8 7.2Denmark 18.6 15.8 16.6 15.3 18.8 11.5 7.3 5.3 9.2Germany : : : : : : : : :Estonia 29.8 25.7 27.2 20.0 20.5 14.3 7.8 8.4 6.8Ireland : : : : : : : : :Greece 9.1 11.6 5.8 8.3 9.2 26.2 20.7 12.9 11.3Spa<strong>in</strong> 25.2 18.6 33.5 22.6 27.4 12.9 8.5 13.4 19.8France : : : : : : : : :Italy : : : : : : : : :Cyprus 45.3 37.9 57.5 69.8 62.5 29.2 19.9 38.0 56.0Latvia 27.8 15.8 26.5 16.4 17.3 6.2 5.4 6.3 13.9Lithuania 32.4 28.0 34.4 25.0 30.5 10.7 8.5 9.9 25.2Luxembourg 57.7 45.1 62.1 35.2 33.6 13.0 6.8 12.9 28.5Hungary 32.4 26.2 37.2 21.9 22.3 6.2 7.2 13.6 19.8Malta 27.7 15.9 31.3 21.0 18.5 11.8 7.7 8.7 20.0Netherlands 44.8 38.8 44.0 31.8 31.6 16.6 10.5 11.7 14.6Austria 39.4 33.7 48.7 30.0 27.8 11.9 9.7 13.4 18.5Poland 36.1 26.9 38.1 20.8 25.7 13.8 11.6 18.5 24.7Portugal 34.1 25.4 44.3 31.2 36.5 22.4 15.0 24.1 25.6Romania 37.0 29.4 41.7 28.2 34.1 18.3 14.8 23.7 20.9Slovenia : : : : : : : : :Slovakia 38.1 23.1 41.6 28.5 27.2 8.0 10.8 13.8 13.4F<strong>in</strong>land 16.5 15.5 16.9 14.4 15.3 10.7 5.2 7.2 9.6Sweden 33.0 24.3 34.2 18.4 23.1 17.0 10.2 14.0 17.8United K<strong>in</strong>gdom : : : : : : : : :Croatia 39.1 32.8 52.3 34.5 32.2 19.9 15.1 18.0 31.5Turkey 38.3 32.6 49.5 39.4 39.4 18.0 10.2 21.6 28.8(1) Note that multiple answers could be given.Source: <strong>Eurostat</strong> (<strong>in</strong>n_cis5_eff)50 EUROPE IN FIGURES — <strong>Eurostat</strong> <strong>yearbook</strong> <strong>2009</strong>
Science, technology, <strong>in</strong>novation and entrepreneurship:<strong>2009</strong>, the year of creativity and <strong>in</strong>novation 1Table 1.13: Enterprises that <strong>in</strong>troduced organisational and/or market<strong>in</strong>g <strong>in</strong>novations, 2006 (1)(% of enterprises <strong>with</strong> <strong>in</strong>novation activities)ReducedcustomerresponsetimeImprovedquality ofgoods &servicesReducedcostsper unitoutputImproved employeesatisfaction and/orreduced rates ofemployee turnoverTotalBelgium 66.8 25.7 26.9 12.7 9.8Bulgaria 46.2 12.9 23.1 10.9 9.9Czech Republic 69.7 21.2 27.8 11.9 13.0Denmark 76.0 22.1 17.0 12.6 12.1Germany 84.6 : : : :Estonia 70.9 26.9 24.8 13.6 12.5Ireland 65.7 38.6 39.7 29.6 16.6Greece 86.2 8.3 1.5 23.6 21.3Spa<strong>in</strong> : : : : :France : : : : :Italy : : : : :Cyprus 80.1 42.1 45.4 22.3 27.7Latvia 70.5 23.2 30.1 6.7 11.4Lithuania 73.1 16.2 25.3 15.1 15.5Luxembourg 83.4 34.4 46.9 14.2 18.8Hungary 70.9 42.5 39.6 21.0 11.5Malta 82.1 31.8 33.8 21.0 15.9Netherlands 53.5 19.4 23.3 10.0 9.5Austria 77.9 26.2 31.9 10.8 14.0Poland 72.2 26.9 25.8 9.9 10.2Portugal 82.4 37.9 43.3 20.9 18.5Romania 73.9 34.9 39.2 16.2 16.0Slovenia 76.6 51.4 56.3 37.6 24.7Slovakia : : : : :F<strong>in</strong>land : : : : :Sweden : : : : :United K<strong>in</strong>gdom : : : : :Croatia 76.4 34.9 37.7 13.6 19.2Turkey 76.6 25.4 37.6 15.6 14.8Norway 64.0 13.0 17.5 14.5 9.8(1) Note that multiple answers could be given.Source: <strong>Eurostat</strong> (<strong>in</strong>n_cis5_mo and <strong>in</strong>n_cis5_oref)Highly important effects of organisational <strong>in</strong>novationEUROPE IN FIGURES — <strong>Eurostat</strong> <strong>yearbook</strong> <strong>2009</strong>51
1Science, technology, <strong>in</strong>novation and entrepreneurship:<strong>2009</strong>, the year of creativity and <strong>in</strong>novationFigure 1.25: Protection methods (copyright, registered designs, trademarks, patents) used by<strong>in</strong>novative and non-<strong>in</strong>novative enterprises, average, 2006 (1)(% of enterprises <strong>with</strong> <strong>in</strong>novation activities)20151050Registered atrademarkApplied fora patentRegistered an<strong>in</strong>dustrial designClaimedcopyright(1) Note that multiple answers could be given; average based upon data for 18 Member States, exclud<strong>in</strong>g Denmark, Germany, France,Italy, Latvia, Slovenia, F<strong>in</strong>land, Sweden and the United K<strong>in</strong>gdom.Source: <strong>Eurostat</strong> (<strong>in</strong>n_cis5_pat)Figure 1.26: Enterprises cit<strong>in</strong>g various highly important hamper<strong>in</strong>g effects, average, 2006 (1)(% of enterprises <strong>with</strong> <strong>in</strong>novation activities)3020100Innovationcoststoo highLack offunds<strong>with</strong><strong>in</strong>enterpriseLack off<strong>in</strong>ancefrom outsideenterpriseMarketdom<strong>in</strong>atedbyestablishedenterprisesLack ofqualifiedpersonnelUncerta<strong>in</strong>demandDifficulty<strong>in</strong> f<strong>in</strong>d<strong>in</strong>gcooperationpartnersLack of<strong>in</strong>formationtechnologyLack of<strong>in</strong>formationon markets(1) Note that multiple answers could be given; average based upon data for 19 Member States, exclud<strong>in</strong>g Belgium, Denmark, Germany,France, Italy, Slovenia, F<strong>in</strong>land and the United K<strong>in</strong>gdom.Source: <strong>Eurostat</strong> (<strong>in</strong>n_cis5_ham)Figure 1.27: Reasons not to <strong>in</strong>novate, 2006 (1)(% of non-<strong>in</strong>novative enterprises)403020100Average (2)BulgariaCzech RepublicEstoniaIrelandGreeceSpa<strong>in</strong>CyprusLatviaLithuaniaLuxembourgHungaryMaltaNetherlandsAustriaPolandPortugalRomaniaPrior <strong>in</strong>novations No demand for <strong>in</strong>novationsSlovakiaSwedenCroatiaTurkeyNorway(1) Note that multiple answers could be given; Belgium, Denmark, Germany, Italy, Slovenia and F<strong>in</strong>land, not available.(2) Average based upon data for 19 Member States, exclud<strong>in</strong>g Belgium, Denmark, Germany, France, Italy, Slovenia, F<strong>in</strong>land and theUnited K<strong>in</strong>gdom.Source: <strong>Eurostat</strong> (<strong>in</strong>n_cis5_ham)52 EUROPE IN FIGURES — <strong>Eurostat</strong> <strong>yearbook</strong> <strong>2009</strong>
Science, technology, <strong>in</strong>novation and entrepreneurship:<strong>2009</strong>, the year of creativity and <strong>in</strong>novation 11.5 PatentsIntellectual property rights provide a l<strong>in</strong>kbetween <strong>in</strong>novation, <strong>in</strong>ventions and themarketplace. Apply<strong>in</strong>g for a patent, forexample, makes an <strong>in</strong>vention public but atthe same time gives it protection. A countof patents is one measure that reflectsa country’s <strong>in</strong>ventive activity and alsoshows its capacity to exploit knowledgeand translate it <strong>in</strong>to potential economicga<strong>in</strong>s. In this context, <strong>in</strong>dicators based onpatent statistics are widely used to assessthe <strong>in</strong>ventive and <strong>in</strong>novative performance.While patents are generally usedto protect R & D results, they are alsosignificant as a source of technical <strong>in</strong>formation,which may prevent re-<strong>in</strong>vent<strong>in</strong>gand re-develop<strong>in</strong>g ideas because of a lackof <strong>in</strong>formation. More <strong>in</strong>formation on thesources and methods concern<strong>in</strong>g patentdata are available <strong>in</strong> Subchapter 14.3 ofthis publication.The fall<strong>in</strong>g trend <strong>in</strong> patent applicationsbetween 2000 and 2005 is l<strong>in</strong>ked tothe length of patent<strong>in</strong>g procedures andshould not be understood as a real decl<strong>in</strong>e<strong>in</strong> patent<strong>in</strong>g activity. For this reasonthe 2005 <strong>figures</strong> <strong>in</strong> <strong>Eurostat</strong>’s referencedatabase are flagged as provisional.Among the Member States, Germany hadby far the highest number of patent applicationsto the <strong>Europe</strong>an Patent Office(EPO), some 11 500 <strong>in</strong> 2005 (which wasalmost half the total number made by enterprisesfrom <strong>with</strong><strong>in</strong> the EU-27). In relativeterms, the Member States <strong>with</strong> thehighest number of patent applications permillion <strong>in</strong>habitants were Luxembourg(143) and Germany (139), followed someway beh<strong>in</strong>d by Austria (79).About one third (32.5 %) of the high-technologypatent applications made to theEPO <strong>in</strong> 2005 came from EU-27 MemberStates, a further one quarter (25.6 %)com<strong>in</strong>g from Japan. A little over one half(52.4 %) of these high-technology applicationsconcerned communications technology,and a further one third (32.1 %)related to computer and automated bus<strong>in</strong>essequipment.A little over one fifth (21.7 %) of the patentapplications by EU-27 Member Statesto the EPO <strong>in</strong> 2005 concerned perform<strong>in</strong>goperations (such as pr<strong>in</strong>t<strong>in</strong>g and shap<strong>in</strong>g)and transport (such as forms of transportor hoist<strong>in</strong>g, lift<strong>in</strong>g and haul<strong>in</strong>g). Patentsconcern<strong>in</strong>g electricity (such as basic elements,circuitry and power distribution)were the next most common (14.7 %), followedclosely by patents <strong>in</strong> physics (suchas optics, check<strong>in</strong>g devices and <strong>in</strong>formationstorage) and then human necessities(such as foodstuffs, personal or domesticarticles and health articles).EUROPE IN FIGURES — <strong>Eurostat</strong> <strong>yearbook</strong> <strong>2009</strong>53
1Science, technology, <strong>in</strong>novation and entrepreneurship:<strong>2009</strong>, the year of creativity and <strong>in</strong>novationFigure 1.28: Patent applications to the <strong>Europe</strong>an Patent Office (EPO), 2005 (1)(applications per million <strong>in</strong>habitants)375 455300 380225150750EU-27LuxembourgGermanyAustriaBelgiumSwedenFranceNetherlandsItalyF<strong>in</strong>landDenmarkUnitedMaltaSloveniaSpa<strong>in</strong>CyprusIrelandPortugalGreeceCzechSlovakiaHungaryPolandLatviaEstoniaLithuaniaRomaniaBulgariaCroatiaLiechtenste<strong>in</strong>SwitzerlandJapanUnited StatesNorwayIcelandTurkeyCh<strong>in</strong>a(1) Data refer to applications filed directly under the <strong>Europe</strong>an Patent Convention or to applications filed under the Patent CooperationTreaty and designated to the EPO (Euro-PCT). For patent applications to the EPO all direct applications (EPO-direct) aretaken <strong>in</strong>to account, but among the PCT applications (applications follow<strong>in</strong>g the procedure laid down by the PCT) made to the EPOonly those that have entered <strong>in</strong>to the regional phase are counted. Patent applications are counted accord<strong>in</strong>g to the year <strong>in</strong> which theywere filed. Estimates.Source: <strong>Eurostat</strong> (pat_ep_nipc)Figure 1.29: High-technology patent applications made to the <strong>Europe</strong>an Patent Office (EPO),2005 (1)(% of total)By orig<strong>in</strong>By fieldOther extraEU-27 countriesSwitzerland2.2%1.9%Taiwan2.1%Ch<strong>in</strong>a (exclud<strong>in</strong>gHong Kong)2.8% Canada3.9%EU-27 Member States32.5%South Korea13.4% United States15.6%Japan25.6%Communicationstechnology52.4%Semiconductors9.5%Lasers1.0%Computer & automatedbus<strong>in</strong>ess equipment32.1%Micro-organisms &genetic eng<strong>in</strong>eer<strong>in</strong>g3.7%Aviation1.3%(1) Provisional.Source: <strong>Eurostat</strong> (pat_ep_ntec)54 EUROPE IN FIGURES — <strong>Eurostat</strong> <strong>yearbook</strong> <strong>2009</strong>
Science, technology, <strong>in</strong>novation and entrepreneurship:<strong>2009</strong>, the year of creativity and <strong>in</strong>novation 1Table 1.14: Patent applications to the <strong>Europe</strong>an Patent Office (EPO), 2005 (1)(permillion<strong>in</strong>hab.)HumannecessitiesPerform<strong>in</strong>goper.;transp.Mech.eng.;light<strong>in</strong>g;heat<strong>in</strong>g;weaponsChem.; Textiles; FixedElectricity(1 000)metall. paper constr.PhysicsEU-27 23.4 47.7 12.4 21.7 6.4 1.9 5.8 11.7 13.0 14.8Belgium 0.7 66.6 13.8 17.9 11.5 1.9 3.8 5.4 14.9 19.6Bulgaria 0.0 0.3 : 37.5 : : : : 25.1 37.5Czech Republic 0.0 3.5 8.9 32.5 14.6 5.6 3.7 : 11.5 13.3Denmark 0.2 40.0 23.5 13.7 4.5 0.5 10.2 6.8 8.7 20.6Germany 11.5 138.9 10.9 24.0 6.2 1.8 5.4 12.8 13.0 13.9Estonia 0.0 1.5 25.0 : : : : : 50.0 25.0Ireland 0.0 11.8 8.7 17.3 2.1 0.7 4.1 16.5 18.4 15.8Greece 0.0 3.9 14.9 11.4 7.6 : 9.9 11.4 10.3 16.0Spa<strong>in</strong> 0.6 13.6 16.9 22.3 8.7 1.6 9.7 10.0 7.8 9.0France 3.6 57.7 13.2 18.5 4.8 0.9 5.4 11.5 14.6 19.0Italy 2.8 48.0 16.4 23.4 4.9 3.8 6.6 12.3 9.0 10.0Cyprus 0.0 12.5 14.3 : : 21.4 42.9 10.7 10.7 :Latvia 0.0 1.6 : 53.3 : : : : 26.7 20.0Lithuania 0.0 0.6 : : 25.0 : : : 50.0 :Luxembourg 0.1 143.3 4.6 28.8 11.5 : 2.1 17.9 8.3 9.2Hungary 0.0 2.1 17.9 10.4 15.8 : 2.4 : 12.6 17.3Malta 0.0 17.6 84.7 : : : : : 3.5 11.7Netherlands 0.9 56.5 14.2 22.0 12.7 1.2 7.1 4.7 16.6 10.0Austria 0.6 79.1 11.0 19.7 8.1 3.9 9.9 12.0 11.4 10.3Poland 0.1 1.7 2.1 11.6 7.3 1.5 5.4 18.8 12.5 26.0Portugal 0.1 5.6 6.7 4.4 3.3 : 5.9 17.3 8.4 36.7Romania 0.0 0.4 26.0 39.0 : : : : 20.8 13.0Slovenia 0.0 15.1 16.6 16.6 4.7 6.6 8.3 5.3 6.6 1.9Slovakia 0.0 2.2 : 4.2 20.1 : 8.4 50.5 : 16.8F<strong>in</strong>land 0.2 44.7 13.4 13.1 8.0 4.3 3.4 7.9 12.5 25.2Sweden 0.5 60.2 7.3 19.0 7.1 0.6 5.2 10.8 17.1 20.7United K<strong>in</strong>gdom 1.3 21.1 12.1 14.8 6.9 1.5 5.0 11.1 16.3 20.6Croatia 0.0 1.0 31.4 : : : : 11.8 : 33.1Turkey 0.0 0.6 11.3 20.1 8.8 2.5 12.6 17.6 4.4 7.5Iceland 0.0 10.2 66.7 : : : : 33.3 : :Liechtenste<strong>in</strong> 0.0 391.6 35.2 27.1 11.1 : 3.7 10.5 8.9 :Norway 0.1 14.5 8.0 23.6 6.8 2.0 1.9 9.9 7.0 14.4Switzerland 1.6 219.0 14.2 18.7 6.9 2.2 4.7 5.7 21.5 12.3Ch<strong>in</strong>a 0.5 0.4 8.3 10.5 2.3 0.2 0.9 2.0 11.9 56.4Japan 9.2 71.8 5.0 19.5 6.5 0.8 0.5 7.8 26.9 24.5Russian Federation 0.0 0.3 7.9 16.0 14.7 4.1 2.4 : 17.6 20.6United States 6.4 21.7 14.2 13.6 7.3 0.7 1.1 9.7 21.0 21.3(1) Provisional.Source: <strong>Eurostat</strong> (pat_ep_nipc)Total of which (%):EUROPE IN FIGURES — <strong>Eurostat</strong> <strong>yearbook</strong> <strong>2009</strong>55
1Science, technology, <strong>in</strong>novation and entrepreneurship:<strong>2009</strong>, the year of creativity and <strong>in</strong>novation1.6 Bus<strong>in</strong>ess start-ups andentrepreneurshipThe Entrepreneurship Action Plan adopted<strong>in</strong> 2004 established a mechanism to fosterentrepreneurship. A 2006 f<strong>in</strong>al reporton its implementation concluded that itsunderly<strong>in</strong>g goals had been achieved, andthat it had built the path to further actionsto be carried out under the competitivenessand <strong>in</strong>novation framework programme(CIP). Furthermore, it providedthe platform for stronger recognition ofSME issues lead<strong>in</strong>g to the June 2008 proposalby the <strong>Europe</strong>an Commission fora ‘Small Bus<strong>in</strong>ess Act’ (5) . This proposalaims to address the needs of <strong>Europe</strong>’ssmall and medium-sized enterprises, tomake <strong>Europe</strong> more entrepreneurial, andto help its enterprises thrive, by improv<strong>in</strong>gthe conditions for SMEs while tak<strong>in</strong>gaccount of their diversity. The proposalfocuses on promot<strong>in</strong>g entrepreneurship,anchor<strong>in</strong>g the ‘Th<strong>in</strong>k Small First’ pr<strong>in</strong>ciple<strong>in</strong> policy-mak<strong>in</strong>g and support<strong>in</strong>gSMEs’ growth.A majority (57.7 %) of <strong>in</strong>dividuals <strong>in</strong> theEU-25 that launched or were launch<strong>in</strong>gtheir own bus<strong>in</strong>esses did so because theysaw an opportunity to do so, rather thansolely out of necessity (27.0 %). Amongthe Member States, Greece stood out asthe only country where the s<strong>in</strong>gle largestfactor for bus<strong>in</strong>ess start-ups was out of necessity(42.4 % of <strong>in</strong>dividuals), which was<strong>in</strong> stark contrast to the four fifths (82.9 %)of entrepreneurs <strong>in</strong> Denmark who did sobecause they saw an opportunity.A little over one half of the EU-25’s entrepreneursstated that hav<strong>in</strong>g an appropriatebus<strong>in</strong>ess idea and receiv<strong>in</strong>g necessaryf<strong>in</strong>ancial support were very important<strong>in</strong> mak<strong>in</strong>g their decision to set up theirbus<strong>in</strong>esses. For a little over one quarterof entrepreneurs, dissatisfaction <strong>with</strong>their previous situation and/or changes<strong>in</strong> family circumstances were also veryimportant reasons to start-up their bus<strong>in</strong>esses,<strong>with</strong> one third (35.5 %) also cit<strong>in</strong>gcontact <strong>with</strong> an appropriate bus<strong>in</strong>esspartner as very important.Among <strong>in</strong>dividuals who had never starteda bus<strong>in</strong>ess and were not tak<strong>in</strong>g stepsto start one, a little under two thirds(61.7 %) had never thought about it, thisshare ris<strong>in</strong>g to about three quarters <strong>in</strong>Belgium and Lithuania. A relatively highproportion of <strong>in</strong>dividuals (20.5 %) acrossthe EU-25, who had not yet started abus<strong>in</strong>ess, had at one time thought aboutdo<strong>in</strong>g so, and <strong>in</strong> cases taken steps to do sobefore giv<strong>in</strong>g up. In Germany, the UnitedK<strong>in</strong>gdom and Austria, the proportion ofthose who did not follow through their<strong>in</strong>terest was relatively high (about 25 %).The employer enterprise birth rate forthe bus<strong>in</strong>ess economy (NACE Rev. 1.1Sections C to K, exclud<strong>in</strong>g hold<strong>in</strong>g companies)was 11.3 % among the 13 MemberStates for which data are available for2005. This compared <strong>with</strong> a birth rate of9.3 % for the same countries when consider<strong>in</strong>gall enterprises, not just those<strong>with</strong> employees. Employer enterprisebirth rates were generally higher thanbirth rates for all enterprises <strong>in</strong> 2005,exceptions be<strong>in</strong>g <strong>in</strong> Bulgaria, Latvia andRomania.(5) http://ec.europa.eu/enterprise/entrepreneurship/sba_en.htm.56 EUROPE IN FIGURES — <strong>Eurostat</strong> <strong>yearbook</strong> <strong>2009</strong>
Science, technology, <strong>in</strong>novation and entrepreneurship:<strong>2009</strong>, the year of creativity and <strong>in</strong>novation 1There is considerable policy <strong>in</strong>terest <strong>in</strong> theway <strong>in</strong> which enterprises grow and createemployment. Across the 12 MemberStates for which data are available, thenumber of persons employed <strong>in</strong> newlyborn enterprises <strong>in</strong> 2005 was the equivalentof 3.5 % of the total number of personsemployed <strong>in</strong> all employer enterprises;the correspond<strong>in</strong>g share for employerenterprise deaths <strong>in</strong> 2004 was 2.9 % of theworkforce. Newly born enterprises accountedfor a particularly high share ofthe workforce <strong>in</strong> Slovakia (5.9 %), otherhigh shares be<strong>in</strong>g <strong>in</strong> Spa<strong>in</strong> (4.4 %) andRomania (4.1 %).There is also <strong>in</strong>terest <strong>in</strong> enterprises (newor established) that display particularlyrapid rates of growth. This sub-group arelikely to have behaved <strong>in</strong> an atypical fashion,<strong>in</strong> that they are likely to have donesometh<strong>in</strong>g different or new <strong>in</strong> terms ofproduct or process development, <strong>in</strong> orderto achieve such rapid growth. Acrossthe 14 Member States for which data areavailable for 2005, high-growth enterprisesaccounted for an average 3.8 % ofemployment across active enterprises and5.9 % of turnover. In many of the MemberStates that jo<strong>in</strong>ed the EU <strong>in</strong> either 2004or 2007, these rates were considerablyhigher.Figure 1.30: Preference for be<strong>in</strong>g an employee or self-employed, 2007(%)100%75%50%25%0%EU-25SloveniaBelgiumSwedenDenmarkLuxembourgNetherlandsAustriaSlovakiaFranceF<strong>in</strong>landCzech RepublicGermanySpa<strong>in</strong>United K<strong>in</strong>gdomEstoniaHungaryMaltaPolandIrelandGreeceItalyCyprusLatviaPortugalLithuaniaNorwayUnited StatesIcelandBe<strong>in</strong>g an employeeBe<strong>in</strong>g self-employedNeitherDid not knowSource: <strong>Europe</strong>an Commission, Flash Eurobarometer 192 (Entrepreneurship Survey of the EU (25 Member States), United States, Icelandand Norway)EUROPE IN FIGURES — <strong>Eurostat</strong> <strong>yearbook</strong> <strong>2009</strong>57
1Science, technology, <strong>in</strong>novation and entrepreneurship:<strong>2009</strong>, the year of creativity and <strong>in</strong>novationFigure 1.31: Bus<strong>in</strong>ess start-up decision by entrepreneurs, 2007(%)100%75%50%25%0%EU-25DenmarkSwedenNetherlandsSloveniaIrelandUnited K<strong>in</strong>gdomBelgiumF<strong>in</strong>landMaltaSlovakiaPolandGermanyAustriaCzech RepublicItalyFranceLuxembourgPortugalSpa<strong>in</strong>Came across an opportunityIt was a necessityBoth an opportunity and necessityDid not knowLatviaLithuaniaCyprusHungaryEstoniaGreeceUnited StatesNorwayIcelandSource: <strong>Europe</strong>an Commission, Flash Eurobarometer 192 (Entrepreneurship Survey of the EU (25 Member States), United States, Icelandand Norway)Figure 1.32: Change <strong>in</strong> ‘real’ employer bus<strong>in</strong>esses, total economy (NACE Rev. 1.1 Sections A to Q),1997-2007 (1)(percentage po<strong>in</strong>ts)30150-15-30HungaryBelgiumSpa<strong>in</strong>IrelandGreeceEstoniaPolandFranceSloveniaDenmarkF<strong>in</strong>landSwedenRomaniaPortugalAustriaNetherlandsUnited K<strong>in</strong>gdomGermanyCzech RepublicItalyLuxembourgNorwayIcelandSwitzerland(1) Overall growth of the number of self-employed persons (aged 15 or more), who are not work<strong>in</strong>g alone and who are not familyworkers (<strong>in</strong> other words, who employ at least one other person); Bulgaria, Cyprus, Latvia, Lithuania, Malta and Slovakia, not available.Source: <strong>Eurostat</strong> (lfsa_egaps)58 EUROPE IN FIGURES — <strong>Eurostat</strong> <strong>yearbook</strong> <strong>2009</strong>
Science, technology, <strong>in</strong>novation and entrepreneurship:<strong>2009</strong>, the year of creativity and <strong>in</strong>novation 1Figure 1.33: Preference for self-employment status - ma<strong>in</strong> elements, EU-25, 2007(% of those who have started a bus<strong>in</strong>ess or are tak<strong>in</strong>g steps to start one or who thought of it or had alreadytaken steps to start a bus<strong>in</strong>ess but gave up)1007550250Dissatisfaction <strong>with</strong>previous situationAn appropriatebus<strong>in</strong>ess ideaContact <strong>with</strong> anappropriate bus<strong>in</strong>esspartnerReceiv<strong>in</strong>g the necessaryf<strong>in</strong>ancial meansChanges <strong>in</strong> familycircumstancesRather importantVery importantSource: <strong>Europe</strong>an Commission, Flash Eurobarometer 192 (Entrepreneurship Survey of the EU (25 Member States), United States, Icelandand Norway)Figure 1.34: Experience <strong>in</strong> sett<strong>in</strong>g up a bus<strong>in</strong>ess: among those who have not yet done this,EU-25, 2007(%)100%75%50%25%0%EU-25BelgiumLithuaniaPortugalSpa<strong>in</strong>F<strong>in</strong>landItalyFranceLuxembourgNetherlandsHungaryIrelandEstoniaSwedenAustriaSloveniaUnited K<strong>in</strong>gdomLatviaGermanyCyprusDenmarkGreeceMaltaPolandCzech RepublicSlovakiaNorwayIcelandUnited StatesNever thought of start<strong>in</strong>g a bus<strong>in</strong>essTh<strong>in</strong>k<strong>in</strong>g about start<strong>in</strong>g a bus<strong>in</strong>essThought about start<strong>in</strong>g a bus<strong>in</strong>ess, or had taken steps, but gave upDid not know or not applicableSource: <strong>Europe</strong>an Commission, Flash Eurobarometer 192 (Entrepreneurship Survey of the EU (25 Member States), United States, Icelandand Norway)EUROPE IN FIGURES — <strong>Eurostat</strong> <strong>yearbook</strong> <strong>2009</strong>59
1Science, technology, <strong>in</strong>novation and entrepreneurship:<strong>2009</strong>, the year of creativity and <strong>in</strong>novationFigure 1.35: Comparison of enterprise birth rates and employer enterprise birth rates, 2005 (1)(%)20151050EU (2)RomaniaSlovakiaEstoniaLithuaniaSpa<strong>in</strong>Czech RepublicLuxembourgHungaryBulgariaLatviaF<strong>in</strong>landNetherlandsItalyAustriaUnited K<strong>in</strong>gdom (3)France (3)Slovenia (3)Cyprus (3)Sweden (3)Employer enterprise birth ratesEnterprise birth rates(1) Enterprise birth rates are def<strong>in</strong>ed as the number of enterprise births <strong>in</strong> the reference period (t), divided by the number ofenterprises active <strong>in</strong> t; data for Belgium, Denmark, Germany, Ireland, Greece, Malta, Poland and Portugal, not available.(2) EU average based on data available for Bulgaria, the Czech Republic, Estonia, Spa<strong>in</strong>, Italy, Latvia, Luxembourg, Hungary, theNetherlands, Austria, Romania, Slovakia and F<strong>in</strong>land.(3) Data for employer enterprise birth rates, not available.Source: <strong>Eurostat</strong> (bd_9f_size_cl)Figure 1.36: Proportion of employment among employer enterprise births and employerenterprise deaths, 2005 (1)(%)6420EU (2)SlovakiaRomaniaBulgariaLithuaniaSpa<strong>in</strong>F<strong>in</strong>landLuxembourgItalyEstoniaCzech RepublicHungaryNetherlandsLatvia (3)Austria (3)Employment among employer enterprise births Employment among employer enterprise deaths (4)(1) Data for Belgium, Denmark, Germany, Ireland, Greece, France, Cyprus, Malta, Poland, Portugal, Slovenia, Sweden and the UnitedK<strong>in</strong>gdom, not available.(2) EU average based on data available for Bulgaria, the Czech Republic, Estonia, Spa<strong>in</strong>, Italy, Lithuania, Luxembourg, Hungary, theNetherlands, Romania, Slovakia and F<strong>in</strong>land.(3) Data for employment among employer enterprise deaths, not available.(4) Numbers of persons employed <strong>in</strong> employer enterprise deaths, 2004.Source: <strong>Eurostat</strong> (bd_9f_size_cl)60 EUROPE IN FIGURES — <strong>Eurostat</strong> <strong>yearbook</strong> <strong>2009</strong>
Science, technology, <strong>in</strong>novation and entrepreneurship:<strong>2009</strong>, the year of creativity and <strong>in</strong>novation 1Figure 1.37: High-growth firm rate by employment/turnover, bus<strong>in</strong>ess economy (Sections C to K),2005 (1)(% of active enterprises)2520151050EU (2)BulgariaCzech RepublicEstoniaSpa<strong>in</strong>ItalyLatviaLithuaniaLuxembourgHungaryNetherlandsRomaniaSloveniaSlovakiaF<strong>in</strong>landIn employment terms In turnover terms (3)(1) Share of high growth enterprises <strong>in</strong> the population of active enterprises, measured <strong>in</strong> employment/turnover; all enterprises <strong>with</strong>average annualised growth greater than 20 % per annum, over a three year period should be considered as high-growth enterprises;enterprises <strong>with</strong> ten or more employees; data for Belgium, Denmark, Germany, Ireland, Greece, France, Cyprus, Malta, Austria, Poland,Portugal, Sweden and the United K<strong>in</strong>gdom, not available.(2) EU average composed of available countries shown <strong>in</strong> graph.(3) Spa<strong>in</strong>, not available.Source: <strong>Eurostat</strong> (bd_9n)Figure 1.38: Employment/turnover growth rate of ‘gazelles’, bus<strong>in</strong>ess economy (Sections C to K),2005 (1)(% of active enterprises)43210EU (2)BulgariaCzech RepublicEstoniaSpa<strong>in</strong>ItalyLatviaLithuaniaLuxembourgHungaryNetherlandsRomaniaSloveniaSlovakiaF<strong>in</strong>landEmployment (3) Turnover (4)(1) Share of young high growth enterprises <strong>in</strong> the population of active enterprises, measured <strong>in</strong> employment/turnover; all enterprisesup to 5 years old <strong>with</strong> average annualised growth greater than 20 % per annum, over a three year period, should be considered asgazelles; enterprises <strong>with</strong> ten or more employees; data for Belgium, Denmark, Germany, Ireland, Greece, France, Cyprus, Malta, Austria,Poland, Portugal, Sweden and the United K<strong>in</strong>gdom, not available.(2) EU average composed of available countries shown <strong>in</strong> graph.(3) Czech Republic, not available.(4) Spa<strong>in</strong>, not available.Source: <strong>Eurostat</strong> (bd_9n)EUROPE IN FIGURES — <strong>Eurostat</strong> <strong>yearbook</strong> <strong>2009</strong>61
1Science, technology, <strong>in</strong>novation and entrepreneurship:<strong>2009</strong>, the year of creativity and <strong>in</strong>novation1.7 Factors of bus<strong>in</strong>ess successAverag<strong>in</strong>g across the Member States forwhich data are available, the overwhelm<strong>in</strong>gmajority (81.2 %) of enterprises born<strong>in</strong> 2002 had no employees when start<strong>in</strong>gup.At start-up <strong>in</strong> 2002, very few (1.5 %)enterprises had more than 10 employees,the rest (16.8 %) employ<strong>in</strong>g between 1and 9 persons. Of those enterprises born<strong>in</strong> 2002 that had survived to 2005, however,many had grown <strong>in</strong> terms of employeenumbers: on average, 29.4 % of enterpriseshad between 1 and 9 employeesand 4.1 % had more than 10 or moreemployees. There was particularly strongemployment growth among surviv<strong>in</strong>g enterprises<strong>in</strong> Lithuania, where the numberof enterprises <strong>with</strong>out employees fell toalmost none (0.3 %), whilst those employ<strong>in</strong>gover ten employees grew from 4.4 %at start-up <strong>in</strong> 2002 to 23.5 % of surviv<strong>in</strong>genterprises <strong>in</strong> 2005. Strong employmentgrowth <strong>in</strong> surviv<strong>in</strong>g start-ups was alsonoted <strong>in</strong> Bulgaria, Estonia and Romania.Figure 1.39: Bus<strong>in</strong>ess units hav<strong>in</strong>g been born <strong>in</strong> 2002 and surviv<strong>in</strong>g to 2005 (1)(% share of total number of units hav<strong>in</strong>g been born <strong>in</strong> 2002 and surviv<strong>in</strong>g to 2005)100%75%50%25%At start-up100%75%50%25%By survival size class0%EU (2)BulgariaCzech RepublicDenmarkEstoniaFranceItalyLithuaniaLuxembourgAustriaPortugalRomaniaSloveniaSlovakiaSweden10 or more employees1-9 employeesZero employees0%EU (2)BulgariaCzech RepublicDenmarkEstoniaFranceItalyLithuaniaLuxembourgAustriaPortugalRomaniaSloveniaSlovakiaSweden10 or more employees1-9 employeesZero employees(1) Units <strong>with</strong><strong>in</strong> <strong>in</strong>dustry and services exclud<strong>in</strong>g public adm<strong>in</strong>istration and management activities of hold<strong>in</strong>g companies (NACE Rev. 1.1Sections C to K exclud<strong>in</strong>g Class 74.15); Slovenia, not available for(2) Average of those Member States for which data are available.Source: <strong>Eurostat</strong> (fobs_isc and fobs_ssc)62 EUROPE IN FIGURES — <strong>Eurostat</strong> <strong>yearbook</strong> <strong>2009</strong>
Science, technology, <strong>in</strong>novation and entrepreneurship:<strong>2009</strong>, the year of creativity and <strong>in</strong>novation 1Table 1.15: Bus<strong>in</strong>ess units hav<strong>in</strong>g survived from 2002 to 2005, accord<strong>in</strong>g to status of thefounder (1)(% share of total number of units hav<strong>in</strong>g survived)By genderBy ageBy educationMale FemaleLessthan 3030-39years40+yearsPrimary& lowersecondaryUppersecondaryPostsecondarynon-tertiary TertiaryEU (2) 72.9 27.1 25.0 35.6 39.3 27.6 41.2 10.1 21.1Bulgaria 59.2 40.8 15.3 28.7 55.9 5.0 45.1 18.7 31.2Czech Republic 72.7 27.3 33.2 32.7 34.1 13.1 61.7 6.7 18.5Denmark 79.6 20.4 15.9 35.9 48.2 20.5 24.2 15.7 39.6Estonia 76.0 24.0 25.3 39.5 35.2 2.8 19.8 20.5 56.9France 79.4 20.6 8.8 34.0 57.1 23.6 42.5 : 33.9Italy 74.8 25.2 29.9 40.0 30.1 32.3 46.3 2.3 19.2Latvia 64.7 35.3 18.1 34.6 47.3 2.3 37.4 10.1 50.2Lithuania 74.1 25.9 6.6 33.8 59.5 1.2 13.3 17.1 68.4Luxembourg 81.6 18.4 10.1 36.5 53.3 19.4 23.7 18.2 38.7Austria 72.3 27.7 10.8 39.7 49.5 5.7 36.6 22.0 35.6Portugal 85.8 14.2 13.0 31.3 55.7 51.2 26.4 6.7 15.7Romania 64.4 35.6 23.2 32.3 44.6 52.1 10.0 32.5 5.4Slovenia 73.4 26.6 24.7 33.2 42.0 4.0 41.3 25.4 29.3Slovakia 70.0 30.0 31.1 31.4 37.5 28.5 45.3 4.6 21.6Sweden 79.2 20.8 14.1 34.9 51.1 15.7 35.2 20.9 28.2(1) Units <strong>with</strong><strong>in</strong> <strong>in</strong>dustry and services exclud<strong>in</strong>g public adm<strong>in</strong>istration and management activities of hold<strong>in</strong>g companies (NACE Rev. 1.1Sections C to K exclud<strong>in</strong>g Class 74.15).(2) Average of those Member States for which data are available.Source: <strong>Eurostat</strong> (fobs_gen, fobs_age and fobs_edu)EUROPE IN FIGURES — <strong>Eurostat</strong> <strong>yearbook</strong> <strong>2009</strong>63
EconomyEconomic and social progress and constant improvements <strong>in</strong> liv<strong>in</strong>g and work<strong>in</strong>g conditionsare fundamental objectives for the EU. Over the last five decades policy-makershave strived to improve economic <strong>in</strong>tegration (through remov<strong>in</strong>g barriers to the freemovement of goods, services, money and people) <strong>with</strong> the goal of creat<strong>in</strong>g more jobsand economic growth. Much has been achieved: such as the customs union, then thes<strong>in</strong>gle market and, more recently, economic and monetary union (EMU).The chief objective of the S<strong>in</strong>gle <strong>Europe</strong>an Act was to add new momentum to the processof the <strong>Europe</strong>an construction so as to complete the <strong>in</strong>ternal market (1) . S<strong>in</strong>ce 1993the <strong>Europe</strong>an s<strong>in</strong>gle market has strongly enhanced the possibility for people, goods,services and money to move around <strong>Europe</strong> as freely as <strong>with</strong><strong>in</strong> a s<strong>in</strong>gle country. Thesefreedoms, foreseen from the outset of the EC <strong>in</strong> the Treaty establish<strong>in</strong>g the <strong>Europe</strong>anEconomic Community of 1957 have been designed: to allow <strong>in</strong>dividuals the right tolive, work, study or retire <strong>in</strong> another Member State; to <strong>in</strong>crease competition lead<strong>in</strong>gto lower prices, a wider choice of th<strong>in</strong>gs to buy and higher levels of protection for consumers;and to make it easier and cheaper for bus<strong>in</strong>esses to <strong>in</strong>teract across borders.It is now easier to travel across the EU’s <strong>in</strong>ternal frontiers, <strong>in</strong> particular <strong>with</strong><strong>in</strong> theSchengen area, or to order a wide range of products that may be delivered from all overthe EU. Accord<strong>in</strong>g to the <strong>Europe</strong>an Commission, the s<strong>in</strong>gle market has created 2.5million new jobs s<strong>in</strong>ce 1993 and generated more than EUR 800 000 million <strong>in</strong> extrawealth, through abolish<strong>in</strong>g tariffs and quotas, as well as technical and adm<strong>in</strong>istrativeobstacles to free trade (2) . The creation of the s<strong>in</strong>gle market has <strong>in</strong>creased <strong>in</strong>centivesto liberalise previously protected monopoly markets for utilities such as telecommunications,electricity, gas and water. As a result, many households and <strong>in</strong>dustriesacross <strong>Europe</strong> are <strong>in</strong>creas<strong>in</strong>gly able to choose who supplies them <strong>with</strong> related services.Nevertheless, there rema<strong>in</strong> areas, for example <strong>in</strong> relation to f<strong>in</strong>ancial services andtransportation, where separate national markets still exist.(1) http://europa.eu/scadplus/treaties/s<strong>in</strong>gleact_en.htm.(2) http://europa.eu/pol/overview_en.htm.EUROPE IN FIGURES — <strong>Eurostat</strong> <strong>yearbook</strong> <strong>2009</strong>65
2 EconomyThe Council and Parliament of theEU adopted <strong>in</strong> 2005 the ‘IntegratedGuidel<strong>in</strong>es Package’ (3) which is a roadmapfor spurr<strong>in</strong>g growth and creat<strong>in</strong>g jobs <strong>in</strong> asocially cohesive and environmentally responsibleEU for the period 2005 to 2008.This package represents a comprehensivestrategy of macro-economic, micro-economicand employment policies. Underthe package, Member States draw up nationalreform programmes, us<strong>in</strong>g the taxand social welfare policy mix they th<strong>in</strong>kbest suits national circumstances.2.1 National accountsIntroductionThe most frequently used measure forthe overall size of an economy is grossdomestic product (GDP). It correspondsto the total monetary value of all productionactivity <strong>in</strong> a certa<strong>in</strong> geographic area.GDP at market prices is the f<strong>in</strong>al resultof the production activity of all producerunits <strong>with</strong><strong>in</strong> a certa<strong>in</strong> area (for example, anational territory), no matter whether theunits are owned by nationals or foreigners.GDP, and <strong>in</strong> particular GDP per capita,is one of the ma<strong>in</strong> <strong>in</strong>dicators used foreconomic analysis, as well as spatial and/or temporal comparisons, <strong>in</strong> particularas a measure of liv<strong>in</strong>g standards.Household sav<strong>in</strong>g rates vary considerablybetween countries because of <strong>in</strong>stitutional,demographic and socio-economicdifferences between countries.Government provisions for old-age pensions,the extent to which governmentsprovide <strong>in</strong>surance aga<strong>in</strong>st sickness andunemployment, and the demographic agestructure of the population will all <strong>in</strong>fluencethe rate at which a population saves– older persons tend to run down theirf<strong>in</strong>ancial assets dur<strong>in</strong>g their retirementto the detriment of sav<strong>in</strong>g. F<strong>in</strong>ally, theavailability and price of credit, as well asattitudes towards debt may also <strong>in</strong>fluencechoices made by <strong>in</strong>dividuals regard<strong>in</strong>gwhether to spend or save; someth<strong>in</strong>g thatbecame apparent <strong>with</strong> devastat<strong>in</strong>g effectdur<strong>in</strong>g the autumn of 2008.Aside from <strong>in</strong>dividuals’ choices as toconsumption and sav<strong>in</strong>gs patterns, theMember States of the EU also need tohave sound public f<strong>in</strong>ances, by balanc<strong>in</strong>gtheir choice of expenditure priorities<strong>in</strong> relation to the types and levels oftaxes that they fix. The governments ofthe Member States reta<strong>in</strong> responsibilityfor fix<strong>in</strong>g their levels of direct taxation– i.e. tax on personal <strong>in</strong>comes and companyprofits, sav<strong>in</strong>gs and capital ga<strong>in</strong>s.In the area of company tax, the EU hastwo goals: prevent<strong>in</strong>g harmful tax competitionbetween Member States and support<strong>in</strong>gthe pr<strong>in</strong>ciple of free movementof capital. Cross-border payments of <strong>in</strong>terest,royalties and dividends to sisterand parent companies have progressivelybeen exempted from <strong>with</strong>hold<strong>in</strong>g tax <strong>in</strong>the country from which the payment ismade and discussions are under way onhav<strong>in</strong>g a common tax base for companies,i.e. the rules apply<strong>in</strong>g to each typeof transaction would be the same acrossthe EU <strong>in</strong> order to prevent unfair competition,while still leav<strong>in</strong>g Member Statesfree to set actual tax rates.(3) http://eur-lex.europa.eu/LexUriServ/LexUriServ.do?uri=OJ:L:2005:205:0021:0027:EN:PDF.66 EUROPE IN FIGURES — <strong>Eurostat</strong> <strong>yearbook</strong> <strong>2009</strong>
Economy 2Def<strong>in</strong>itions and data availabilityThe <strong>Europe</strong>an system of (<strong>in</strong>tegrated economic)accounts provides the methodologyfor national accounts <strong>in</strong> <strong>Europe</strong>. Thecurrent version, ESA 95, is fully consistent<strong>with</strong> the worldwide guidel<strong>in</strong>es on thenational accounts, the SNA 93.Data <strong>with</strong><strong>in</strong> the national accounts doma<strong>in</strong>encompasses <strong>in</strong>formation on GDPand its components, employment, f<strong>in</strong>alconsumption aggregates, <strong>in</strong>come, andsav<strong>in</strong>gs. Many of these annual variablesare also calculated on a quarterly basis.Breakdowns exist for certa<strong>in</strong> variablesby economic activity (<strong>in</strong>dustries, as def<strong>in</strong>edby NACE), <strong>in</strong>vestment products,f<strong>in</strong>al consumption purpose (as def<strong>in</strong>ed byCOICOP) and <strong>in</strong>stitutional sectors.An analysis of the economy of differentcountries can be facilitated by study<strong>in</strong>gGDP per capita, so remov<strong>in</strong>g the <strong>in</strong>fluenceof the absolute size of the population.GDP per capita is a broad economic<strong>in</strong>dicator of liv<strong>in</strong>g standards, and a basicmeasure of the competitiveness of aneconomy. The volume <strong>in</strong>dex of GDP percapita <strong>in</strong> purchas<strong>in</strong>g power standards(PPS) is expressed <strong>in</strong> relation to the EUaverage (set to equal 100). If the <strong>in</strong>dex ofa country is higher/lower than 100, thiscountry’s level of GDP per head is above/below the EU-27 average. Such comparisonsof the wealth and competitiveness ofcountries should ideally be made us<strong>in</strong>g aPPS based series. To do this, measures ofGDP <strong>in</strong> national currencies are converted<strong>in</strong>to a common currency us<strong>in</strong>g purchas<strong>in</strong>gpower parities (PPPs) that reflectthe purchas<strong>in</strong>g power of each currency,rather than us<strong>in</strong>g market exchange rates.GDP per capita <strong>in</strong> purchas<strong>in</strong>g powerstandards (the common currency), thereforeelim<strong>in</strong>ates differences <strong>in</strong> price levelsbetween countries and also allows a comparisonbetween economies of differentabsolute sizes. Note that the <strong>in</strong>dex, calculatedfrom PPS <strong>figures</strong> is <strong>in</strong>tended forcross-country comparisons rather thanfor temporal comparisons.The calculation of the annual growth rateof GDP at constant prices is <strong>in</strong>tended toallow comparisons of the dynamics ofeconomic development both over timeand between economies of different sizes,irrespective of price levels.A further set of national accounts data isused <strong>with</strong><strong>in</strong> the context of competitivenessanalyses, namely <strong>in</strong>dicators relat<strong>in</strong>gto the productivity of the workforce, suchas labour productivity measures. GDP <strong>in</strong>PPS per person employed is <strong>in</strong>tended togive an overall impression of the productivityof national economies. It should bekept <strong>in</strong> m<strong>in</strong>d, though, that this measuredepends on the structure of total employmentand may, for <strong>in</strong>stance, be lowered bya shift from full-time to part-time work.GDP <strong>in</strong> PPS per hour worked thereforegives a clearer picture of productivity,through the use of a more consistentmeasure of labour <strong>in</strong>put.GDP can be def<strong>in</strong>ed and calculated <strong>in</strong>three ways:• the output approach – as the sum ofgross value added of the various <strong>in</strong>stitutionalsectors or the various <strong>in</strong>dustries,plus taxes and less subsidies onproducts;• the expenditure approach – as thesum of f<strong>in</strong>al uses of goods and servicesby resident <strong>in</strong>stitutional units(f<strong>in</strong>al consumption and gross capitalformation), plus exports and m<strong>in</strong>usimports of goods and services;• the <strong>in</strong>come approach – as the sum ofthe compensation of employees, nettaxes on production and imports,gross operat<strong>in</strong>g surplus and mixed<strong>in</strong>come.EUROPE IN FIGURES — <strong>Eurostat</strong> <strong>yearbook</strong> <strong>2009</strong>67
2 EconomyThe output approachGross value added is def<strong>in</strong>ed as the valueof all newly generated goods and servicesless the value of all goods and servicesconsumed <strong>in</strong> their creation; the depreciationof fixed assets is not <strong>in</strong>cluded. Whencalculat<strong>in</strong>g value added, output is valuedat basic prices and <strong>in</strong>termediate consumptionat purchasers’ prices. Taxes lesssubsidies on products have to be addedto value added to obta<strong>in</strong> GDP at marketprices.Various measures of labour productivityare available, for example, based on GDP(or value added) <strong>in</strong> PPS either relative tothe number of persons employed or to thenumber of hours worked.The breakdown of the gross value addedgenerated by particular <strong>in</strong>dustries is presented<strong>in</strong> terms of six NACE Rev. 1 head<strong>in</strong>gs,cover<strong>in</strong>g: agriculture, hunt<strong>in</strong>g andfish<strong>in</strong>g; <strong>in</strong>dustry; construction; trade,transport and communication services;bus<strong>in</strong>ess activities and f<strong>in</strong>ancial services,and other services.In the system of national accounts, onlyhouseholds, non-profit <strong>in</strong>stitutions serv<strong>in</strong>ghouseholds (NPISH) and governmenthave f<strong>in</strong>al consumption, whereas corporationshave <strong>in</strong>termediate consumption.Private f<strong>in</strong>al consumption expenditure,or that performed by households andNPISH, is def<strong>in</strong>ed as expenditure ongoods and services for the direct satisfactionof <strong>in</strong>dividual needs, whereas governmentconsumption expenditure <strong>in</strong>cludesgoods and services produced by government,as well as purchases of goods andservices by government that are suppliedto households as social transfers <strong>in</strong> k<strong>in</strong>d.The expenditure approachNational accounts aggregates from theexpenditure approach are used by the<strong>Europe</strong>an Central Bank (ECB) and<strong>Europe</strong>an Commission services as importanttools for economic analysis andpolicy decisions. The quarterly series arecentral to bus<strong>in</strong>ess-cycle analysis andsubsequent policy decisions. These seriesare also widely employed for support<strong>in</strong>gbus<strong>in</strong>ess decisions <strong>in</strong> the private sector,<strong>in</strong> particular <strong>with</strong><strong>in</strong> f<strong>in</strong>ancial markets.The expenditure approach of GDP isdef<strong>in</strong>ed as private f<strong>in</strong>al consumption expenditure+ government f<strong>in</strong>al consumptionexpenditure + gross capital formation+ exports - imports.Private f<strong>in</strong>al consumption expenditure<strong>in</strong>cludes f<strong>in</strong>al expenditure of householdsand non-profit <strong>in</strong>stitutions serv<strong>in</strong>g households(NPISH), <strong>in</strong> other words, expenditureon goods or services that are usedfor the direct satisfaction of <strong>in</strong>dividualneeds. NPISHs are private, non-marketproducers which are separate legal entities.Their pr<strong>in</strong>cipal resources, apart fromthose derived from occasional sales, arederived from voluntary contributions <strong>in</strong>cash or <strong>in</strong> k<strong>in</strong>d from households <strong>in</strong> theircapacity as consumers, from paymentsmade by general governments and fromproperty <strong>in</strong>come. Examples of NPISHs<strong>in</strong>clude churches, trade unions or politicalparties.Government f<strong>in</strong>al consumption expenditure<strong>in</strong>cludes two categories of expenditure;the value of goods and services producedby general government itself otherthan own-account capital formation andsales, and purchases by general governmentof goods and services produced bymarket producers that are supplied tohouseholds – <strong>with</strong>out any transformation– as social transfers <strong>in</strong> k<strong>in</strong>d.68 EUROPE IN FIGURES — <strong>Eurostat</strong> <strong>yearbook</strong> <strong>2009</strong>
Economy 2Gross fixed capital formation consistsof resident producers’ acquisitions, lessdisposals, of fixed assets plus certa<strong>in</strong> additionsto the value of non-produced assetsrealised by productive activity. Fixedassets are tangible or <strong>in</strong>tangible assetsproduced as outputs from processes ofproduction that are themselves used repeatedly,or cont<strong>in</strong>uously, <strong>in</strong> processesof production for more than one year;such assets may be outputs from productionprocesses or imports. Investmentmay be made by public or private <strong>in</strong>stitutions.Gross capital formation is the sumof gross fixed capital formation and thechange <strong>in</strong> <strong>in</strong>ventories. Changes <strong>in</strong> <strong>in</strong>ventoriesare measured by the value of theentries <strong>in</strong>to <strong>in</strong>ventories less the value of<strong>with</strong>drawals and the value of any recurrentlosses of goods held <strong>in</strong> <strong>in</strong>ventories.The external balance is the differencebetween exports and imports of goodsand services. Depend<strong>in</strong>g on the size ofexports and imports, it can be positive (asurplus) or negative (a deficit).The <strong>in</strong>come approach<strong>Eurostat</strong> data on <strong>in</strong>come from <strong>in</strong>put factorsare crucial to economic analysis <strong>in</strong>a number of contexts <strong>in</strong>side and outsidethe <strong>Europe</strong>an Commission. Typical examplesare studies of competitiveness,of <strong>in</strong>come distribution <strong>in</strong>equalities, or oflong-term economic developments. Usersoutside the <strong>Europe</strong>an Commission <strong>in</strong>clude,<strong>in</strong> particular, academia and f<strong>in</strong>ancial<strong>in</strong>stitutions.Production requires ‘<strong>in</strong>put factors’ suchas the work of employees and capital;these <strong>in</strong>put factors have to be paid for.The <strong>in</strong>come-side approach shows howGDP is distributed among different participants<strong>in</strong> the production process, as thesum of:• compensation of employees: the totalremuneration, <strong>in</strong> cash or <strong>in</strong> k<strong>in</strong>d,payable by an employer to an employee<strong>in</strong> return for work done by thelatter dur<strong>in</strong>g the account<strong>in</strong>g period;the compensation of employees isbroken down <strong>in</strong>to: wages and salaries(<strong>in</strong> cash and <strong>in</strong> k<strong>in</strong>d); employers’ socialcontributions (employers’ actualsocial contributions and employers’imputed social contributions);• gross operat<strong>in</strong>g surplus: this is thesurplus (or deficit) on production activitiesbefore account has been takenof the <strong>in</strong>terest, rents or charges paidor received for the use of assets;• mixed <strong>in</strong>come: this is the remunerationfor the work carried out by theowner (or by members of his/herfamily) of an un<strong>in</strong>corporated enterprise;this is referred to as ‘mixed <strong>in</strong>come’s<strong>in</strong>ce it cannot be dist<strong>in</strong>guishedfrom the entrepreneurial profit of theowner;• taxes on production and imports lesssubsidies: these consist of compulsory(<strong>in</strong> the case of taxes) unrequitedpayments to or from general governmentor <strong>in</strong>stitutions of the EU, <strong>in</strong> respectof the production or import ofgoods and services, the employmentof labour, and the ownership or use ofland, build<strong>in</strong>gs or other assets used <strong>in</strong>production.EUROPE IN FIGURES — <strong>Eurostat</strong> <strong>yearbook</strong> <strong>2009</strong>69
2 EconomyHousehold sav<strong>in</strong>g is the ma<strong>in</strong> domesticsource of funds to f<strong>in</strong>ance capital <strong>in</strong>vestment.Sav<strong>in</strong>gs rates can be measured oneither a gross or net basis. Net sav<strong>in</strong>grates are measured after deduct<strong>in</strong>g consumptionof fixed capital (depreciation).The system of accounts also provides forboth disposable <strong>in</strong>come and sav<strong>in</strong>g to beshown on a gross basis, <strong>in</strong> other words,<strong>with</strong> both aggregates <strong>in</strong>clud<strong>in</strong>g the consumptionof fixed capital. In this respect,household sav<strong>in</strong>gs may be estimated bysubtract<strong>in</strong>g consumption expenditureand the adjustment for the change <strong>in</strong> netequity of households <strong>in</strong> pension fundsreserves from disposable <strong>in</strong>come. Thelatter consists essentially of <strong>in</strong>come fromemployment and from the operation ofun<strong>in</strong>corporated enterprises, plus receiptsof <strong>in</strong>terest, dividends and social benefitsm<strong>in</strong>us payments of <strong>in</strong>come taxes, <strong>in</strong>terestand social security contributions.Ma<strong>in</strong> f<strong>in</strong>d<strong>in</strong>gsThe GDP of the EU-27 was EUR12 303 961 million <strong>in</strong> 2007, <strong>with</strong> thecountries of the euro area account<strong>in</strong>gfor a little under three quarters (72.5 %)of this total. The sum of the four largestEU economies (Germany, the UnitedK<strong>in</strong>gdom, France and Italy) accounted foralmost two thirds (64.0 %) of the EU-27’sGDP <strong>in</strong> 2007. Cross-country comparisonsshould be made <strong>with</strong> caution and itis necessary to consider the effect of exchangerate fluctuations when analys<strong>in</strong>gdata. For example, the apparent fluctuationof GDP <strong>in</strong> the United States is, to alarge degree, a reflection of a strong dollarbetween 2001 and 2003 and a subsequentreversal to a strong euro thereafter, ratherthan any <strong>in</strong>herent change <strong>in</strong> the level ofGDP <strong>in</strong> dollar terms (which has cont<strong>in</strong>uedto rise).Hav<strong>in</strong>g grown at an average rate ofaround 3 % per annum dur<strong>in</strong>g the late1990s, real GDP growth slowed considerablyafter the turn of the millennium,to just above 1 % per annum <strong>in</strong> both2002 and 2003, before rebound<strong>in</strong>g morestrongly <strong>in</strong> 2006 and 2007 back to about3.0 % per annum.In order to look at standards of liv<strong>in</strong>g, oneof the most frequently cited statistics isthat of GDP per capita. Across the EU-27as a whole, GDP per capita was EUR24 800 <strong>in</strong> 2007. Among Member States,by far the highest level was recorded forLuxembourg (EUR 75 200 per capita).Even after account<strong>in</strong>g for the relativelyhigh cost of liv<strong>in</strong>g <strong>in</strong> Luxembourg, GDPper capita <strong>in</strong> PPS terms rema<strong>in</strong>ed almosttwice as high as <strong>in</strong> any other MemberState; these high values for Luxembourgare partly expla<strong>in</strong>ed by the importanceof cross-border workers from Belgium,France and Germany. The lowest levelsof GDP per capita among the MemberStates were recorded <strong>in</strong> Bulgaria andRomania, where liv<strong>in</strong>g standards (aga<strong>in</strong><strong>in</strong> PPS terms) were approximately 40 % ofthe EU-27 average <strong>in</strong> 2007.In recent years, labour productivityamong those Member States thatjo<strong>in</strong>ed the EU s<strong>in</strong>ce 2004, <strong>in</strong> particularthe Czech Republic, Poland, Slovenia,Slovakia and the Baltic Member Stateshas been converg<strong>in</strong>g quickly towards theEU-27 average.70 EUROPE IN FIGURES — <strong>Eurostat</strong> <strong>yearbook</strong> <strong>2009</strong>
Economy 2There has been a considerable shift <strong>in</strong> theeconomic structure of the EU economy <strong>in</strong>the last few decades, <strong>with</strong> the proportionof gross value added accounted for by agricultureand <strong>in</strong>dustry fall<strong>in</strong>g, <strong>with</strong> thatfor most services ris<strong>in</strong>g. This change is, atleast <strong>in</strong> part, a result of phenomena suchas technological change, the evolution ofrelative prices, and globalisation, oftenresult<strong>in</strong>g <strong>in</strong> manufactur<strong>in</strong>g bases be<strong>in</strong>gmoved to lower labour-cost regions. Morethan one quarter (28.2 %) of the EU-27’sgross value added was accounted for bybus<strong>in</strong>ess activities and f<strong>in</strong>ancial services<strong>in</strong> 2007. There were three other sectoralbranches that also contributed significantshares of just over one fifth of total valueadded, namely other services (largelymade up of public adm<strong>in</strong>istrations, educationand health systems, as well as othercommunity, social and personal serviceactivities (22.3 %)); trade, transport andcommunication services (21.2 %); and<strong>in</strong>dustry (20.2 %). The rema<strong>in</strong>der of theeconomy was divided between construction(6.3 %) and agriculture, hunt<strong>in</strong>g andfish<strong>in</strong>g (1.9 %).As such, the three groups of services identifiedabove accounted for 71.7 % of totalgross value added <strong>in</strong> the EU-27 <strong>in</strong> 2007.The relative importance of services wasparticularly high <strong>in</strong> Luxembourg, France,the United K<strong>in</strong>gdom and Belgium, aswell as the holiday dest<strong>in</strong>ations of Cyprusand Malta. Services accounted for morethan three quarters of total value added<strong>in</strong> each of these six countries.F<strong>in</strong>al consumption expenditure acrossthe EU-27 rose by 28.1 % between 1996and 2007. This was very similar to thegrowth <strong>in</strong> GDP dur<strong>in</strong>g the same period(31.2 %). Growth <strong>in</strong> gross capital formationoutstripped both, <strong>in</strong>creas<strong>in</strong>g by48.8 % dur<strong>in</strong>g the same period. F<strong>in</strong>alconsumption expenditure of householdsand non-profit <strong>in</strong>stitutions serv<strong>in</strong>ghouseholds rose by 30.1 % between1996 and 2007, and represented 57.5 %of the EU-27’s GDP <strong>in</strong> 2007. This sharehas been relatively stable over time, althoughit has decl<strong>in</strong>ed <strong>in</strong> recent yearsfrom a peak of 58.7 % <strong>in</strong> 2001.The share of total GDP that is devoted to<strong>in</strong>vestment <strong>in</strong> fixed assets is an important<strong>in</strong>dicator of future economic growth– especially the level of <strong>in</strong>vestment <strong>in</strong>mach<strong>in</strong>ery and equipment and ICTproducts. Gross fixed capital formationrepresented 20.6 % of the EU-27’s GDP<strong>in</strong> 2007. This marked the fourth successiveyear that the relative importance ofgross fixed capital formation had risen,from a low of 19.6 % of GDP at the bottomof the last economic slowdown <strong>in</strong>2003. There was a wide variation <strong>in</strong> <strong>in</strong>vestment<strong>in</strong>tensity that may, <strong>in</strong> part, reflectthe different economic structures ofthe Member States. Gross fixed capitalformation as a share of GDP ranged frommore than 30 % <strong>in</strong> Estonia, Latvia, Spa<strong>in</strong>and Romania, to less than 19 % of GDP<strong>in</strong> Sweden, Germany and the UnitedK<strong>in</strong>gdom.The external balance of goods and serviceshas been <strong>in</strong> surplus dur<strong>in</strong>g the lastdecade. Nonetheless, <strong>in</strong> the most recentyears the relative size of the surplus hasdecreased, reach<strong>in</strong>g 0.4 % of GDP <strong>in</strong>2007.The higher the output of an economy, themore <strong>in</strong>come can be redistributed to thefactors that have provided for its creation.Between 1998 and 2007, the GDP of theEU-27 (measured at current prices) roseby a total of 51.1 %. In comparison, the<strong>in</strong>come of employees rose by 47.7 % <strong>in</strong>total over the same period. The fastestEUROPE IN FIGURES — <strong>Eurostat</strong> <strong>yearbook</strong> <strong>2009</strong>71
2 Economygrowth <strong>in</strong> <strong>in</strong>come factors was recordedfor taxes on production and imports lesssubsidies, result<strong>in</strong>g largely from a markedacceleration dur<strong>in</strong>g periods of economicexpansion (the late 1990s and aga<strong>in</strong> from2004 onwards).With<strong>in</strong> the EU-27, the breakdown of GDPby <strong>in</strong>put factors <strong>in</strong> 2007 was dom<strong>in</strong>ated bythe compensation of employees (48.5 %),while gross operat<strong>in</strong>g surplus and mixed<strong>in</strong>come accounted for 39.2 % of GDP andtaxes on production and imports lesssubsidies the rema<strong>in</strong><strong>in</strong>g 12.3 %.In some countries, gross national sav<strong>in</strong>gas a proportion of national disposable<strong>in</strong>come fell considerably between 1997and 2007. This was particularly the case<strong>in</strong> Portugal (down 7.2 po<strong>in</strong>ts), Slovakia(down 3.3 po<strong>in</strong>ts), the United K<strong>in</strong>gdom(down 2.9 po<strong>in</strong>ts), Ireland (down 2.8po<strong>in</strong>ts) and Italy (down 2.5 po<strong>in</strong>ts). Thehighest national sav<strong>in</strong>gs rates (between27.8 % and 28.6 %) were recorded <strong>in</strong> theNetherlands, Sweden and F<strong>in</strong>land.In relation to gross household disposable<strong>in</strong>come, gross household sav<strong>in</strong>gs represented10.7 % of GDP <strong>in</strong> 2007 for theEU-27. Belgium, Germany, France, Italyand Austria reported a sav<strong>in</strong>gs rate ofaround 14-16 % of their gross householddisposable <strong>in</strong>come. In contrast, F<strong>in</strong>land,the United K<strong>in</strong>gdom and Denmark reportedhousehold sav<strong>in</strong>gs rates of between2.5 % and 5.5 % <strong>in</strong> 2006 and 2007,while rates <strong>in</strong> Greece and Lithuania fellto around 1 %. Romania and Estonia reportednegative values between 2003 and2006, <strong>in</strong>dicat<strong>in</strong>g that households <strong>in</strong> thesecountries were spend<strong>in</strong>g more moneythan they earned, and funded some oftheir expenditure through credit, butEstonia reported a positive value <strong>in</strong> 2007.Figure 2.1: GDP per capita at current market prices, 200780 00060 00040 00020 0000EU-27Euro areaLuxembourgIreland (1)NetherlandsAustria (1)SwedenDenmarkBelgiumF<strong>in</strong>landUnited K<strong>in</strong>gdomGermanyFranceSpa<strong>in</strong>ItalyGreeceCyprusSloveniaCzech Republic (1)MaltaPortugalEstoniaSlovakiaHungaryLithuaniaLatviaPolandRomania (1)BulgariaNorwayUnited StatesSwitzerlandIcelandJapanCroatiaTurkey (1)FYR Macedonia (1)(EUR)(PPS)(1) Forecasts.Source: <strong>Eurostat</strong> (nama_gdp_c and tec00001)72 EUROPE IN FIGURES — <strong>Eurostat</strong> <strong>yearbook</strong> <strong>2009</strong>
Economy 2Table 2.1: GDP per capita at current market prices(PPS, EU-27=100)GDP percapita,2007GDP percapita,20071998 1999 2000 2001 2002 2003 2004 2005 2006 2007 (PPS) (EUR)EU-27 100 100 100 100 100 100 100 100 100 100 24 800 24 800Euro area (1) 115 114 114 114 113 112 111 111 110 110 27 300 27 800Belgium (2) 123 123 126 124 125 123 121 121 120 118 29 300 31 100Bulgaria 27 27 28 29 31 33 34 35 37 38 9 500 3 800Czech Republic 71 70 69 70 71 74 75 76 78 82 20 200 12 400Denmark 132 131 132 128 129 125 126 127 126 123 30 500 41 700Germany 123 123 119 117 116 117 117 115 114 113 28 100 29 500Estonia 42 42 45 46 50 55 57 62 68 71 17 600 11 400Ireland 122 127 131 133 138 141 142 144 145 146 36 200 42 600Greece 84 83 84 87 91 92 94 96 97 98 24 300 20 500Spa<strong>in</strong> 96 97 98 98 101 101 101 103 105 107 26 500 23 400France (2) 115 115 116 116 116 112 110 112 112 111 27 600 29 800Italy 120 118 117 118 112 111 107 105 103 101 25 200 25 900Cyprus 87 88 89 91 90 89 91 93 92 93 23 100 19 900Latvia 36 36 37 39 41 43 46 50 54 58 14 400 8 800Lithuania 40 39 39 42 44 49 51 53 56 60 15 000 8 300Luxembourg 218 238 244 235 241 247 253 264 279 276 68 500 75 200Hungary 53 54 56 59 62 64 63 64 65 64 15 700 10 100Malta 81 81 84 78 80 79 77 78 77 77 19 200 13 200Netherlands 129 131 135 134 134 130 130 132 132 133 32 900 34 600Austria 132 132 132 125 127 127 127 128 127 127 31 600 32 600Poland 48 49 48 48 48 49 51 51 52 54 13 300 8 100Portugal 77 79 78 78 77 77 75 75 75 75 18 600 15 400Romania : 26 26 28 29 31 34 35 39 41 10 100 5 600Slovenia 78 80 79 79 81 82 85 87 88 89 22 000 16 600Slovakia 52 51 50 53 54 56 57 61 64 69 17 000 10 200F<strong>in</strong>land 115 115 118 116 116 113 117 115 117 117 29 000 34 000Sweden 123 126 127 122 121 123 125 124 124 126 31 300 36 300United K<strong>in</strong>gdom 116 116 117 118 119 120 122 119 118 116 28 700 33 200Croatia 44 43 43 44 46 48 49 50 52 56 13 900 8 600FYR of Macedonia 27 27 27 25 25 26 27 28 28 29 7 300 2 700Turkey 43 39 40 36 34 34 37 39 41 42 10 500 6 500Iceland 141 140 132 133 130 126 131 135 130 129 32 000 46 900Norway 139 145 165 162 155 157 165 180 186 184 45 700 60 400Switzerland 150 147 146 141 142 138 136 135 137 140 34 700 41 500Japan 121 118 117 114 112 112 113 114 114 114 28 200 25 000United States 160 162 159 155 152 154 155 158 157 155 38 500 33 400(1) EA-13 <strong>in</strong>stead of EA-15 for 1998-2003.(2) Break <strong>in</strong> series, 2004.Source: <strong>Eurostat</strong> (tsieb010, tec00001 and nama_gdp_c)EUROPE IN FIGURES — <strong>Eurostat</strong> <strong>yearbook</strong> <strong>2009</strong>73
2 EconomyTable 2.2: GDP at current market prices(EUR 1 000 million)1998 1999 2000 2001 2002 2003 2004 2005 2006 2007Share ofEU-27,2007 (%)EU-27 8 142 8 558 9 173 9 549 9 911 10 077 10 577 11 035 11 641 12 304 100.0Euro area 6 140 6 422 6 757 7 051 7 299 7 514 7 819 8 109 8 499 8 919 72.5Belgium 228 238 252 259 268 275 290 302 317 331 2.7Bulgaria 11 12 14 15 17 18 20 22 25 29 0.2Czech Republic 55 56 61 69 80 81 88 100 113 127 1.0Denmark 155 163 174 179 185 189 197 208 220 228 1.9Germany 1 952 2 012 2 063 2 113 2 143 2 164 2 211 2 243 2 322 2 423 19.7Estonia 5 5 6 7 8 9 10 11 13 15 0.1Ireland 79 91 105 117 130 139 149 161 175 186 1.5Greece 122 132 138 146 158 171 185 199 214 229 1.9Spa<strong>in</strong> 537 580 630 681 729 783 841 909 982 1 051 8.5France 1 315 1 368 1 441 1 497 1 549 1 595 1 660 1 726 1 807 1 892 15.4Italy 1 087 1 127 1 191 1 249 1 295 1 335 1 392 1 428 1 480 1 536 12.5Cyprus 9 9 10 11 11 12 13 14 15 16 0.1Latvia 6 7 8 9 10 10 11 13 16 20 0.2Lithuania 10 10 12 14 15 16 18 21 24 28 0.2Luxembourg 17 20 22 23 24 26 27 30 34 36 0.3Hungary 42 45 52 60 71 75 82 89 90 101 0.8Malta 3 4 4 4 4 4 5 5 5 5 0.0Netherlands 360 386 418 448 465 477 491 513 540 567 4.6Austria 190 198 208 212 219 223 233 244 257 271 2.2Poland 153 157 186 212 210 192 204 244 272 309 2.5Portugal 106 114 122 129 135 139 144 149 155 163 1.3Romania 37 33 40 45 48 53 61 80 98 121 1.0Slovenia 19 20 21 22 24 25 27 28 30 34 0.3Slovakia 20 19 22 24 26 29 34 38 45 55 0.4F<strong>in</strong>land 116 123 132 140 144 146 152 157 167 180 1.5Sweden 226 241 266 251 264 276 288 295 313 332 2.7United K<strong>in</strong>gdom 1 280 1 384 1 573 1 613 1 679 1 616 1 745 1 805 1 913 2 019 16.4Croatia 19 19 20 22 24 26 29 31 34 37 0.3FYR of Macedonia 3 3 4 4 4 4 4 5 5 5 0.0Turkey 239 234 290 218 243 268 315 387 419 479 3.9Iceland 7 8 9 9 9 10 11 13 13 15 0.1Liechtenste<strong>in</strong> : 3 3 3 3 3 3 3 : : :Norway 135 149 183 191 204 199 208 243 269 284 2.3Switzerland 244 252 271 285 296 288 292 299 310 312 2.5Japan 3 448 4 102 5 057 4 580 4 162 3 744 3 707 3 666 3 485 3 197 26.0United States 7 802 8 696 10 629 11 309 11 072 9 690 9 395 9 985 10 496 10 075 81.9Source: <strong>Eurostat</strong> (tec00001), CH: Secrétariat de l’Etat à l’Economie / JP: Bureau of Economic Analysis / US: Economic andSocial Research Institute74 EUROPE IN FIGURES — <strong>Eurostat</strong> <strong>yearbook</strong> <strong>2009</strong>
Economy 2Figure 2.2: GDP at current market prices(EUR 1 000 million)15 00012 0009 0006 0003 00001998 1999 2000 2001 2002 2003 2004 2005 2006 2007EU-27United StatesJapanSource: <strong>Eurostat</strong> (tec00001)Figure 2.3: Real GDP growth, EU-27(% change compared <strong>with</strong> the previous year)5432101998 1999 2000 2001 2002 2003 2004 2005 2006 2007Real GDP growthReal GDP growth rate per capitaSource: <strong>Eurostat</strong> (tsieb020 and tsdec100)EUROPE IN FIGURES — <strong>Eurostat</strong> <strong>yearbook</strong> <strong>2009</strong>75
2 EconomyTable 2.3: Labour productivityLabour productivity per person employed(EU-27=100, based on a PPS series)Labour productivity per hour worked(EU-15=100, based on a PPS series)2002 2003 2004 2005 2006 2007 2002 2003 2004 2005 2006 2007EU-27 100.0 100.0 100.0 100.0 100.0 100.0 86.8 87.2 87.6 87.6 87.8 88.0Euro area : : 110.3 110.6 110.2 110.2 : : 101.1 101.8 101.7 101.8Belgium (1) 136.6 134.8 132.2 132.0 131.3 130.2 127.9 126.4 126.8 125.2 124.1 123.7Bulgaria 33.1 33.5 33.8 34.3 34.8 35.7 29.6 30.1 30.1 30.7 31.3 32.0Czech Republic 63.1 66.7 68.1 68.9 70.4 73.6 48.0 50.6 51.8 52.1 53.3 :Denmark 108.6 106.4 108.8 109.2 108.3 106.0 103.1 101.2 103.9 105.2 103.7 100.4Germany 106.5 108.8 108.3 107.4 106.9 105.7 108.9 111.7 111.6 111.2 110.9 109.7Estonia 49.3 53.0 55.3 59.0 61.7 64.7 37.9 40.6 42.6 45.1 47.2 49.8Ireland 133.5 135.5 134.8 133.8 134.7 135.7 103.5 105.9 106.2 105.5 106.5 :Greece 100.5 100.3 101.8 103.5 103.8 105.0 70.4 70.5 72.7 73.7 71.8 :Spa<strong>in</strong> 105.0 104.0 102.2 102.0 102.9 105.1 90.1 90.0 89.9 90.8 92.4 95.6France (1) 125.7 121.8 120.8 123.7 124.0 124.3 120.8 117.4 114.9 117.8 119.5 :Italy 117.8 115.7 112.3 111.1 108.9 108.0 95.1 93.6 91.3 90.7 89.1 88.0Cyprus 84.6 82.7 82.9 84.2 85.0 86.1 65.1 63.8 65.6 67.7 67.7 68.9Latvia 43.1 44.3 46.0 49.2 50.9 53.6 33.0 33.6 36.1 38.6 39.9 42.1Lithuania 48.0 52.0 53.3 54.6 57.1 60.7 39.4 43.0 43.8 43.4 45.7 48.2Luxembourg 163.5 166.8 169.8 175.6 183.9 180.3 147.9 151.2 159.0 166.1 170.3 174.0Hungary 71.0 71.9 72.2 73.4 74.5 73.9 51.8 53.2 53.7 54.7 55.6 55.4Malta 92.1 90.4 90.4 90.7 90.6 90.1 77.0 76.1 75.1 75.3 75.3 75.1Netherlands 113.4 111.0 112.4 115.3 114.4 114.3 119.0 117.0 119.3 122.9 122.1 :Austria 118.0 118.8 119.0 119.9 119.8 119.9 101.0 101.2 101.9 103.6 103.5 104.8Poland 54.1 62.6 65.0 65.3 66.2 67.4 43.2 48.9 51.1 51.7 52.8 54.9Portugal 68.0 68.5 67.2 68.6 68.5 69.9 56.8 58.1 56.6 58.1 57.7 59.3Romania 29.2 31.2 34.4 36.3 39.2 41.0 23.1 25.1 27.7 29.1 : :Slovenia 76.7 78.1 80.9 82.7 83.9 84.3 64.4 65.3 69.5 71.1 72.1 72.6Slovakia 62.6 63.4 65.6 68.8 71.7 76.8 53.3 55.9 56.5 58.0 60.8 64.2F<strong>in</strong>land 111.6 109.6 112.8 110.8 112.3 111.9 95.5 94.1 97.2 95.7 97.3 97.3Sweden 107.8 110.2 113.5 112.9 113.8 115.3 99.9 102.9 105.0 104.5 105.5 106.1United K<strong>in</strong>gdom 110.3 110.6 112.3 109.7 109.5 108.8 89.1 90.3 92.5 89.9 90.3 89.8Croatia 58.1 60.1 60.9 62.0 64.2 68.4 : : : : : :Turkey 49.0 49.7 54.0 56.1 59.7 62.4 : : : : : :Iceland 104.4 101.5 107.8 108.8 104.3 102.3 85.1 82.9 88.4 90.1 86.2 84.2Norway 131.7 135.2 142.6 155.3 158.9 154.7 137.7 142.7 149.4 162.4 167.5 163.0Switzerland 107.5 105.7 105.2 105.2 105.8 108.9 97.5 95.3 93.6 93.6 94.8 97.7United States 138.0 139.8 140.8 143.2 142.8 142.7 112.6 115.5 117.0 119.3 : :(1) 2004, break <strong>in</strong> series.Source: <strong>Eurostat</strong> (tsieb030 and tsieb040), OE<strong>CD</strong>76 EUROPE IN FIGURES — <strong>Eurostat</strong> <strong>yearbook</strong> <strong>2009</strong>
Economy 2Table 2.4: Gross value added at basic prices(% share of total gross value added)Agriculture,hunt<strong>in</strong>g &fish<strong>in</strong>g Industry ConstructionBus<strong>in</strong>essactivities &f<strong>in</strong>ancialservicesOtherservices1997 2007 1997 2007 1997 2007 1997 2007 1997 2007 1997 2007EU-27 2.8 1.9 23.3 20.2 5.6 6.3 21.3 21.2 24.9 28.2 22.2 22.3Euro area 2.8 1.9 22.7 20.4 5.7 6.5 21.0 20.7 25.3 28.0 22.4 22.4Belgium 1.6 0.9 23.5 18.9 4.9 5.2 21.3 23.5 26.3 28.4 22.5 23.2Bulgaria 26.2 6.2 26.4 24.1 2.7 8.2 17.5 24.4 18.8 22.0 8.4 15.1Czech Republic (1) 4.2 2.6 33.0 32.0 7.5 6.2 24.7 25.3 14.8 16.6 15.8 17.3Denmark 3.2 1.3 20.9 20.1 4.8 5.6 22.5 21.6 21.8 24.5 26.8 26.8Germany 1.3 0.9 25.1 26.4 6.0 4.0 17.8 17.6 27.3 29.2 22.6 21.9Estonia 5.2 2.8 24.9 21.3 6.1 9.1 26.7 26.9 20.2 23.3 16.9 16.6Ireland (1) 5.2 1.7 33.1 25.0 5.6 9.9 18.6 16.8 18.7 26.4 18.9 20.2Greece (2) 6.6 3.6 13.9 14.8 7.0 8.3 30.1 30.6 20.6 18.8 21.7 24.0Spa<strong>in</strong> 5.0 2.9 22.2 17.5 7.1 12.3 26.4 24.4 18.3 22.1 21.0 20.9France 3.2 2.2 18.4 14.1 5.1 6.5 19.1 18.7 29.4 33.3 24.8 25.3Italy 3.2 2.0 24.4 20.8 5.1 6.3 23.9 22.5 22.8 27.6 20.6 20.8Cyprus 4.0 2.2 13.4 9.8 7.9 9.1 29.9 27.2 22.6 27.8 22.2 23.8Latvia 5.1 3.3 25.3 13.6 4.2 8.4 31.5 33.0 14.0 23.5 19.9 18.2Lithuania 11.4 5.3 23.5 23.3 7.6 10.0 27.7 31.5 11.5 14.7 18.3 15.1Luxembourg 0.8 0.4 14.7 9.3 6.2 5.1 23.1 20.8 37.8 49.0 17.3 15.4Hungary 5.9 4.2 28.1 25.2 4.6 4.2 23.2 21.3 19.1 23.0 19.1 22.2Malta 2.8 2.3 22.3 17.7 4.3 3.8 31.6 27.0 17.4 20.9 21.5 28.3Netherlands 3.5 2.0 20.6 18.8 5.3 5.6 22.3 21.9 26.0 28.3 22.4 23.4Austria 2.3 1.8 23.0 23.5 7.9 7.1 24.7 23.1 20.3 24.2 21.7 20.4Poland 6.6 4.3 26.1 23.2 7.2 7.9 26.4 27.9 15.3 18.4 18.2 18.3Portugal 4.6 2.5 22.0 18.0 7.0 6.5 24.2 24.3 19.7 22.4 22.5 26.3Romania (1, 3) 16.0 8.8 29.1 27.5 5.6 8.4 25.5 25.4 12.4 17.6 11.3 12.2Slovenia 4.2 2.0 29.1 27.5 6.7 7.0 21.7 22.5 18.8 21.6 19.5 19.4Slovakia 5.3 2.9 28.0 30.3 7.3 6.7 26.3 26.6 17.0 17.8 16.2 15.8F<strong>in</strong>land 4.1 3.2 27.4 26.2 4.9 6.4 21.8 21.6 19.3 21.2 22.7 21.4Sweden 2.5 1.5 25.1 23.7 4.0 5.0 19.0 19.4 24.2 24.0 25.1 26.3United K<strong>in</strong>gdom 1.4 0.9 24.9 16.6 5.0 5.2 21.9 21.1 25.4 33.8 21.4 22.4Croatia 8.7 6.8 24.2 23.3 7.1 6.8 25.6 26.0 17.1 18.8 17.2 18.2FYR of Macedonia (1) 12.8 12.6 28.4 23.5 6.2 6.7 22.2 28.1 10.2 10.6 20.3 18.6Turkey 14.3 7.6 24.9 19.3 6.0 4.9 34.2 27.6 8.0 17.6 12.7 10.1Iceland (1) 10.2 6.1 20.8 15.5 8.3 10.5 22.0 18.4 17.0 27.6 21.8 21.9Norway 2.4 1.4 32.5 37.8 4.7 5.2 21.4 16.7 16.8 18.3 22.2 20.5Switzerland 1.8 1.2 23.0 22.5 5.5 5.5 22.0 21.8 21.8 23.6 26.0 25.4Japan 1.5 : 25.5 : 7.6 : 17.6 : 17.2 : 26.8 :United States (3) 1.3 : 20.0 : 4.6 : 19.9 : 30.7 : 23.5 :(1) 2006 <strong>in</strong>stead of 2007.(2) 2000 <strong>in</strong>stead of 1997.(3) 1998 <strong>in</strong>stead of 1997.Source: <strong>Eurostat</strong> (tec00003, tec00004, tec00005, tec00006, tec00007 and tec00008)Trade,transport &communicationservicesEUROPE IN FIGURES — <strong>Eurostat</strong> <strong>yearbook</strong> <strong>2009</strong>77
2 EconomyFigure 2.4: Gross value added at basic prices, EU-27, 2007 (1)(% share of total gross value added)Industry20.2%Construction6.3%Agriculture, hunt<strong>in</strong>gand fish<strong>in</strong>g1.9%Bus<strong>in</strong>ess activities andf<strong>in</strong>ancial services28.2%Trade, transport andcommunication services21.2%Other services22.3%(1) Figures do not sum to 100 % due to round<strong>in</strong>g.Source: <strong>Eurostat</strong> (tec00007, tec00008, tec00006, tec00004, tec00005 and tec00003)Figure 2.5: Consumption expenditure and gross capital formation at constant prices, EU-27(2000=100)12011010090801997 1998 1999 2000 2001 2002 2003 2004 2005 2006 2007F<strong>in</strong>al consumption expenditure at constant pricesGDPGross capital formationSource: <strong>Eurostat</strong> (nama_gdp_k)78 EUROPE IN FIGURES — <strong>Eurostat</strong> <strong>yearbook</strong> <strong>2009</strong>
Economy 2Figure 2.6: Expenditure components of GDP, EU-27(EUR 1 000 million)7 5001805 0001202 5006001998 1999 2000 2001 2002 2003 2004 2005 2006 2007Households and non-profit <strong>in</strong>stitutions serv<strong>in</strong>g households (left-hand scale)General government (left-hand scale)Gross fixed capital formation - <strong>in</strong>vestments (left-hand scale)External balance of goods and services (right-hand scale)0Source: <strong>Eurostat</strong> (tec00009, tec00010, tec00011 and tec00110)Figure 2.7: Expenditure components of GDP, EU-27, 2007(% share of GDP)External balance of goodsand services0.4%Generalgovernment21.5%Gross capital formation(<strong>in</strong>vestments)20.6%Households and nonprofit<strong>in</strong>stitutions serv<strong>in</strong>ghouseholds57.5%Source: <strong>Eurostat</strong> (tec00009, tec00011, tec00010 and tec00110)EUROPE IN FIGURES — <strong>Eurostat</strong> <strong>yearbook</strong> <strong>2009</strong>79
2 EconomyFigure 2.8: Gross fixed capital formation, 2007(% share of GDP)35302520151050EU-27Euro areaEstoniaLatviaSpa<strong>in</strong> (1)RomaniaBulgariaSloveniaLithuania (1)GreeceSlovakiaIrelandCzech RepublicDenmarkAustriaPortugalPolandFranceCyprusBelgiumItalyHungaryF<strong>in</strong>landLuxembourg (1)NetherlandsMaltaSwedenGermanyUnited K<strong>in</strong>gdomIcelandSwitzerlandNorway(1) Estimate.Source: <strong>Eurostat</strong> (tec00011)Figure 2.9: Distribution of <strong>in</strong>come, EU-27(1998=100)1601401201001998 1999 2000 2001 2002 2003 2004 2005 2006 2007Taxes on production and imports less subsidiesGross operat<strong>in</strong>g surplus and mixed <strong>in</strong>comeCompensation of employeesSource: <strong>Eurostat</strong> (tec00016, tec00015 and tec00013)80 EUROPE IN FIGURES — <strong>Eurostat</strong> <strong>yearbook</strong> <strong>2009</strong>
Economy 2Figure 2.10: Distribution of <strong>in</strong>come, 2007(% share of GDP)100%75%50%25%0%EU-27Euro areaBelgiumBulgariaCzech RepublicDenmarkGermanyEstoniaIreland (1)GreeceSpa<strong>in</strong>FranceItalyCyprus (1)LatviaLithuaniaLuxembourgHungary (1)MaltaNetherlandsAustriaPoland (1)Portugal (1)Romania (2)Slovenia (1)SlovakiaF<strong>in</strong>landSwedenUnited K<strong>in</strong>gdomIcelandNorwaySwitzerland (1)(1) 2006.(2) 2005.Source: <strong>Eurostat</strong> (tec00016, tec00015 and tec00013)Taxes on production and imports less subsidiesGross operat<strong>in</strong>g surplus and mixed <strong>in</strong>comeCompensation of employeesFigure 2.11: Gross national sav<strong>in</strong>gs (1)(% of gross national disposable <strong>in</strong>come)35302520151050EU-15Euro area (2)F<strong>in</strong>landSwedenNetherlandsSloveniaAustriaGermanyCzech RepublicBelgiumDenmarkSlovakiaSpa<strong>in</strong>IrelandEstoniaItalyPolandFranceHungary (3)Romania (3)LithuaniaUnited K<strong>in</strong>gdomBulgariaLatviaPortugalGreece (3)Cyprus (4)1997 2007(1) Luxembourg and Malta, not available.(2) EA-13 <strong>in</strong>stead of EA-15.(3) 1997, not available.(4) 2007, not available.Source: <strong>Eurostat</strong> (nama_<strong>in</strong>c_c)EUROPE IN FIGURES — <strong>Eurostat</strong> <strong>yearbook</strong> <strong>2009</strong>81
2 EconomyTable 2.5: Gross household sav<strong>in</strong>gs (1)(% of gross household disposable <strong>in</strong>come)1997 1998 1999 2000 2001 2002 2003 2004 2005 2006 2007EU-27 : : 12.0 11.3 12.3 12.1 12.1 11.7 11.6 11.0 10.7Belgium 17.7 17.0 17.2 15.4 16.4 15.8 14.7 13.3 12.6 12.9 13.7Bulgaria : : : : : : : : -22.7 : :Czech Republic 11.0 9.2 8.5 8.5 7.4 8.1 7.4 5.7 8.1 9.1 8.8Denmark 5.0 6.3 3.8 4.9 8.8 8.8 9.4 6.3 2.6 4.0 :Germany 15.9 15.9 15.3 15.1 15.2 15.7 16.0 16.1 16.3 16.2 16.7Estonia 6.5 4.5 2.6 4.1 3.1 0.5 -1.6 -4.8 -3.8 -3.0 0.8Ireland : : : : : 10.3 10.6 13.7 11.6 10.3 9.2Greece : : : 2.5 1.7 1.1 1.6 1.5 0.7 1.2 :Spa<strong>in</strong> : : : 11.1 11.1 11.4 12.0 11.3 11.3 11.2 10.2France 15.8 15.4 15.1 14.9 15.6 16.7 15.6 15.6 14.6 14.9 15.6Italy 20.2 16.8 15.8 14.2 16.0 16.8 16.0 16.0 15.9 15.1 14.2Cyprus : : : : : : : : : : :Latvia 1.8 0.7 -0.7 2.9 -0.4 1.5 3.0 4.7 1.2 -3.6 :Lithuania 3.4 7.2 7.8 7.2 6.2 6.1 3.7 1.9 1.6 0.7 :Luxembourg : : : : : : : : : : :Hungary : : : 13.9 13.7 11.4 9.2 11.6 11.4 12.0 :Malta : : : : : : : : : : :Netherlands 17.6 16.6 13.8 11.9 14.5 13.7 13.0 13.0 12.2 11.5 13.4Austria 12.6 13.3 14.5 13.9 12.9 12.9 14.0 14.1 14.5 15.4 16.3Poland 14.1 14.4 12.9 10.7 12.1 8.4 7.8 7.2 7.2 6.6 :Portugal 10.8 10.5 9.8 10.2 10.9 10.6 10.5 9.7 9.2 8.1 6.6Romania : : : : : : -7.5 -3.0 -10.9 -14.1 :Slovenia : : : 14.5 16.1 16.9 14.8 15.9 16.8 16.1 :Slovakia 13.9 12.4 11.2 11.1 9.1 8.9 7.1 6.3 6.9 6.1 7.7F<strong>in</strong>land 9.1 7.9 9.3 7.6 7.8 7.9 8.4 9.4 8.0 5.6 5.5Sweden 7.2 6.4 6.0 7.4 11.8 11.6 11.4 10.3 9.5 9.8 11.0United K<strong>in</strong>gdom 9.6 7.4 5.2 4.7 6.0 4.8 5.1 4.0 5.1 4.2 2.5Norway 8.1 10.5 9.5 9.2 8.2 12.7 13.3 11.8 14.5 5.6 4.6Switzerland 15.8 15.8 16.0 16.9 17.1 16.1 14.8 14.4 15.3 17.1 :(1) Includ<strong>in</strong>g net adjustment for the change <strong>in</strong> net equity of households <strong>in</strong> pension funds reserves.Source: <strong>Eurostat</strong> (tsdec240)82 EUROPE IN FIGURES — <strong>Eurostat</strong> <strong>yearbook</strong> <strong>2009</strong>
Economy 22.2 Government f<strong>in</strong>ancesIntroductionThe discipl<strong>in</strong>es of the Stability andGrowth Pact (SGP) keep economic developments<strong>in</strong> the EU, and <strong>in</strong> the euroarea countries <strong>in</strong> particular, broadlysynchronised (4) . They prevent MemberStates from tak<strong>in</strong>g policy measures whichwould unduly benefit their own economiesat the expense of others. There aretwo key pr<strong>in</strong>ciples to the Pact: namely,that the deficit must not exceed 3 % ofgross domestic product (GDP) and thatthe debt-to-GDP ratio should not bemore than 60 %.A revision <strong>in</strong> March 2005 based on thefirst five years of experience left thesepr<strong>in</strong>ciples unchanged, but <strong>in</strong>troducedgreater flexibility <strong>in</strong> exceed<strong>in</strong>g the deficitthreshold <strong>in</strong> hard economic times orto f<strong>in</strong>ance <strong>in</strong>vestment <strong>in</strong> structural improvements.It also gave Member Statesa longer period to reverse their excessivedeficits – although, if they do not br<strong>in</strong>gtheir economies back <strong>in</strong>to l<strong>in</strong>e, correctivemeasures, or even f<strong>in</strong>es, can be imposed.Each year, Member States provide the<strong>Europe</strong>an Commission <strong>with</strong> detailed <strong>in</strong>formationon their economic policies andthe state of their public f<strong>in</strong>ances. Euroarea countries provide this <strong>in</strong>formation <strong>in</strong>the context of the ‘stability programmes’,while other Member States do so <strong>in</strong> theform of ‘convergence programmes’. The<strong>Europe</strong>an Commission assesses whetherthe policies are <strong>in</strong> l<strong>in</strong>e <strong>with</strong> agreed economic,social and environmental objectivesand may choose to issue a warn<strong>in</strong>gif it believes a deficit is becom<strong>in</strong>g abnormallyhigh.Def<strong>in</strong>itions and data availabilityMember States acknowledge the need forsolid and susta<strong>in</strong>able government f<strong>in</strong>ances.Under the rules on budgetary discipl<strong>in</strong>e<strong>with</strong><strong>in</strong> the EU Stability and GrowthPact (Amsterdam, 1997), Member Statesare to avoid situations of ‘excessive governmentdeficits’: their ratio of planned oractual government deficit to GDP shouldbe no more than 3 %, and their ratio ofgovernment debt to GDP should be nomore than 60 % (unless the excess overthe reference value is only exceptional ortemporary, or unless the ratios have decl<strong>in</strong>edsubstantially and cont<strong>in</strong>uously).The Member States should, by law, notifytheir government deficit and debt statisticsto the <strong>Europe</strong>an Commission before1 April and 1 October of each yearunder the ‘excessive deficit procedure’. Inaddition, <strong>Eurostat</strong> collects the data andensures that Member States comply <strong>with</strong>the relevant regulations. The ma<strong>in</strong> aggregatesof general government are providedby the Member States to <strong>Eurostat</strong> twice ayear, accord<strong>in</strong>g to the ESA 95 transmissionprogramme.The data presented <strong>with</strong><strong>in</strong> this sectioncorrespond to the ma<strong>in</strong> revenue and expenditureitems of the general governmentsector, which are compiled on anational accounts (ESA 95) basis. The differencebetween total revenue and totalexpenditure – <strong>in</strong>clud<strong>in</strong>g capital expenditure(<strong>in</strong> particular, gross fixed capital formation)– equals net lend<strong>in</strong>g/net borrow<strong>in</strong>g,which is also the balanc<strong>in</strong>g item ofthe non-f<strong>in</strong>ancial accounts.(4) http://ec.europa.eu/economy_f<strong>in</strong>ance/sg_pact_fiscal_policy/fiscal_policy528_en.htm.EUROPE IN FIGURES — <strong>Eurostat</strong> <strong>yearbook</strong> <strong>2009</strong>83
2 EconomyThe general government sector <strong>in</strong>cludesall <strong>in</strong>stitutional units whose output is<strong>in</strong>tended for <strong>in</strong>dividual and collectiveconsumption, and ma<strong>in</strong>ly f<strong>in</strong>anced bycompulsory payments made by units belong<strong>in</strong>gto other sectors, and/or all <strong>in</strong>stitutionalunits pr<strong>in</strong>cipally engaged <strong>in</strong> theredistribution of national <strong>in</strong>come andwealth. The general government sector issubdivided <strong>in</strong>to four subsectors: centralgovernment, State government, local government,and social security funds:• Central government covers all adm<strong>in</strong>istrativedepartments of the Stateand other central agencies whose responsibilitiesextend over the wholeeconomic territory, except for theadm<strong>in</strong>istration of the social securityfunds.• State government covers separate <strong>in</strong>stitutionalunits exercis<strong>in</strong>g some ofthe functions of government at a levelbelow that of central government andabove that of the governmental <strong>in</strong>stitutionalunits exist<strong>in</strong>g at local level,except for the adm<strong>in</strong>istration of socialsecurity funds.• Local government concerns all typesof public adm<strong>in</strong>istration whose competenceextends to only a local part ofthe economic territory apart from localagencies of social security funds.• Social security funds comprises allcentral, State and local <strong>in</strong>stitutionalunits whose pr<strong>in</strong>cipal activity is toprovide social benefits, and whichfulfil each of the two follow<strong>in</strong>g criteria:(i) by law or regulation (exceptregulations concern<strong>in</strong>g governmentemployees), certa<strong>in</strong> groups of thepopulation are obliged to participate<strong>in</strong> the scheme or to pay contributions,and (ii) general government is responsiblefor the management of the<strong>in</strong>stitution <strong>in</strong> respect of settlementor approval of the contributions andbenefits <strong>in</strong>dependently of its role as asupervisory body or employer.The ma<strong>in</strong> revenue of general governmentconsists of taxes, social contributions,sales and property <strong>in</strong>come. It isdef<strong>in</strong>ed <strong>in</strong> ESA-95 by reference to a list ofcategories: market output, output for ownf<strong>in</strong>al use, payments for the other nonmarketoutput, taxes on production andimports, other subsidies on production,receivable property <strong>in</strong>come, current taxeson <strong>in</strong>come, wealth, etc., social contributions,other current transfers and capitaltransfers.The ma<strong>in</strong> expenditure items consist ofthe compensation of civil servants, socialbenefits, <strong>in</strong>terest on the public debt, subsidiesand gross fixed capital formation.Total general government expenditureis def<strong>in</strong>ed <strong>in</strong> ESA-95 by reference to a listof categories: <strong>in</strong>termediate consumption,gross capital formation, compensationof employees, other taxes on production,subsidies, payable property <strong>in</strong>come, currenttaxes on <strong>in</strong>come, wealth, etc., socialbenefits, some social transfers, other currenttransfers, some adjustments, capitaltransfers and transactions on non-producedassets.84 EUROPE IN FIGURES — <strong>Eurostat</strong> <strong>yearbook</strong> <strong>2009</strong>
Economy 2The public balance is def<strong>in</strong>ed as generalgovernment net borrow<strong>in</strong>g/net lend<strong>in</strong>greported for the Excessive DeficitProcedure and is expressed <strong>in</strong> relationto GDP. General government comprisescentral, state and local government, aswell as social security funds. Under theconvergence criteria, the ratio of plannedor actual government deficit (net borrow<strong>in</strong>g)to GDP should be no more than 3 %.General government consolidated grossdebt is also expressed as a percentage ofGDP. It refers to the consolidated stock ofgross debt at nom<strong>in</strong>al value at the end ofthe year. Under the convergence criteria,the ratio of general government consolidatedgross debt to GDP should generallybe no more than 60 % (unless the ratio issufficiently dim<strong>in</strong>ish<strong>in</strong>g and approach<strong>in</strong>gthe reference value at a satisfactory pace).Compulsory levies correspond to revenueswhich are levied (<strong>in</strong> cash or <strong>in</strong> k<strong>in</strong>d)by central, state and local governments,and social security funds. Compulsorylevies (generally referred to as taxes) areorganised <strong>in</strong>to three ma<strong>in</strong> areas, coveredby the follow<strong>in</strong>g head<strong>in</strong>gs:• taxes on <strong>in</strong>come and wealth, <strong>in</strong>clud<strong>in</strong>gall compulsory payments leviedperiodically by general governmenton the <strong>in</strong>come and wealth of enterprisesand households;• taxes on production and imports,<strong>in</strong>clud<strong>in</strong>g all compulsory paymentslevied by general government <strong>with</strong>respect to the production and importationof goods and services, the employmentof labour, the ownership oruse of land, build<strong>in</strong>gs or other assetsused <strong>in</strong> production;• social contributions, <strong>in</strong>clud<strong>in</strong>g allemployers and employees social contributions,as well as imputed socialcontributions that represent the counterpartto social benefits paid directlyby employers.Data on public procurement are basedon <strong>in</strong>formation conta<strong>in</strong>ed <strong>in</strong> the calls forcompetition and contract award noticessubmitted for publication <strong>in</strong> the OfficialJournal of the <strong>Europe</strong>an Communities(the S series). The numerator is thevalue of public procurement, which isopenly advertised. For each of the sectors– works, supplies and services – thenumber of calls for competition publishedis multiplied by an average based,<strong>in</strong> general, on all the prices provided <strong>in</strong>the contract award notices published <strong>in</strong>the Official Journal dur<strong>in</strong>g the relevantyear. The value of public procurement isthen expressed relative to GDP.State aid is made up of sectoral State aid(given to specific activities such as agriculture,fisheries, manufactur<strong>in</strong>g, m<strong>in</strong><strong>in</strong>g,services), ad-hoc State aid (given to<strong>in</strong>dividual enterprises), and State aid forhorizontal objectives such as researchand development, safeguard<strong>in</strong>g the environment,support to small and mediumsizedenterprises, employment creationor tra<strong>in</strong><strong>in</strong>g, <strong>in</strong>clud<strong>in</strong>g aid for regional development.The first two of these (sectoraland ad-hoc State aid) are considered potentiallymore distortive to competition.EUROPE IN FIGURES — <strong>Eurostat</strong> <strong>yearbook</strong> <strong>2009</strong>85
2 EconomyMa<strong>in</strong> f<strong>in</strong>d<strong>in</strong>gsThe public (general government) deficitof the EU-27, measured <strong>in</strong> terms of apercentage share of GDP, fell to -0.9 % <strong>in</strong>2007, its lowest rate s<strong>in</strong>ce 2000. The trendwas similar <strong>in</strong> the euro area, where thedeficit was steadily reduced from 2.9 %of GDP recorded for 2004 to -0.6 % ofGDP for 2007. The deficit ratios for allof the Member States, <strong>with</strong> the exceptionof Hungary (-5.5 %), were <strong>with</strong><strong>in</strong> thetarget reference value of -3 % <strong>in</strong> 2007, upfrom only fifteen of the Member States<strong>in</strong> 2004. Of the 26 Member States <strong>with</strong><strong>in</strong>the Maastricht target, ten reporteda surplus, the highest of which were <strong>in</strong>F<strong>in</strong>land (5.3 %) and Denmark (4.4 %),while the public balance was <strong>in</strong> equilibriumfor Germany and Latvia. In the periodbetween 2004 and 2007, most of thedeficit ratios <strong>in</strong> the Member States werereduced; this was also the case <strong>in</strong> Turkeyand Croatia.For the first time s<strong>in</strong>ce the launch of theeuro, average general government grossdebt across the EU-27 fell below the target60 % of GDP <strong>in</strong> 2007, reach<strong>in</strong>g 58.7 %.The average rate across the euro area alsofell to its lowest level <strong>in</strong> 2007 (66.4 %), butrema<strong>in</strong>ed above the target. Some 19 ofthe Member States had a debt ratio below60 % of GDP <strong>in</strong> 2007, the same numberas <strong>in</strong> 2004. Throughout this period, Italyrecorded the highest debt ratio, at over100 %. Greece followed closely, but reducedits debt-to-GDP ratio from 98.6 %to 94.5 %. At the other end of the scale,Estonia and Luxembourg reported thelowest debt to GDP ratios, both below7 % throughout the period considered.Dur<strong>in</strong>g the period from 2004 to 2007, thedebt ratios <strong>in</strong> Bulgaria and Denmark fellat the most rapid pace.General government expenditure maybe identified by function us<strong>in</strong>g the classificationof the functions of government– COFOG. In all of the Member States,social protection measures accountedfor the highest proportion of governmentexpenditure, albeit rang<strong>in</strong>g <strong>in</strong> 2006from a little less than 10 % of GDP <strong>in</strong>Estonia, Ireland and Latvia to over 21 %<strong>in</strong> Sweden, France (2005), Denmark andGermany. Average expenditure on generalpublic services and health across theeuro area was broadly similar (each be<strong>in</strong>gabout 7 % <strong>in</strong> 2005), <strong>with</strong> both expenditureon education and economic affairsaccount<strong>in</strong>g for a slightly lower proportion(between 4 % and 5 % on average).The importance of the general governmentsector <strong>in</strong> the economy may bemeasured <strong>in</strong> terms of total governmentrevenue and expenditure as a percentageof GDP. In the EU-27, total governmentrevenue <strong>in</strong> 2007 amounted to 44.9 % ofGDP, and expenditure to 45.8 % of GDP;<strong>in</strong> the euro area, the equivalent <strong>figures</strong>were 45.7 % and 46.3 % respectively.The level of general government expenditureand revenue varies considerably betweenthe Members States. Those <strong>with</strong>the highest levels of comb<strong>in</strong>ed governmentexpenditure and revenue as a proportionof GDP <strong>in</strong> 2007 were Sweden,Denmark, France and F<strong>in</strong>land, for whichthe government sector represented over100 % of GDP. N<strong>in</strong>e Member States reportedrelatively low comb<strong>in</strong>ed revenueand expenditure to GDP ratios below80 %. Out of these, the government sectorwas smallest for Slovakia, Romania,Estonia and Lithuania, where revenueplus expenditure accounted for less than72 % of GDP <strong>in</strong> 2007.86 EUROPE IN FIGURES — <strong>Eurostat</strong> <strong>yearbook</strong> <strong>2009</strong>
Economy 2The ma<strong>in</strong> types of government revenueare taxes on <strong>in</strong>come and wealth, taxeson production and imports, and socialcontributions. These three sources of revenueaccounted for over 90 % of EU-27revenue <strong>in</strong> 2007. The structure of taxes<strong>with</strong><strong>in</strong> the EU-27 shows that receiptsfrom these three ma<strong>in</strong> tax head<strong>in</strong>gs wereroughly equal <strong>in</strong> 2007: social contributionsaccounted for 13.6 % of GDP, taxeson production and imports for 13.5 %,and current taxes on <strong>in</strong>come and wealthfor 13.4 %. In a similar way to the distributionof government expenditure, therewas considerable variation <strong>in</strong> the structureof taxes across the Member States.As may be expected, those countries thatreported relatively high levels of expendituretended to be those that also raisedmore taxes (as a proportion of GDP). Forexample, the highest return from taxeswas 49.4 % of GDP recorded <strong>in</strong> Denmark,<strong>with</strong> Sweden record<strong>in</strong>g the next highestshare. The proportion of GDP accountedfor by taxes was about 30 % <strong>in</strong> Lithuania,Romania and Slovakia, <strong>with</strong> the relativeimportance of current taxes on <strong>in</strong>comeand wealth particularly low <strong>in</strong> the lattertwo countries.The value of public procurement, which isopenly advertised, expressed as a proportionof GDP, rose between 1996 and 2006<strong>in</strong> each of the 15 Member States for whichdata are available, <strong>with</strong> the exception ofPortugal. Public procurement accountedfor 3.3 % of GDP <strong>in</strong> the EU-25 <strong>in</strong> 2006,<strong>with</strong> a high of 13.8 % recorded <strong>in</strong> Latvia.In total, EU State aid amounted to 0.6 % ofGDP <strong>in</strong> 2006, which marked a reductioncompared <strong>with</strong> its peak value of 0.7 % <strong>in</strong>2002. This average masks significant disparitiesbetween Member States: the ratioof total State aid to GDP ranged from0.4 % or less <strong>in</strong> Estonia, Belgium, Italy,the Netherlands, Luxembourg, Greece,the United K<strong>in</strong>gdom and Bulgaria (2004)to 1.5 % or more <strong>in</strong> F<strong>in</strong>land, Hungary,Latvia, Romania (2004) and Malta. Therelatively high importance of State aid<strong>in</strong> some of the Member States that jo<strong>in</strong>edthe EU s<strong>in</strong>ce 2004 may be largely attributedto pre-accession measures that areeither be<strong>in</strong>g phased out under transitionalarrangements or are limited <strong>in</strong> time.In absolute numbers, State aid by EU-25Member States amounted to EUR 66 805million <strong>in</strong> 2006.Figure 2.12: Public balance(net borrow<strong>in</strong>g/lend<strong>in</strong>g of consolidated general government sector, % of GDP)630-3-6-9ThresholdEU-27Euro areaF<strong>in</strong>landDenmarkSwedenBulgariaCyprusLuxembourgEstoniaSpa<strong>in</strong>NetherlandsIrelandLatviaGermanySloveniaBelgiumAustriaLithuaniaCzech RepublicMaltaItalyPolandSlovakiaRomaniaPortugalFranceGreeceUnited K<strong>in</strong>gdoHungaryTurkeyCroatia2004 2007Source: <strong>Eurostat</strong> (tsieb080)EUROPE IN FIGURES — <strong>Eurostat</strong> <strong>yearbook</strong> <strong>2009</strong>87
2 EconomyTable 2.6: Public balance, general government debt2004 2005 2006 2007 2004 2005 2006 2007EU-27 -2.8 -2.5 -1.4 -0.9 62.1 62.6 61.3 58.7Euro area -2.9 -2.5 -1.3 -0.6 69.6 70.2 68.5 66.4Belgium 0.0 -2.3 0.3 -0.2 94.2 92.1 88.2 84.9Bulgaria 1.4 1.8 3.0 3.4 37.9 29.2 22.7 18.2Czech Republic -3.0 -3.6 -2.7 -1.6 30.4 29.7 29.4 28.7Denmark 1.9 5.0 4.8 4.4 43.8 36.4 30.4 26.0Germany -3.8 -3.4 -1.6 0.0 65.6 67.8 67.6 65.0Estonia 1.6 1.8 3.4 2.8 5.1 4.5 4.2 3.4Ireland 1.4 1.6 3.0 0.3 29.5 27.4 25.1 25.4Greece -7.4 -5.1 -2.6 -2.8 98.6 98.0 95.3 94.5Spa<strong>in</strong> -0.3 1.0 1.8 2.2 46.2 43.0 39.7 36.2France -3.6 -2.9 -2.4 -2.7 64.9 66.4 63.6 64.2Italy -3.5 -4.2 -3.4 -1.9 103.8 105.8 106.5 104.0Cyprus -4.1 -2.4 -1.2 3.3 70.2 69.1 64.8 59.8Latvia -1.0 -0.4 -0.2 0.0 14.9 12.4 10.7 9.7Lithuania -1.5 -0.5 -0.5 -1.2 19.4 18.6 18.2 17.3Luxembourg -1.2 -0.1 1.3 2.9 6.3 6.1 6.6 6.8Hungary -6.5 -7.8 -9.2 -5.5 59.4 61.6 65.6 66.0Malta -4.6 -3.0 -2.6 -1.8 72.6 70.4 64.2 62.6Netherlands -1.7 -0.3 0.5 0.4 52.4 52.3 47.9 45.4Austria -3.7 -1.5 -1.5 -0.5 63.8 63.5 61.8 59.1Poland -5.7 -4.3 -3.8 -2.0 45.7 47.1 47.6 45.2Portugal -3.4 -6.1 -3.9 -2.6 58.3 63.6 64.7 63.6Romania -1.2 -1.2 -2.2 -2.5 18.8 15.8 12.4 13.0Slovenia -2.3 -1.5 -1.2 -0.1 27.6 27.5 27.2 24.1Slovakia -2.4 -2.8 -3.6 -2.2 41.4 34.2 30.4 29.4F<strong>in</strong>land 2.4 2.9 4.1 5.3 44.1 41.3 39.2 35.4Sweden 0.8 2.2 2.3 3.5 51.2 50.9 45.9 40.6United K<strong>in</strong>gdom -3.4 -3.4 -2.6 -2.9 40.4 42.1 43.1 43.8Croatia -4.3 -4.0 -2.4 -1.6 43.2 43.7 40.8 37.7Turkey -4.5 -0.6 -0.1 -1.2 59.2 52.3 46.1 38.8Norway 11.1 15.2 19.3 : 45.6 43.8 48.9 :Source: <strong>Eurostat</strong> (tsieb080 and tsieb090)Public balance(net borrow<strong>in</strong>g/lend<strong>in</strong>g of consolidatedgeneral government sector, % of GDP)General government debt(general government consolidatedgross debt, % of GDP)88 EUROPE IN FIGURES — <strong>Eurostat</strong> <strong>yearbook</strong> <strong>2009</strong>
Economy 2Figure 2.13: General government debt(general government consolidated gross debt, % of GDP)120100806040200EU-27Euro areaItalyGreeceBelgiumHungaryGermanyFrancePortugalMaltaCyprusAustriaNetherlandsPolandUnited K<strong>in</strong>gdomSwedenSpa<strong>in</strong>F<strong>in</strong>landSlovakiaCzech RepublicDenmarkIrelandSloveniaBulgariaThresholdLithuaniaRomaniaLatviaLuxembourgEstoniaTurkeyCroatia2004 2007Source: <strong>Eurostat</strong> (tsieb090)Figure 2.14: General government expenditure by COFOG function, 2006 (1)(% of GDP)6040200Euro area (2)BelgiumCzech RepublicDenmarkGermanyEstoniaIrelandGreeceSpa<strong>in</strong>France (2)ItalyCyprusLatviaLithuaniaLuxembourgHungaryMaltaNetherlandsAustriaOthersEconomic affairsEducationHealthGeneral public servicesSocial protectionPolandPortugalRomania (2)SloveniaSlovakia (2)F<strong>in</strong>landSwedenUnited K<strong>in</strong>gdomNorway(1) COFOG: classification of the functions of government; Bulgaria, not available.(2) 2005.Source: <strong>Eurostat</strong> (gov_a_exp)EUROPE IN FIGURES — <strong>Eurostat</strong> <strong>yearbook</strong> <strong>2009</strong>89
2 EconomyFigure 2.15: Government revenue and expenditure, 2007 (1)(% of GDP)6040200Figure 2.16: Taxes and social contributions, 2007(% of GDP)6040200EU-27EU-27Euro areaEuro areaSwedenDenmarkFranceF<strong>in</strong>landBelgiumAustriaItalyHungaryNetherlandsCyprusPortugalGermanySloveniaUnited K<strong>in</strong>gdomGreeceMaltaCzech RepublicPolandSpa<strong>in</strong>BulgariaLuxembourgLatviaIrelandSlovakiaRomaniaEstoniaLithuaniaNorwayIcelandTotal general government revenueTotal general government expenditure(1) The figure is ranked on the average of revenue and expenditure.Source: <strong>Eurostat</strong> (tec00021 and tec00023)BelgiumBulgariaCzech RepublicDenmarkGermanyEstoniaIrelandGreeceSpa<strong>in</strong>FranceItalyCyprusLatviaLithuaniaLuxembourgHungaryMaltaNetherlandsAustriaPolandPortugalRomaniaSocial contributionsTaxes on production and imports (1)Current taxes on <strong>in</strong>come and wealthSloveniaSlovakiaF<strong>in</strong>landSwedenUnited K<strong>in</strong>gdomIcelandNorway(1) For Denmark, <strong>in</strong>cludes taxes on production and imports collected on behalf of EU <strong>in</strong>stitutions.Source: <strong>Eurostat</strong> (tec00019, tec00020 and tec00018)90 EUROPE IN FIGURES — <strong>Eurostat</strong> <strong>yearbook</strong> <strong>2009</strong>
Economy 2Figure 2.17: Public procurement (1)(value of public procurement which is openly advertised, as % of GDP)15129630EU-25 (2)Euro area (3)Latvia (2)Estonia (2)Hungary (2)GreecePoland (2)Czech Republic (2)Slovenia (2)United K<strong>in</strong>gdomCyprus (2)Lithuania (2)Spa<strong>in</strong>FranceIrelandSwedenF<strong>in</strong>landSlovakia (2)ItalyDenmarkBelgiumNetherlandsPortugalMalta (2)AustriaGermanyLuxembourg1996 2006(1) Bulgaria and Romania, not available.(2) Not available for 1996.(3) EA-12 <strong>in</strong>stead of EA-15.Source: <strong>Eurostat</strong> (tsier090), Commission servicesFigure 2.18: State aid, 2006 (1)(% of GDP)3210EU-25Euro area (2)MaltaRomania (3)LatviaHungaryF<strong>in</strong>landSwedenPortugalAustriaGermanyPolandSloveniaCyprusCzech RepublicDenmarkFranceIrelandLithuaniaSlovakiaSpa<strong>in</strong>EstoniaBelgiumItalyNetherlandsLuxembourgGreeceUnited K<strong>in</strong>gdomBulgaria (3)Total State aid Sectoral and ad hoc State aid (4)(1) The figure is ranked on total State aid.(2) EA-13 <strong>in</strong>stead of EA-15, 2005.(3) 2004.(4) 2005.Source: <strong>Eurostat</strong> (tsier100), Commission servicesEUROPE IN FIGURES — <strong>Eurostat</strong> <strong>yearbook</strong> <strong>2009</strong>91
2 Economy2.3 Exchange rates and<strong>in</strong>terest ratesIntroductionOn 1 January 2002, around 7 800 millionnotes and 40 400 million co<strong>in</strong>s enteredcirculation, valued at EUR 144 000 million,as the euro became the commoncurrency of 12 of the Member States;these were Belgium, Germany, Ireland,Greece, Spa<strong>in</strong>, France, Italy, Luxembourg,the Netherlands, Austria, Portugal andF<strong>in</strong>land. Slovenia subsequently jo<strong>in</strong>edthe euro area at the start of 2007 as didCyprus and Malta on 1 January 2008,br<strong>in</strong>g<strong>in</strong>g the number of Member Statesus<strong>in</strong>g the euro to 15.Economic and Monetary Union (EMU)consists of three stages coord<strong>in</strong>at<strong>in</strong>g economicpolicy and culm<strong>in</strong>at<strong>in</strong>g <strong>with</strong> theadoption of the euro. All EMU membersare eligible to adopt the euro. At the timeof writ<strong>in</strong>g, it is expected that Slovakiawill adopt the euro on 1 January <strong>2009</strong>.The entry criteria for the euro <strong>in</strong>cludetwo years of prior exchange rate stabilityvia membership of the Exchange RateMechanism (ERM), as well as criteria relat<strong>in</strong>gto <strong>in</strong>terest rates, budget deficits, <strong>in</strong>flationrates, and debt-to-GDP ratios.Through us<strong>in</strong>g a common currency thecountries of the euro area have removedexchange rates and therefore benefit fromlower transaction costs. The size of theeuro area market is also likely to promote<strong>in</strong>vestment and trade. Those countriesjo<strong>in</strong><strong>in</strong>g the euro area have agreed to allowthe <strong>Europe</strong>an Central Bank (ECB)to be responsible for ma<strong>in</strong>ta<strong>in</strong><strong>in</strong>g pricestability, through the def<strong>in</strong>ition and implementationof monetary policy. Whenthe euro was launched <strong>in</strong> 1999, the ECBtook over full responsibility for monetarypolicy throughout the euro area, <strong>in</strong>clud<strong>in</strong>gsett<strong>in</strong>g benchmark <strong>in</strong>terest ratesand manag<strong>in</strong>g the euro area’s foreignexchange reserves. The ECB has def<strong>in</strong>edprice stability as a year-on-year <strong>in</strong>crease<strong>in</strong> the harmonised <strong>in</strong>dex of consumerprices (HICP) for the euro area close tobut below 2 % over the medium term (seesection 2.5 for more details <strong>in</strong> relation toconsumer prices). Monetary policy decisionsare taken by the ECB’s govern<strong>in</strong>gcouncil which meets every month to analyseand assess economic developmentsand the risks to price stability and to decideon the appropriate level of <strong>in</strong>terestrates.The ECB also has the job of ensur<strong>in</strong>gthat payments move smoothly acrossEU f<strong>in</strong>ancial markets. The ECB and the<strong>Europe</strong>an Commission are work<strong>in</strong>gjo<strong>in</strong>tly on a S<strong>in</strong>gle Euro Payments Area(SEPA) – a system that aims to make virtuallyall forms of cross-border euro paymentfaster and no more expensive thandomestic payments by 2010.Def<strong>in</strong>itions and data availabilityExchange rates are the price or valueof one country’s currency <strong>in</strong> relation toanother. <strong>Eurostat</strong>’s database conta<strong>in</strong>s anumber of different data sets concern<strong>in</strong>gexchange rates. Three ma<strong>in</strong> areas aredist<strong>in</strong>guished:• data on bilateral exchange rates betweencurrencies, <strong>in</strong>clud<strong>in</strong>g somespecial conversion factors for thecountries that have adopted the euro;• data on fluctuations <strong>in</strong> the exchangerate mechanism (ERM and ERM II)of the EU;• data on effective exchange rate<strong>in</strong>dices.92 EUROPE IN FIGURES — <strong>Eurostat</strong> <strong>yearbook</strong> <strong>2009</strong>
Economy 2Bilateral exchange rates are available<strong>with</strong> reference to the euro; before 1999,exchange rates were given <strong>in</strong> relation tothe ecu (<strong>Europe</strong>an currency unit). Theecu ceased to exist on 1 January 1999,when it was replaced by the euro at anexchange rate of 1:1. From that date, thecurrencies of the euro area became subdivisionsof the euro at irrevocably fixedrates of conversion. Daily exchange ratesare available from 1974 onwards aga<strong>in</strong>sta large number of currencies. These dailyvalues are used to construct monthlyand annual averages, which are based onbus<strong>in</strong>ess day rates. Alternatively, monthendand year-end rates are also providedfor the daily rate of the last bus<strong>in</strong>ess dayof the month/year.An <strong>in</strong>terest rate is def<strong>in</strong>ed as the costor price of borrow<strong>in</strong>g, or the ga<strong>in</strong> fromlend<strong>in</strong>g; <strong>in</strong>terest rates are traditionallyexpressed <strong>in</strong> annual percentage terms.Interest rates are dist<strong>in</strong>guished either bythe period of lend<strong>in</strong>g/borrow<strong>in</strong>g, or bythe parties <strong>in</strong>volved <strong>in</strong> the transaction(bus<strong>in</strong>ess, consumers, governments or<strong>in</strong>terbank operations).Central bank <strong>in</strong>terest rates are key referencerates set by the ECB and nationalcentral banks (for those countries outsideof the euro area). Central bank <strong>in</strong>terestrates are also referred to as official <strong>in</strong>terestrates; they are the ma<strong>in</strong> <strong>in</strong>strument ofmonetary policy for central banks.<strong>Eurostat</strong> publish statistics on <strong>in</strong>terestrates under several head<strong>in</strong>gs:• long-term <strong>in</strong>terest rates: governmentbond yields <strong>with</strong> a 10 years’ maturityand <strong>in</strong>terest rates used for theMaastricht criterion on long-term <strong>in</strong>terestrates;• central bank <strong>in</strong>terest rates: differentrates that central banks fix to conductthe monetary policy (reference rates);• short-term <strong>in</strong>terest rates: rates onmoney markets for different maturities(overnight, 1 to 12 months);• retail bank <strong>in</strong>terest rates: lend<strong>in</strong>gand deposit <strong>in</strong>terest rates of commercialbanks (non-harmonised and historicalseries), and harmonised MFI<strong>in</strong>terest rates (monetary f<strong>in</strong>ancial <strong>in</strong>stitutions<strong>in</strong>terest rates);• convergence of <strong>in</strong>terest rates: thestandard deviation and the coefficientof variation for: loans to householdsfor house purchases; loans to nonf<strong>in</strong>ancialcorporations over one year;loans to non-f<strong>in</strong>ancial corporationsup to one year.Ma<strong>in</strong> f<strong>in</strong>d<strong>in</strong>gsIt is important to note that nearly all ofthe <strong>in</strong>formation presented <strong>in</strong> this publicationhas been converted <strong>in</strong>to euro (EUR).As such, when mak<strong>in</strong>g comparisons betweencountries it is necessary to bear <strong>in</strong>m<strong>in</strong>d the possible effect of currency fluctuationson the evolution of particular series.The value of the euro aga<strong>in</strong>st the yenor the dollar depreciated considerably <strong>in</strong>1999 and 2000. However, the follow<strong>in</strong>gyears saw a marked appreciation <strong>in</strong> thevalue of the euro, such that it reachedrecord highs aga<strong>in</strong>st the yen (EUR 1 =JPY 168.45) <strong>in</strong> July 2007 and aga<strong>in</strong>st thedollar (EUR 1 =USD 1.59) <strong>in</strong> July 2008;afterwards the value of the euro fell.EUROPE IN FIGURES — <strong>Eurostat</strong> <strong>yearbook</strong> <strong>2009</strong>93
2 EconomyAt the end of the last period of rapid economicgrowth, global <strong>in</strong>terest rates startedto fall, <strong>with</strong> sizeable and successivereductions <strong>in</strong> 2001. This pattern cont<strong>in</strong>ued<strong>with</strong><strong>in</strong> the euro area (and to a lesserdegree the United States) dur<strong>in</strong>g 2002and 2003, such that official lend<strong>in</strong>g ratesof central banks reached historic lows –nowhere was this more evident than <strong>in</strong>Japan (where deflationary pressures resulted<strong>in</strong> an <strong>in</strong>terest rate close to zero).With signs of an economic recovery, therewere several rate rises <strong>in</strong> the United Statesdur<strong>in</strong>g 2004, which were confirmed <strong>in</strong>2005 and 2006. Subsequently, the federalfunds rate rema<strong>in</strong>ed unchanged betweenJune 2006 and September 2007,when it fell to 4.75 % on the back of fearsfor a slowdown <strong>in</strong> economic activity, <strong>in</strong>particular <strong>with</strong><strong>in</strong> the hous<strong>in</strong>g market<strong>with</strong> concerns over the subprime market.<strong>Europe</strong>an <strong>in</strong>terest rates followedthis trend, and dur<strong>in</strong>g the period fromDecember 2005 to July 2007 there weren<strong>in</strong>e <strong>in</strong>dividual <strong>in</strong>creases <strong>in</strong> <strong>in</strong>terest rates,as the ECB tightened monetary policy. Inan abrupt turnabout, there was a co-ord<strong>in</strong>ated<strong>in</strong>terest rate reduction of a halfpo<strong>in</strong>t(0.5 %) by the ECB, the US FederalReserve, the Bank of England, and thecentral banks of Canada, Sweden andSwitzerland <strong>in</strong> October 2008, <strong>in</strong> order toencourage <strong>in</strong>ter-bank lend<strong>in</strong>g, which haddried up (the so-called credit crunch) asthe full-exposure of some banks to subprimemarkets became clearer.Figure 2.19: Exchange rates aga<strong>in</strong>st the euro (1)(1998=100)14012010080601998 1999 2000 2001 2002 2003 2004 2005 2006 2007(1) CHF, Swiss franc; JPY, Japanese Yen; USD, United States Dollar; a reduction <strong>in</strong> the value of the <strong>in</strong>dex shows an appreciation <strong>in</strong> thevalue of the foreign currency and a depreciation <strong>in</strong> the value of the euro.Source: <strong>Eurostat</strong> (tec00033), ECBCHFUSDJPY94 EUROPE IN FIGURES — <strong>Eurostat</strong> <strong>yearbook</strong> <strong>2009</strong>
Economy 2Table 2.7: Exchange rates aga<strong>in</strong>st the euro (1)(1 EUR =… national currency)1999 2000 2001 2002 2003 2004 2005 2006 2007Bulgaria 1.9558 1.9522 1.9482 1.9492 1.9490 1.9533 1.9558 1.9558 1.9558Czech Republic 36.884 35.599 34.068 30.804 31.846 31.891 29.782 28.342 27.766Denmark 7.4355 7.4538 7.4521 7.4305 7.4307 7.4399 7.4518 7.4591 7.4506Estonia 15.647 15.647 15.647 15.647 15.647 15.647 15.647 15.647 15.647Latvia 0.6256 0.5592 0.5601 0.5810 0.6407 0.6652 0.6962 0.6962 0.7001Lithuania 4.2641 3.6952 3.5823 3.4594 3.4527 3.4529 3.4528 3.4528 3.4528Hungary 252.77 260.04 256.59 242.96 253.62 251.66 248.05 264.26 251.35Poland 4.2274 4.0082 3.6721 3.8574 4.3996 4.5268 4.0230 3.8959 3.7837Romania 1.6345 1.9922 2.6004 3.1270 3.7551 4.0510 3.6209 3.5258 3.3328Slovakia 44.123 42.602 43.300 42.694 41.489 40.022 38.599 37.234 33.775Sweden 8.8075 8.4452 9.2551 9.1611 9.1242 9.1243 9.2822 9.2544 9.2501United K<strong>in</strong>gdom 0.65874 0.60948 0.62187 0.62883 0.69199 0.6787 0.68380 0.68173 0.68434Croatia 7.5805 7.6432 7.4820 7.4130 7.5688 7.4967 7.4008 7.3247 7.3376Turkey 0.4472 0.5748 1.1024 1.4397 1.6949 1.7771 1.6771 1.8090 1.7891Iceland 77.180 72.580 87.420 86.180 86.650 87.140 78.230 87.760 87.630Norway 8.3104 8.1129 8.0484 7.5086 8.0033 8.3697 8.0092 8.0472 8.0165Switzerland 1.6003 1.5579 1.5105 1.4670 1.5212 1.5438 1.5483 1.5729 1.6427Japan 121.32 99.47 108.68 118.06 130.97 134.44 136.85 146.02 161.25United States 1.0658 0.9236 0.8956 0.9456 1.1312 1.2439 1.2441 1.2556 1.3705(1) The euro replaced the ecu on 1 January 1999; on 1 January 2002, it also replaced the notes and co<strong>in</strong>s of 12 Community currencies<strong>with</strong> the <strong>in</strong>troduction of the euro to the euro area (EA-12) members; on 1 January 2007, the euro came <strong>in</strong>to circulation <strong>in</strong> Slovenia; on1 January 2008, the euro came <strong>in</strong>to circulation <strong>in</strong> Cyprus and Malta.Source: <strong>Eurostat</strong> (tec00033), ECBFigure 2.20: Central bank <strong>in</strong>terest rates: official lend<strong>in</strong>g rates for loans(%)765432102000 2001 2002 2003 2004 2005 2006 2007(1) 2007, not available.Source: <strong>Eurostat</strong> (irt_cb_a), ECB, national central banksEuro areaUnited States (1)Japan (1)EUROPE IN FIGURES — <strong>Eurostat</strong> <strong>yearbook</strong> <strong>2009</strong>95
2 EconomyTable 2.8: Interest rates(%)Central bank<strong>in</strong>terest rates:official lend<strong>in</strong>grates for loansEMU convergencecriterion bondyields (Maastrichtcriterion) (1)Short-term <strong>in</strong>terestrates: three-month<strong>in</strong>ter-bank rates(annual average)Short-term <strong>in</strong>terestrates: day-to-daymoney rates(annual average) (2)2002 2007 2002 2007 2002 2007 2002 2007EU-27 : : : 4.56 3.83 4.64 3.76 2.70Euro area 3.75 5.00 4.91 : 3.32 4.28 3.29 3.87Belgium : : 4.99 4.33 - - - -Bulgaria : : : 4.54 4.91 4.90 2.39 4.03Czech Republic 3.75 4.50 4.88 4.30 3.54 3.10 3.57 2.77Denmark 2.95 4.25 5.06 4.29 3.54 4.44 3.49 2.68Germany : : 4.78 4.22 - - - -Estonia - : 8.42 6.09 3.88 4.88 3.04 :Ireland : : 5.01 4.31 - - - -Greece : : 5.12 4.50 - - - -Spa<strong>in</strong> : : 4.96 4.31 - - - -France : : 4.86 4.30 - - - -Italy : : 5.03 4.49 - - - -Cyprus 5.00 5.00 5.70 4.48 4.40 4.15 3.53 3.81Latvia 5.00 7.50 5.41 5.28 4.35 8.68 3.39 5.79Lithuania 10.00 : 6.06 4.55 3.74 5.11 2.58 4.37Luxembourg : : 4.70 4.56 - - - -Hungary 9.50 8.50 7.09 6.74 9.21 7.86 8.87 7.64Malta 4.30 5.00 5.82 4.72 4.01 4.26 3.93 4.10Netherlands : : 4.89 4.29 - - - -Austria : : 4.97 4.29 - - - -Poland 8.75 6.50 7.36 5.48 8.98 4.74 9.48 4.42Portugal : : 5.01 4.42 - - - -Romania 20.40 7.50 : 7.13 27.31 7.24 23.35 6.89Slovenia 10.50 : 8.71 4.53 8.03 : 4.88 3.37Slovakia 8.00 5.75 6.94 4.49 7.77 4.34 7.18 3.83F<strong>in</strong>land : : 4.98 4.29 - - - -Sweden 4.50 4.75 5.30 4.17 4.27 3.89 4.17 2.10United K<strong>in</strong>gdom 4.00 5.50 4.91 5.06 4.06 6.00 3.95 5.64Turkey 58.94 17.50 : : : : 49.54 17.32Japan 0.10 0.75 : : 0.08 0.79 0.00 0.00United States 1.25 4.25 : : 1.79 5.30 1.67 3.22(1) The <strong>in</strong>dicator for Estonia represents <strong>in</strong>terest rates on new EEK-denom<strong>in</strong>ated loans to non-f<strong>in</strong>ancial corporations and households<strong>with</strong> maturity over 5 years; however, a large part of the underly<strong>in</strong>g claims are l<strong>in</strong>ked to variable <strong>in</strong>terest rates. The <strong>in</strong>dicator forLuxembourg is based on a basket of long-term bonds, which have an average residual maturity close to ten years; the bonds are issuedby a private credit <strong>in</strong>stitution.(2) Denmark and Slovenia, 2006; EU-27, Japan and United States, 2005.Source: <strong>Eurostat</strong> (irt_cb_a, irt_lt_mcby_a, tec00035 and tec00034), ECB, national central banks96 EUROPE IN FIGURES — <strong>Eurostat</strong> <strong>yearbook</strong> <strong>2009</strong>
Economy 22.4 Wages and labour costsIntroductionGlobalisation, the behaviour of firms,employment-related policies and changes<strong>in</strong> the structure of markets may <strong>in</strong>fluencethe way <strong>in</strong> which labour markets develop.The level and structure of labour costsare among some of the key macro-economic<strong>in</strong>dicators used by policy-makers,employers and trade unions <strong>in</strong> assess<strong>in</strong>glabour market supply and demandconditions.With<strong>in</strong> the context of the renewed Lisbonstrategy, as highlighted <strong>in</strong> the IntegratedGuidel<strong>in</strong>es for Growth and Employmentthere are two key guidel<strong>in</strong>es, namely toensure:• ‘that wage developments contributeto macro-economic stability andgrowth, and;• employment-friendly labour cost developmentsand wage-sett<strong>in</strong>g mechanismsby encourag<strong>in</strong>g social partners<strong>with</strong><strong>in</strong> their own responsibilities toset the right framework for wage-barga<strong>in</strong><strong>in</strong>g<strong>in</strong> order to reflect productivityand labour market challenges atall relevant levels and to avoid genderpay gaps, by review<strong>in</strong>g the impacton employment of non-wage labourcosts and where appropriate adjusttheir structure and level, especiallyto reduce the tax burden on the lowpaid’(5) .At the <strong>in</strong>dividual country level, nom<strong>in</strong>aland real wage flexibility is consideredkey to rebalanc<strong>in</strong>g relative competitivepositions.Article 141(1) of the EC Treaty sets outthe pr<strong>in</strong>ciple of equal pay for male andfemale workers for equal work or workof equal value, and Article 141(3) providesthe legal basis for legislation onthe equal treatment of men and women<strong>in</strong> employment matters. The <strong>Europe</strong>anCommission Communication (6) ofMarch 2006 on a roadmap for equalitybetween women and men <strong>in</strong> the periodbetween 2006-2010 is the latest reviewof this pr<strong>in</strong>ciple (among others), and wasgiven further notice through the designationof 2007 as the <strong>Europe</strong>an Year ofEqual Opportunities. The gender paygap is a multidimensional phenomenonthat may be related to a number of effects,such as the composition of the labourforce, remuneration and personnelselection effects. Gender differences arenot restricted to pay, and the pr<strong>in</strong>cipleof equal treatment has been extended tocover a range of employment aspects, <strong>in</strong>clud<strong>in</strong>gequal access to self-employment,work<strong>in</strong>g conditions and vocational tra<strong>in</strong><strong>in</strong>g.Policy measures <strong>with</strong><strong>in</strong> this area aredesigned to take account of differences <strong>in</strong>male and female labour market participationrates and career structures, wagestructures, promotion policies, as well asthe concentration of women <strong>in</strong> low paysectors and occupations.(5) http://europa.eu/scadplus/leg/en/cha/c11323.htm.(6) COM(2006) 92 f<strong>in</strong>al; http://eur-lex.europa.eu/LexUriServ/LexUriServ.do?uri=COM:2006:0092:FIN:EN:PDF.EUROPE IN FIGURES — <strong>Eurostat</strong> <strong>yearbook</strong> <strong>2009</strong>97
2 EconomyDef<strong>in</strong>itions and data availabilityLabour costs refer to the expenditure <strong>in</strong>curredby employers <strong>in</strong> order to employpersonnel. They <strong>in</strong>clude employee compensation(<strong>in</strong>clud<strong>in</strong>g wages, salaries <strong>in</strong>cash and <strong>in</strong> k<strong>in</strong>d, employers’ social securitycontributions), vocational tra<strong>in</strong><strong>in</strong>gcosts, other expenditure such as recruitmentcosts, spend<strong>in</strong>g on work<strong>in</strong>g clothesand employment taxes regarded as labourcosts m<strong>in</strong>us any subsidies received.These labour cost components and theirelements are def<strong>in</strong>ed <strong>in</strong> CommissionRegulation (EC) 1737/2005 of 21 October2005 amend<strong>in</strong>g Regulation (EC) No1726/1999 as regards the def<strong>in</strong>ition andtransmission of <strong>in</strong>formation on labourcosts implement<strong>in</strong>g Council Regulation(EC) No 530/1999 concern<strong>in</strong>g structuralstatistics on earn<strong>in</strong>gs and labour costs.Data relate to three core <strong>in</strong>dicators:• average monthly labour costs, def<strong>in</strong>edas total labour costs per monthdivided by the correspond<strong>in</strong>g numberof employees, expressed as full-timeunits;• average hourly labour costs, def<strong>in</strong>edas total labour costs divided bythe correspond<strong>in</strong>g number of hoursworked;• the structure of labour costs (wagesand salaries; employers’ social securitycontributions; other labour costs),expressed as a percentage of total labourcosts.Gross earn<strong>in</strong>gs are the most importantpart of labour costs – <strong>in</strong>formation is providedon average annual gross earn<strong>in</strong>gs.Ma<strong>in</strong> def<strong>in</strong>itions on earn<strong>in</strong>gs are set up <strong>in</strong>Commission Regulation (EC) 1738/2005of 21 October 2005 amend<strong>in</strong>g Regulation(EC) No 1916/2000 as regards the def<strong>in</strong>itionand transmission of <strong>in</strong>formation onthe structure of earn<strong>in</strong>gs implement<strong>in</strong>gCouncil Regulation (EC) No 530/1999concern<strong>in</strong>g structural statistics on earn<strong>in</strong>gsand labour costs. Gross earn<strong>in</strong>gscover remuneration <strong>in</strong> cash paid directlyby the employer, before tax deductionsand social security contributions payableby wage earners and reta<strong>in</strong>ed by theemployer. All bonuses, whether or notregularly paid, are <strong>in</strong>cluded (13th or 14thmonth, holiday bonuses, profit-shar<strong>in</strong>g,allowances for leave not taken, occasionalcommissions, etc.). The <strong>in</strong>formation ispresented for full-time employees work<strong>in</strong>g<strong>in</strong> <strong>in</strong>dustry and services (as coveredby NACE Sections C to K). The statisticalunit is the enterprise or local unit. Thepopulation consists of all units hav<strong>in</strong>gemployees, although it is at present stillconf<strong>in</strong>ed to enterprises <strong>with</strong> at least 10employees <strong>in</strong> most countries.Net earn<strong>in</strong>gs are derived from grossearn<strong>in</strong>gs and represent the part of remunerationthat employees can actuallyspend. Compared <strong>with</strong> gross earn<strong>in</strong>gs,net earn<strong>in</strong>gs do not <strong>in</strong>clude social securitycontributions and taxes, but do <strong>in</strong>cludefamily allowances.The gender pay gap is given as the differencebetween average gross hourlyearn<strong>in</strong>gs of male paid employees and offemale paid employees, expressed as apercentage of average gross hourly earn<strong>in</strong>gsof male paid employees. The targetpopulation consists of all paid employeesaged 16-64 that are at work for at least 15hours per week. The values used were calculatedbefore switch<strong>in</strong>g to a new methodologybased on the harmonised structureof earn<strong>in</strong>gs survey.98 EUROPE IN FIGURES — <strong>Eurostat</strong> <strong>yearbook</strong> <strong>2009</strong>
Economy 2M<strong>in</strong>imum wages are enforced by lawand apply nationwide to the majorityof full-time employees <strong>in</strong> each country.M<strong>in</strong>imum wages are expressed as grossamounts, that is, before the deduction of<strong>in</strong>come tax and social security contributions.For most countries, the m<strong>in</strong>imumwage is agreed <strong>in</strong> terms of an hourly ormonthly rate, <strong>with</strong> the follow<strong>in</strong>g exceptionsfor those countries where the m<strong>in</strong>imumwage is fixed at an hourly rate:• France: m<strong>in</strong>imum wage per hour * 35hours per week * 52/12;• Ireland and the United K<strong>in</strong>gdom:m<strong>in</strong>imum wage per hour * 39 hoursper week * 52/12.• In the case of Greece, Spa<strong>in</strong> andPortugal, where 14 monthly m<strong>in</strong>imumwages are paid per year, them<strong>in</strong>imum monthly wage is multipliedby 14/12.The tax wedge on labour costs is def<strong>in</strong>edas <strong>in</strong>come tax on gross wage earn<strong>in</strong>gsplus the employee’s and the employer’ssocial security contributions, expressedas a percentage of the total labour costs ofthe earner. This <strong>in</strong>dicator is available fors<strong>in</strong>gle persons <strong>with</strong>out children earn<strong>in</strong>g67 % of the average earn<strong>in</strong>gs of an averageworker <strong>in</strong> NACE Sections C to K (thebus<strong>in</strong>ess economy). The unemploymenttrap measures the proportion of grossearn<strong>in</strong>gs which is taxed away by highertax and social security contributions andthe <strong>with</strong>drawal of unemployment andother benefits when an unemployed personreturns to employment; it is def<strong>in</strong>edas the difference between gross earn<strong>in</strong>gsand the <strong>in</strong>crease of the net <strong>in</strong>come whenmov<strong>in</strong>g from unemployment to employment,expressed as percentage of thegross earn<strong>in</strong>gs. The <strong>in</strong>dicator is availablefor s<strong>in</strong>gle persons <strong>with</strong>out children earn<strong>in</strong>g67 % of the average earn<strong>in</strong>gs of anaverage worker <strong>in</strong> NACE Sections C to K.The low wage trap measures the proportionof gross earn<strong>in</strong>gs which is taxed awaythrough the comb<strong>in</strong>ed effects of <strong>in</strong>cometaxes, social security contributions, andany <strong>with</strong>drawal of benefits when grossearn<strong>in</strong>gs <strong>in</strong>crease from 33 % to 67 % ofthe average earn<strong>in</strong>gs of an average worker<strong>in</strong> NACE Sections C to K. This <strong>in</strong>dicatoris available for s<strong>in</strong>gle persons <strong>with</strong>outchildren and for one-earner couples <strong>with</strong>two children between 6 and 11 years old.Ma<strong>in</strong> f<strong>in</strong>d<strong>in</strong>gsGross annual earn<strong>in</strong>gs of full-time employees<strong>in</strong> enterprises <strong>with</strong> 10 or moreemployees averaged EUR 28 992 <strong>in</strong> theEU-27 <strong>in</strong> 2006. Among the MemberStates, average earn<strong>in</strong>gs were highest <strong>in</strong>Denmark (EUR 48 307), followed by theUnited K<strong>in</strong>gdom, Luxembourg, Germanyand Ireland (2005) – all above EUR 40 000– and lowest <strong>in</strong> Romania (EUR 3 713) andBulgaria (EUR 2 195).Despite some progress, there rema<strong>in</strong>san important gap between the earn<strong>in</strong>gsof men and women <strong>in</strong> the EU. Womenwere paid, on average, 15 % less thantheir male counterparts <strong>with</strong><strong>in</strong> the EU-27<strong>in</strong> 2006. The pay gap was below 10 % <strong>in</strong>Ireland, Italy (2005), Portugal, Slovenia,Belgium and Malta (where it was 3 %), butwas wider than 20 % <strong>in</strong> Estonia, Cyprus,Germany, Slovakia, the United K<strong>in</strong>gdom,Austria and F<strong>in</strong>land. Various effects maycontribute to these gender pay gaps, suchas: differences <strong>in</strong> labour force participationrates, differences <strong>in</strong> the occupationsand activities that tend to be male or femaledom<strong>in</strong>ated, differences <strong>in</strong> the degreesto which men and women work ona part-time basis, as well as the attitudesof personnel departments <strong>with</strong><strong>in</strong> privateand public bodies towards career developmentand unpaid/maternity leave.EUROPE IN FIGURES — <strong>Eurostat</strong> <strong>yearbook</strong> <strong>2009</strong>99
2 EconomyStatutory m<strong>in</strong>imum wages also vary considerablybetween Member States, andreflect to some degree the price levels <strong>in</strong>each economy, <strong>with</strong> the highest m<strong>in</strong>imumwage <strong>in</strong> 2008 be<strong>in</strong>g recorded <strong>in</strong>Luxembourg (EUR 1 570 per month) andthe lowest <strong>in</strong> Bulgaria and Romania (EUR113 and EUR 141 respectively).There were quite large differences <strong>in</strong>the structure of labour costs <strong>with</strong><strong>in</strong>the Member States <strong>in</strong> 2006; the relativeimportance of wages and salaries rangedfrom less than 70 % of total labourcosts <strong>in</strong> Belgium, France, Italy (2002),Hungary and Sweden to more than 83 %<strong>in</strong> Denmark, Cyprus, Luxembourg andMalta. When social security and othernon-salary costs account for a relativelyhigh share of labour costs then this islikely to deter employers from hir<strong>in</strong>g untilthey are absolutely sure that they requirenew labour.Table 2.9: Earn<strong>in</strong>gs <strong>in</strong> <strong>in</strong>dustry and services (average gross annual earn<strong>in</strong>gs of full timeemployees <strong>in</strong> enterprises <strong>with</strong> 10 or more employees)(EUR)1996 1997 1998 1999 2000 2001 2002 2003 2004 2005 2006EU-27 : : : : : 27948 30142 30349 28226 28992 :Euro area (1) : : : : 28786 29588 30379 31089 32471 33164 :Belgium 29 131 28 901 29 616 30 701 31 644 33 109 34 330 34 643 35 704 36 673 37 674Bulgaria 795 896 1 216 1 330 1 436 1 518 1 588 1 678 1 784 1 978 2 195Czech Republic : : : : : : 6016 6137 6569 7405 8284Denmark 36 376 36 235 37 209 39 515 40 962 41 661 43 577 44 692 46 122 47 529 48 307Germany 35 254 35 093 35 432 36 228 37 319 38 204 39 153 40 056 40 954 41 694 42 382Estonia : : : : : : : : : : :Ireland : : : : : : : : : 40462 :Greece 11 917 12 605 13 210 13 926 14 721 15 431 16 278 16 739 : : :Spa<strong>in</strong> 16 043 16 192 16 528 17 038 17 432 17 768 18 462 19 220 19 828 20 439 21 150France 25 089 25 545 25 777 26 339 26 712 27 418 28 185 28 847 29 608 30 521 :Italy : : : : : : : : : : :Cyprus 12 980 14 021 14 709 15 161 16 335 16 948 17 740 18 406 19 290 20 549 21 310Latvia : : : : : : : : 3806 4246 5211Lithuania 1597 2286 2799 3017 : : : : : : :Luxembourg : 32 600 33 337 34 462 35 875 37 745 38 442 39 587 40 575 42 135 43 621Hungary 3 158 3 543 3 686 3 770 4 173 4 898 5 846 6 196 7 100 7 798 7 840Malta (2) 9 322 10 144 10 745 11 608 11 658 11 974 12 096 11 886 11 926 11 180 11 669Netherlands 28 140 28 061 29 189 30 426 31 901 33 900 35 200 36 600 37 900 38 700 :Austria : : : : : : : : 34995 36032 36673Poland 3 076 : 4 156 5 310 : 7 510 : : 6 230 6 270 :Portugal : : : : 12620 13338 13322 13871 14253 14715 15930Romania : : : : : : : : 2414 3155 3713Slovenia : : : : : : : : : : :Slovakia : 3 179 3 292 3 125 3 583 3 837 4 582 4 945 5 706 6 374 7 040F<strong>in</strong>land 23 883 24 005 24 944 25 739 27 398 28 555 29 916 30 978 31 988 33 290 34 080Sweden : : : : 31621 30467 31164 32177 33620 34049 35084United K<strong>in</strong>gdom : : 29 370 32 269 37 677 39 233 40 553 38 793 41 253 42 866 44 496Croatia : : : : : : : 8491 9036 9634 :Iceland : : : 32311 37639 34101 36764 : : : :Norway : : 31 456 33 741 36 202 38 604 43 736 42 882 42 224 45 485 47 221Switzerland 42 194 : 40 727 : 43 683 : 48 498 : 45 760 : 46 058(1) EA-13 <strong>in</strong>stead of EA-15.(2) Break <strong>in</strong> series, 2000.Source: <strong>Eurostat</strong> (tps00175)100 EUROPE IN FIGURES — <strong>Eurostat</strong> <strong>yearbook</strong> <strong>2009</strong>
Economy 2Figure 2.21: Earn<strong>in</strong>gs <strong>in</strong> <strong>in</strong>dustry and services (average gross annual earn<strong>in</strong>gs of full-timeemployees <strong>in</strong> enterprises <strong>with</strong> 10 or more employees), 2006 (1)(EUR)50 00040 00030 00020 00010 0000EU-27 (2)Euro area (3)DenmarkUnited K<strong>in</strong>gdomLuxembourgGermanyIreland (3)Netherlands (3)BelgiumAustriaSwedenF<strong>in</strong>landFrance (3)CyprusSpa<strong>in</strong>Greece (4)PortugalMaltaCzech RepublicHungarySlovakiaPoland (3)LatviaRomaniaBulgariaNorway(1) Estonia, Italy, Lithuania and Slovenia, not available.(2) EA-13 <strong>in</strong>stead of EA-15, 2005.(3) 2005.(4) 2003.Source: <strong>Eurostat</strong> (tps00175)SwitzerlandCroatia (3)Table 2.10: M<strong>in</strong>imum wage(EUR/month, as of 1 January)1998 1999 2000 2001 2002 2003 2004 2005 2006 2007 2008Belgium : 1 074 1 096 1 118 1 163 1 163 1 186 1 210 1 234 1 259 1 310Bulgaria : 33 38 44 51 56 61 77 82 92 113Czech Republic : 93 111 144 175 199 207 235 261 288 304Denmark : : : : : : : : : : :Germany : : : : : : : : : : :Estonia : : : : 118 138 159 172 192 230 278Ireland : : 945 945 1 009 1 073 1 073 1 183 1 293 1 403 1 462Greece : 505 526 544 552 605 631 668 668 658 681Spa<strong>in</strong> : 416 425 433 516 526 537 599 631 666 700France : 1 036 1 049 1 083 1 126 1 154 1 173 1 197 1 218 1 254 1 280Italy : : : : : : : : : : :Cyprus : : : : : : : : : : :Latvia : 75 84 89 107 116 121 116 129 172 229Lithuania : 92 106 120 120 125 125 145 159 174 232Luxembourg : 1 162 1 191 1 259 1 290 1 369 1 403 1 467 1 503 1 570 1 570Hungary : 89 100 151 202 212 189 232 247 258 273Malta : 462 500 532 552 534 542 557 580 585 612Netherlands : 1 064 1 092 1 154 1 207 1 249 1 265 1 265 1 273 1 301 1 335Austria : : : : : : : : : : :Poland : 159 159 196 212 201 177 205 234 246 313Portugal : 357 371 390 406 416 426 437 450 470 497Romania : 28 25 44 62 73 69 72 90 114 141Slovenia 335 351 359 387 419 451 471 490 512 522 539Slovakia : : : : 114 133 148 167 183 217 243F<strong>in</strong>land : : : : : : : : : : :Sweden : : : : : : : : : : :United K<strong>in</strong>gdom : 866 970 1 130 1 118 1 106 1 083 1 197 1 269 1 361 1 223Turkey : 217 206 230 171 189 240 240 331 298 354United States : 762 883 995 1 001 877 727 666 753 676 696Source: <strong>Eurostat</strong> (tps00155)EUROPE IN FIGURES — <strong>Eurostat</strong> <strong>yearbook</strong> <strong>2009</strong>101
2 EconomyFigure 2.22: Gender pay gap - female earn<strong>in</strong>gs lower than male earn<strong>in</strong>gs, 2006(% difference between average gross hourly earn<strong>in</strong>gs of male and female employees, as % of male grossearn<strong>in</strong>gs, unadjusted form)2520151050EU-27 (1)Euro area (2)Estonia (3)Cyprus (4)GermanySlovakiaUnited K<strong>in</strong>gdomAustriaF<strong>in</strong>landCzech RepublicNetherlands (3)DenmarkLatviaLithuaniaSwedenBulgariaLuxembourgSpa<strong>in</strong>PolandFrance (4)HungaryGreeceRomaniaIrelandItaly (3)Portugal (4)Slovenia (4)Belgium (4)MaltaSwitzerlandNorwayCroatia (3)(1) Estimate.(2) EA-13 <strong>in</strong>stead of EA-15; estimate for 2005.(3) 2005.(4) Provisional.Source: <strong>Eurostat</strong> (tsiem030)Figure 2.23: Tax rate on low wage earners: tax wedge on labour cost, 2006(%)50403020100EU-27Euro area (1)BelgiumGermanySwedenFranceAustriaHungaryPolandRomaniaItalyLatviaSloveniaLithuaniaNetherlandsCzech RepublicDenmarkF<strong>in</strong>landEstoniaGreeceSpa<strong>in</strong>SlovakiaPortugalBulgariaUnited K<strong>in</strong>gdomLuxembourgMaltaIrelandCyprusTurkeyNorwayUnited StatesSwitzerlandIceland(1) EA-13 <strong>in</strong>stead of EA-15.Source: <strong>Eurostat</strong> (tsiem060), OE<strong>CD</strong>, Commission services102 EUROPE IN FIGURES — <strong>Eurostat</strong> <strong>yearbook</strong> <strong>2009</strong>
Economy 2Figure 2.24: Labour costs (average hourly labour costs <strong>in</strong> <strong>in</strong>dustry and services of full-timeemployees <strong>in</strong> enterprises <strong>with</strong> 10 or more employees), 2006 (1)(EUR)403020100EU-27 (2)Euro area (3)DenmarkSwedenLuxembourgBelgiumFranceGermanyNetherlands (2)F<strong>in</strong>landAustriaUnited K<strong>in</strong>gdom (2)Italy (4)Spa<strong>in</strong>Greece (5)CyprusSloveniaPortugalMaltaCzech RepublicHungaryPolandEstoniaSlovakiaLithuaniaLatviaRomaniaBulgariaSwitzerlandIceland(1) Ireland, not available.(2) 2005.(3) EA-13 <strong>in</strong>stead of EA-15, 2005.(4) 2004.(5) 2003.Source: <strong>Eurostat</strong> (tps00173)Figure 2.25: Breakdown of labour costs, bus<strong>in</strong>ess economy, 2006 (1)(% share of total labour costs)100%75%50%25%0%BelgiumBulgariaCzech RepublicDenmarkGermanyEstoniaGreece (2)Spa<strong>in</strong>FranceItaly (3)CyprusLatviaLithuaniaLuxembourgHungaryMaltaNetherlands (4)AustriaPoland (4)PortugalOther labour costsSocial security paid by employerWages and salariesRomaniaSloveniaSlovakiaF<strong>in</strong>landSwedenUnited K<strong>in</strong>gdom (4)IcelandSwitzerland(1) Ireland, not available.(2) 2003.(3) 2002.(4) 2005.Source: <strong>Eurostat</strong> (tps00115, tps00114 and tps00113)EUROPE IN FIGURES — <strong>Eurostat</strong> <strong>yearbook</strong> <strong>2009</strong>103
2 Economy2.5 Consumer prices andcomparative price levelsIntroductionChanges <strong>in</strong> the price of consumer goodsand services are usually referred to asthe <strong>in</strong>flation rate. They measure the lossof liv<strong>in</strong>g standards due to price <strong>in</strong>flationand are some of the most well-knowneconomic statistics.Price stability is one of the ma<strong>in</strong> objectivesof the <strong>Europe</strong>an Central Bank (ECB),<strong>with</strong> the <strong>in</strong>flation rate used as a prime <strong>in</strong>dicatorfor monetary policy management<strong>in</strong> the euro area. The ECB has def<strong>in</strong>edprice stability as an annual <strong>in</strong>crease <strong>in</strong>the harmonised <strong>in</strong>dex of consumer prices(HICP) for the euro area of below, butclose to, 2 % (over the medium-term).HICPs are economic <strong>in</strong>dicators constructedto measure, over time, the change <strong>in</strong>prices of consumer goods and servicesthat are acquired by households. HICPsgive comparable measures of <strong>in</strong>flation <strong>in</strong>the euro area, the <strong>Europe</strong>an Union, the<strong>Europe</strong>an Economic Area, as well as for<strong>in</strong>dividual countries. They are calculatedaccord<strong>in</strong>g to a harmonised approach anda s<strong>in</strong>gle set of def<strong>in</strong>itions, provid<strong>in</strong>g anofficial measure of consumer price <strong>in</strong>flationfor the purposes of monetary policyand assess<strong>in</strong>g <strong>in</strong>flation convergence as requiredunder the Maastricht criteria.A comparison of price changes betweencountries depends not only on movements<strong>in</strong> price levels, but also exchangerates – together these two forces impactupon price and cost competitiveness of<strong>in</strong>dividual Member States.With the <strong>in</strong>troduction of the euro, prices<strong>with</strong><strong>in</strong> those Member States that sharea common currency are said to be moretransparent, as it is relatively simple forconsumers to compare the price of itemsacross borders. Such comparisons thatprovide an economic case for purchas<strong>in</strong>ga good or service from another countryhave led to an <strong>in</strong>crease <strong>in</strong> cross-bordertrade. From an economic po<strong>in</strong>t of view,the price of a given good <strong>with</strong><strong>in</strong> the s<strong>in</strong>glemarket should not differ significantlydepend<strong>in</strong>g on geographic location, beyonddifferences that may be expla<strong>in</strong>edby transport costs or tax differences.However, not all goods and servicesconverge at the same pace. For example,price convergence <strong>in</strong> hous<strong>in</strong>g does notnecessarily follow the same pace as fortradable goods. Indeed, even <strong>with</strong><strong>in</strong> <strong>in</strong>dividualcountries there are large (and perhapsgrow<strong>in</strong>g) discrepancies <strong>in</strong> the priceof hous<strong>in</strong>g for rent or for sale betweenregions.Def<strong>in</strong>itions and data availabilityThe <strong>in</strong>flation rate is calculated from harmonised<strong>in</strong>dices of consumer prices – itequates to the all-items harmonised <strong>in</strong>dexof consumer prices. Harmonised<strong>in</strong>dices of consumer prices (HICPs) arepresented <strong>with</strong> a common reference year,which is currently 2005=100. Normallythe <strong>in</strong>dices are used to create percentagechanges that show price <strong>in</strong>creases/decreases for the period <strong>in</strong> question.Although the rates of change shown <strong>in</strong>this publication are annual averages, thebasic <strong>in</strong>dices are compiled on a monthlybasis and are published at this frequencyby <strong>Eurostat</strong>. <strong>Eurostat</strong> publishes HICPssome 14 to 16 days after the end of the report<strong>in</strong>gmonth, <strong>with</strong> these series start<strong>in</strong>g<strong>in</strong> the mid-1990s.104 EUROPE IN FIGURES — <strong>Eurostat</strong> <strong>yearbook</strong> <strong>2009</strong>
Economy 2HICPs cover practically every good andservice that may be purchased by households<strong>in</strong> the form of f<strong>in</strong>al monetary consumptionexpenditure. Owner occupiedhous<strong>in</strong>g is, however, not yet reflected<strong>in</strong> the HICPs. The different goods andservices are classified accord<strong>in</strong>g to an<strong>in</strong>ternational classification of <strong>in</strong>dividualconsumption by purpose, known asCOICOP/HICP. At its most disaggregatedlevel, <strong>Eurostat</strong> publishes around 100 sub<strong>in</strong>dices,which can be aggregated to broadcategories of goods and services. In orderto improve the comparability and reliabilityof HICPs, sampl<strong>in</strong>g, replacementand quality adjustment procedures areperiodically reviewed, the latest changesbe<strong>in</strong>g set out <strong>in</strong> Commission Regulation(EC) No 1334/2007 of 14 November 2007.There are three key HICP aggregate <strong>in</strong>dices:the monetary union <strong>in</strong>dex of consumerprices (MUICP) for the euro area;the <strong>Europe</strong>an <strong>in</strong>dex of consumer prices(EICP) cover<strong>in</strong>g all Member States; andthe <strong>Europe</strong>an Economic Area <strong>in</strong>dex ofconsumer prices (EEAICP), which additionallycovers Iceland and Norway.Note that these aggregates reflect changesover time <strong>in</strong> their country compositionthrough the use of a cha<strong>in</strong> <strong>in</strong>dex formula– for example, the MUICP <strong>in</strong>cludesSlovenia only from 2007 onwards, whilethe EICP <strong>in</strong>dex only <strong>in</strong>cludes Bulgariaand Romania from 2007 onwards.Purchas<strong>in</strong>g power parities (PPPs) estimateprice-level differences betweencountries. They make it possible to producemean<strong>in</strong>gful volume or price-level<strong>in</strong>dicators required for cross-countrycomparisons. PPPs are aggregated priceratios calculated from price comparisonsover a large number of goods and services.PPPs are employed either:• as currency converters to generatevolume measures <strong>with</strong> which to comparelevels of economic performance,total consumption, <strong>in</strong>vestment, overallproductivity and selected privatehousehold expenditures;• or as price measures <strong>with</strong> which tocompare relative price levels, priceconvergence and competitiveness.<strong>Eurostat</strong> produces three sets of data us<strong>in</strong>gPPPs:• levels and <strong>in</strong>dices of real f<strong>in</strong>al expenditure– these are measures of volume;they <strong>in</strong>dicate the relative magnitudesof the product groups or aggregatesbe<strong>in</strong>g compared; at the level of GDP,they are used to compare the economicsize of countries;• levels and <strong>in</strong>dices of real f<strong>in</strong>al expenditureper head – these are standardisedmeasures of volume; they <strong>in</strong>dicate therelative levels of the product groupsor aggregates be<strong>in</strong>g compared afteradjust<strong>in</strong>g for differences <strong>in</strong> the size ofpopulations between countries; at thelevel of GDP, they are often used tocompare the economic well-be<strong>in</strong>g ofpopulations;• comparative price levels – these arethe ratios of PPPs to exchange rates;these <strong>in</strong>dices provide a comparisonof the countries’ price levels <strong>with</strong> respectto the EU average – if the pricelevel <strong>in</strong>dex is higher than 100, thecountry concerned is relatively expensivecompared <strong>with</strong> the EU averageand vice versa; at the level of GDP,they provide a measure of the differences<strong>in</strong> the general price levels ofcountries.EUROPE IN FIGURES — <strong>Eurostat</strong> <strong>yearbook</strong> <strong>2009</strong>105
2 EconomyThe coefficient of variation of comparativeprice levels is applied as an <strong>in</strong>dicatorof price convergence among EU MemberStates – if the coefficient of variation forcomparative price levels for the EU decreases/<strong>in</strong>creasesover time, the nationalprice levels <strong>in</strong> the Member States areconverg<strong>in</strong>g/diverg<strong>in</strong>g.The real effective exchange rate is deflatedby nom<strong>in</strong>al unit labour costs. Thisrelative price and cost <strong>in</strong>dicator aims toassess a country’s competitiveness relativeto its pr<strong>in</strong>cipal competitors <strong>in</strong> <strong>in</strong>ternationalmarkets, <strong>with</strong> changes <strong>in</strong> costand price competitiveness depend<strong>in</strong>gnot only on exchange rate movementsbut also on price trends. Double exportweights are used to calculate the <strong>in</strong>dex,reflect<strong>in</strong>g not only competition <strong>in</strong> thehome markets of the various competitors,but also competition <strong>in</strong> export marketselsewhere. A rise <strong>in</strong> the <strong>in</strong>dex means aloss of competitiveness.Ma<strong>in</strong> f<strong>in</strong>d<strong>in</strong>gsCompared <strong>with</strong> historical trends, consumerprice <strong>in</strong>dices have risen only at amoderate pace dur<strong>in</strong>g the last two decades.The EU <strong>in</strong>flation rate decreaseddur<strong>in</strong>g the 1990s, reach<strong>in</strong>g 1.2 % by 1999,after which the pace of price <strong>in</strong>creasessettled at around 2 % per annum dur<strong>in</strong>gthe period 2000 to 2007. This pattern wasquite similar to the evolution of <strong>in</strong>flation<strong>in</strong> the United States, while Japan has beencharacterised by exceptionally low <strong>in</strong>flation– often deflation (<strong>in</strong> other words fall<strong>in</strong>gprices) dur<strong>in</strong>g the last decade.In 2007, the highest rates of price <strong>in</strong>flationamong the EU-27 Member Stateswere recorded <strong>in</strong> Latvia (10.1 %), Hungary(7.9 %), Bulgaria (7.6 %) and Estonia(6.7 %). In general, <strong>in</strong>flation was oftensomewhat higher than the EU averageamong those Member States that jo<strong>in</strong>edthe EU s<strong>in</strong>ce 2004.106 EUROPE IN FIGURES — <strong>Eurostat</strong> <strong>yearbook</strong> <strong>2009</strong>
Economy 2Among the constituent price <strong>in</strong>dices fordifferent goods and services, the averageprice of education rose sharpest (8.6 %)<strong>in</strong> the EU. There was also a relativelystrong price rise for alcoholic dr<strong>in</strong>ks andtobacco (3.8 %), largely reflect<strong>in</strong>g changes<strong>in</strong> duties. The cont<strong>in</strong>ued rise <strong>in</strong> the priceof oil and gas was often a factor beh<strong>in</strong>dhigher prices, particularly for hous<strong>in</strong>g,water, electricity, gas and other fuels(3.3 %) and transport (2.5 %). Strongdemand for staple foods (particularlyfrom Asia) was a key factor beh<strong>in</strong>d therelatively strong price <strong>in</strong>creases for foodand non-alcoholic beverages (3.5 %). Incontrast, the price of cloth<strong>in</strong>g and footwear,as well as recreation and culturerema<strong>in</strong>ed almost unchanged, and the averageprice of communications decl<strong>in</strong>ed(-2.0 %), reflect<strong>in</strong>g technology ga<strong>in</strong>s and<strong>in</strong>creased competition.The relative price levels of private householdconsumption vary significantlybetween the Member States. With theaverage for the EU-27 be<strong>in</strong>g def<strong>in</strong>ed as100, comparative price levels <strong>with</strong><strong>in</strong> theMember States ranged <strong>in</strong> 2007 from 46.0<strong>in</strong> Bulgaria to 136.9 <strong>in</strong> Denmark.Nevertheless, over the decade between1997 and 2007, there was a convergenceof prices; the coefficient of variation ofcomparative price levels decl<strong>in</strong>ed from37.8 % <strong>in</strong> 1997 to 26.2 % by 2007. Thepace at which price convergence tookplace slowed somewhat from 2000, butaccelerated aga<strong>in</strong> after 2003.Figure 2.26: HICP all-items, annual average <strong>in</strong>flation rates(%)43210-1-21997 1998 1999 2000 2001 2002 2003 2004 2005 2006 2007EU (1)Euro area (2)United States (3)Japan (3)(1) The data refer to the official EU aggregate, its country coverage changes <strong>in</strong> l<strong>in</strong>e <strong>with</strong> the addition of new EU Member States and<strong>in</strong>tegrates them us<strong>in</strong>g a cha<strong>in</strong> <strong>in</strong>dex formula; 1996, not available; 1997-1999, estimates.(2) The data refer to the official euro area aggregate, its country coverage changes <strong>in</strong> l<strong>in</strong>e <strong>with</strong> the addition of new EU Member Statesand <strong>in</strong>tegrates them us<strong>in</strong>g a cha<strong>in</strong> <strong>in</strong>dex formula.; 1996, not available; 1997, estimate.(3) National CPI: not strictly comparable <strong>with</strong> the HICP.Source: <strong>Eurostat</strong> (tsieb060)EUROPE IN FIGURES — <strong>Eurostat</strong> <strong>yearbook</strong> <strong>2009</strong>107
2 EconomyTable 2.11: HICP all-items, annual average <strong>in</strong>flation rates(%)1997 1998 1999 2000 2001 2002 2003 2004 2005 2006 2007EU (1) 1.7 1.3 1.2 1.9 2.2 2.1 2.0 2.0 2.2 2.2 2.3Euro area (2) 1.6 1.1 1.1 2.1 2.3 2.2 2.1 2.1 2.2 2.2 2.1Belgium 1.5 0.9 1.1 2.7 2.4 1.6 1.5 1.9 2.5 2.3 1.8Bulgaria : 18.7 2.6 10.3 7.4 5.8 2.3 6.1 6.0 7.4 7.6Czech Republic 8.0 9.7 1.8 3.9 4.5 1.4 -0.1 2.6 1.6 2.1 3.0Denmark 2.0 1.3 2.1 2.7 2.3 2.4 2.0 0.9 1.7 1.9 1.7Germany 1.5 0.6 0.6 1.4 1.9 1.4 1.0 1.8 1.9 1.8 2.3Estonia 9.3 8.8 3.1 3.9 5.6 3.6 1.4 3.0 4.1 4.4 6.7Ireland 1.3 2.1 2.5 5.3 4.0 4.7 4.0 2.3 2.2 2.7 2.9Greece 5.4 4.5 2.1 2.9 3.7 3.9 3.4 3.0 3.5 3.3 3.0Spa<strong>in</strong> 1.9 1.8 2.2 3.5 2.8 3.6 3.1 3.1 3.4 3.6 2.8France 1.3 0.7 0.6 1.8 1.8 1.9 2.2 2.3 1.9 1.9 1.6Italy 1.9 2.0 1.7 2.6 2.3 2.6 2.8 2.3 2.2 2.2 2.0Cyprus 3.3 2.3 1.1 4.9 2.0 2.8 4.0 1.9 2.0 2.2 2.2Latvia 8.1 4.3 2.1 2.6 2.5 2.0 2.9 6.2 6.9 6.6 10.1Lithuania 10.3 5.4 1.5 1.1 1.6 0.3 -1.1 1.2 2.7 3.8 5.8Luxembourg 1.4 1.0 1.0 3.8 2.4 2.1 2.5 3.2 3.8 3.0 2.7Hungary 18.5 14.2 10.0 10.0 9.1 5.2 4.7 6.8 3.5 4.0 7.9Malta 3.9 3.7 2.3 3.0 2.5 2.6 1.9 2.7 2.5 2.6 0.7Netherlands 1.9 1.8 2.0 2.3 5.1 3.9 2.2 1.4 1.5 1.7 1.6Austria 1.2 0.8 0.5 2.0 2.3 1.7 1.3 2.0 2.1 1.7 2.2Poland 15.0 11.8 7.2 10.1 5.3 1.9 0.7 3.6 2.2 1.3 2.6Portugal 1.9 2.2 2.2 2.8 4.4 3.7 3.3 2.5 2.1 3.0 2.4Romania 154.8 59.1 45.8 45.7 34.5 22.5 15.3 11.9 9.1 6.6 4.9Slovenia 8.3 7.9 6.1 8.9 8.6 7.5 5.7 3.7 2.5 2.5 3.8Slovakia 6.0 6.7 10.4 12.2 7.2 3.5 8.4 7.5 2.8 4.3 1.9F<strong>in</strong>land 1.2 1.3 1.3 2.9 2.7 2.0 1.3 0.1 0.8 1.3 1.6Sweden 1.8 1.0 0.5 1.3 2.7 1.9 2.3 1.0 0.8 1.5 1.7United K<strong>in</strong>gdom 1.8 1.6 1.3 0.8 1.2 1.3 1.4 1.3 2.1 2.3 2.3Turkey 85.6 82.1 61.4 53.2 56.8 47.0 25.3 10.1 8.1 9.3 8.8Iceland 1.8 1.3 2.1 4.4 6.6 5.3 1.4 2.3 1.4 4.6 3.6Norway 2.6 2.0 2.1 3.0 2.7 0.8 2.0 0.6 1.5 2.5 0.7Switzerland : : : : : : : : : 1.0 0.8Japan (3) 1.8 0.6 -0.3 -0.7 -0.7 -0.9 -0.3 0.0 -0.3 0.3 0.0United States (3) 2.3 1.6 2.2 3.4 2.8 1.6 2.3 2.7 3.4 3.2 2.8(1) The data refer to the official EU aggregate, its country coverage changes <strong>in</strong> l<strong>in</strong>e <strong>with</strong> the addition of new EU Member States and<strong>in</strong>tegrates them us<strong>in</strong>g a cha<strong>in</strong> <strong>in</strong>dex formula.(2) The data refer to the official euro area aggregate, its country coverage changes <strong>in</strong> l<strong>in</strong>e <strong>with</strong> the addition of new EU Member Statesand <strong>in</strong>tegrates them us<strong>in</strong>g a cha<strong>in</strong> <strong>in</strong>dex formula.(3) National CPI: not strictly comparable <strong>with</strong> the HICP.Source: <strong>Eurostat</strong> (tsieb060)108 EUROPE IN FIGURES — <strong>Eurostat</strong> <strong>yearbook</strong> <strong>2009</strong>
Economy 2Table 2.12: Comparative price levels (1)(f<strong>in</strong>al consumption by private households <strong>in</strong>clud<strong>in</strong>g <strong>in</strong>direct taxes, EU-27=100)1996 1997 1998 1999 2000 2001 2002 2003 2004 2005 2006EU-27 100.0 100.0 100.0 100.0 100.0 100.0 100.0 100.0 100.0 100.0 100.0Euro area (2) 104.0 102.8 102.2 100.5 101.0 101.1 103.5 103.6 102.5 102.5 102.0Belgium 105.8 107.5 106.8 102.0 103.2 101.5 106.5 106.7 106.0 106.2 105.4Bulgaria 34.0 37.5 37.9 38.7 41.0 40.8 40.7 42.0 43.1 44.8 46.0Czech Republic 44.4 47.4 46.4 48.1 50.0 57.1 54.5 55.4 58.4 61.5 62.6Denmark 131.6 129.4 131.5 130.3 135.2 133.8 141.1 139.6 139.6 139.2 136.9Germany 109.6 108.7 107.3 106.6 107.0 106.6 106.1 104.7 103.7 103.3 103.2Estonia 50.8 54.1 56.9 57.3 61.1 60.8 62.0 63.0 64.6 66.5 71.3Ireland 113.0 108.1 111.6 114.9 119.3 125.2 126.4 125.9 124.8 124.9 126.0Greece 87.6 85.7 88.3 84.8 82.3 80.2 85.9 87.6 88.4 89.1 88.6Spa<strong>in</strong> 86.9 85.5 86.0 85.0 85.4 84.6 88.3 91.0 92.0 93.3 93.0France 112.0 110.7 109.3 105.9 104.1 103.5 110.0 109.9 107.4 107.3 106.7Italy 99.7 97.9 98.2 97.5 99.7 102.7 103.6 104.9 104.0 104.1 102.9Cyprus 86.6 87.1 87.4 88.1 88.9 89.1 90.9 91.2 89.7 90.1 87.7Latvia 47.8 49.2 52.3 58.8 59.0 57.0 54.4 56.1 57.1 60.6 65.0Lithuania 43.2 45.6 46.8 52.7 54.1 54.2 52.3 53.5 55.1 56.6 59.7Luxembourg 106.6 104.2 102.9 101.5 103.5 102.1 103.2 103.0 102.7 103.2 105.1Hungary 46.4 45.7 47.1 49.2 52.9 57.4 58.2 62.0 63.5 60.0 65.7Malta 68.7 69.4 70.5 73.3 74.8 74.6 72.0 73.2 73.1 73.4 73.2Netherlands 103.4 102.1 102.7 100.0 103.0 102.9 107.8 106.1 104.5 103.9 103.1Austria 107.1 105.3 104.9 101.9 104.8 103.4 103.3 103.3 101.9 101.2 100.0Poland 51.8 53.5 51.9 57.9 64.8 61.2 54.4 53.2 61.3 62.1 63.4Portugal 82.5 84.0 83.4 83.0 84.4 86.3 86.0 87.4 85.3 85.7 84.6Romania 34.7 43.2 37.9 42.5 41.7 43.0 43.4 43.3 54.3 57.0 64.7Slovenia 72.4 74.1 74.1 72.9 73.9 74.4 76.2 75.5 75.8 75.3 76.9Slovakia 41.6 41.9 40.5 44.4 43.4 44.8 50.7 54.9 55.8 58.3 63.0F<strong>in</strong>land 125.0 123.0 122.3 120.9 124.8 123.9 126.6 123.8 123.3 121.7 121.4Sweden 131.6 127.0 126.4 127.6 119.9 121.7 123.5 121.4 117.9 117.5 116.4United K<strong>in</strong>gdom 107.6 112.2 115.6 120.0 116.8 117.1 107.8 108.5 110.2 110.8 112.3Croatia : : : : : : 64.8 66.5 69.0 69.9 69.5FYR of Macedonia : : : : : : 43.9 44.4 44.0 44.5 43.0Turkey : : 56.0 62.5 47.7 51.6 57.2 59.1 68.4 68.4 72.2Iceland 120.8 124.7 126.7 144.0 127.9 134.6 138.4 137.9 152.3 141.7 146.0Norway 136.6 131.0 134.3 137.7 141.8 151.2 142.1 135.2 140.0 139.8 137.5Switzerland 135.8 136.4 139.7 142.6 146.3 146.7 143.8 140.8 137.9 134.2 125.7Japan 158.8 146.9 173.1 198.4 177.7 156.3 136.5 129.5 119.6 109.1 :United States 100.0 100.6 105.6 121.0 126.1 119.7 101.4 92.8 92.0 91.6 :(1) Belgium and France, break <strong>in</strong> the series for 2003.(2) EA-13 <strong>in</strong>stead of EA-15.Source: <strong>Eurostat</strong> (tsier010)EUROPE IN FIGURES — <strong>Eurostat</strong> <strong>yearbook</strong> <strong>2009</strong>109
2 EconomyFigure 2.27: HICP ma<strong>in</strong> head<strong>in</strong>gs, annual average <strong>in</strong>flation rates, EU, 2007(%)All-items HICP (1)EducationAlcoholic beverages, tobacco and narcoticsFood and non-alcoholic beveragesRestaurants and hotelsHous<strong>in</strong>g, water, electricity, gas and other fuelsTransportMiscellaneous goods and servicesHealthFurnish<strong>in</strong>gs, household equipment & rout<strong>in</strong>e ma<strong>in</strong>tenanceCloth<strong>in</strong>g and footwearRecreation and cultureCommunications(1) More commonly referred to as the <strong>in</strong>flation rate.Source: <strong>Eurostat</strong> (prc_hicp_a<strong>in</strong>d)-4 -2 0 2 4 6 8 10Figure 2.28: Price convergence between EU Member States(%, coefficient of variation of comparative price levels of f<strong>in</strong>al consumption by private households <strong>in</strong>clud<strong>in</strong>g<strong>in</strong>direct taxes)504030201001996 1997 1998 1999 2000 2001 2002 2003 2004 2005 2006 2007EU-27Euro area (1)(1) EA-13 <strong>in</strong>stead of EA-15.Source: <strong>Eurostat</strong> (tsier020)110 EUROPE IN FIGURES — <strong>Eurostat</strong> <strong>yearbook</strong> <strong>2009</strong>
Economy 22.6 Balance of payments –current accountIntroductionThe balance of payments is a statisticalstatement that summarises the transactionsof an economy <strong>with</strong> the rest of theworld. Transactions are organised <strong>in</strong>two different accounts, the current accountand the capital and f<strong>in</strong>ancial account,whose sum, <strong>in</strong> pr<strong>in</strong>ciple, should bezero, as for each credit transaction thereis a correspond<strong>in</strong>g one on the debit side.Thus, the current account balance determ<strong>in</strong>esthe exposure of an economy vis-àvisthe rest of the world, whereas the capitaland f<strong>in</strong>ancial account expla<strong>in</strong>s how itis f<strong>in</strong>anced.Def<strong>in</strong>itions and data availabilityThe current account gauges a country’seconomic position <strong>in</strong> the world, cover<strong>in</strong>gall transactions that occur between residentand non-resident entities and referto trade <strong>in</strong> goods and services, <strong>in</strong>comeand current transfers. More specifically,the four ma<strong>in</strong> components of the currentaccount are def<strong>in</strong>ed as follows:• Trade <strong>in</strong> goods covers general merchandise,goods for process<strong>in</strong>g, repairson goods, goods procured <strong>in</strong>ports by carriers, and non-monetarygold. Exports and imports of goodsare recorded on a fob/fob basis, i.e. atmarket value at the customs frontiersof export<strong>in</strong>g economies, <strong>in</strong>clud<strong>in</strong>gcharges for <strong>in</strong>surance and transportservices up to the frontier of the export<strong>in</strong>gcountry.• Trade <strong>in</strong> services consists of the follow<strong>in</strong>gitems: transportation servicesperformed by EU residents for non-EU residents, or vice versa, <strong>in</strong>volv<strong>in</strong>gthe carriage of passengers, the movementof goods, rentals of carriers <strong>with</strong>crew and related support<strong>in</strong>g and auxiliaryservices; travel, which <strong>in</strong>cludesprimarily the goods and services EUtravellers acquire from non-EU residents,or vice versa; and other services,which <strong>in</strong>clude communicationservices, construction services, <strong>in</strong>suranceservices, f<strong>in</strong>ancial services, computerand <strong>in</strong>formation services, royaltiesand licence fees, other bus<strong>in</strong>essservices (which comprise merchant<strong>in</strong>gand other trade-related services,operational leas<strong>in</strong>g services and miscellaneousbus<strong>in</strong>ess, professional andtechnical services), personal, culturaland recreational services and governmentservices not <strong>in</strong>cluded elsewhere.• Income covers two types of transactions:compensation of employees paidto non-resident workers or receivedfrom non-resident employers, and <strong>in</strong>vestment<strong>in</strong>come accrued on externalf<strong>in</strong>ancial assets and liabilities.• Current transfers <strong>in</strong>clude generalgovernment current transfers, forexample transfers related to <strong>in</strong>ternationalcooperation between governments,payments of current taxes on<strong>in</strong>come and wealth, etc., and othercurrent transfers, for example workers’remittances, <strong>in</strong>surance premiums(less service charges), and claims onnon-life <strong>in</strong>surance companies.EUROPE IN FIGURES — <strong>Eurostat</strong> <strong>yearbook</strong> <strong>2009</strong>111
2 EconomyUnder the balance of payment conventions,transactions which represent an<strong>in</strong>flow of real resources, an <strong>in</strong>crease <strong>in</strong>assets or a decrease <strong>in</strong> liabilities (such as,exports of goods) are recorded as credits,and transactions represent<strong>in</strong>g an outflowof real resources, a decrease <strong>in</strong> assets oran <strong>in</strong>crease <strong>in</strong> liabilities (such as, importsof goods) are recorded as debits.Ma<strong>in</strong> f<strong>in</strong>d<strong>in</strong>gsThe current account deficit of the EU-27was EUR 72 400 million <strong>in</strong> 2007 (correspond<strong>in</strong>gto 0.6 % of GDP), which althoughslightly less than the deficit of2006, nevertheless confirmed the starkturnaround from relatively small surplusesrecorded for the period between 2002and 2004. The overall deficit for 2007comprised deficits <strong>in</strong> the current accountfor goods (-1.2 % of GDP) and for currenttransfers (-0.5 %), as well as positive balancesfor the <strong>in</strong>come account (0.4 %) andfor services (0.7 %).Most of the EU-27’s current accounttransactions <strong>in</strong> 2007 took place <strong>with</strong>the United States (26.7 % of credits and21.7 % of debits). All other partners recordedshares of less than 10 %; the nextmost significant partner was Switzerland(9.1 % credits, 8.4 % debits), and thenCh<strong>in</strong>a (3.9 % and 9.6 %), the RussianFederation (5.1 % and 6.4 %) and Japan(3.7 % and 4.7 %).Accord<strong>in</strong>gly, the EU-27 recorded a surplusof just over EUR 100 000 million visà-visthe United States <strong>in</strong> 2007, but deficits<strong>with</strong> Ch<strong>in</strong>a (EUR 143 100 million),the Russian Federation (EUR 37 000 million)and Japan (EUR 27 200 million).Figure 2.29: Current account transactions, EU-27 (1)(EUR 1 000 million)2 5002 0001 5001 000500250-25-50-7502002 2003 2004 2005 2006 2007-100Balance (right-hand scale)Credits (left-hand scale)Debits (left-hand scale)(1) EU-25: for 2002-2003; 2007, provisional data.Source: <strong>Eurostat</strong> (tec00038)112 EUROPE IN FIGURES — <strong>Eurostat</strong> <strong>yearbook</strong> <strong>2009</strong>
Economy 2Table 2.13: Current account balance for EU Member States <strong>with</strong> the rest of the world(EUR million)2003 2004 2005 2006 2007 (1)EU-27 (2) : 10 300 -19 600 -82 900 -72 400Euro area (3) 33 200 62 000 17 100 -1 700 27 400Belgium 5 600 10 200 7 900 8 400 6 400Bulgaria -1 500 -1 300 -2 700 -4 500 -6 200Czech Republic -5 000 -4 700 -1 800 -3 800 -3 500Denmark 6 500 5 900 9 000 5 900 2 500Germany 44 000 102 900 116 600 141 500 184 200Estonia -1 000 -1 200 -1 100 -2 100 -2 700Ireland 0 -900 -5 700 -7 300 -9 300Greece -11 000 -10 500 -14 000 : :Spa<strong>in</strong> -27 500 -44 200 -66 900 -87 700 -105 800France 7 000 8 500 -15 700 -22 500 -21 900Italy -17 300 -13 000 -23 400 -37 900 -37 900Cyprus -300 -600 -800 -900 -1 500Latvia -800 -1 400 -1 600 -3 600 -4 600Lithuania -1 100 -1 400 -1 500 -2 600 -3 800Luxembourg 2 100 3 300 3 300 3 500 3 600Hungary -5 900 -6 900 -6 000 -5 400 -5 000Malta -100 -300 -400 -400 -300Netherlands 26 200 36 900 36 600 44 500 36 800Austria -500 1 100 2 800 6 300 8 800Poland -4 100 -8 200 -3 000 -7 300 -11 500Portugal -8 500 -10 900 -14 100 -15 700 -15 900Romania -2 900 -5 100 -6 900 -10 200 -17 100Slovenia -200 -700 -600 -900 -1 600Slovakia -200 -1 200 -3 200 -3 600 -3 100F<strong>in</strong>land 7 500 10 000 5 700 7 600 8 200Sweden 19 800 19 200 20 500 26 500 27 900United K<strong>in</strong>gdom -21 300 -28 700 -45 300 -74 500 -85 100(1) Provisional data.(2) EU-25 for 2003; EU vis-à-vis extra-EU.(3) EA-13 <strong>in</strong>stead of EA-15; euro area vis-à-vis extra euro area.Source: <strong>Eurostat</strong> (tec00038)EUROPE IN FIGURES — <strong>Eurostat</strong> <strong>yearbook</strong> <strong>2009</strong>113
2 EconomyTable 2.14: Current account, balance by components, 2007(% of GDP)Currentaccount Goods Services IncomeCurrenttransfersEU-27 -0.6 -1.2 0.7 0.4 -0.5Euro area (1) 0.3 0.7 0.5 0.0 -0.9Belgium 1.9 0.2 1.5 2.0 -1.7Bulgaria -21.5 -25.6 3.8 -1.0 1.0Czech Republic -2.7 3.1 1.6 -7.2 -0.2Denmark 1.1 -0.4 2.4 0.7 -1.6Germany 7.6 8.4 -1.3 1.7 -1.3Estonia -17.7 -17.0 6.5 -7.2 0.0Ireland -5.0 12.3 -2.2 -14.5 -0.7Greece : : : : :Spa<strong>in</strong> -10.1 -8.5 2.1 -3.0 -0.6France -1.2 -2.0 0.5 1.6 -1.2Italy -2.5 0.1 -0.4 -1.3 -0.9Cyprus -9.6 -29.4 23.7 -3.8 0.0Latvia -23.1 -24.6 3.5 -3.5 1.5Lithuania -13.6 -14.6 2.1 -4.3 2.9Luxembourg 10.0 -9.4 53.7 -29.6 -4.7Hungary -4.9 1.4 1.1 -7.7 0.3Malta -5.5 -16.6 14.8 -1.8 -1.8Netherlands 6.5 6.8 0.3 1.1 -1.6Austria 3.2 0.5 4.5 -1.4 -0.4Poland -3.7 -3.7 0.9 -3.0 2.0Portugal -9.8 -10.7 3.8 -4.5 1.6Romania -14.1 -14.6 0.2 -3.8 4.0Slovenia -4.8 -5.1 3.0 -2.1 -0.9Slovakia -5.7 -1.5 0.7 -4.4 -0.5F<strong>in</strong>land 4.6 4.8 -0.1 0.6 -0.8Sweden 8.4 4.1 3.1 2.2 -1.1United K<strong>in</strong>gdom -4.2 -6.3 2.8 0.4 -1.0(1) EA-13 <strong>in</strong>stead of EA-15.Source: <strong>Eurostat</strong> (tec00038, tec00039, tec00040, tec00041, tec00042 and tec00001)Figure 2.30: Current account, credit by partner country, EU-27, 2007 (1)(% of total credits)India1.8%Hong Kong1.9%Canada2.3%Ch<strong>in</strong>a(exclud<strong>in</strong>g Hong Kong)3.9%Brazil1.7%Other extra EU-27countries43.9%Japan3.7%RussianFederation5.1%Switzerland9.1% United States26.7%(1) Figures do not sum to 100 % due to round<strong>in</strong>g.Source: <strong>Eurostat</strong> (bop_q_eu)114 EUROPE IN FIGURES — <strong>Eurostat</strong> <strong>yearbook</strong> <strong>2009</strong>
Economy 2Figure 2.31: Current account, debit by partner country, EU-27, 2007 (1)(% of total debits)Brazil1.6%Hong Kong1.6%Canada1.7%Japan4.7%RussianFederation6.4%India1.5%Switzerland8.4%Ch<strong>in</strong>a(exclud<strong>in</strong>g Hong Kong)9.6%Other extra EU-27countries42.9%United States21.7%(1) Figures do not sum to 100 % due to round<strong>in</strong>g.Source: <strong>Eurostat</strong> (bop_q_eu)Figure 2.32: Current account balance <strong>with</strong> selected partners, EU-27, 2007(EUR 1 000 million)12080400-40-80-120-160ExtraEU-27UnitedStatesCanadaSwitzerlandHongKongIndia Brazil Japan RussianFederationCh<strong>in</strong>a(excl.HongKong)OtherextraEU-27countriesSource: <strong>Eurostat</strong> (bop_q_eu)EUROPE IN FIGURES — <strong>Eurostat</strong> <strong>yearbook</strong> <strong>2009</strong>115
2 Economy2.7 Balance of payments –foreign direct <strong>in</strong>vestmentIntroductionIn a world of <strong>in</strong>creas<strong>in</strong>g globalisation,where political, economic and technologicalbarriers are rapidly disappear<strong>in</strong>g,the ability of a country to participate <strong>in</strong>global activity is an important <strong>in</strong>dicatorof its performance and competitiveness.In order to rema<strong>in</strong> competitive, modernday bus<strong>in</strong>ess relationships extend wellbeyond the traditional foreign exchangeof goods and services, as witnessed by the<strong>in</strong>creas<strong>in</strong>g reliance of firms on mergers,partnerships, jo<strong>in</strong>t ventures, licens<strong>in</strong>gagreements, and other forms of bus<strong>in</strong>esscooperation.External trade may be complemented orsubstituted by produc<strong>in</strong>g (and often sell<strong>in</strong>g)goods and services <strong>in</strong> countries otherthan where an enterprise was first established:this approach is known as foreigndirect <strong>in</strong>vestment (FDI), whereby theenterprise concerned either <strong>in</strong>vests to establisha new plant/office, or alternatively,purchases exist<strong>in</strong>g assets of a foreign enterprise.FDI is a type of <strong>in</strong>ternational <strong>in</strong>vestmentwhere an entity that is resident<strong>in</strong> one economy (the direct <strong>in</strong>vestor) acquiresa last<strong>in</strong>g <strong>in</strong>terest (at least 10 % ofthe vot<strong>in</strong>g power) <strong>in</strong> an enterprise operat<strong>in</strong>g<strong>in</strong> another economy. The last<strong>in</strong>g <strong>in</strong>terestimplies the existence of a long-termrelationship between the direct <strong>in</strong>vestorand the enterprise, and a significant degreeof <strong>in</strong>fluence by the <strong>in</strong>vestor on themanagement of the enterprise.Conventional trade is less important forservices than for goods and while trade<strong>in</strong> services has been grow<strong>in</strong>g, the shareof services <strong>in</strong> total <strong>in</strong>tra-EU trade haschanged little dur<strong>in</strong>g the last decade.However, FDI is expand<strong>in</strong>g more rapidlyfor services than for goods, as FDI<strong>in</strong> services has <strong>in</strong>creased at a more rapidpace than conventional trade <strong>in</strong> services.As a result, the share of services <strong>in</strong> totalFDI flows and positions has <strong>in</strong>creasedsubstantially, <strong>with</strong> <strong>Europe</strong>an services becom<strong>in</strong>g<strong>in</strong>creas<strong>in</strong>gly <strong>in</strong>ternational.Def<strong>in</strong>itions and data availabilityFormally def<strong>in</strong>ed, a direct <strong>in</strong>vestmententerprise is an un<strong>in</strong>corporated or <strong>in</strong>corporatedenterprise <strong>in</strong> which a direct <strong>in</strong>vestorowns 10 % or more of the ord<strong>in</strong>aryshares or vot<strong>in</strong>g power (for an <strong>in</strong>corporatedenterprise) or the equivalent (for anun<strong>in</strong>corporated enterprise).FDI statistics for the EU give a detailedpresentation of FDI flows and stocks,show<strong>in</strong>g which Member States <strong>in</strong>vest <strong>in</strong>which countries and sectors. <strong>Eurostat</strong>collects FDI statistics for quarterly andannual flows, as well as for stocks at theend of the year. FDI stocks (assets and liabilities)are part of the <strong>in</strong>ternational <strong>in</strong>vestmentposition of an economy at theend of the year.Outward flows and stocks of FDI (orFDI abroad) report <strong>in</strong>vestment by entitiesresident <strong>in</strong> the report<strong>in</strong>g economy <strong>in</strong>an affiliated enterprise abroad. Inwardflows and stocks of FDI report <strong>in</strong>vestmentby foreigners <strong>in</strong> enterprises resident<strong>in</strong> the report<strong>in</strong>g economy. FDI flows arenew <strong>in</strong>vestment made dur<strong>in</strong>g the referenceperiod, whereas FDI stocks provide116 EUROPE IN FIGURES — <strong>Eurostat</strong> <strong>yearbook</strong> <strong>2009</strong>
Economy 2<strong>in</strong>formation on the position, <strong>in</strong> terms ofvalue, of all previous <strong>in</strong>vestments at theend of the reference period.The <strong>in</strong>tensity of FDI can be measured byaverag<strong>in</strong>g the value of <strong>in</strong>ward and outwardflows dur<strong>in</strong>g a particular referenceperiod and express<strong>in</strong>g this <strong>in</strong> relation toGDP.The f<strong>in</strong>ancial account of the balanceof payments (BoP) records all f<strong>in</strong>ancialtransactions; it <strong>in</strong>cludes foreign direct<strong>in</strong>vestment, portfolio <strong>in</strong>vestment, other<strong>in</strong>vestment and reserve asset flows. Thereare two k<strong>in</strong>ds of FDI:• the creation of productive assets byforeigners (greenfield <strong>in</strong>vestment);• the purchase of exist<strong>in</strong>g assets by foreigners(acquisitions, mergers, takeovers,etc.).FDI differs from portfolio <strong>in</strong>vestmentsbecause it is made <strong>with</strong> the purpose ofhav<strong>in</strong>g control or an effective voice <strong>in</strong>management and a last<strong>in</strong>g <strong>in</strong>terest <strong>in</strong> theenterprise. Direct <strong>in</strong>vestment not only<strong>in</strong>cludes the <strong>in</strong>itial acquisition of equitycapital, but also subsequent capital transactionsbetween the foreign <strong>in</strong>vestor anddomestic and affiliated enterprises.The sign convention adopted for the datashown <strong>in</strong> this section, for both flows andstocks, is that <strong>in</strong>vestment is always recorded<strong>with</strong> a positive sign, and a dis<strong>in</strong>vestment<strong>with</strong> a negative sign.Ma<strong>in</strong> f<strong>in</strong>d<strong>in</strong>gsFlows of FDI fluctuate considerably fromone year to the next – partly as a functionof economic fortunes, <strong>with</strong> FDIflows generally <strong>in</strong>creas<strong>in</strong>g dur<strong>in</strong>g timesof rapid growth, while dis<strong>in</strong>vestment ismore likely dur<strong>in</strong>g periods of recessionas companies focus on core activities <strong>in</strong>their domestic market. Inflows of FDIfrom non-Community countries <strong>in</strong>to theEU-27 were valued at EUR 319 161 million<strong>in</strong> 2007, which was about double (90 %)the amount <strong>in</strong> 2006. Outward flows ofFDI from the EU-27 to non-Communitycountries were valued at EUR 419 912million. Despite the rapid <strong>in</strong>crease <strong>in</strong> <strong>in</strong>wardflows of FDI, the EU-27 rema<strong>in</strong>ed anet <strong>in</strong>vestor abroad <strong>with</strong> net outflows ofEUR 100 751 million <strong>in</strong> 2007 (only slightlylower than the value of EUR 106 074recorded <strong>in</strong> 2006).Stocks of FDI show the value of all previous<strong>in</strong>vestments at the end of the referenceperiod. Inward FDI stocks forthe EU-27 accounted for 17.7 % of GDP<strong>in</strong> 2006, while outward FDI stocks werevalued at 23.2 % of GDP. A more detailedanalysis by partner reveals that stocks ofEU-27 FDI abroad were largely concentrated<strong>in</strong> North America (39.9 % of thetotal <strong>in</strong> 2006). North America was aneven more important partner <strong>in</strong> terms ofstocks of FDI <strong>with</strong><strong>in</strong> the EU-27, account<strong>in</strong>gfor 49.6 % of all FDI made by nonmembercountries. The share of Asiancountries <strong>in</strong> outward stocks fell from15.0 % to 13.6 % while <strong>in</strong>ward stocks ofFDI rose from 8.9 % to 10.1 % between2005 and 2006.It should be noted that the relatively highimportance of FDI <strong>in</strong> Luxembourg shouldbe <strong>in</strong>terpreted <strong>with</strong> caution, and resultsma<strong>in</strong>ly from the role of Luxembourgbasedhold<strong>in</strong>g companies.EUROPE IN FIGURES — <strong>Eurostat</strong> <strong>yearbook</strong> <strong>2009</strong>117
2 EconomyTable 2.15: Foreign direct <strong>in</strong>vestment (1)FDI flows, 2007(EUR million) (2)FDI flows, 2007(% of GDP) (3)FDI stocks, 2006(% of GDP) (4)Inward OutwardNetoutflows Inward OutwardNetoutflows Inward OutwardNet FDIassetsEU-27 319 161 419 912 100 751 2.6 3.4 0.8 17.7 23.2 -5.5Euro area (5) 197 880 334 048 314 260 : : : : : :Belgium 28 537 37 881 9 344 8.6 11.5 2.9 : : :Bulgaria 6 101 191 -5 910 21.1 0.7 -20.4 63.2 0.9 62.3Czech Republic 6 710 979 -5 731 5.3 0.8 -4.5 54.2 3.0 51.2Denmark 8 272 11 863 3 591 3.6 5.2 1.6 46.7 51.5 -4.8Germany 37 205 122 325 85 120 1.5 5.0 3.5 24.5 33.5 -9.0Estonia 1 815 1 123 -692 11.7 7.2 -4.5 72.7 20.7 52.0Ireland 18 917 12 109 -6 808 10.2 6.5 -3.7 68.1 53.6 14.5Greece 1 399 3 894 2 495 0.6 1.7 1.1 14.7 8.0 6.7Spa<strong>in</strong> 39 006 87 387 48 381 3.7 8.3 4.6 34.0 39.4 -5.4France 109 487 159 306 49 819 5.8 8.4 2.6 35.3 49.1 -13.8Italy 22 660 64 153 41 493 1.5 4.2 2.7 15.1 19.4 -4.3Cyprus 1 518 777 -741 9.7 5.0 -4.7 75.4 25.6 49.8Latvia 1 595 166 -1 429 8.0 0.8 -7.2 35.8 2.3 33.5Lithuania 1 412 431 -981 5.0 1.5 -3.5 35.3 3.3 32.0Luxembourg (6) 86 798 132 865 46 067 240.2 367.7 127.5 123.1 88.1 35.0Hungary 26 831 25 800 -1 031 26.5 25.5 -1.0 98.9 40.2 58.7Malta 696 14 -682 12.9 0.3 -12.6 93.6 16.4 77.2Netherlands (7) 72 653 22 768 -49 885 12.8 4.0 -8.8 70.6 101.1 -30.5Austria 22 605 23 154 549 8.3 8.5 0.2 24.1 22.7 1.4Poland 12 831 2 392 -10 439 4.2 0.8 -3.4 34.7 4.5 30.2Portugal 4 115 4 542 427 2.5 2.8 0.3 37.3 25.1 12.2Romania 7 256 -49 -7 305 6.0 0.0 -6.0 35.3 0.7 34.6Slovenia 1 073 1 154 81 3.2 3.4 0.2 22.2 11.4 10.8Slovakia 2 157 150 -2 007 3.9 0.3 -3.6 65.7 2.1 63.6F<strong>in</strong>land 6 193 6 300 107 3.4 3.5 0.1 30.3 42.7 -12.4Sweden 13 728 26 831 13 103 4.1 8.1 4.0 49.4 59.8 -10.4United K<strong>in</strong>gdom 135 670 165 416 29 746 6.7 8.2 1.5 44.9 57.2 -12.3Croatia 2 714 164 -2 550 7.9 0.5 -7.4 60.6 5.3 55.3Turkey 15 922 744 -15 178 3.8 0.2 -3.6 16.0 1.6 14.4Switzerland 20 945 55 684 34 739 6.8 18.0 11.2 53.5 127.1 -73.6Japan -5 181 40 035 45 216 -0.1 1.1 1.2 2.3 9.8 -7.5United States 139 689 172 518 32 829 1.3 1.6 0.3 12.9 17.2 -4.3(1) EU-27, FDI <strong>with</strong> extra-EU-27 partners; EA-12: FDI <strong>with</strong> extra-EA-12 partners; all other countries, FDI <strong>with</strong> the rest of the world.(2) Euro area, Croatia, Turkey, Switzerland, Japan and the United States, 2006.(3) Croatia, Turkey, Switzerland, Japan and the United States, 2006.(4) Austria, Portugal and Sweden, 2005.(5) EA-12 <strong>in</strong>stead of EA-15.(6) Special purpose entities excluded from FDI stocks.(7) Exclud<strong>in</strong>g special purpose entities.Source: <strong>Eurostat</strong> (tec00049, tec00053, tec00046 and tec00047), Bank of Japan, Bureau of Economic Analysis118 EUROPE IN FIGURES — <strong>Eurostat</strong> <strong>yearbook</strong> <strong>2009</strong>
Economy 2Figure 2.33: Stocks of foreign direct <strong>in</strong>vestment abroad, EU-27, 2006 (1)(% of extra EU-27 FDI)Rest of the world23.1%Oceania2.1%Africa4.6%South America6.2%North America39.9%Central America10.6%Asia13.6%(1) Figures do not sum to 100 % due to round<strong>in</strong>g.Source: <strong>Eurostat</strong> (tec00094)Figure 2.34: Stocks of foreign direct <strong>in</strong>vestment <strong>in</strong> the EU-27, 2006(% of extra EU-27 FDI)Rest of the world24.4%Oceania0.9%Africa1.1%North America49.6%South America1.2%Asia10.1%Central America12.7%Source: <strong>Eurostat</strong> (tec00095)EUROPE IN FIGURES — <strong>Eurostat</strong> <strong>yearbook</strong> <strong>2009</strong>119
2 EconomyTable 2.16: Foreign direct <strong>in</strong>vestment stocks for selected partner countries, 2006 (1)(EUR 1 000 million)Outward Inward Net assets abroad (2)Total EU-27 JP US Total EU-27 JP US Total EU-27 JP USEU-27 2 706 - 76 934 2 057 - 99 954 649 - -24 -19Euro area (3) 3 074 - 70 613 2 615 - 72 631 459 - -2 -18Belgium : : : : : : : : : : : :Bulgaria 0 0 : 0 16 7 0 0 -16 -7 : 0Czech Republic 3 2 0 0 61 54 1 3 -58 -52 -1 -3Denmark 113 69 1 12 103 74 0 8 10 -4 1 4Germany 778 : 7 162 570 : 12 78 209 : -5 84Estonia 3 2 0 0 10 8 0 0 -7 -6 0 0Ireland 94 63 : 11 119 91 3 9 -25 -29 : 2Greece 17 : 0 1 31 : 0 2 -14 : 0 -1Spa<strong>in</strong> 387 235 2 27 334 249 2 56 53 -14 -1 -29France 887 : 26 142 637 : 13 69 249 : 13 74Italy 288 212 1 21 224 172 3 20 64 40 -2 1Cyprus 4 2 0 0 11 7 0 0 -7 -4 0 0Latvia 0 0 0 0 6 4 0 0 -5 -4 0 0Lithuania 1 1 0 0 8 7 0 0 -8 -7 0 0Luxembourg (4) 30 19 0 4 42 34 0 5 -12 -15 0 -1Hungary 36 13 0 5 89 40 1 2 -53 -27 -1 3Malta 1 0 0 : 5 3 0 0 -4 -2 0 :Netherlands (4) 546 337 2 72 381 223 9 73 164 114 -7 -1Austria (5) 55 39 0 2 59 41 1 7 -3 -2 -1 -5Poland 12 9 0 0 94 80 1 7 -82 -71 -1 -7Portugal (5) 37 25 0 0 56 40 0 1 -18 -15 0 -1Romania 1 0 0 0 34 30 0 1 -34 -29 0 -1Slovenia 3 1 0 0 7 5 0 0 -3 -4 0 0Slovakia 1 1 0 0 29 27 0 1 -28 -26 0 -1F<strong>in</strong>land 71 56 0 5 51 46 0 1 21 10 0 4Sweden (5) 176 : 0 27 145 : 2 26 31 : -1 1United K<strong>in</strong>gdom 1 094 456 4 276 859 432 22 265 235 24 -18 11Croatia 2 0 : 0 21 19 : 0 -19 -19 : 0Turkey 7 4 0 0 67 49 1 4 -60 -45 -1 -4Switzerland 393 : 6 82 166 : 1 38 228 : 6 45Japan 341 : - 119 82 : - 32 259 : - 87United States 1 810 : 70 - 1 358 : 160 - 452 : -91 -(1) EU-27: FDI stocks <strong>in</strong> extra-EU-27 partners; EA-12: FDI stocks <strong>in</strong> extra-EA-12 partners; all other countries: FDI stocks <strong>in</strong> the rest of theworld.(2) Outward stocks - <strong>in</strong>ward stocks.(3) EA-12 <strong>in</strong>stead of EA-15.(4) Exclud<strong>in</strong>g special purpose entities.(5) 2005.Source: <strong>Eurostat</strong> (tec00052 and tec00051)120 EUROPE IN FIGURES — <strong>Eurostat</strong> <strong>yearbook</strong> <strong>2009</strong>
Economy 22.8 Development aidIntroductionMore than half the money spent throughoutthe world on help<strong>in</strong>g develop<strong>in</strong>gcountries comes from the EU and itsMember States. The aims of this developmentaid were laid out <strong>in</strong> a December2005 document agreed by the <strong>Europe</strong>anParliament, Council and Commissiontitled ‘<strong>Europe</strong>an Consensus onDevelopment’, which seeks, <strong>in</strong> particular,to reduce poverty, to develop democraticvalues, and to support national strategiesand procedures. The ultimate objective ofthe EU is to enable disadvantaged people<strong>in</strong> the third world to take control of theirown development, through attack<strong>in</strong>g thema<strong>in</strong> sources of their vulnerability, suchas access to food, clean water, education,health, employment, land and socialservices.The EU’s development strategy focuseson f<strong>in</strong>ancial and technical assistance toimprove basic, physical and social <strong>in</strong>frastructuresand the productive potentialof poor nations, <strong>in</strong>clud<strong>in</strong>g their adm<strong>in</strong>istrativeand <strong>in</strong>stitutional capacities. Thissupport has the potential to help thirdworld countries benefit from <strong>in</strong>ternationaltrade opportunities and secure more<strong>in</strong>ward <strong>in</strong>vestment to broaden their economicbases.The EU’s activities also extend to externaltrade policy, which is used to drive developmentthrough the open<strong>in</strong>g-up of markets.S<strong>in</strong>ce the 1970s, the EU has reducedor removed tariffs and elim<strong>in</strong>ated quotason imports from develop<strong>in</strong>g countries, apolicy that was further extended <strong>in</strong> 2001to cover the complete removal of tariffson all imports (except arms) from the 49least-developed countries (LDCs) of theworld.The EU promotes self-help and povertyeradication through policies that focuson consolidat<strong>in</strong>g the democratic process,expand<strong>in</strong>g social programmes, strengthen<strong>in</strong>g<strong>in</strong>stitutional frameworks, and re<strong>in</strong>forc<strong>in</strong>gthe respect for human rights,<strong>in</strong>clud<strong>in</strong>g equality between men andwomen. Indeed, all trade or cooperationagreements <strong>with</strong> the third world <strong>in</strong>cludea human rights clause as a matter of rout<strong>in</strong>e,and failure to comply gives rise toautomatic penalties, frozen or cancelledaid.Aside from long-term, strategic, developmentaid, the EU also plays an importantrole <strong>in</strong> rapidly alleviat<strong>in</strong>g human suffer<strong>in</strong>g– as a result of natural disaster ormilitary conflict. The EU’s relief activitiesare global and have, s<strong>in</strong>ce 1992, beenhandled by ECHO, its humanitarian aidoffice. ECHO considers its first duty to betowards the victims of disaster, throughthe emergency provision of supplies,such as tents, blankets, food, medic<strong>in</strong>es,water purification systems and fuel. Theannual budget of this office <strong>in</strong> 2007 wasabout EUR 750 million, a little over onehalf (55 %) of which was allocated toAfrican, Caribbean and Pacific (ACP)countries. In the past, global relief operationshave <strong>in</strong>cluded the Asian tsunami <strong>in</strong>December 2004 and the effects of hurricaneKatr<strong>in</strong>a <strong>in</strong> August 2005. Key regionsto which assistance has been provided <strong>in</strong>2007 stretched from the Sudan and theDemocratic Republic of Congo <strong>in</strong> Africa,to the Palest<strong>in</strong>ian Territories <strong>in</strong> theMiddle East, or the northern Caucasus(particularly Chechnya) to Afghanistan,Iran and Pakistan <strong>in</strong> Asia. Most of thisEU aid is <strong>in</strong> the form of non-repayablegrants.EUROPE IN FIGURES — <strong>Eurostat</strong> <strong>yearbook</strong> <strong>2009</strong>121
2 EconomyDef<strong>in</strong>itions and data availabilityOfficial development assistance (ODA)consists of grants or loans that are undertakenby the official sector <strong>with</strong> thepromotion of economic developmentand welfare <strong>in</strong> the recipient countries asthe ma<strong>in</strong> objective. In addition to ODA,total f<strong>in</strong>anc<strong>in</strong>g for development refers tonet disbursements, other official flows,and private flows. Other official flows aretransactions which do not meet the conditionsfor eligibility as ODA (or officialaid), either because they are not primarilyaimed at development, or because theyhave a grant element of less than 25 %.Private flows <strong>in</strong>clude private export credits,direct <strong>in</strong>vestment and f<strong>in</strong>anc<strong>in</strong>g tomultilateral <strong>in</strong>stitutions. Foreign direct<strong>in</strong>vestment <strong>in</strong>cludes significant <strong>in</strong>vestmentsby foreign companies of productionfacilities or ownership stakes taken<strong>in</strong> the national companies.Commitments <strong>in</strong>clude both bilateralcommitments and commitments to regionalbanks. Bilateral commitments arerecorded as the full amount of the expectedtransfer, irrespective of the timerequired for the completion of disbursements.Disbursements are the releaseof funds to, or the purchase of goods orservices for a recipient. Disbursementsrecord the actual <strong>in</strong>ternational transfer off<strong>in</strong>ancial resources, or of goods or servicesvalued at the cost of the donor.Ma<strong>in</strong> f<strong>in</strong>d<strong>in</strong>gsThe EU-15 Member States paid almostEUR 47 000 million <strong>in</strong> official developmentassistance to DAC (DevelopmentAssistance Committee) countries <strong>in</strong> 2006,a further EUR 75 000 million com<strong>in</strong>g <strong>in</strong>the form of private flows. DAC countriesrefer to ‘develop<strong>in</strong>g countries and territories’<strong>with</strong><strong>in</strong> Part I of the OE<strong>CD</strong> DAC Listof Aid Recipients.There is a long-stand<strong>in</strong>g United Nationstarget of reach<strong>in</strong>g a level of aid equivalentto 0.7 % of donors’ gross national <strong>in</strong>come(GNI). While EU members, like other <strong>in</strong>dustrialisedcountries, have accepted this0.7 % target for spend<strong>in</strong>g, currently onlyDenmark, Luxembourg, the Netherlandsand Sweden have reached this goal. EUm<strong>in</strong>isters agreed <strong>in</strong> May 2005 to set a collectivetarget of 0.56 % of GNI by 2010,on the way to achiev<strong>in</strong>g the UN target of0.7 % by 2015. The earlier commitmentto reach an EU average of 0.39 % by 2006was met.122 EUROPE IN FIGURES — <strong>Eurostat</strong> <strong>yearbook</strong> <strong>2009</strong>
Economy 2Table 2.17: Official development assistanceOfficial development assistance(% of gross national <strong>in</strong>come)2003 2004 2005 2006 2007 2002 2003 2004 2005 2006Belgium 0.60 0.41 0.53 0.50 0.43 109.80 158.00 113.10 151.30 149.40Bulgaria : : : 0.00 0.06 : : : : :Czech Republic 0.11 0.11 0.11 0.12 0.11 4.70 7.80 8.50 10.60 12.50Denmark 0.84 0.85 0.81 0.80 0.81 323.00 286.20 302.70 312.20 326.80Germany 0.28 0.28 0.36 0.36 0.37 68.30 72.70 73.40 98.30 100.10Estonia : : : 0.09 0.12 : : : : :Ireland 0.39 0.39 0.42 0.54 0.54 108.40 111.30 122.10 144.50 187.30Greece 0.21 0.16 0.17 0.17 0.16 26.60 29.00 23.30 27.80 30.30Spa<strong>in</strong> 0.23 0.24 0.27 0.32 0.41 44.00 40.60 45.40 56.10 67.90France 0.40 0.41 0.47 0.47 0.39 97.60 107.30 109.90 132.70 131.30Italy 0.17 0.15 0.29 0.20 0.19 43.10 37.30 34.00 69.80 49.60Cyprus : 0.03 0.09 0.15 0.12 : : : : :Latvia : 0.06 0.07 0.06 0.06 : : : : :Lithuania : 0.04 0.06 0.08 0.11 : : : : :Luxembourg 0.81 0.83 0.86 0.89 0.90 352.70 380.80 420.90 458.00 503.90Hungary 0.03 0.07 0.11 0.13 0.07 : 1.90 5.60 8.00 11.80Malta : 0.18 0.18 0.15 0.15 : : : : :Netherlands 0.80 0.73 0.82 0.81 0.81 218.70 216.10 207.50 251.60 265.40Austria 0.20 0.23 0.52 0.47 0.49 68.50 55.40 66.90 153.70 144.10Poland 0.01 0.05 0.07 0.09 0.09 0.40 0.60 2.50 4.30 6.20Portugal 0.22 0.63 0.21 0.21 0.19 33.00 27.30 80.20 29.30 30.50Romania : : : 0.00 0.07 : : : : :Slovenia : 0.10 0.10 0.12 0.12 : : : : :Slovakia 0.05 0.07 0.12 0.10 0.09 1.30 2.50 4.20 8.40 8.10F<strong>in</strong>land 0.35 0.37 0.46 0.40 0.40 93.80 94.80 104.30 137.80 125.10Sweden 0.79 0.78 0.94 1.02 0.93 238.00 236.30 242.90 298.60 346.80United K<strong>in</strong>gdom 0.34 0.36 0.47 0.51 0.36 88.30 93.80 105.60 144.20 166.80Turkey 0.04 0.11 0.17 0.18 : 1.10 0.80 3.80 6.70 :Iceland 0.17 0.18 0.18 0.27 0.25 46.50 53.90 58.50 73.80 105.50Norway 0.92 0.87 0.94 0.89 0.95 394.20 395.00 383.40 482.60 501.40Switzerland 0.39 0.41 0.44 0.39 0.37 135.60 156.90 168.80 190.60 174.90Source: <strong>Eurostat</strong> (tsdgp100 and tsdgp520), OE<strong>CD</strong> (DAC database)Official development assistanceper capita (EUR)EUROPE IN FIGURES — <strong>Eurostat</strong> <strong>yearbook</strong> <strong>2009</strong>123
2 EconomyFigure 2.35: Total f<strong>in</strong>anc<strong>in</strong>g for develop<strong>in</strong>g countries, EU-15(EUR million)150 000100 00050 0000-50 0001996 1997 1998 1999 2000 2001 2002 2003 2004 2005 2006Grants by NGOsOther official flowsPrivate flowsOfficial development assistanceSource: <strong>Eurostat</strong> (tsdgp310), OE<strong>CD</strong> (DAC database)Figure 2.36: Official development assistance, EU-15(% share of GNI)0.8UN target2016 target0.60.40.22006 target2010 target0.01996 1998 2000 2002 2004 2006 2008 2010 2012 2014 2016Source: <strong>Eurostat</strong> (tsdgp100), OE<strong>CD</strong> (DAC database)124 EUROPE IN FIGURES — <strong>Eurostat</strong> <strong>yearbook</strong> <strong>2009</strong>
PopulationThis chapter focuses on <strong>Europe</strong>’s population: it starts <strong>with</strong> a presentation of the currentdemographic situation, compar<strong>in</strong>g the population structure <strong>in</strong> the EU and therest of the world (Subchapter 3.1), followed by a more detailed description of the picture<strong>with</strong><strong>in</strong> the EU itself (Subchapter 3.2). The analysis then moves on to look at thedifferent components that contribute to population change (Subchapter 3.3), <strong>in</strong> particular,births (Subchapter 3.4), life expectancy and death (Subchapter 3.5), and migratoryflows (Subchapter 3.6).Three factors are at the heart of <strong>Europe</strong>’s age<strong>in</strong>g society: persistently low fertility rates,high life expectancy, and baby-boom generations that reach higher ages. Together <strong>with</strong>other factors, such as unemployment and changes <strong>in</strong> the span of the average work<strong>in</strong>glife, the age structure of the population impacts on the numerical balance of the populationaged 65 years and over and the population aged between 15 and 64 years old, thelatter conventionally considered as the work<strong>in</strong>g age population. Future demographictrends are likely to see a cont<strong>in</strong>uous <strong>in</strong>crease <strong>in</strong> the proportion of the EU’s populationthat is aged above the age of 65.It is likely that the EU will, <strong>in</strong> the com<strong>in</strong>g decades, face a number of significant challenges,which will need to be taken <strong>in</strong>to account <strong>with</strong><strong>in</strong> a variety of different policy areas.In order to address these challenges, the <strong>Europe</strong>an Commission released a GreenPaper <strong>in</strong> March 2005 (COM(2005) 94) entitled ‘Confront<strong>in</strong>g demographic change:a new solidarity between the generations’ (1) , <strong>in</strong> which it was recognised that youngadults are <strong>in</strong>creas<strong>in</strong>gly liv<strong>in</strong>g <strong>with</strong> their parents for longer, while parents often have tosupport dependent elderly people. In a Communication from October 2006 on the demographicfuture of <strong>Europe</strong> (2) , the Commission emphasised the need for the MemberStates to promote demographic renewal, l<strong>in</strong>k<strong>in</strong>g action to the renewed Lisbon strategyand gender equality policy. These ideas were elaborated <strong>in</strong> a Communication of May2007 (3) on promot<strong>in</strong>g solidarity between the generations.(1) http://ec.europa.eu/employment_social/news/2005/mar/comm2005-94_en.pdf.(2) The demographic future of <strong>Europe</strong> – from challenge to opportunity – COM(2006) 571.(3) COM(2007) 244 f<strong>in</strong>al.EUROPE IN FIGURES — <strong>Eurostat</strong> <strong>yearbook</strong> <strong>2009</strong>127
3 Population3.1 EU population compared<strong>with</strong> other regions of the worldDef<strong>in</strong>itions and data availabilityThe data <strong>in</strong> this subchapter is providedby the Population Division of theDepartment of Economic and SocialAffairs of the United Nations (UN)Secretariat – for more <strong>in</strong>formation: http://esa.un.org/unpp.S<strong>in</strong>ce the 1970s, the UN has been <strong>in</strong>volved<strong>in</strong> several multi-national surveyprogrammes whose results provide key<strong>in</strong>formation about fertility, mortality, maternaland child health. The UN data reflectsdemographic <strong>in</strong>formation producedby other UN agencies or bodies, suchas, Economic and Social Commissions,the High Commissioner for Refugees(UNHCR), the United Nations Children’sFund (UNICEF), and the World HealthOrganization (WHO). Data from otherorganisations, such as <strong>Eurostat</strong>, is alsoconsulted and used when elaborat<strong>in</strong>gforecasts. UN population data is oftenbased on registers or estimates of populationon a date close to 1 July (mid-yearpopulation), <strong>in</strong> comparison <strong>with</strong> <strong>Eurostat</strong>data that generally reflects the situationas of 1 January <strong>in</strong> each reference year.Note the data collection made by the UNis only revised every five years, and assuch the UN data reported <strong>in</strong> this editionof the <strong>Eurostat</strong> <strong>yearbook</strong> is the same asthat found <strong>in</strong> the last edition.The preparation of population estimatesand projections by the UN <strong>in</strong>volves twodist<strong>in</strong>ct processes: the <strong>in</strong>corporation ofnew and relevant <strong>in</strong>formation regard<strong>in</strong>gpast demographic dynamics; and the formulationof assumptions about the futurepaths of fertility, mortality and <strong>in</strong>ternationalmigration. In fact, population projectionsare what-if scenarios that aim toprovide <strong>in</strong>formation about the likely futuresize and structure of the populationfor a specific set of assumptions. Becauseof the <strong>in</strong>herent uncerta<strong>in</strong>ty of demographicbehaviour and <strong>in</strong> order to take<strong>in</strong>to account alternative assumptions,projection variants are produced: low;medium; high; constant-fertility; <strong>in</strong>stantreplacement-fertility;constant-mortality;no change (constant- fertility andconstant-mortality); and zero-migration.For the purposes of this publication, themedium variant has been selected. Underthis variant, total fertility <strong>in</strong> all countriesis assumed to converge towards 1.85 childrenper woman, although not all countriesreach this level dur<strong>in</strong>g the projectionperiod. Mortality is projected on the basisof models concern<strong>in</strong>g changes <strong>in</strong> life expectancy.These models produce smallerga<strong>in</strong>s the higher the life expectancy thathas already been reached. The selection ofa model for each country is based on recenttrends <strong>in</strong> life expectancy by gender.128 EUROPE IN FIGURES — <strong>Eurostat</strong> <strong>yearbook</strong> <strong>2009</strong>
Population 3For countries highly affected by the HIV/AIDS epidemic, a model <strong>in</strong>corporat<strong>in</strong>g aslow pace of mortality decl<strong>in</strong>e has generallybeen used to project a certa<strong>in</strong> slowdown<strong>in</strong> the reduction of general mortalityrisks not related to HIV/AIDS. Underthe normal migration assumption, thefuture path of <strong>in</strong>ternational migrationis set on the basis of past <strong>in</strong>ternationalmigration estimates and considerationof the policy stance of each country <strong>with</strong>regard to future <strong>in</strong>ternational migrationflows. Projected levels of net migrationare generally kept constant over most ofthe projection period.Ma<strong>in</strong> f<strong>in</strong>d<strong>in</strong>gsIn comparison to other regions, the EU’spopulation is grow<strong>in</strong>g at a relatively slowpace. Between 1960 and 2005 the world’spopulation more than doubled, ris<strong>in</strong>gfrom 3 032 million <strong>in</strong>habitants to 6 515million, while the correspond<strong>in</strong>g rate ofchange <strong>in</strong> the EU-27 was an overall <strong>in</strong>creaseof 21.9 % to reach 491 million <strong>in</strong>habitants.The fastest expansions <strong>in</strong> worldpopulation dur<strong>in</strong>g the last 45 years werereported <strong>in</strong> particular for countries <strong>in</strong>Africa, Asia, and Lat<strong>in</strong> America and theCaribbean.The relative weight of the EU-27’s populationfell from 13.3 % of the world total<strong>in</strong> 1960 to 7.5 % by 2005. This trend isprojected (medium variant) to cont<strong>in</strong>ue,such that by 2050, the EU-27 will accountfor 5.4 % of the world’s population. Theproportion of the world’s population thatare Ch<strong>in</strong>ese is also expected to decl<strong>in</strong>e toaround 15 % by 2050, almost 5 percentagepo<strong>in</strong>ts down on its share of 2005;although the total number of Ch<strong>in</strong>esepeople is projected to <strong>in</strong>crease by almost100 million over the period considered.In contrast, population growth <strong>in</strong> Indiais more pronounced and the UN projectsthis pattern will cont<strong>in</strong>ue, as India islikely to become the most populous nationon the planet before 2050, when itspopulation is expected to be a little over1 650 million persons.The world’s population growth peaked <strong>in</strong>the period 1985-1990, when the numberof global <strong>in</strong>habitants <strong>in</strong>creased, on average,by 87.9 million persons per annum.By 2050, the rate of population growthis expected to have slowed considerably,such that each year will see an additional33.1 million <strong>in</strong>habitants on the planet.The world’s population is projected (mediumvariant), nevertheless, to grow by41.1 % overall between 2005 and 2050.The fastest grow<strong>in</strong>g population amongthe world’s cont<strong>in</strong>ents is projected to bethat of Africa, where the UN foreseesthe number of <strong>in</strong>habitants <strong>in</strong> 2050 be<strong>in</strong>ga little more than twice as high as<strong>in</strong> 2005. For means of comparison, theUN projects that the populations ofAsia, Lat<strong>in</strong> America and the Caribbean,North America, and Oceania will rise bybetween 34 % and 46 % overall between2005 and 2050.EUROPE IN FIGURES — <strong>Eurostat</strong> <strong>yearbook</strong> <strong>2009</strong>129
3 PopulationTable 3.1: World population(million)1960 1965 1970 1975 1980 1985 1990 1995 2000 2005World 3 032 3 343 3 699 4 076 4 451 4 855 5 295 5 719 6 124 6 515<strong>Europe</strong> (1) 605 635 657 676 693 707 721 729 729 731Africa 282 320 364 416 480 554 637 726 821 922Asia 1 704 1 899 2 139 2 394 2 636 2 896 3 181 3 452 3 705 3 938Lat<strong>in</strong> America and the Caribbean 220 253 288 325 364 404 444 484 523 558Northern America 204 219 232 243 256 269 284 300 316 332Oceania 16 18 20 21 23 25 27 29 31 331960 1965 1970 1975 1980 1985 1990 1995 2000 2005EU-27 403 420 435 447 457 464 470 477 483 491Ch<strong>in</strong>a 657 729 831 928 999 1 067 1 149 1 214 1 270 1 313India 446 494 549 614 689 771 860 954 1 046 1 134Japan 94 99 104 112 117 121 124 125 127 128Russian Federation 120 127 130 134 139 143 149 149 147 144United States 186 199 210 220 231 243 256 270 285 300(1) EU-27, Albania, Andorra, Belarus, Bosnia and Herzegov<strong>in</strong>a, Croatia, Faeroe Islands, Iceland, Liechtenste<strong>in</strong>, the former YugoslavRepublic of Macedonia, Republic of Moldova, Montenegro, Norway, the Russian Federation, Serbia, Switzerland and the Ukra<strong>in</strong>e.Source: <strong>Eurostat</strong> (demo_pjan), United Nations, Population Division of the Department of Economic and Social AffairsTable 3.2: World population(% share of world regions and some countries <strong>in</strong> total world population)1960 1965 1970 1975 1980 1985 1990 1995 2000 2005<strong>Europe</strong> (1) 20.0 19.0 17.8 16.6 15.6 14.6 13.6 12.7 11.9 11.2Africa 9.3 9.6 9.8 10.2 10.8 11.4 12.0 12.7 13.4 14.2Asia 56.2 56.8 57.8 58.7 59.2 59.7 60.1 60.4 60.5 60.4Lat<strong>in</strong> America and the Caribbean 7.3 7.6 7.8 8.0 8.2 8.3 8.4 8.5 8.5 8.6Northern America 6.7 6.6 6.3 6.0 5.7 5.5 5.4 5.2 5.2 5.1Oceania 0.5 0.5 0.5 0.5 0.5 0.5 0.5 0.5 0.5 0.51960 1965 1970 1975 1980 1985 1990 1995 2000 2005EU-27 13.3 12.6 11.8 11.0 10.3 9.5 8.9 8.3 7.9 7.5Ch<strong>in</strong>a 21.7 21.8 22.5 22.8 22.4 22.0 21.7 21.2 20.7 20.2India 14.7 14.8 14.9 15.1 15.5 15.9 16.2 16.7 17.1 17.4Japan 3.1 3.0 2.8 2.7 2.6 2.5 2.3 2.2 2.1 2.0Russian Federation 4.0 3.8 3.5 3.3 3.1 3.0 2.8 2.6 2.4 2.2United States 6.1 6.0 5.7 5.4 5.2 5.0 4.8 4.7 4.7 4.6(1) EU-27, Albania, Andorra, Belarus, Bosnia and Herzegov<strong>in</strong>a, Croatia, Faeroe Islands, Iceland, Liechtenste<strong>in</strong>, the former YugoslavRepublic of Macedonia, Republic of Moldova, Montenegro, Norway, the Russian Federation, Serbia, Switzerland and the Ukra<strong>in</strong>e.Source: <strong>Eurostat</strong> (demo_pjan), United Nations, Population Division of the Department of Economic and Social Affairs130 EUROPE IN FIGURES — <strong>Eurostat</strong> <strong>yearbook</strong> <strong>2009</strong>
Population 3Figure 3.1: World population(% of total)6050403020100EU-27 Ch<strong>in</strong>a India Japan RussianFederationUnited States Other (1)moredevelopedOther (2)lessdeveloped1960 2005 2050(1) Exclud<strong>in</strong>g EU-27, Japan, the Russian Federation and the United States.(2) Exclud<strong>in</strong>g Ch<strong>in</strong>a and India.Source: <strong>Eurostat</strong> (demo_pjan), United Nations, Population Division of the Department of Economic and Social AffairsFigure 3.2: Population change(average annual change, million)41203100280160040-120-21960-651965-701970-751975-801980-851985-901990-951995-002000-052005-102010-152015-202020-252025-302030-352035-402040-452045-500EU-27 (left-hand scale)World (right-hand scale)Source: <strong>Eurostat</strong> (demo_pjan), United Nations, Population Division of the Department of Economic and Social AffairsEUROPE IN FIGURES — <strong>Eurostat</strong> <strong>yearbook</strong> <strong>2009</strong>131
3 PopulationTable 3.3: Population and population projections(million)2005 2010 2015 2020 2025 2030 2035 2040 2045 2050World 6 515 6 907 7 295 7 667 8 011 8 318 8 587 8 824 9 026 9 191<strong>Europe</strong> (1) 731 730 727 722 715 707 698 687 676 664Africa 922 1 032 1 149 1 271 1 394 1 518 1 643 1 765 1 884 1 998Asia 3 938 4 166 4 389 4 596 4 779 4 931 5 052 5 148 5 220 5 266Lat<strong>in</strong> America and the Caribbean 558 594 628 660 688 713 733 750 762 769Northern America 332 349 364 379 393 405 417 427 436 445Oceania 33 35 37 39 41 43 45 46 48 492005 2010 2015 2020 2025 2030 2035 2040 2045 2050EU-27 491 498 502 505 506 506 504 501 498 494Ch<strong>in</strong>a 1 313 1 352 1 389 1 421 1 446 1 458 1 458 1 448 1 431 1 409India 1 134 1 220 1 303 1 379 1 447 1 506 1 554 1 597 1 632 1 658Japan 128 128 127 124 122 118 115 111 107 103Russian Federation 144 140 136 132 128 124 120 116 112 108United States 300 315 329 343 355 366 376 386 394 402(1) EU-27, Albania, Andorra, Belarus, Bosnia and Herzegov<strong>in</strong>a, Croatia, Faeroe Islands, Iceland, Liechtenste<strong>in</strong>, the former YugoslavRepublic of Macedonia, Republic of Moldova, Montenegro, Norway, the Russian Federation, Serbia, Switzerland and the Ukra<strong>in</strong>e.Source: <strong>Eurostat</strong> (demo_pjan), United Nations, Population Division of the Department of Economic and Social Affairs132 EUROPE IN FIGURES — <strong>Eurostat</strong> <strong>yearbook</strong> <strong>2009</strong>
Population 33.2 EU-27 populationIntroductionThe data <strong>in</strong> this subchapter is providedby <strong>Eurostat</strong>, <strong>in</strong> contrast to that used <strong>in</strong>the open<strong>in</strong>g subchapter from the UnitedNations. There are methodological differences<strong>in</strong> the projections made by <strong>Eurostat</strong>and the United Nations that expla<strong>in</strong> thedifferences <strong>in</strong> the reported values.The EU-27’s population age structureis the result of many years of high birthrates, followed by low birth rates, accompaniedby a steady, gradual <strong>in</strong>crease <strong>in</strong>life expectancy and migration flows.Over the last 40 years much of the<strong>Europe</strong>an labour force has been made-upof members of the baby-boom generations,who have formed a high proportionof the work<strong>in</strong>g age population. Thisdemographic characteristic is projectedto end dur<strong>in</strong>g the com<strong>in</strong>g decades, as thebaby-boom generation take their retirement.<strong>Europe</strong>’s fertility rates have been <strong>in</strong>decl<strong>in</strong>e s<strong>in</strong>ce the 1970s, and the numberof young people enter<strong>in</strong>g the labour markethas become progressively smaller. Asa result, the proportion of people of work<strong>in</strong>gage <strong>in</strong> the EU-27 is shr<strong>in</strong>k<strong>in</strong>g at thesame time as those who are tak<strong>in</strong>g theirretirement expands.Old age dependency is likely to result<strong>in</strong> <strong>in</strong>creased burdens for the work<strong>in</strong>gpopulation to provide for the social expenditurethat is related to populationage<strong>in</strong>g, <strong>in</strong> the form of pensions, healthcareand <strong>in</strong>stitutional or private (health)care. Increas<strong>in</strong>g labour force participationis one factor that helps to reconciledemographic developments and the socialexpenditure burden, while pensionreforms have already been started <strong>in</strong> severalMember States. In addition, policymakershave also considered ways ofcreat<strong>in</strong>g more flexible work<strong>in</strong>g opportunitiesthat may be of <strong>in</strong>terest to the elderly,or delay<strong>in</strong>g the average age when thiscohort exit the labour market.The ability of the EU as a whole to <strong>in</strong>creaseproductivity and to make full useof its human resources will play an importantrole <strong>in</strong> determ<strong>in</strong><strong>in</strong>g its ability tocope <strong>with</strong> the socio-economic transformationsthat are l<strong>in</strong>ked to demographicage<strong>in</strong>g. Much of the care required by theelderly is currently provided by their descendents.However, <strong>with</strong> an <strong>in</strong>creas<strong>in</strong>gshare of older people likely to live awayfrom their families, the need for professionalcare can be expected to <strong>in</strong>crease.Moreover, the fastest grow<strong>in</strong>g age group<strong>in</strong> <strong>Europe</strong> will be those aged over 80. Asa result, provid<strong>in</strong>g social and healthcare,as well as adapted hous<strong>in</strong>g, transport/mobility facilities and other public <strong>in</strong>frastructurefor this population group willbe a major challenge. The demand forservices of this type will not only dependon the absolute number of elderly persons,but also on their future health.In order to address the demographicchallenge of an age<strong>in</strong>g population, theStockholm <strong>Europe</strong>an Council of 2001agreed that half of the EU population <strong>in</strong>the 55-64 age group should be <strong>in</strong> employmentby 2010. Employment guidel<strong>in</strong>esand a report by the employment taskforcechaired by Wim Kok urged the adoptionof a comprehensive active age<strong>in</strong>g policycentred on appropriate f<strong>in</strong>ancial <strong>in</strong>centivesto encourage longer work<strong>in</strong>g lives,lifelong learn<strong>in</strong>g strategies, and improvedquality of work. A Commission GreenPaper ‘faced <strong>with</strong> demographic change, anew solidarity between the generations’ (4)concluded that <strong>Europe</strong> should pursuethree priorities:(4) COM(2005) 94 f<strong>in</strong>al; http://ec.europa.eu/employment_social/news/2005/mar/comm2005-94_en.pdf.EUROPE IN FIGURES — <strong>Eurostat</strong> <strong>yearbook</strong> <strong>2009</strong>133
3 Population• modernisation of social protectionsystems, <strong>in</strong>creas<strong>in</strong>g the rate of femaleemployment and the employment ofolder workers, <strong>in</strong>novative measures tosupport the birth rate and appropriatemanagement of immigration;• ensur<strong>in</strong>g a balance between thegenerations, <strong>in</strong> the shar<strong>in</strong>g of timethroughout life, <strong>in</strong> the distribution ofthe benefits of growth, and <strong>in</strong> that offund<strong>in</strong>g needs stemm<strong>in</strong>g from pensionsand health-related expenditure;• f<strong>in</strong>d<strong>in</strong>g new bridges between the stagesof life as young people f<strong>in</strong>d it difficultto get <strong>in</strong>to employment; An <strong>in</strong>creas<strong>in</strong>gnumber of ‘young retirees’ wantto participate <strong>in</strong> social and economiclife; study time is gett<strong>in</strong>g longer andyoung work<strong>in</strong>g people want to spendtime <strong>with</strong> their children; these changesalter the frontiers and the bridgesbetween activity and <strong>in</strong>activity.Def<strong>in</strong>itions and data availability<strong>Eurostat</strong> produces a large range of demographicdata, <strong>in</strong>clud<strong>in</strong>g statistics on population,births and deaths, marriages anddivorces. A number of important policies,notably <strong>in</strong> social and economic fields, usepopulation data – such as, fertility ratesand life expectancy when plann<strong>in</strong>g socialpolicies for retirement schemes, orregional population data for calculat<strong>in</strong>gGDP per capita which is used as part ofthe decision-mak<strong>in</strong>g criteria for the allocationof structural funds to economicallyless advantaged regions.There has, until recently, been no comprehensivelegal base for the collection ofstatistics on migration and <strong>in</strong>ternationalprotection, <strong>with</strong> <strong>Eurostat</strong> generally compil<strong>in</strong>gstatistics <strong>in</strong> this area under specificarrangements <strong>with</strong> the Member States.However, the <strong>Europe</strong>an Parliament andthe Council recently adopted a Regulationon Community statistics on migrationand <strong>in</strong>ternational protection (5) . This newRegulation specifies the collection of statisticsrelat<strong>in</strong>g to <strong>in</strong>ternational migrationflows, foreign population stocks, acquisitionof citizenship, asylum applicationsand decisions, measures taken aga<strong>in</strong>stillegal entry and stay, returns of unauthorisedmigrants, and residence permitsissued to third- country citizens. Its focusis to harmonise statistical outputs, basedon a set of common def<strong>in</strong>itions relat<strong>in</strong>gto immigration, border management,and asylum issues, and on established<strong>in</strong>ternational standards (<strong>in</strong> particular,the UN recommendations for migrationstatistics). The Regulation provides aframework which needs to be completedthrough the adoption of implement<strong>in</strong>gmeasures <strong>in</strong> the form of Commissionregulations.In July 2008, the <strong>Europe</strong>an Parliamentand the Council adopted a regulationon population and hous<strong>in</strong>g censuses (6) .This regulation will make data from censusesconducted <strong>in</strong> the EU Member Statesmore comparable. Dur<strong>in</strong>g <strong>2009</strong>, the<strong>Europe</strong>an Commission will put forwardimplement<strong>in</strong>g measures to complete theframework regulation.Most <strong>Europe</strong>an countries evaluate populationdata on the basis of gender and agebreakdowns as of 1 January (althoughsome countries adopt another date).Unless otherwise stipulated, the populationdata presented is based on this date.(5) Regulation (EC) No 862/2007 of the <strong>Europe</strong>an Parliament and of the Council of 11 July 2007 on Community statistics onmigration and <strong>in</strong>ternational protection and repeal<strong>in</strong>g Council Regulation (EEC) No 311/76 on the compilation of statisticson foreign workers (text <strong>with</strong> EEA relevance); http://eur-lex.europa.eu/ LexUriServ/LexUriServ.do?uri=OJ:L:2007:199:0023:01:EN:HTML.(6) Regulation (EC) No 763/2008 of the <strong>Europe</strong>an Parliament and of the Council of 9 July 2008 on population and hous<strong>in</strong>gcensuses; http://eur-lex.europa.eu/LexUriServ/LexUriServ.do?uri=OJ:L:2008:218:0014:0020:EN:PDF.134 EUROPE IN FIGURES — <strong>Eurostat</strong> <strong>yearbook</strong> <strong>2009</strong>
Population 3Population <strong>figures</strong> are generally given <strong>in</strong>relation to data from the most recent census,adjusted by the components of populationchange produced s<strong>in</strong>ce the last census,or alternatively population registers.Note that demographic statistics for theEU-27, euro area and France have a break<strong>in</strong> series <strong>in</strong> 1998, as prior to this date <strong>in</strong>formationfor France was collected on thebasis of metropolitan France (<strong>in</strong> otherwords exclud<strong>in</strong>g the French overseas departments),while from 1998 onwardsthese are <strong>in</strong>cluded.Every three to five years, <strong>Eurostat</strong> producesdemographic projections. Those presentedhere relate to the EUROPOP2008convergence scenario, national level,which is one of a set of ‘what-if’ scenarios.To this end, a projection is a conditionalstatement, whose numerical outcome isthe result of explicit assumptions that areextended to the far future. The projectionsare made us<strong>in</strong>g the latest available <strong>figures</strong>for the population on 1 January, <strong>with</strong> assumptionsmade <strong>with</strong> respect to mortality,fertility and migration by sex and byage. In particular, for the EUROPOP2008convergence scenario population projections,the assumptions have been developed<strong>in</strong> a conceptual framework ofconvergence of demographic values as aresult of decreas<strong>in</strong>g socio-economic andcultural differences between the MemberStates of the EU.Age dependency ratios are importantdemographic <strong>in</strong>dicators that relate theyoung and old age population (those generally<strong>in</strong>active) to the population of work<strong>in</strong>gage. In this publication the follow<strong>in</strong>gterm<strong>in</strong>ology is used:• young age dependency ratio: the populationaged up to 14 years related tothe population aged between 15 and64 years;• old age dependency ratio: the populationaged 65 years or older related tothe population aged between 15 and64 years;• total dependency ratio: the populationaged up to 14 years and aged 65years or older related to the populationaged between 15 and 64 years.Ma<strong>in</strong> f<strong>in</strong>d<strong>in</strong>gsThe population of the 27 Member States ofthe EU grew from 403 million <strong>in</strong> 1960 tojust over 495 million <strong>in</strong> 2007. Populationgrowth <strong>in</strong> the EU-27 was strongest at thebeg<strong>in</strong>n<strong>in</strong>g of this period <strong>in</strong> the 1960s,when average annual <strong>in</strong>creases were generallyover 3 million persons per year,peak<strong>in</strong>g at 4.2 million <strong>in</strong> 1963. The rateof population change slowed down significantly<strong>in</strong> the 1970s, and by the 1980sthe average <strong>in</strong>crease <strong>in</strong> population wasaround one and a quarter million personseach year. This level of population growthcont<strong>in</strong>ued dur<strong>in</strong>g much of the next 20years, although there appears to havebeen a reversal <strong>in</strong> the trend observed dur<strong>in</strong>gthe period from 2003 to 2007, as thenumber of EU-27 <strong>in</strong>habitants rose by approximately2 million a year.Germany had the largest populationamong the Member States <strong>in</strong> 2007, account<strong>in</strong>gfor almost 17 % of the EU-27total. Together <strong>with</strong> France, the UnitedK<strong>in</strong>gdom and Italy, who had similar sizedpopulations, these four countries togethercomprised almost 54 % of the total populationof the EU-27. The twelve MemberStates that have jo<strong>in</strong>ed the EU s<strong>in</strong>ce 2004had a comb<strong>in</strong>ed population of 103.3 millionpersons <strong>in</strong> 2007, represent<strong>in</strong>g a littlemore than one fifth (almost 21 %) of theEU-27’s total population.EUROPE IN FIGURES — <strong>Eurostat</strong> <strong>yearbook</strong> <strong>2009</strong>135
3 PopulationIn a majority of <strong>Europe</strong>an countries,populations cont<strong>in</strong>ued to grow throughto 2007, although the situation varied betweenMember States. Most of the overallpopulation growth <strong>in</strong> the EU-27 <strong>in</strong> the lastdecade may be attributed to an <strong>in</strong>creasednumber of <strong>in</strong>habitants <strong>in</strong> Ireland, Spa<strong>in</strong>,France, Italy and the United K<strong>in</strong>gdom; <strong>in</strong>relative terms, Ireland, Spa<strong>in</strong> and Cyprusrecorded the highest population growthrates.Accord<strong>in</strong>g to the latest population projections(EUROPOP2008 convergencescenario), <strong>Eurostat</strong> projects that theEU-27’s population will rise to a high of521 million persons <strong>in</strong> 2035, thereafterfall<strong>in</strong>g to about 506 million <strong>in</strong>habitantsby 2060. The changes expected <strong>in</strong> populationlevels <strong>with</strong><strong>in</strong> the EU-27 by 2060will not be distributed equally across theMember States. At one end of the projections,the populations of Cyprus, Irelandand Luxembourg are projected to growby over 50 % from 2008 to 2060, while thepopulations of Belgium, Spa<strong>in</strong>, France,Sweden and the United K<strong>in</strong>gdom are projectedto grow by between 15 % and 25 %by 2060. In contrast, the populations ofPoland, Estonia, Hungary, Slovakia andGermany are projected to have shrunkby between 10 % and 20 % by 2060, <strong>with</strong>even stronger decl<strong>in</strong>es of between 20 %and 30 % <strong>in</strong> Bulgaria, Latvia, Lithuaniaand Romania.The EU-27’s population has aged <strong>in</strong> thedecade through until 2007. Those agedless than 15 years accounted for 15.8 % ofthe EU-27’s population <strong>in</strong> 2007, althoughthis rate varied considerably among theMember States, from lows of 13.4 % <strong>in</strong>Bulgaria and 13.9 % <strong>in</strong> Germany to ahigh of 20.3 % <strong>in</strong> Ireland. In contrast,the proportion of the EU-27 populationaged more than 64 years grew to 16.9 %<strong>in</strong> 2007, the share ris<strong>in</strong>g to almost 20 % <strong>in</strong>Italy and Germany.A little more than two thirds (67.2 %) ofthe EU-27’s population were of work<strong>in</strong>gage (15 to 64 years old) <strong>in</strong> 2007. In a seriesof population pyramids, projectionsthrough until 2050 suggest, however,that this relatively large proportion of thepopulation may shr<strong>in</strong>k gradually to about57 % of the total. This narrower work<strong>in</strong>gbase will need to support a grow<strong>in</strong>gpopulation of persons aged over 65 yearsor more (nearly 29 % of the population).The importance of the very old (80 yearsor more) will be considerable by 2060,when this age group is likely to accountfor 12.0 % of the EU-27’s population,swelled by numbers from the so-calledbaby-boom generation.These EU developments should also beviewed <strong>in</strong> a global context and over thelonger-term.<strong>Europe</strong> reported the lowest share of youngpersons (15.9 %) and the highest share ofold persons (also 15.9 %) across any of thecont<strong>in</strong>ents <strong>in</strong> 2005. For means of comparison,the overall share of young persons<strong>in</strong> the world population was 28.3 % <strong>in</strong>2005, while older generations accountedfor 7.3 % of the global population. Youngage dependency ratios <strong>in</strong> <strong>Europe</strong> decl<strong>in</strong>edover the period 1960 to 2005 from 41.4 %to 23.3 %. <strong>Europe</strong> recorded the largest <strong>in</strong>creaseacross the cont<strong>in</strong>ents <strong>in</strong> relation tothe old age dependency ratio dur<strong>in</strong>g theperiod 1960 to 2005. The <strong>Europe</strong>an old136 EUROPE IN FIGURES — <strong>Eurostat</strong> <strong>yearbook</strong> <strong>2009</strong>
Population 3age dependency ratio rose from 13.7 % to23.3 %, which was almost three times thepace of the next highest <strong>in</strong>crease whichwas recorded <strong>in</strong> Oceania, where old agedependency <strong>in</strong>creased from 12.2 % to15.8 %. Comb<strong>in</strong><strong>in</strong>g these two sets of <strong>in</strong>dicators,the total dependency ratio <strong>in</strong>2005 ranged from 46.6 % <strong>in</strong> <strong>Europe</strong> to ahigh of 81.2 % <strong>in</strong> Africa, where the vastmajority of dependents are children. Thefall <strong>in</strong> young age dependency <strong>in</strong> <strong>Europe</strong>was largely counterbalanced by an <strong>in</strong>crease<strong>in</strong> old age dependency, result<strong>in</strong>g<strong>in</strong> a relatively small net change <strong>in</strong> totaldependency <strong>in</strong> comparison to the mostother cont<strong>in</strong>ents. Nevertheless, this hasnecessitated a switch <strong>in</strong> social expenditureto more healthcare and pensions forthe elderly.Table 3.4: Total population and population projections (1)(at 1 January, million)1960 1970 1980 1990 2000 2007 2010 2020 2030 2040 2050 2060EU-27 (2) 402.6 435.5 457.1 470.4 482.8 495.1 499.4 513.8 519.9 520.1 515.3 505.7Euro area (2) : 274.1 287.6 295.6 307.3 319.6 322.9 334.1 339.1 340.4 337.3 330.6Belgium 9.1 9.7 9.9 9.9 10.2 10.6 10.8 11.3 11.7 12.0 12.2 12.3Bulgaria 7.8 8.5 8.8 8.8 8.2 7.7 7.6 7.2 6.8 6.3 5.9 5.5Czech Republic 9.6 9.9 10.3 10.4 10.3 10.3 10.4 10.5 10.4 10.2 9.9 9.5Denmark 4.6 4.9 5.1 5.1 5.3 5.4 5.5 5.7 5.8 5.9 5.9 5.9Germany 72.5 78.3 78.2 79.1 82.2 82.3 82.1 81.5 80.2 77.8 74.5 70.8Estonia 1.2 1.4 1.5 1.6 1.4 1.3 1.3 1.3 1.3 1.2 1.2 1.1Ireland 2.8 2.9 3.4 3.5 3.8 4.3 4.6 5.4 5.9 6.2 6.5 6.8Greece 8.3 8.8 9.6 10.1 10.9 11.2 11.3 11.6 11.6 11.6 11.4 11.1Spa<strong>in</strong> 30.3 33.6 37.2 38.8 40.0 44.5 46.7 51.1 52.7 53.3 53.2 51.9France (3) 45.5 50.5 53.7 56.6 58.8 61.5 62.6 65.6 68.0 69.9 71.0 71.8Italy 50.0 53.7 56.4 56.7 56.9 59.1 60.0 61.4 61.9 62.0 61.2 59.4Cyprus 0.6 0.6 0.5 0.6 0.7 0.8 0.8 1.0 1.1 1.2 1.3 1.3Latvia 2.1 2.4 2.5 2.7 2.4 2.3 2.2 2.2 2.0 1.9 1.8 1.7Lithuania 2.8 3.1 3.4 3.7 3.5 3.4 3.3 3.2 3.1 2.9 2.7 2.5Luxembourg 0.3 0.3 0.4 0.4 0.4 0.5 0.5 0.6 0.6 0.7 0.7 0.7Hungary 10.0 10.3 10.7 10.4 10.2 10.1 10.0 9.9 9.7 9.4 9.1 8.7Malta 0.3 0.3 0.3 0.4 0.4 0.4 0.4 0.4 0.4 0.4 0.4 0.4Netherlands 11.4 13.0 14.1 14.9 15.9 16.4 16.5 16.9 17.2 17.2 16.9 16.6Austria 7.0 7.5 7.5 7.6 8.0 8.3 8.4 8.7 9.0 9.1 9.1 9.0Poland 29.5 32.7 35.4 38.0 38.7 38.1 38.1 38.0 37.0 35.2 33.3 31.1Portugal 8.8 8.7 9.7 10.0 10.2 10.6 10.7 11.1 11.3 11.5 11.4 11.3Romania 18.3 20.1 22.1 23.2 22.5 21.6 21.3 20.8 20.0 19.2 18.1 16.9Slovenia 1.6 1.7 1.9 2.0 2.0 2.0 2.0 2.1 2.0 2.0 1.9 1.8Slovakia 4.0 4.5 5.0 5.3 5.4 5.4 5.4 5.4 5.3 5.1 4.9 4.5F<strong>in</strong>land 4.4 4.6 4.8 5.0 5.2 5.3 5.3 5.5 5.6 5.5 5.4 5.4Sweden 7.5 8.0 8.3 8.5 8.9 9.1 9.3 9.9 10.3 10.5 10.7 10.9United K<strong>in</strong>gdom 52.2 55.5 56.3 57.2 58.8 60.9 62.0 65.7 69.2 72.0 74.5 76.7Croatia 4.1 4.4 4.6 4.8 4.4 4.4 : : : : : :FYR of Macedonia 1.4 1.6 1.9 1.9 2.0 2.0 : : : : : :Turkey 27.1 34.9 44.0 55.5 66.9 69.7 : : : : : :Iceland 0.2 0.2 0.2 0.3 0.3 0.3 : : : : : :Liechtenste<strong>in</strong> 0.0 0.0 0.0 0.0 0.0 0.0 : : : : : :Norway 3.6 3.9 4.1 4.2 4.5 4.7 4.8 5.2 5.5 5.7 5.9 6.0Switzerland 5.3 6.2 6.3 6.7 7.2 7.5 7.7 8.2 8.6 8.9 9.1 9.2(1) From 2010 onwards the data refer to projections (EUROPOP2008 convergence scenario).(2) Break <strong>in</strong> series, 1998.(3) Metropolitan France, exclud<strong>in</strong>g the four overseas departments (French Guyana, Guadeloupe, Mart<strong>in</strong>ique and Réunion).Source: <strong>Eurostat</strong> (demo_pjan and proj_08c2150p)EUROPE IN FIGURES — <strong>Eurostat</strong> <strong>yearbook</strong> <strong>2009</strong>137
3 PopulationFigure 3.3: Population by age class, EU-27(1997=100)13012011010090801997 1998 1999 2000 2001 2002 2003 2004 2005 2006 2007Source: <strong>Eurostat</strong> (tps00010)80 years and more 65 to 79 years 50 to 64 years25 to 49 years 15 to 24 years 0 to 14 yearsFigure 3.4: Age pyramid, EU-27, 2007(% of total population)80+75 to 7970 to 7465 to 6960 to 6455 to 5950 to 5445 to 4940 to 4435 to 3930 to 3425 to 2920 to 2415 to 1910 to 145 to 90 to 48 6 4 2 0 2 4 6 8Source: <strong>Eurostat</strong> (demo_pjan)MaleFemale138 EUROPE IN FIGURES — <strong>Eurostat</strong> <strong>yearbook</strong> <strong>2009</strong>
Population 3Figure 3.5: Mov<strong>in</strong>g age pyramids, EU-27 (1)(% of total population)80+75 to 7970 to 7465 to 6960 to 6455 to 5950 to 5445 to 4940 to 4435 to 3930 to 3425 to 2920 to 2415 to 1910 to 145 to 90 to 419508 6 4 2 0 2 4 6 880+75 to 7970 to 7465 to 6960 to 6455 to 5950 to 5445 to 4940 to 4435 to 3930 to 3425 to 2920 to 2415 to 1910 to 145 to 90 to 419708 6 4 2 0 2 4 6 8MaleFemaleMaleFemale80+75 to 7970 to 7465 to 6960 to 6455 to 5950 to 5445 to 4940 to 4435 to 3930 to 3425 to 2920 to 2415 to 1910 to 145 to 90 to 419908 6 4 2 0 2 4 6 880+75 to 7970 to 7465 to 6960 to 6455 to 5950 to 5445 to 4940 to 4435 to 3930 to 3425 to 2920 to 2415 to 1910 to 145 to 90 to 420108 6 4 2 0 2 4 6 8MaleFemaleMaleFemale80+75 to 7970 to 7465 to 6960 to 6455 to 5950 to 5445 to 4940 to 4435 to 3930 to 3425 to 2920 to 2415 to 1910 to 145 to 90 to 420308 6 4 2 0 2 4 6 880+75 to 7970 to 7465 to 6960 to 6455 to 5950 to 5445 to 4940 to 4435 to 3930 to 3425 to 2920 to 2415 to 1910 to 145 to 90 to 420508 6 4 2 0 2 4 6 8MaleFemale(1) Limited data availability for 1950 and 1970, based on those Member States for which data are available; from 2010 onwards the datarefer to projections (EUROPOP2008 convergence scenario).Source: <strong>Eurostat</strong> (demo_pjan and proj_08c2150p)MaleFemaleEUROPE IN FIGURES — <strong>Eurostat</strong> <strong>yearbook</strong> <strong>2009</strong>139
3 PopulationTable 3.5: Population by age class, 2007 (1)(% of total population)0 to 14years15 to 24years25 to 49years50 to 64years65 to 79years80 yearsand moreEU-27 15.8 12.6 36.3 18.3 12.6 4.3Euro area 15.6 11.9 36.8 18.0 13.2 4.5Belgium 17.0 12.1 35.4 18.5 12.5 4.6Bulgaria 13.4 13.3 35.6 20.4 13.8 3.5Czech Republic 14.4 13.1 36.9 21.2 11.1 3.3Denmark 18.6 11.4 34.7 20.0 11.2 4.1Germany 13.9 11.7 36.3 18.4 15.2 4.6Estonia 14.9 15.4 34.7 17.9 13.6 3.5Ireland 20.3 14.8 38.3 15.5 8.4 2.7Greece 14.3 11.6 37.6 18.0 14.7 3.9Spa<strong>in</strong> 14.5 11.5 40.5 16.8 12.1 4.5France 18.6 12.8 34.2 18.2 11.4 4.8Italy 14.1 10.2 37.3 18.4 14.6 5.3Cyprus 17.9 15.5 37.3 16.9 9.5 2.8Latvia 14.0 15.7 35.6 17.6 13.7 3.4Lithuania 15.9 15.7 36.2 16.6 12.5 3.1Luxembourg 18.3 11.8 38.8 17.1 10.7 3.3Hungary 15.2 12.8 35.7 20.4 12.3 3.6Malta 16.7 14.2 34.6 20.6 10.8 3.0Netherlands 18.1 12.0 36.1 19.4 10.8 3.7Austria 15.6 12.3 37.6 17.6 12.4 4.5Poland 15.8 15.9 36.0 18.9 10.6 2.9Portugal 15.5 11.9 37.4 18.0 13.2 4.1Romania 15.4 14.9 37.0 17.8 12.2 2.7Slovenia 14.0 12.7 37.8 19.6 12.5 3.4Slovakia 16.1 15.6 38.0 18.4 9.3 2.5F<strong>in</strong>land 17.1 12.5 32.9 21.1 12.3 4.2Sweden 17.0 12.7 33.2 19.7 12.0 5.4United K<strong>in</strong>gdom 17.6 13.4 35.1 17.9 11.5 4.5Croatia 15.6 12.9 35.2 19.2 14.0 3.1FYR of Macedonia 18.9 16.0 36.9 17.0 9.6 1.6Turkey 27.9 17.4 37.5 11.1 : :Iceland 21.8 14.6 36.0 15.9 8.6 3.1Liechtenste<strong>in</strong> 17.1 12.3 39.0 19.7 8.9 3.0Norway 19.4 12.5 35.0 18.5 10.0 4.7Switzerland 15.8 11.9 37.2 18.9 11.6 4.6(1) Euro area and Iceland, 2006.Source: <strong>Eurostat</strong> (tps00010)140 EUROPE IN FIGURES — <strong>Eurostat</strong> <strong>yearbook</strong> <strong>2009</strong>
Population 3Figure 3.6: Proportion of the population aged under 15(% of total population)50403020101960 1965 1970 1975 1980 1985 1990 1995 2000 2005AfricaLat<strong>in</strong> America and the CaribbeanAsiaOceaniaNorthern America <strong>Europe</strong> (1)(1) EU-27, Albania, Andorra, Belarus, Bosnia and Herzegov<strong>in</strong>a, Croatia, Faeroe Islands, Iceland, Liechtenste<strong>in</strong>, the former YugoslavRepublic of Macedonia, Republic of Moldova, Montenegro, Norway, the Russian Federation, Serbia, Switzerland and the Ukra<strong>in</strong>e.Source: United Nations, Population Division of the Department of Economic and Social AffairsFigure 3.7: Proportion of the population aged 65 and over(% of total population)16128401960 1965 1970 1975 1980 1985 1990 1995 2000 2005<strong>Europe</strong> (1)OceaniaLat<strong>in</strong> America and the CaribbeanNorth AmericaAsiaAfrica(1) EU-27, Albania, Andorra, Belarus, Bosnia and Herzegov<strong>in</strong>a, Croatia, Faeroe Islands, Iceland, Liechtenste<strong>in</strong>, the former YugoslavRepublic of Macedonia, Republic of Moldova, Montenegro, Norway, the Russian Federation, Serbia, Switzerland and the Ukra<strong>in</strong>e.Source: United Nations, Population Division of the Department of Economic and Social AffairsEUROPE IN FIGURES — <strong>Eurostat</strong> <strong>yearbook</strong> <strong>2009</strong>141
3 PopulationTable 3.6: Age related dependency ratios(%)Young age dependency ratioOld age dependency ratio1960 1970 1980 1990 2000 2007 1960 1970 1980 1990 2000 2007EU-27 : : : 29.2 25.7 23.5 : : : 20.6 23.2 25.2Euro area (1) : : : 27.0 24.4 23.4 : : : 21.0 24.2 26.5Belgium 36.2 37.5 31.0 27.0 26.9 25.8 18.5 21.2 21.9 22.1 25.5 25.9Bulgaria 39.4 33.9 33.5 30.9 23.4 19.4 11.2 14.0 17.8 19.5 23.8 24.9Czech Republic 39.5 32.0 37.0 33.0 23.9 20.2 14.6 17.9 21.6 19.0 19.8 20.2Denmark 39.8 36.4 32.7 25.5 27.6 28.2 16.4 18.9 22.2 23.2 22.2 23.2Germany 31.1 36.8 28.6 23.1 23.1 21.0 17.0 21.4 23.9 21.6 23.9 29.9Estonia : 33.3 32.8 33.7 27.3 21.9 : 17.7 19.0 17.5 22.4 25.1Ireland 53.2 54.2 51.8 44.7 32.8 29.7 19.2 19.3 18.2 18.6 16.8 16.2Greece 37.6 37.5 36.2 29.3 22.9 21.3 14.2 17.2 20.6 20.4 24.2 27.6Spa<strong>in</strong> 42.6 44.2 41.2 30.5 21.8 21.1 12.7 15.2 17.1 20.2 24.5 24.2France 42.2 40.0 35.4 30.5 29.0 28.1 18.7 20.6 22.1 21.1 24.6 25.2Italy 37.4 38.1 35.1 24.5 21.2 21.3 14.0 16.7 20.3 21.5 26.8 30.2Cyprus : : : 41.2 34.5 25.7 : : : 17.2 17.0 17.6Latvia : 32.8 30.7 32.1 26.7 20.2 : 18.0 19.6 17.7 22.1 24.8Lithuania : 43.2 36.2 33.9 30.6 23.2 : 15.9 17.4 16.2 20.8 22.7Luxembourg 31.5 33.8 28.1 24.9 28.3 27.1 15.9 19.1 20.3 19.3 21.4 20.7Hungary 38.7 31.3 33.8 31.0 24.8 22.1 13.6 17.0 20.9 20.0 22.0 23.2Malta : : 36.1 35.8 30.2 24.0 : : 12.5 15.7 17.9 19.8Netherlands 49.1 43.8 34.3 26.4 27.4 26.8 14.6 16.2 17.4 18.6 20.0 21.5Austria 33.0 39.5 32.4 26.0 25.4 23.1 18.4 22.7 24.3 22.1 22.9 25.0Poland 54.5 42.0 36.8 39.0 28.6 22.3 9.5 12.6 15.5 15.4 17.6 19.0Portugal 46.8 46.8 41.6 31.6 24.0 23.0 12.4 14.9 17.8 20.0 23.7 25.6Romania : 39.8 42.1 36.0 27.7 22.1 : 13.0 16.3 15.6 19.7 21.3Slovenia : 37.7 34.6 30.6 23.0 19.9 : 14.8 16.4 15.5 19.8 22.7Slovakia 51.1 43.4 41.2 39.6 28.8 22.4 11.1 14.4 16.7 16.0 16.6 16.5F<strong>in</strong>land 49.4 37.7 30.2 28.7 27.2 25.7 11.6 13.6 17.6 19.8 22.2 24.8Sweden 34.5 31.8 30.9 27.7 28.8 25.9 17.8 20.7 25.3 27.7 26.9 26.4United K<strong>in</strong>gdom 35.9 38.2 33.2 29.0 29.4 26.5 18.0 20.5 23.3 24.1 24.3 24.1Croatia : : : 29.0 24.4 23.2 : : : 17.0 24.4 25.4FYR of Macedonia : : : : 33.3 27.1 : : : : 14.6 16.0Turkey 74.7 77.7 69.7 57.6 46.6 42.2 6.4 8.2 8.4 7.1 8.3 10.1Iceland (1) 60.9 56.4 44.3 38.8 35.8 32.8 14.0 15.0 15.7 16.4 17.8 17.6Liechtenste<strong>in</strong> 44.7 43.5 33.1 27.4 26.3 24.0 12.3 12.3 12.9 14.2 14.8 16.8Norway 41.3 39.1 35.5 29.2 30.8 29.3 17.3 20.4 23.3 25.2 23.5 22.2Switzerland 36.8 36.5 30.2 24.9 25.9 23.1 15.5 17.3 20.9 21.3 22.7 23.8(1) 2006 <strong>in</strong>stead of 2007.Source: <strong>Eurostat</strong> (demo_pjan<strong>in</strong>d)142 EUROPE IN FIGURES — <strong>Eurostat</strong> <strong>yearbook</strong> <strong>2009</strong>
Population 3Figure 3.8: Young age dependency ratio(%)10075502501960 1965 1970 1975 1980 1985 1990 1995 2000 2005AfricaLat<strong>in</strong> America and the CaribbeanAsiaOceaniaNorth America <strong>Europe</strong> (1)(1) EU-27, Albania, Andorra, Belarus, Bosnia and Herzegov<strong>in</strong>a, Croatia, Faeroe Islands, Iceland, Liechtenste<strong>in</strong>, the former YugoslavRepublic of Macedonia, Republic of Moldova, Montenegro, Norway, the Russian Federation, Serbia, Switzerland and the Ukra<strong>in</strong>e.Source: United Nations, Population Division of the Department of Economic and Social AffairsFigure 3.9: Old age dependency ratio(%)25201510501960 1965 1970 1975 1980 1985 1990 1995 2000 2005<strong>Europe</strong> (1)OceaniaLat<strong>in</strong> America and the CaribbeanNorth AmericaAsiaAfrica(1) EU-27, Albania, Andorra, Belarus, Bosnia and Herzegov<strong>in</strong>a, Croatia, Faeroe Islands, Iceland, Liechtenste<strong>in</strong>, the former YugoslavRepublic of Macedonia, Republic of Moldova, Montenegro, Norway, the Russian Federation, Serbia, Switzerland and the Ukra<strong>in</strong>e.Source: United Nations, Population Division of the Department of Economic and Social AffairsEUROPE IN FIGURES — <strong>Eurostat</strong> <strong>yearbook</strong> <strong>2009</strong>143
3 PopulationFigure 3.10: Proportion of the population aged 0-14 and 65 years and more, EU-27 (1)(% of total population)4030201002005 2010 2015 2020 2025 2030 2035 2040 2045 2050 2055 206065 years and more0 to 14 years(1) From 2008 onwards the data refer to projections (EUROPOP2008 convergence scenario).Source: <strong>Eurostat</strong> (tps00010 and proj_08c2150p)Figure 3.11: Proportion of the population aged 80 years and more, EU-27 (1)(% of total population)1510502005 2010 2015 2020 2025 2030 2035 2040 2045 2050 2055 2060TotalFemaleMale(1) From 2008 onwards the data refer to projections (EUROPOP2008 convergence scenario).Source: <strong>Eurostat</strong> (demo_pjan and proj_08c2150p)144 EUROPE IN FIGURES — <strong>Eurostat</strong> <strong>yearbook</strong> <strong>2009</strong>
Population 33.3 Components of populationchangeIntroductionThis subchapter focuses on populationchange, which is made up of two dist<strong>in</strong>ctaspects: namely, natural populationchange and net migration. Natural populationchange is the difference betweenlive births and deaths, or put <strong>in</strong> generalterms, fertility and mortality. Births arecovered <strong>in</strong> more detail <strong>with</strong><strong>in</strong> the nextsubchapter, while life expectancy anddeaths are treated <strong>in</strong> Subchapter 3.5, andmigration <strong>in</strong> Subchapter 3.6.There are many countries <strong>with</strong><strong>in</strong> theEU-27 that currently report a highernumber of deaths than births. In someof these, the negative evolution of naturalpopulation change is (at least) partlyoffset by positive net migration; this is apattern that exists <strong>in</strong> western Germany,northern Italy, Slovenia or southernSweden. The opposite pattern is muchrarer, as there are only a handful of cases<strong>in</strong> the EU where positive natural change(more births than deaths) has been compensatedby negative net migration; oneexample is northern Poland.When the two components of populationchange do not compensate, but ratheradd to each other, they can lead to moresignificant sw<strong>in</strong>gs <strong>in</strong> overall populationchange. In recent years this has been thecase <strong>in</strong> Ireland and Denmark, most ofthe Benelux and France, as well as morespecific regions <strong>in</strong> southern and easternSpa<strong>in</strong>, where natural population <strong>in</strong>creaseshave been accompanied by positive netmigration. In contrast, some regions <strong>in</strong>eastern Germany, north western Spa<strong>in</strong>,southern Italy, the Baltic States, as wellas the Czech Republic, Hungary, Poland,Romania and Slovakia have witnessedboth components of population changemov<strong>in</strong>g <strong>in</strong> a negative direction; it is <strong>in</strong>these areas of the EU where the largestdecl<strong>in</strong>es <strong>in</strong> population have been recorded<strong>in</strong> the last decade. Often, their populationis expected to cont<strong>in</strong>ue fall<strong>in</strong>g <strong>in</strong>the com<strong>in</strong>g years. More details concern<strong>in</strong>gregional population density and theevolution of population change across EUregions can be found <strong>in</strong> Chapter 15, morespecifically <strong>in</strong> Maps 15.3 and 15.4.Def<strong>in</strong>itions and data availabilityPopulation change is def<strong>in</strong>ed as the differencebetween the size of the populationat the end and the beg<strong>in</strong>n<strong>in</strong>g of a period.It is equal to the algebraic sum of natural<strong>in</strong>crease and net migration <strong>in</strong>clud<strong>in</strong>gcorrections (see below for more details).There is negative change when both ofthese components are negative or whenone is negative and has a higher absolutevalue than the other.Natural population <strong>in</strong>crease is def<strong>in</strong>edas the difference between the number oflive births and the number of deaths dur<strong>in</strong>gthe year. The natural <strong>in</strong>crease is negative(<strong>in</strong> other words, a natural decrease)when the number of deaths exceeds thenumber of live births.Net migration is def<strong>in</strong>ed as the differencebetween immigration <strong>in</strong>to and emigrationfrom the area considered dur<strong>in</strong>g thereference year (net migration is thereforenegative when the number of emigrantsexceeds the number of immigrants).S<strong>in</strong>ce most countries either do not haveEUROPE IN FIGURES — <strong>Eurostat</strong> <strong>yearbook</strong> <strong>2009</strong>145
3 Populationaccurate <strong>figures</strong> on immigration and emigration,or have no <strong>figures</strong> at all, net migrationis generally estimated on the basisof the difference between populationchange and natural <strong>in</strong>crease between twodates (<strong>in</strong> <strong>Eurostat</strong>’s database, this conceptis generally referred to as corrected netmigration).Ma<strong>in</strong> f<strong>in</strong>d<strong>in</strong>gsDur<strong>in</strong>g the ten years through until 2007,net migration was the ma<strong>in</strong> driver of populationchange <strong>in</strong> the EU-27. Populationgrowth across the EU-27 of 2.4 millionpersons <strong>in</strong> 2007 comprised a positive netmigration of 1.9 million persons and anatural population <strong>in</strong>crease of 0.5 millionpersons.The patterns of population change varyconsiderably across the Member States.In some Member States, there were steadydecl<strong>in</strong>es <strong>in</strong> the natural population between1997 and 2007 (and <strong>in</strong>deed longer<strong>in</strong> some cases); <strong>in</strong> Germany the decl<strong>in</strong>ewas almost 1.2 million persons, and <strong>in</strong>Bulgaria, Latvia and Romania closer to0.5 million. In contrast, there were relativelyhigh natural <strong>in</strong>creases <strong>in</strong> Ireland,Spa<strong>in</strong>, France, the Netherlands and theUnited K<strong>in</strong>gdom.Negative net migration (<strong>in</strong>clud<strong>in</strong>g corrections)is relatively rare among theMember States. Over the period 2002 to2007, only six countries (Bulgaria, Latvia,Lithuania, the Netherlands, Poland andRomania) reported negative net migration.High negative values of net migration<strong>in</strong> Romania, Poland and Bulgaria,as well as <strong>in</strong> the Czech Republic andSlovakia at the beg<strong>in</strong>n<strong>in</strong>g of the decadereflect differences between populationsestimated before the last population censuscompared <strong>with</strong> census results. Thehighest positive values of net migrationover the period 2002 to 2007 were recorded<strong>in</strong> Spa<strong>in</strong> and Italy, followed by theUnited K<strong>in</strong>gdom, France and Germany.As many <strong>Europe</strong>an countries are currentlyat a po<strong>in</strong>t <strong>in</strong> the demographic cyclewhere natural population change is closeto be<strong>in</strong>g balanced or negative, the relativeimportance of migration <strong>in</strong>creases.However, as <strong>Europe</strong>’s population ages,natural population change might becomeonce aga<strong>in</strong> the pr<strong>in</strong>cipal component ofpopulation change – however, it will thenbe negative.146 EUROPE IN FIGURES — <strong>Eurostat</strong> <strong>yearbook</strong> <strong>2009</strong>
Population 3Table 3.7: Natural population change(1 000)1997 1998 1999 2000 2001 2002 2003 2004 2005 2006 2007EU-27 (1) 223.7 168.8 162.3 296.4 231.8 152.1 104.0 391.9 292.0 475.9 483.8Euro area (1) 267.9 227.0 251.5 347.8 319.7 275.2 205.4 401.3 291.0 405.4 378.5Belgium 12.4 9.7 9.3 10.0 10.7 5.6 5.1 13.7 14.7 19.8 20.0Bulgaria -57.7 -52.8 -39.5 -41.4 -44.2 -46.1 -44.6 -40.2 -42.3 -39.5 -37.7Czech Republic -22.1 -19.0 -20.3 -18.1 -17.0 -15.5 -17.6 -9.5 -5.7 1.4 10.0Denmark 7.8 7.7 7.1 9.1 7.1 5.5 7.1 8.8 9.3 9.5 8.5Germany -48.2 -67.3 -75.6 -71.8 -94.1 -122.4 -147.2 -112.6 -144.4 -148.9 -140.9Estonia -6.0 -7.3 -6.0 -5.3 -5.9 -5.4 -5.1 -3.7 -3.0 -2.4 -1.6Ireland 21.2 22.4 21.3 23.4 27.6 31.1 32.7 33.8 33.6 36.8 42.9Greece 2.3 -1.8 -2.7 -2.0 -0.3 -0.3 -1.1 0.7 2.5 6.6 2.3Spa<strong>in</strong> 19.5 4.7 9.0 37.2 46.2 50.2 57.1 82.7 79.0 111.5 106.7France : 225.1 229.2 267.5 262.9 248.3 231.3 280.7 269.6 303.3 290.0Italy -22.4 -51.0 -20.5 -12.4 -16.8 -17.5 -44.8 17.5 -34.9 2.1 -7.5Cyprus 4.1 3.4 3.4 3.1 3.3 2.7 2.9 3.1 2.8 3.6 3.1Latvia -14.7 -15.8 -13.4 -12.0 -13.3 -12.5 -11.4 -11.7 -11.3 -10.8 -9.8Lithuania -3.3 -3.7 -3.6 -4.8 -8.9 -11.1 -10.4 -10.9 -13.3 -13.5 -13.3Luxembourg 1.6 1.5 1.8 2.0 1.7 1.6 1.3 1.9 1.8 1.7 1.6Hungary -39.1 -43.6 -48.6 -38.0 -35.1 -36.0 -41.2 -37.4 -38.2 -31.7 -35.2Malta 2.0 1.7 1.3 1.5 1.1 0.9 0.9 0.9 0.7 0.7 0.8Netherlands 56.7 61.9 60.0 66.1 62.2 59.7 58.4 57.5 51.5 49.7 47.9Austria 4.6 2.9 -0.1 1.5 0.7 2.3 -0.3 4.7 3.0 3.6 1.6Poland 32.4 20.3 0.6 10.3 5.0 -5.7 -14.2 -7.4 -3.9 4.6 10.6Portugal 8.3 7.3 8.1 14.6 7.7 8.1 3.7 7.3 1.9 3.5 -1.0Romania -42.4 -31.9 -30.6 -21.3 -39.2 -59.1 -54.1 -42.6 -41.1 -38.6 -37.2Slovenia -0.8 -1.2 -1.4 -0.4 -1.0 -1.2 -2.1 -0.6 -0.7 0.8 1.4Slovakia 7.0 4.4 3.8 2.4 -0.8 -0.7 -0.5 1.9 1.0 0.6 0.6F<strong>in</strong>land 10.2 7.8 8.2 7.4 7.6 6.1 7.6 10.2 9.8 10.8 9.7Sweden -2.8 -4.2 -6.6 -3.0 -2.3 0.8 6.2 10.4 9.6 14.7 15.7United K<strong>in</strong>gdom 96.9 87.7 67.9 70.7 66.9 62.6 84.4 132.9 139.9 176.3 194.7Croatia 3.5 -5.2 -6.8 -6.5 -8.6 -10.5 -12.9 -9.4 -9.3 -8.9 -11.7FYR of Macedonia 12.9 12.4 10.5 12.1 10.1 9.8 9.0 5.4 4.1 4.0 3.1Turkey 1 056.0 1 046.0 1 024.0 948.0 940.0 933.0 925.0 917.0 911.0 906.0 897.0Iceland 2.3 2.4 2.2 2.5 2.4 2.2 2.3 2.4 2.4 2.5 2.6Liechtenste<strong>in</strong> 0.2 0.2 0.2 0.2 0.2 0.2 0.1 0.2 0.2 0.1 0.1Norway 15.2 14.2 14.1 15.2 12.7 11.0 14.0 15.8 15.5 17.3 16.5Switzerland 17.7 16.4 15.9 15.9 11.1 10.6 8.8 12.9 11.8 13.1 13.4(1) Break <strong>in</strong> series, 1998.Source: <strong>Eurostat</strong> (tps00007)EUROPE IN FIGURES — <strong>Eurostat</strong> <strong>yearbook</strong> <strong>2009</strong>147
3 PopulationFigure 3.12: Population change, net migration (<strong>in</strong>clud<strong>in</strong>g corrections) and natural populationchange, EU-27(million)32101997 1998 1999 2000 2001 2002 2003 2004 2005 2006 2007Population change (1)Net migrationNatural population change (2)(1) Break <strong>in</strong> series, 1998; provisional data for 2007.(2) Provisional data for 2007.Source: <strong>Eurostat</strong> (tps00006, tsdde230 and tps00007)Figure 3.13: Net migration (<strong>in</strong>clud<strong>in</strong>g corrections) and natural population change, 2002-2007(average annual change, %)2.52.01.51.00.50.0-0.5-1.0BelgiumBulgariaCzech RepublicDenmarkGermanyEstoniaIrelandGreeceSpa<strong>in</strong>FranceItalyCyprusLatviaLithuaniaLuxembourgHungaryMaltaNetherlandsAustriaPolandPortugalRomaniaSloveniaSlovakiaF<strong>in</strong>landSwedenUnited K<strong>in</strong>gdomCroatiaFYR of MacedoniaTurkey (1)IcelandLiechtenste<strong>in</strong>NorwaySwitzerland(1) Break <strong>in</strong> series, 2007.Source: <strong>Eurostat</strong> (demo_g<strong>in</strong>d)Net migrationNatural population <strong>in</strong>crease148 EUROPE IN FIGURES — <strong>Eurostat</strong> <strong>yearbook</strong> <strong>2009</strong>
Population 33.4 Families and birthsIntroductionFamily structures differ from one MemberState to another, reflect<strong>in</strong>g different historicaldevelopments, social attitudes andtraditions. However, there are a numberof common demographic characteristicsthat are apparent across the whole of theEU, <strong>in</strong>clud<strong>in</strong>g: a reduction <strong>in</strong> the numberof marriages; an <strong>in</strong>crease <strong>in</strong> the averageage at which people marry; and an <strong>in</strong>crease<strong>in</strong> the number of divorces. Thesetrends have resulted <strong>in</strong> more householdsand households of a smaller average size,as a higher proportion of people livealone. The changes observed <strong>in</strong> the agestructure of the EU-27’s population mayalso expla<strong>in</strong>, to some degree, the grow<strong>in</strong>gproportion of people liv<strong>in</strong>g alone. Indeed,the highest proportion of people liv<strong>in</strong>galone is found among the elderly.The slowdown <strong>in</strong> the EU-27’s populationgrowth can be partly attributed tothe fact that people are generally hav<strong>in</strong>gfewer children. Fertility rates have fallen<strong>in</strong> the EU <strong>in</strong> recent decades. A total fertilityrate of around 2.1 children per womanis considered to be the replacement level– <strong>in</strong> other words, the average number ofchildren per woman required to keep thenatural population stable <strong>in</strong> the long-run,under the theoretical assumption of nomigration. The total fertility rate of theEU-27 decl<strong>in</strong>ed from almost 2.6 <strong>in</strong> thefirst half of the 1960s to about 1.4 dur<strong>in</strong>gthe period 1995 to 2005.While fertility rates of women aged lessthan 30 have decl<strong>in</strong>ed s<strong>in</strong>ce the 1970s,fertility rates of those aged 30 or morehave risen s<strong>in</strong>ce the 1980s. As such, partof the decl<strong>in</strong>e <strong>in</strong> fertility <strong>with</strong><strong>in</strong> the EUis likely to be a result of postponement ofchildbear<strong>in</strong>g.Relatively high fertility rates tend to berecorded <strong>in</strong> those Member States whichhave implemented a range of familyfriendlypolicies, such as the <strong>in</strong>troductionof accessible and affordable childcareand/or more flexible work<strong>in</strong>g patterns(France, the Nordic countries, or theNetherlands). Most commentators agreethat fertility will <strong>in</strong>crease if there arestimuli, such as higher economic growthand security, more childcare facilities,fiscal measures that support families,family benefit <strong>in</strong>come, a stock of suitablehous<strong>in</strong>g, or a range of policies designedto reconcile work and family life, suchas more flexible work<strong>in</strong>g arrangements(part-time or telework). While a conventionalanalysis of decl<strong>in</strong><strong>in</strong>g fertility ratesmight suggest that the decl<strong>in</strong>e <strong>in</strong> fertilityrates could be related to <strong>in</strong>creased femaleparticipation <strong>in</strong> the labour market,there is clear evidence of a positive relationship<strong>in</strong> many countries, for example,<strong>in</strong> the Nordic countries or Spa<strong>in</strong>, wheretertiary-educated women <strong>in</strong> employmenttend to have more children than less educatedwomen.Def<strong>in</strong>itions and data availabilityLive births are def<strong>in</strong>ed as the birth ofchildren that showed any sign of life; theyrefer to the number of births exclud<strong>in</strong>gstillbirths (total births <strong>in</strong>clude live birthsand stillbirths). Stillbirths are def<strong>in</strong>edas the expulsion or extraction from themother of a dead foetus after the time atwhich it would normally be presumedcapable of <strong>in</strong>dependent extra-uter<strong>in</strong>e existence(commonly taken to be after 24 or28 weeks of gestation). Live births outsidemarriage are def<strong>in</strong>ed as births wherethe mother’s marital status at the time ofEUROPE IN FIGURES — <strong>Eurostat</strong> <strong>yearbook</strong> <strong>2009</strong>149
3 Populationbirth is other than married. The crudebirth rate is the ratio of the number ofbirths dur<strong>in</strong>g the year to the average population<strong>in</strong> that year; the value is expressedper 1 000 <strong>in</strong>habitants.Total fertility rates are def<strong>in</strong>ed as themean number of children that would beborn alive to a woman dur<strong>in</strong>g her lifetimeif she were to pass through her childbear<strong>in</strong>gyears conform<strong>in</strong>g to the fertility ratesby age of a given year. The total fertilityrate is therefore the completed fertility ofa hypothetical generation, computed byadd<strong>in</strong>g the fertility rates by age for women<strong>in</strong> a given year (the number of womenat each age is assumed to be the same).The mean age of women at childbear<strong>in</strong>gis def<strong>in</strong>ed as the mean age of womenwhen their children are born. For a givencalendar year, the mean age of women atchildbear<strong>in</strong>g can be calculated us<strong>in</strong>g fertilityrates by age (<strong>in</strong> general, the reproductiveperiod is between 15 and 49 yearsof age).The crude marriage rate is the ratio ofthe number of marriages dur<strong>in</strong>g the yearto the average population <strong>in</strong> that year; thevalue is expressed per 1 000 <strong>in</strong>habitants.In a similar ve<strong>in</strong>, the crude divorce rateis the ratio of the number of divorces dur<strong>in</strong>gthe year to the average population <strong>in</strong>that year; the value is expressed per 1 000<strong>in</strong>habitants. Divorce is possible <strong>in</strong> all EUMember States, except Malta; <strong>in</strong> almostall countries divorces are registered at acourt.Ma<strong>in</strong> f<strong>in</strong>d<strong>in</strong>gsS<strong>in</strong>ce the 1960 and the beg<strong>in</strong>n<strong>in</strong>g of the21st century, the number of births <strong>in</strong><strong>Europe</strong> decl<strong>in</strong>ed sharply, through to arelative low of just under 5 million births<strong>in</strong> 2002. S<strong>in</strong>ce then, there has been asteady and moderate rebound. This broadtrend was reflected <strong>in</strong> the developmentsfor many of the Member States. However,the number of births has cont<strong>in</strong>ued to decl<strong>in</strong>erelatively steadily <strong>in</strong> some countries,such as Germany and the Netherlands. Incontrast, the number of births <strong>in</strong> Spa<strong>in</strong>has risen strongly and steadily dur<strong>in</strong>g theten-year period through until 2007.Crude birth rates express the number ofbirths <strong>in</strong> relation to the whole population:the <strong>Europe</strong>an crude birth rate (10.2 birthsper 1 000 <strong>in</strong>habitants) was the lowestamong the cont<strong>in</strong>ents and approximatelyhalf the world average of 21.1 for the period2000 to 2005. The EU-27 rate fluctuateddur<strong>in</strong>g this five-year period between10.3 and 10.6, which was slightly abovethe latest crude birth rates registeredfor Russia (9.9) or Japan (9.0), but lowerthan those recorded for Ch<strong>in</strong>a (13.6), theUnited States (14.1) or India (25.1).The fertility rate of women <strong>in</strong> <strong>Europe</strong> fellat a relatively fast pace between the early1960s and late 1990s, from an averageof 2.58 children per woman to 1.40 children.This trend was reflected across mostof the cont<strong>in</strong>ents, <strong>with</strong> average rates forthe world as a whole decl<strong>in</strong><strong>in</strong>g from 4.98children to 2.65 children <strong>in</strong> the same period.Among the Member States, Francehad the highest fertility rate, reach<strong>in</strong>g anaverage of two children per woman <strong>in</strong>2006. In contrast, some of the lowest fertilityrates <strong>in</strong> the EU-27 were registered<strong>in</strong> southern and eastern <strong>Europe</strong>, the lowestbe<strong>in</strong>g <strong>in</strong> Slovakia (1.24 children perwoman <strong>in</strong> 2006).150 EUROPE IN FIGURES — <strong>Eurostat</strong> <strong>yearbook</strong> <strong>2009</strong>
Population 3As well as hav<strong>in</strong>g fewer children, womenhave tended to have their children later<strong>in</strong> life. The mean age for women giv<strong>in</strong>gbirth rose to over 30 <strong>in</strong> seven of theMember States (Spa<strong>in</strong>, Ireland, Italy,the Netherlands, Sweden, Denmark andF<strong>in</strong>land) by 2006, and was between 29and 30 <strong>in</strong> a further n<strong>in</strong>e of the MemberStates. The trend for postpon<strong>in</strong>g birthwas, <strong>in</strong> the last decade, most prevalent<strong>in</strong> the Czech Republic, the Baltic States,Hungary and Slovenia, where the averageage of women giv<strong>in</strong>g birth rose by at leasttwo years <strong>in</strong> the period 1996 to 2006.Across the EU-27 as a whole, the numberof marriages per 1 000 persons decreased;the rate was about 5 % lower <strong>in</strong> the yearsafter 2000 than dur<strong>in</strong>g the late 1990s. InCyprus, there was a strong decl<strong>in</strong>e <strong>in</strong> themarriage rate between 2001 and 2007 (almosthalv<strong>in</strong>g to 7.5 marriages per 1 000persons), and a more steady and prolongeddecl<strong>in</strong>e <strong>in</strong> the Netherlands to 4.5marriages per 1 000 persons <strong>in</strong> 2007.Although marriage is a form of commitmentof union between partners, irreparabledifferences can lead to divorce.The number of divorces <strong>in</strong> the EU-27grew steadily to pass one million a year<strong>in</strong> 2005, the equivalent of about 42 per100 marriages, or, <strong>in</strong> terms of an annualrate, two divorces per 1 000 persons eachyear. When marriage ends <strong>in</strong> divorce, themean duration of each marriage exceedsten years <strong>in</strong> every Member State, ris<strong>in</strong>g tonearly 17 years <strong>in</strong> Italy.Table 3.8: Average number of live births per year(1 000)1960-65 65-70 70-75 75-80 80-85 85-90 90-95 95-00 00-05World 111 829 117 740 119 550 120 479 128 653 136 825 135 888 133 632 133 493<strong>Europe</strong> (1) 11 873 10 838 10 453 10 128 10 080 9 806 8 366 7 431 7 419Africa 14 449 16 066 18 151 20 550 23 311 25 728 27 850 30 062 32 816Asia 70 704 76 143 75 917 74 190 78 945 84 627 82 844 79 547 76 623Lat<strong>in</strong> America and the Caribbean 9 691 10 233 10 804 11 389 11 769 11 790 11 757 11 683 11 601Northern America 4 663 4 002 3 735 3 760 4 064 4 356 4 518 4 341 4 461Oceania 449 459 491 463 484 518 554 567 5731960-65 65-70 70-75 75-80 80-85 85-90 90-95 95-00 00-05EU-27 (2) 7 609 7 457 6 897 6 475 6 130 5 905 5 483 5 108 5 072Ch<strong>in</strong>a 26 313 28 798 25 131 20 745 21 627 24 721 21 555 19 848 17 569India 19 108 20 241 21 699 23 452 25 048 26 524 27 890 27 728 27 408Japan 1 662 1 793 2 147 1 759 1 533 1 281 1 213 1 213 1 141Russian Federation 2 585 1 854 2 027 2 163 2 371 2 363 1 620 1 326 1 441United States 4 197 3 618 3 383 3 396 3 689 3 973 4 123 3 992 4 124(1) EU-27, Albania, Andorra, Belarus, Bosnia and Herzegov<strong>in</strong>a, Croatia, Faeroe Islands, Iceland, Liechtenste<strong>in</strong>, the former YugoslavRepublic of Macedonia, Republic of Moldova, Montenegro, Norway, the Russian Federation, Serbia, Switzerland and the Ukra<strong>in</strong>e.(2) Break <strong>in</strong> series, 1998.Source: <strong>Eurostat</strong> (tps00111), United Nations, Population Division of the Department of Economic and Social AffairsEUROPE IN FIGURES — <strong>Eurostat</strong> <strong>yearbook</strong> <strong>2009</strong>151
3 PopulationTable 3.9: Number of live births(1 000)1997 1998 1999 2000 2001 2002 2003 2004 2005 2006 2007EU-27 (1) 5 117.9 5 074.8 5 073.4 5 121.6 5 022.1 4 993.3 5 040.8 5 117.0 5 134.6 5 223.1 5 266.1Euro area (1) 3 200.1 3 191.4 3 221.6 3 287.3 3 236.6 3 230.3 3 245.8 3 281.9 3 269.4 3 308.0 3 308.0Belgium 116.2 114.2 114.2 114.9 114.2 111.2 112.1 115.6 118.0 121.4 120.7Bulgaria 64.1 65.4 72.3 73.7 68.2 66.5 67.4 69.9 71.1 74.0 75.3Czech Republic 90.7 90.5 89.5 90.9 90.7 92.8 93.7 97.7 102.2 105.8 114.6Denmark 67.6 66.2 66.2 67.1 65.5 64.1 64.7 64.6 64.3 65.0 64.1Germany 812.2 785.0 770.7 767.0 734.5 719.3 706.7 705.6 685.8 672.7 682.7Estonia 12.6 12.2 12.4 13.1 12.6 13.0 13.0 14.0 14.4 14.9 15.8Ireland 52.8 54.0 53.9 54.8 57.9 60.5 61.5 62.0 61.0 64.2 70.6Greece 102.0 100.9 100.6 103.3 102.3 103.6 104.4 105.7 107.5 112.0 110.0Spa<strong>in</strong> 369.0 365.2 380.1 397.6 406.4 418.8 441.9 454.6 466.4 483.0 488.3France 758.1 768.6 776.5 808.2 804.1 793.6 793.9 800.2 807.8 830.3 816.5Italy 534.5 515.4 537.2 543.1 535.3 538.2 544.1 562.6 554.0 560.0 563.2Cyprus 9.3 8.9 8.5 8.4 8.2 7.9 8.1 8.3 8.2 8.7 8.5Latvia 18.8 18.4 19.4 20.2 19.7 20.0 21.0 20.3 21.5 22.3 23.3Lithuania 37.8 37.0 36.4 34.1 31.5 30.0 30.6 30.4 30.5 31.3 32.3Luxembourg 5.5 5.4 5.6 5.7 5.5 5.3 5.3 5.5 5.4 5.5 5.5Hungary 100.4 97.3 94.6 97.6 97.0 96.8 94.6 95.1 97.5 99.9 97.6Malta 4.8 4.7 4.4 4.4 4.0 3.9 4.1 3.9 3.9 3.9 3.9Netherlands 192.4 199.4 200.4 206.6 202.6 202.1 200.3 194.0 187.9 185.1 180.9Austria 84.0 81.2 78.1 78.3 75.5 78.4 76.9 79.0 78.2 77.9 76.3Poland 412.6 395.6 382.0 378.3 368.2 353.8 351.1 356.1 364.4 374.2 387.9Portugal 113.0 113.5 116.0 120.0 112.8 114.4 112.5 109.3 109.4 105.4 102.5Romania 236.9 237.3 234.6 234.5 220.4 210.5 212.5 216.3 221.0 219.5 214.7Slovenia 18.2 17.9 17.5 18.2 17.5 17.5 17.3 18.0 18.2 18.9 19.6Slovakia 59.1 57.6 56.2 55.2 51.1 50.8 51.7 53.7 54.4 53.9 54.4F<strong>in</strong>land 59.3 57.1 57.6 56.7 56.2 55.6 56.6 57.8 57.7 58.8 58.7Sweden 90.5 89.0 88.2 90.4 91.5 95.8 99.2 100.9 101.3 105.9 107.4United K<strong>in</strong>gdom 726.6 716.9 700.0 679.0 669.1 668.8 695.5 716.0 722.5 748.6 770.7Croatia 55.5 47.1 45.2 43.7 41.0 40.1 39.7 40.3 42.5 41.4 42.0FYR of Macedonia 29.5 29.2 27.3 29.3 27.0 27.8 27.0 23.4 22.5 22.6 22.7Turkey 1 480.0 1 472.0 1 451.0 1 363.0 1 362.0 1 362.0 1 361.0 1 360.0 1 361.0 1 362.0 1 361.0Iceland 4.2 4.2 4.1 4.3 4.1 4.0 4.1 4.2 4.3 4.4 4.5Liechtenste<strong>in</strong> 0.4 0.4 0.4 0.4 0.4 0.4 0.3 0.4 0.4 0.4 0.4Norway 59.8 58.4 59.3 59.2 56.7 55.4 56.5 57.0 56.8 58.5 58.5Switzerland 80.6 78.9 78.4 78.5 72.3 72.4 71.8 73.1 72.9 73.4 74.4(1) Break <strong>in</strong> series, 1998.Source: <strong>Eurostat</strong> (tps00111)152 EUROPE IN FIGURES — <strong>Eurostat</strong> <strong>yearbook</strong> <strong>2009</strong>
Population 3Table 3.10: Crude birth rate(‰)1960-65 65-70 70-75 75-80 80-85 85-90 90-95 95-00 00-05World 35.1 33.4 30.8 28.3 27.6 27.0 24.7 22.6 21.1<strong>Europe</strong> (1) 19.2 16.8 15.7 14.8 14.4 13.7 11.5 10.2 10.2Africa 48.0 47.0 46.5 45.9 45.1 43.2 40.8 38.9 37.7Asia 39.2 37.7 33.5 29.5 28.5 27.9 25.0 22.2 20.1Lat<strong>in</strong> America and the Caribbean 41.0 37.9 35.3 33.0 30.6 27.8 25.3 23.2 21.5Northern America 22.0 17.7 15.7 15.1 15.5 15.8 15.5 14.1 13.8Oceania 26.7 24.5 24.0 21.0 20.4 20.1 19.9 18.9 17.81960-65 65-70 70-75 75-80 80-85 85-90 90-95 95-00 00-05EU-27 (2) 18.3 17.4 15.6 14.3 13.3 12.6 11.6 10.6 10.4Ch<strong>in</strong>a 38.0 36.9 28.6 21.5 20.9 22.3 18.2 16.0 13.6India 40.7 38.8 37.3 36.0 34.3 32.5 30.7 27.7 25.1Japan 17.2 17.6 19.9 15.4 12.9 10.5 9.7 9.6 9.0Russian Federation 21.0 14.4 15.3 15.9 16.8 16.2 10.9 8.9 9.9United States 21.8 17.7 15.7 15.1 15.6 15.9 15.7 14.4 14.1(1) EU-27, Albania, Andorra, Belarus, Bosnia and Herzegov<strong>in</strong>a, Croatia, Faeroe Islands, Iceland, Liechtenste<strong>in</strong>, the former YugoslavRepublic of Macedonia, Republic of Moldova, Montenegro, Norway, the Russian Federation, Serbia, Switzerland and the Ukra<strong>in</strong>e.(2) Break <strong>in</strong> series, 1998.Source: <strong>Eurostat</strong> (tps00112), United Nations, Population Division of the Department of Economic and Social AffairsFigure 3.14: Live births outside marriage and crude birth rate, EU-2710.83810.63410.43010.22610.01997 1998 1999 2000 2001 2002 2003 2004 2005 2006 2007Crude birth rate (‰, left-hand scale) (1)Live births outside marriage (%, right-hand scale) (2)22(1) Break <strong>in</strong> series, 1998; provisional data for 2007.(2) Not available for 2007; exclud<strong>in</strong>g Belgium from 1998 onwards; exclud<strong>in</strong>g Italy for 2004 and 2006.Source: <strong>Eurostat</strong> (tps00112 and demo_fagec)EUROPE IN FIGURES — <strong>Eurostat</strong> <strong>yearbook</strong> <strong>2009</strong>153
3 PopulationTable 3.11: Total fertility rate(mean number of children per woman)1996 1997 1998 1999 2000 2001 2002 2003 2004 2005 2006Belgium 1.59 1.60 : : : : : : : : :Bulgaria 1.23 1.09 1.11 1.23 1.26 1.20 1.21 1.23 1.29 1.31 1.37Czech Republic 1.18 1.17 1.16 1.13 1.14 1.14 1.17 1.18 1.22 1.28 1.33Denmark 1.75 1.76 1.73 1.75 1.78 1.76 1.72 1.76 1.78 1.80 1.83Germany 1.32 1.37 1.36 1.36 1.38 1.35 1.34 1.34 1.36 1.34 1.32Estonia 1.37 1.32 1.28 1.32 1.39 1.34 1.37 1.37 1.47 1.50 1.55Ireland 1.88 1.93 1.93 1.89 1.88 1.93 1.96 1.95 1.93 1.86 1.90Greece 1.28 1.28 1.26 1.24 1.26 1.25 1.27 1.28 1.30 1.33 1.39Spa<strong>in</strong> 1.16 1.17 1.16 1.19 1.23 1.24 1.26 1.31 1.33 1.35 1.38France : : 1.78 1.81 1.89 1.90 1.88 1.89 1.92 1.94 2.00Italy 1.20 1.21 : 1.23 1.26 1.25 1.27 1.29 : 1.32 :Cyprus 1.95 1.86 1.76 1.67 1.64 1.57 1.49 1.50 1.49 1.42 1.47Latvia 1.18 1.14 1.12 1.19 1.24 1.21 1.23 1.29 1.24 1.31 1.35Lithuania 1.49 1.47 1.46 1.46 1.39 1.30 1.24 1.26 1.26 1.27 1.31Luxembourg 1.77 1.72 1.68 1.74 1.76 1.65 1.63 1.62 1.66 1.66 1.65Hungary 1.46 1.37 1.32 1.28 1.32 1.31 1.30 1.27 1.28 1.31 1.34Malta : : : : : : : : : 1.38 1.41Netherlands 1.53 1.56 1.63 1.65 1.72 1.71 1.73 1.75 1.73 1.71 1.70Austria 1.45 1.39 1.37 1.34 1.36 1.33 1.39 1.38 1.42 1.41 1.40Poland 1.59 1.52 1.44 1.37 1.35 1.32 1.25 1.22 1.23 1.24 1.27Portugal 1.44 1.47 1.47 1.50 1.55 1.45 1.47 1.44 1.40 1.40 1.35Romania 1.37 1.40 1.40 1.39 1.39 1.31 1.26 1.27 1.29 1.32 1.31Slovenia 1.28 1.25 1.23 1.21 1.26 1.21 1.21 1.20 1.25 1.26 1.31Slovakia 1.47 1.43 1.37 1.33 1.29 1.20 1.18 1.20 1.24 1.25 1.24F<strong>in</strong>land 1.76 1.75 1.70 1.74 1.73 1.73 1.72 1.77 1.80 1.80 1.84Sweden 1.60 1.52 1.50 1.50 1.54 1.57 1.65 1.71 1.75 1.77 1.85United K<strong>in</strong>gdom 1.73 1.72 1.71 1.68 1.64 1.63 1.64 1.71 1.77 1.78 1.84Croatia : : : : 1.47 1.38 : 1.32 1.34 1.41 1.38FYR of Macedonia 2.07 1.93 1.90 1.76 1.88 1.73 1.80 1.77 1.52 1.46 1.46Iceland 2.12 2.04 2.05 1.99 2.08 1.95 1.93 1.99 2.04 2.05 2.08Liechtenste<strong>in</strong> : : : : 1.57 1.52 1.47 1.37 1.44 1.49 1.42Norway 1.89 1.86 1.81 1.84 1.85 1.78 1.75 1.80 1.83 1.84 1.90Switzerland 1.50 1.48 1.47 1.48 1.50 1.38 1.39 1.39 1.42 1.42 1.43Source: <strong>Eurostat</strong> (tsdde220)154 EUROPE IN FIGURES — <strong>Eurostat</strong> <strong>yearbook</strong> <strong>2009</strong>
Population 3Table 3.12: Average fertility rates(mean number of children per woman)1960-65 65-70 70-75 75-80 80-85 85-90 90-95 95-00 00-05World 4.98 4.90 4.47 3.92 3.58 3.38 3.05 2.80 2.65<strong>Europe</strong> (1) 2.58 2.36 2.16 1.97 1.89 1.83 1.57 1.40 1.41Africa 6.87 6.80 6.72 6.61 6.45 6.13 5.68 5.28 4.98Asia 5.65 5.67 5.04 4.19 3.67 3.40 2.97 2.67 2.47Lat<strong>in</strong> America and the Caribbean 5.97 5.54 5.04 4.48 3.92 3.41 3.03 2.73 2.52Northern America 3.35 2.55 2.01 1.78 1.81 1.89 1.99 1.95 1.99Oceania 3.98 3.57 3.23 2.73 2.59 2.51 2.48 2.42 2.37Ch<strong>in</strong>a 5.72 6.06 4.86 3.32 2.55 2.46 1.92 1.78 1.70India 5.82 5.61 5.26 4.89 4.50 4.15 3.86 3.46 3.11Japan 2.02 2.00 2.07 1.81 1.76 1.66 1.49 1.39 1.29Russian Federation 2.55 2.02 2.03 1.94 2.04 2.12 1.55 1.25 1.30United States 3.31 2.55 2.02 1.79 1.83 1.92 2.03 1.99 2.04(1) EU-27, Albania, Andorra, Belarus, Bosnia and Herzegov<strong>in</strong>a, Croatia, Faeroe Islands, Iceland, Liechtenste<strong>in</strong>, the former YugoslavRepublic of Macedonia, Republic of Moldova, Montenegro, Norway, the Russian Federation, Serbia, Switzerland and the Ukra<strong>in</strong>e.Source: United Nations, Population Division of the Department of Economic and Social AffairsFigure 3.15: Mean age of women at childbear<strong>in</strong>g (1)(years)35302520Spa<strong>in</strong>Italy (2)IrelandNetherlandsSwedenDenmarkF<strong>in</strong>landLuxembourgGreeceCyprusFrance (3)SloveniaGermanyPortugalAustriaUnited K<strong>in</strong>gdom (3)Czech RepublicHungaryEstoniaPolandSlovakia (2, 3)LatviaLithuaniaRomaniaBulgariaBelgium (4)Liechtenste<strong>in</strong> (3)SwitzerlandNorwayIcelandCroatia (3)FYR of Macedonia1996 2006(1) Malta, not available.(2) 2005 <strong>in</strong>stead of 2006.(3) Not available for 1996.(4) Not available for 2006.Source: <strong>Eurostat</strong> (tps00017)EUROPE IN FIGURES — <strong>Eurostat</strong> <strong>yearbook</strong> <strong>2009</strong>155
3 PopulationTable 3.13: Marriages(per 1 000 persons)1997 1998 1999 2000 2001 2002 2003 2004 2005 2006 2007EU-27 (1) 5.15 5.11 5.2 5.18 4.87 4.89 4.85 4.86 4.88 : :Euro area : : : 5.12 4.82 4.82 4.7 4.64 4.61 4.45 :Belgium 4.69 4.35 4.32 4.40 4.09 3.91 4.03 4.15 4.12 4.25 4.28Bulgaria 4.18 4.31 4.33 4.30 3.99 3.71 3.92 3.99 4.33 4.26 3.87Czech Republic 5.61 5.35 5.20 5.39 5.12 5.17 4.79 5.04 5.06 5.15 5.53Denmark 6.48 6.55 6.66 7.19 6.82 6.92 6.50 6.98 6.67 6.71 6.70Germany 5.15 5.09 5.25 5.09 4.73 4.75 4.64 4.80 4.71 4.54 4.48Estonia 3.99 3.92 4.06 4.01 4.14 4.31 4.21 4.45 4.55 5.18 5.23Ireland 4.25 4.52 4.93 5.04 4.98 5.23 5.08 5.07 5.13 5.13 :Greece 5.62 5.12 5.62 4.48 5.21 5.27 5.54 4.64 5.50 5.18 5.16Spa<strong>in</strong> 4.96 5.21 5.21 5.38 5.11 5.12 5.05 5.06 4.83 4.61 :France 4.87 4.64 4.87 5.03 4.84 4.65 4.56 4.46 4.51 4.34 4.19Italy 4.88 4.92 4.93 4.99 4.58 4.65 4.48 4.28 4.23 4.13 4.21Cyprus 10.71 11.40 13.22 14.08 15.07 14.48 7.69 7.23 7.76 6.80 7.50Latvia 3.98 4.00 3.93 3.88 3.93 4.16 4.30 4.48 5.45 6.39 6.80Lithuania 5.26 5.21 5.07 4.83 4.53 4.66 4.91 5.57 5.84 6.26 6.83Luxembourg 4.78 4.80 4.86 4.92 4.49 4.53 4.43 4.36 4.41 4.16 4.10Hungary 4.56 4.37 4.44 4.71 4.28 4.53 4.48 4.33 4.39 4.42 4.06Malta 6.43 6.51 6.35 6.60 5.58 5.66 5.90 5.99 5.88 6.25 6.06Netherlands 5.45 5.54 5.66 5.53 4.97 5.20 4.86 4.51 4.52 4.35 4.49Austria 5.20 4.91 4.94 4.90 4.25 4.52 4.58 4.71 4.75 4.46 4.33Poland 5.30 5.42 5.68 5.49 5.10 5.02 5.12 5.02 5.42 5.93 6.52Portugal 6.52 6.57 6.75 6.23 5.67 5.45 5.15 4.68 4.61 4.52 4.37Romania 6.68 6.46 6.23 6.05 5.87 5.92 6.16 6.61 6.56 6.79 8.78Slovenia 3.78 3.80 3.89 3.62 3.48 3.54 3.39 3.28 2.88 3.17 3.17Slovakia 5.19 5.10 5.07 4.81 4.42 4.66 4.83 5.18 4.85 4.81 5.08F<strong>in</strong>land 4.56 4.66 4.70 5.05 4.79 5.19 4.95 5.61 5.58 5.36 5.58Sweden 3.65 3.57 4.03 4.50 4.02 4.26 4.36 4.79 4.92 5.02 5.24United K<strong>in</strong>gdom 5.32 5.21 5.13 5.19 4.84 4.94 5.14 5.20 5.23 : :Croatia 5.40 5.35 5.27 4.93 4.97 5.13 5.03 5.11 4.98 4.97 :FYR of Macedonia 7.05 6.97 7.03 7.03 : 7.15 7.11 6.92 7.12 7.31 7.58Turkey : : : : : : 6.80 8.75 9.05 8.91 :Iceland 5.46 5.58 5.62 6.32 5.21 5.75 5.29 5.19 5.42 5.53 :Liechtenste<strong>in</strong> 12.55 : : 7.23 5.99 5.19 4.37 4.76 5.38 4.31 5.10Norway 5.41 5.27 5.26 5.65 5.09 5.30 4.90 4.06 4.84 4.66 4.98Switzerland 5.52 5.44 5.69 5.53 4.98 5.51 5.46 5.34 5.40 5.32 5.34(1) Break <strong>in</strong> series, 1998.Source: <strong>Eurostat</strong> (tps00012)156 EUROPE IN FIGURES — <strong>Eurostat</strong> <strong>yearbook</strong> <strong>2009</strong>
Population 3Table 3.14: Divorces(per 1 000 persons)1997 1998 1999 2000 2001 2002 2003 2004 2005 2006 2007EU-27 (1) 1.8 1.8 1.8 1.8 1.9 1.9 2.0 2.0 2.0 : :Belgium 2.6 2.6 2.6 2.6 2.8 3.0 3.0 3.0 2.9 2.8 2.9Bulgaria 1.1 1.3 1.2 1.3 1.3 1.3 1.5 1.9 1.9 1.9 2.1Czech Republic 3.2 3.1 2.3 2.9 3.1 3.1 3.8 3.2 3.1 3.1 3.0Denmark 2.4 2.5 2.5 2.7 2.7 2.8 2.9 2.9 2.8 2.6 2.6Germany 2.3 2.3 2.3 2.4 2.4 2.5 2.6 2.6 2.4 2.3 :Estonia 3.8 3.2 3.3 3.1 3.2 3.0 2.9 3.1 3.0 2.8 2.8Ireland 0.0 0.4 0.6 0.7 0.7 0.7 0.7 0.8 0.8 : :Greece 0.9 0.7 0.9 1.0 1.1 1.0 1.1 1.1 1.2 1.3 1.2Spa<strong>in</strong> 0.9 0.9 0.9 0.9 1.0 1.0 1.1 1.2 1.7 : :France 2.0 2.0 2.0 1.9 1.9 1.9 2.1 2.2 2.5 2.2 :Italy 0.6 0.6 0.6 0.7 0.7 0.7 0.8 0.8 0.8 : 0.8Cyprus 1.3 1.3 1.7 1.7 1.7 1.9 2.0 2.2 2.0 2.3 2.1Latvia 2.5 2.6 2.5 2.6 2.4 2.5 2.1 2.3 2.8 3.2 3.3Lithuania 3.2 3.3 3.2 3.1 3.2 3.0 3.1 3.2 3.3 3.3 3.4Luxembourg 2.4 2.4 2.4 2.4 2.3 2.4 2.3 2.3 2.3 2.5 2.3Hungary 2.4 2.5 2.5 2.3 2.4 2.5 2.5 2.4 2.5 2.5 2.5Malta - - - - - - - - - - -Netherlands 2.2 2.1 2.1 2.2 2.3 2.1 1.9 1.9 2.0 1.9 2.0Austria 2.3 2.2 2.3 2.4 2.6 2.4 2.3 2.4 2.4 2.5 2.4Poland 1.1 1.2 1.1 1.1 1.2 1.2 1.3 1.5 1.8 1.9 1.7Portugal 1.4 1.5 1.7 1.9 1.8 2.7 2.2 2.2 2.2 2.3 2.4Romania 1.6 1.8 1.6 1.4 1.4 1.5 1.5 1.6 1.5 1.5 1.7Slovenia 1.0 1.0 1.0 1.1 1.1 1.2 1.2 1.2 1.3 1.2 1.4Slovakia 1.7 1.7 1.8 1.7 1.8 2.0 2.0 2.0 2.1 2.4 2.3F<strong>in</strong>land 2.6 2.7 2.7 2.7 2.6 2.6 2.6 2.5 2.6 2.5 2.5Sweden 2.4 2.3 2.4 2.4 2.4 2.4 2.4 2.2 2.2 2.2 2.3United K<strong>in</strong>gdom 2.8 2.7 2.7 2.6 2.7 2.7 2.8 2.8 2.6 : :Croatia 0.9 0.9 0.8 1.0 1.1 1.0 1.1 1.1 1.1 1.1 :FYR of Macedonia 0.5 0.5 0.5 0.7 0.7 0.6 0.7 0.8 0.8 0.7 0.7Turkey : : : : : : 0.7 1.3 1.3 1.3 :Iceland 1.9 1.8 1.7 1.9 1.9 1.8 1.8 1.9 1.9 1.6 :Liechtenste<strong>in</strong> 2.1 : : 3.9 2.5 2.9 2.5 2.9 2.7 2.3 2.8Norway 2.3 2.1 2.0 2.2 2.3 2.3 2.4 2.4 2.4 2.3 2.2Switzerland 2.4 2.5 2.9 1.5 2.2 2.2 2.3 2.4 2.9 2.8 2.6(1) Break <strong>in</strong> series, 1998.Source: <strong>Eurostat</strong> (tps00013)EUROPE IN FIGURES — <strong>Eurostat</strong> <strong>yearbook</strong> <strong>2009</strong>157
3 Population3.5 Life expectancyIntroductionAnother contribut<strong>in</strong>g factor to the age<strong>in</strong>gof the EU’s population is a gradual<strong>in</strong>crease <strong>in</strong> life expectancies. This may,at least <strong>in</strong> part, be attributed to higherstandards of liv<strong>in</strong>g, better healthcare, aswell as more awareness of health issues.A set of health expectancy <strong>in</strong>dicators havebeen developed to extend the concept oflife expectancy to cover morbidity anddisability, so as to assess the quality oflife; these <strong>in</strong>dicators are <strong>in</strong>cluded <strong>in</strong> thelist of structural <strong>in</strong>dicators on the basis ofwhich the Commission draws up its annualsynthesis report, thereby <strong>in</strong>tegrat<strong>in</strong>gpublic health <strong>in</strong>to the Lisbon strategy.The EC Treaty (Title XIII Public Health,Article 152) states that ‘Community action,which shall complement nationalpolicies, shall be directed towards improv<strong>in</strong>gpublic health, prevent<strong>in</strong>g humanillness and diseases, and obviat<strong>in</strong>g sourcesof danger to human health.’ The ongo<strong>in</strong>gprogramme of Community action<strong>in</strong> the field of public health (2003-2008)targets the follow<strong>in</strong>g objectives:• to improve <strong>in</strong>formation and knowledgefor the development of publichealth;• to enhance the capability of respond<strong>in</strong>grapidly and <strong>in</strong> a co-ord<strong>in</strong>atedfashion to threats <strong>in</strong> health;• and to promote health and preventdisease through address<strong>in</strong>g healthdeterm<strong>in</strong>ants across all policies andactivities.The <strong>Europe</strong>an Commission report on‘Long-term care <strong>in</strong> the <strong>Europe</strong>an Union’released <strong>in</strong> April 2008, analyses the ma<strong>in</strong>challenges Member States face <strong>in</strong> thefield of long-term care, their strategiesfor tackl<strong>in</strong>g them and presents possiblesolutions (7) .Def<strong>in</strong>itions and data availabilityAccord<strong>in</strong>g to the United Nations (UN)def<strong>in</strong>ition, a death is the permanent disappearanceof all evidence of life at anytime after live birth has taken place (postnatalcessation of vital functions <strong>with</strong>outcapacity of resuscitation); this def<strong>in</strong>itiontherefore excludes foetal deaths.Life expectancy can be given for any age.It relates to the mean number of years stillto be lived by a person who has reached acerta<strong>in</strong> age, if subjected throughout therest of his or her life to the current mortalityconditions (age-specific probabilitiesof dy<strong>in</strong>g). The most common life expectancy<strong>figures</strong> relate to life expectancyat birth, measured as the mean numberof years that a newborn child can expectto live if subjected throughout his/herlife to the current mortality conditions;<strong>in</strong> this publication life expectancy is alsopresented at age 65.Health expectancies extend the conceptof life expectancy to morbidity and disability,<strong>in</strong> order to assess the quality of life.These are composite <strong>in</strong>dicators that comb<strong>in</strong>emortality data <strong>with</strong> data referr<strong>in</strong>g(7) http://ec.europa.eu/employment_social/news/2008/apr/long_term_care_en.pdf.158 EUROPE IN FIGURES — <strong>Eurostat</strong> <strong>yearbook</strong> <strong>2009</strong>
Population 3to health. The Healthy Life Years (HLY)<strong>in</strong>dicator measures the number of rema<strong>in</strong><strong>in</strong>gyears that a person of a specificage is still expected to live <strong>in</strong> a healthycondition. A healthy condition is def<strong>in</strong>edby the absence of limitations <strong>in</strong> function<strong>in</strong>g/disability.Therefore, the <strong>in</strong>dicator isalso called disability-free life expectancy(DFLE). HLY <strong>in</strong>dicators are calculated bygender, at birth, and at the age of 65.Ma<strong>in</strong> f<strong>in</strong>d<strong>in</strong>gsIncreas<strong>in</strong>g life expectancy is one of themany factors that contribute towards<strong>Europe</strong>’s age<strong>in</strong>g population profile. This<strong>in</strong>dicator has gradually risen for malesand females <strong>in</strong> <strong>Europe</strong>, as <strong>in</strong> other worldregions, and this trend is expected tocont<strong>in</strong>ue. EU-27 life expectancy of a boyat birth was 75.2 years <strong>in</strong> 2004, while thelife expectancy of a newborn girl was justover six years higher at 81.5 years. Thererema<strong>in</strong> quite large variations <strong>in</strong> life expectanciesacross the EU-27. For males,the lowest life expectancy <strong>in</strong> 2006 wasrecorded <strong>in</strong> Lithuania (65.3 years) andthe highest <strong>in</strong> Sweden and Cyprus (both78.8); for women, the range was narrower,from a low of 76.2 years <strong>in</strong> Romania toa high of 84.4 <strong>in</strong> both Spa<strong>in</strong> and France.Gender differences <strong>in</strong> life expectancywere, <strong>in</strong> the 1960s, associated <strong>with</strong> unfavourablemale mortality. This patternwas reversed <strong>in</strong> the 1980s as the gendergap closed <strong>in</strong> north western <strong>Europe</strong>, followedby southern <strong>Europe</strong> <strong>in</strong> the 1990s.The difference <strong>in</strong> life expectancies hasbeen further narrowed <strong>in</strong> recent years,as the growth <strong>in</strong> female life expectancyslowed somewhat. The convergence oflife expectancy <strong>figures</strong> may be a consequenceof more similar circumstances<strong>in</strong> terms of the lifestyles led by men andwomen <strong>in</strong> the EU – for example, fewermen are work<strong>in</strong>g <strong>in</strong> areas of the economywhere high degrees of physical effort arerequired throughout the work<strong>in</strong>g day(agriculture, m<strong>in</strong><strong>in</strong>g, or the manufactureof iron and steel). Nevertheless, persistentlyhigher male mortality is recordedthroughout the entire life cycle and <strong>with</strong>respect to all of the ma<strong>in</strong> causes of death.Health expectancies can be used to measurethe potential of the population toparticipate <strong>in</strong> society. There are manyMember States that are <strong>in</strong> the process ofimplement<strong>in</strong>g or consider<strong>in</strong>g changes totheir statutory age for retirement, as wellas the promotion of policies that activelyencourage older persons to rema<strong>in</strong> <strong>in</strong>work longer. In 2005, for most countries,healthy life years at birth for females wereabove those for men. The exceptions <strong>in</strong>cludedCyprus, the Netherlands, Portugal,Sweden, Iceland and Norway, where menat birth had 1 to 2 years of healthy lifemore (compared <strong>with</strong> women).As people are liv<strong>in</strong>g longer there hasbeen a grow<strong>in</strong>g <strong>in</strong>terest <strong>in</strong> the older generations– both as potential actors <strong>in</strong> theworkforce, or as a specific market of consumers.This is borne out when look<strong>in</strong>g atthe life expectancy of those persons whoare aged 65; <strong>in</strong> 2006, the average man ofthis age could be expected to live an additional12.7 years <strong>in</strong> Latvia, ris<strong>in</strong>g to18.2 additional years <strong>in</strong> France. The lifeexpectancy of women at the age of 65was higher, rang<strong>in</strong>g from 16.3 years <strong>in</strong>Bulgaria to 22.7 years <strong>in</strong> France.EUROPE IN FIGURES — <strong>Eurostat</strong> <strong>yearbook</strong> <strong>2009</strong>159
3 PopulationTable 3.15: Life expectancy at birth(years)MaleFemale1996 1998 2000 2002 2004 2006 1996 1998 2000 2002 2004 2006EU-27 : : : 74.5 75.2 : : : : 80.9 81.5 :Euro area : : : 76.0 76.8 : : : : 82.2 82.8 :Belgium 73.9 74.4 74.6 75.1 76.0 76.6 80.7 80.7 81.0 81.2 81.8 82.3Bulgaria 67.4 67.4 68.4 68.8 68.9 69.2 74.5 74.6 75.0 75.5 75.8 76.3Czech Republic 70.4 71.2 71.7 72.1 72.6 73.5 77.5 78.2 78.5 78.7 79.2 79.9Denmark 73.1 74.0 74.5 74.8 75.4 76.1 78.3 79.0 79.2 79.4 80.2 80.7Germany 73.6 74.5 75.1 75.7 76.5 77.2 80.1 80.8 81.2 81.3 81.9 82.4Estonia 64.3 64.1 65.5 65.3 66.4 67.4 75.6 75.4 76.2 77.0 77.8 78.6Ireland 73.1 73.4 74.0 75.2 76.4 77.3 78.7 79.1 79.2 80.5 81.4 82.1Greece 75.1 75.4 75.5 76.2 76.6 77.2 80.2 80.3 80.6 81.1 81.3 81.9Spa<strong>in</strong> 74.5 75.3 75.8 76.3 76.9 77.7 82.0 82.4 82.9 83.2 83.7 84.4France : 74.8 75.3 75.7 76.7 77.3 : 82.6 83.0 83.0 83.8 84.4Italy 75.5 76.1 77.0 77.4 77.9 : 81.8 82.2 82.9 83.2 83.8 :Cyprus : : : 76.4 76.8 78.8 : : : 81.0 82.1 82.4Latvia : : : 64.7 65.9 65.4 : : : 76.0 76.2 76.3Lithuania 64.6 66.0 66.8 66.2 66.3 65.3 75.9 76.6 77.5 77.5 77.7 77.0Luxembourg 73.3 73.7 74.6 74.6 75.9 76.8 80.2 80.8 81.3 81.5 82.3 81.9Hungary 66.3 66.5 67.6 68.3 68.7 69.2 75.0 75.6 76.2 76.7 77.2 77.8Malta 74.8 74.9 76.2 76.3 77.4 77.0 79.6 80.0 80.3 81.3 81.2 81.9Netherlands 74.7 75.2 : 76.0 76.9 77.7 80.5 80.8 : 80.7 81.5 82.0Austria 73.7 74.5 75.2 75.8 76.4 77.2 80.2 81.0 81.2 81.7 82.1 82.8Poland 68.1 68.9 69.6 70.3 70.6 70.9 76.6 77.4 78.0 78.8 79.2 79.7Portugal 71.6 72.4 73.2 73.8 75.0 75.5 79.0 79.5 80.2 80.6 81.5 82.3Romania 65.1 66.3 67.7 67.3 68.2 69.2 72.8 73.8 74.8 74.7 75.5 76.2Slovenia 71.1 71.3 72.2 72.6 73.5 74.5 79.0 79.2 79.9 80.5 80.8 82.0Slovakia 68.8 68.6 69.2 69.8 70.3 70.4 77.0 77.0 77.5 77.7 78.0 78.4F<strong>in</strong>land 73.1 73.6 74.2 74.9 75.4 75.9 80.7 81.0 81.2 81.6 82.5 83.1Sweden 76.6 76.9 77.4 77.7 78.4 78.8 81.7 82.1 82.0 82.1 82.8 83.1United K<strong>in</strong>gdom 74.3 74.8 75.5 76.0 76.8 : 79.5 79.8 80.3 80.6 81.0 :Croatia : : 70.7 : 71.9 72.5 : : 77.7 : 78.8 79.3FYR of Macedonia 70.3 70.2 70.8 70.6 71.5 71.7 74.8 74.4 75.2 75.6 75.8 76.2Iceland 76.5 77.7 77.8 78.6 78.9 79.5 81.2 81.6 81.6 82.5 83.2 82.9Liechtenste<strong>in</strong> 72.3 73.6 73.9 77.1 78.5 78.9 81.6 82.1 79.9 82.3 85.1 83.1Norway 75.4 75.6 76.0 76.4 77.6 78.2 81.2 81.4 81.5 81.6 82.6 82.9Switzerland 76.0 76.4 77.0 77.9 78.6 79.2 82.2 82.7 82.8 83.2 83.8 84.2Source: <strong>Eurostat</strong> (tps00025)160 EUROPE IN FIGURES — <strong>Eurostat</strong> <strong>yearbook</strong> <strong>2009</strong>
Population 3Figure 3.16: Life expectancy at birth, 2006 (1)(years)90807060EU-27Euro areaSpa<strong>in</strong>SwedenFranceItalyCyprusAustriaNetherlandsGermanyIrelandGreeceF<strong>in</strong>landBelgiumMaltaLuxembourgUnited K<strong>in</strong>gdomPortugalDenmarkSloveniaCzech RepublicPolandSlovakiaHungaryEstoniaBulgariaRomaniaLithuaniaLatviaSwitzerlandIcelandLiechtenste<strong>in</strong>NorwayCroatiaFYR of MacedoniaMaleFemale(1) The United K<strong>in</strong>gdom, 2005; EU-27, euro area and Italy, 2004; the figure is ranked on the average of male and female.Source: <strong>Eurostat</strong> (tps00025)Figure 3.17: Life expectancy at 65, 2006 (1)(years)2520151050EU-27Euro areaFranceSpa<strong>in</strong>ItalySwedenF<strong>in</strong>landAustriaGermanyBelgiumCyprusLuxembourgNetherlandsIrelandGreecePortugalUnited K<strong>in</strong>gdomSloveniaMaltaDenmarkPolandCzech RepublicEstoniaHungaryLithuaniaSlovakiaRomaniaLatviaBulgariaSwitzerlandIcelandLiechtenste<strong>in</strong>NorwayCroatiaFYR of MacedoniaMaleFemale(1) The United K<strong>in</strong>gdom, 2005; EU-27, euro area and Italy, 2004; the figure is ranked on the average of male and female.Source: <strong>Eurostat</strong> (tsdde210)EUROPE IN FIGURES — <strong>Eurostat</strong> <strong>yearbook</strong> <strong>2009</strong>161
3 Population3.6 Migration and asylumIntroductionMigration is <strong>in</strong>fluenced by a comb<strong>in</strong>ationof economic, political and social factors.These factors may act <strong>in</strong> a migrant’scountry of orig<strong>in</strong> (push factors) or <strong>in</strong> thecountry of dest<strong>in</strong>ation (pull factors). Therelative economic prosperity and politicalstability of the EU are thought to exert aconsiderable pull effect on immigrants.International migration may <strong>in</strong>creas<strong>in</strong>glybe used as a tool to solve specific labourmarket shortages, but alone will almostcerta<strong>in</strong>ly not be enough to reverse the ongo<strong>in</strong>gtrend of population age<strong>in</strong>g.Migration policies are <strong>in</strong>creas<strong>in</strong>gly concerned<strong>with</strong> attract<strong>in</strong>g a particular migrantprofile, often <strong>in</strong> an attempt to alleviatespecific skills shortages. Selectioncan be carried out on the basis of languageproficiency, work experience, educationand/or age, or alternatively by employersso that migrants already have ajob upon their arrival. Besides policies toencourage labour recruitment, immigrationpolicy is often focused on two areas:prevent<strong>in</strong>g unauthorised migration (8) andthe illegal employment of migrants whoare not permitted to work, and promot<strong>in</strong>gthe <strong>in</strong>tegration of immigrants <strong>in</strong>tosociety. Significant resources have beenmobilised to fight people smuggl<strong>in</strong>g andtraffick<strong>in</strong>g networks <strong>in</strong> the EU.Some of the most important legal textsadopted <strong>in</strong> the area of immigration<strong>in</strong>clude:• Council Directive 2003/86/EC on theright to family reunification (9) ;• Council Directive 2003/109/EC ona long-term resident status for thirdcountry nationals (10) ;• Council Directive 2004/1 14/EC onthe admission of students (11) , and;• Council Directive 2005/71/EC for thefacilitation of the admission of researchers<strong>in</strong>to the EU (12) .The Commission re-launched <strong>in</strong> 2005the debate on the need for a common setof rules for the admission of economicmigrants <strong>with</strong> a Green Paper on an EUapproach to manag<strong>in</strong>g economic migration(13) , which led to the adoption of a‘policy plan on legal migration’ at the endof 2005 (14) . In July 2006 the Commissionadopted a communication on policypriorities <strong>in</strong> the fight aga<strong>in</strong>st illegal immigrationof third-country nationals (15)which aims to strike a balance betweensecurity and basic rights of <strong>in</strong>dividualsdur<strong>in</strong>g all stages of the illegal immigrationprocess. In June 2007, Council conclusionson the strengthen<strong>in</strong>g of <strong>in</strong>tegrationpolicies <strong>in</strong> the EU by promot<strong>in</strong>gunity <strong>in</strong> diversity were adopted, while <strong>in</strong>September 2007, the Commission presentedits third annual report on migrationand <strong>in</strong>tegration (16) .(8) In June 2008, the <strong>Europe</strong>an Parliament approved at first read<strong>in</strong>g a new Directive on the return of illegal immigrants, akey step towards a <strong>Europe</strong>an immigration policy that aims to encourage the voluntary return of illegal immigrants butotherwise lay down m<strong>in</strong>imum standards for their treatment.(9) http://eur-lex.europa.eu/LexUriServ/site/en/oj/2003/l_251/l_25120031003en00120018.pdf.(10) http://eur-lex.europa.eu/LexUriServ/site/en/oj/2004/l_016/l_01620040123en00440053.pdf.(11) http://eur-lex.europa.eu/LexUriServ/site/en/oj/2004/l_375/l_37520041223en00120018.pdf.(12) http://eur-lex.europa.eu/LexUriServ/site/en/oj/2005/l_289/l_28920051103en00150022.pdf.(13) COM(2004) 811; http://ec.europa.eu/justice_home/doc_centre/immigration/work/doc/com_2004_811_en.pdf.(14) COM(2005) 669; http://eur-lex.europa.eu/LexUriServ/site/en/com/2005/com2005_0669en01.pdf.(15) COM(2006) 402; http://eur-lex.europa.eu/LexUriServ/site/en/com/2006/com2006_0402en01.pdf.(16) COM(2007) 512; http://ec.europa.eu/justice_home/fsj/immigration/docs/com_2007_512_en.pdf.162 EUROPE IN FIGURES — <strong>Eurostat</strong> <strong>yearbook</strong> <strong>2009</strong>
Population 3The 1951 Geneva Convention relat<strong>in</strong>g tothe Status of Refugees (as amended by the1967 New York Protocol) has for morethan 50 years def<strong>in</strong>ed who is a refugee,and laid down a common approach towardsrefugees that has been one of thecornerstones for the development of acommon asylum system <strong>with</strong><strong>in</strong> the EU.Asylum is a form of protection given bya state on its territory. It is granted to aperson who is unable to seek protection<strong>in</strong> his/her country of citizenship and/orresidence, <strong>in</strong> particular for fear of be<strong>in</strong>gpersecuted for reasons of race, religion,nationality, membership of a particularsocial group, or political op<strong>in</strong>ion.S<strong>in</strong>ce the beg<strong>in</strong>n<strong>in</strong>g of 1990s, the flow ofpersons seek<strong>in</strong>g <strong>in</strong>ternational protection<strong>in</strong> the EU has been such that the MemberStates have decided to f<strong>in</strong>d common solutionsto this challenge. The <strong>Europe</strong>anCommission adopted on 17 February2006 a communication on strengthenedpractical cooperation <strong>in</strong> the area of asylumpresent<strong>in</strong>g a vision of how MemberStates should further cooperate on asylum<strong>with</strong> a view to the establishment ofa fully harmonised EU system. A numberof directives <strong>in</strong> this area have been developed,the four ma<strong>in</strong> legal <strong>in</strong>struments onasylum <strong>in</strong>clud<strong>in</strong>g:• the Reception ConditionsDirective (17) ;(18)• the Asylum Procedures Directive ;(19)• the Qualification Directive , and;(20)• the Dubl<strong>in</strong> Regulation .The EU is also focus<strong>in</strong>g on the need forbetter coord<strong>in</strong>ation <strong>in</strong> partnership <strong>with</strong>third countries to deal more effectively<strong>with</strong> root causes and to provide for durablesolutions to resolve refugee situations.In this context, the Council has <strong>in</strong>vitedthe Commission to develop RegionalProtection Programmes (RPP) to enhanceprotection capacity and developresettlement programmes. A new f<strong>in</strong>ancial<strong>in</strong>strument was adopted <strong>in</strong> March2004 to establish a programme for f<strong>in</strong>ancialand technical assistance to thirdcountries <strong>in</strong> the area of migration andasylum (AENEAS); it is a multi-annualprogramme for the period 2004-2008.Def<strong>in</strong>itions and data availability<strong>Eurostat</strong> produces statistics on a rangeof issues related to <strong>in</strong>ternational migrationand asylum. Data are supplied on amonthly, quarterly and annual basis bynational statistical <strong>in</strong>stitutes and by m<strong>in</strong>istriesof justice and the <strong>in</strong>terior. Whereassome Member States base their migrationflow and migrant population stock statisticson population registers, others mayuse sample surveys or data extracted fromadm<strong>in</strong>istrative procedures such as the issu<strong>in</strong>gof residence permits. Many statisticsare currently sent to <strong>Eurostat</strong> as partof a jo<strong>in</strong>t migration data collection organisedby <strong>Eurostat</strong> <strong>in</strong> cooperation <strong>with</strong> theUnited Nations Statistical Division, theUnited Nations Economic Commissionfor <strong>Europe</strong> and the International LabourOffice.(17) Council Directive 2003/9/EC of 27 January 2003; http://eur-lex.europa.eu/LexUriServ/LexUriServ.do?uri=OJ:L:2003:031:0018:0025:EN:PDF.(18) Council Directive 2005/85/EC of 1 December 2005; http://eur-lex.europa.eu/LexUriServ/LexUriServ.do?uri=OJ:L:2005:326:0013:0034:EN:PDF.(19) Council Directive 2004/83/EC of 29 April 2004 on m<strong>in</strong>imum standards for the qualification and status of third countrynationals or stateless persons as refugees or as persons who otherwise need <strong>in</strong>ternational protection and the content ofthe protection granted; http://eur-lex.europa.eu/LexUriServ/LexUriServ.do?uri=CELEX:32004L0083:EN:HTML.(20) Council Regulation (EC) No 343/2003 of 18 February 2003 establish<strong>in</strong>g the criteria and mechanisms for determ<strong>in</strong><strong>in</strong>g theMember State responsible for exam<strong>in</strong><strong>in</strong>g an asylum application lodged <strong>in</strong> one of the Member States by a third-countrynational; http://eur-lex.europa.eu/LexUriServ/LexUriServ.do?uri=OJ:L:2003:050:0001:0010:EN:PDF.EUROPE IN FIGURES — <strong>Eurostat</strong> <strong>yearbook</strong> <strong>2009</strong>163
3 PopulationMost important areas of Community statisticshave a clear basis <strong>in</strong> <strong>Europe</strong>an law,def<strong>in</strong><strong>in</strong>g the responsibilities of MemberStates and of <strong>Eurostat</strong> <strong>in</strong> terms of the collection,transmission and publication ofdata. The migration statistics doma<strong>in</strong>had been unusual <strong>in</strong> not hav<strong>in</strong>g a legalbase, be<strong>in</strong>g <strong>in</strong>stead governed by a series ofvoluntary agreements between <strong>Eurostat</strong>and the data suppliers <strong>in</strong> Member States.While this may have been appropriate <strong>in</strong>the past, it became clear that the grow<strong>in</strong>gpolicy importance of this subject at bothnational and <strong>Europe</strong>an level meant thata more formal approach was necessary.In the autumn of 2005 the Commissionadopted a proposal for a regulation onstatistics on migration and <strong>in</strong>ternationalprotection, which was adopted by the<strong>Europe</strong>an Parliament and the Council bythe summer of 2007 (21) . The adoption ofthe Regulation 862/2007 is designed as astep towards the provision of reliable andharmonised statistics on migration andasylum.The focus of the Regulation is to provideharmonised statistical def<strong>in</strong>itions basedon exist<strong>in</strong>g <strong>in</strong>ternational standards andon <strong>Europe</strong>an legislation and policy onimmigration, asylum and border controlissues. Although these def<strong>in</strong>itions mustbe applied, Member States rema<strong>in</strong> free touse any appropriate data sources, accord<strong>in</strong>gto national availability and practice.The Regulation allows for the use of scientificallysound estimates <strong>in</strong> cases wheredirectly observed data are not available.To allow Member States time to makenecessary amendments to their data collectionsystems, the proposed Regulationalso allows for data to be supplied accord<strong>in</strong>gto national def<strong>in</strong>itions <strong>in</strong> thefirst year follow<strong>in</strong>g its com<strong>in</strong>g <strong>in</strong>to force(2008), which will then be reported <strong>in</strong> thefollow<strong>in</strong>g year. The Regulation provides aframework which needs to be completedthrough the adoption of implement<strong>in</strong>gmeasures <strong>in</strong> the form of CommissionRegulations.The Regulation covers most of <strong>Eurostat</strong>’sexist<strong>in</strong>g statistics on migration relatedissues. Statistics on immigration andemigration flows, together <strong>with</strong> statisticson the citizenship and country of birthcomposition of the resident population,provide <strong>in</strong>formation on the impact ofmigration on the size and structure ofthe population. Statistics on asylum applicationsand the subsequent decisionsto grant or refuse refugee status or othertypes of <strong>in</strong>ternational protection will beadapted somewhat under the Regulation.For example, asylum applications statisticswill be collected on a monthly basisas these are needed to allow a cont<strong>in</strong>uousmonitor<strong>in</strong>g of short-term variations<strong>in</strong> the orig<strong>in</strong> and numbers of asylumseekers. In comparison, data on appealsaga<strong>in</strong>st asylum decisions are relativelycomplex to collect and are not needed sofrequently – and so will only be collectedannually.The only new area of statistics covered bythe Regulation is that of residence permitsissued to non-EU citizens. These statisticsoffer a useful <strong>in</strong>sight <strong>in</strong>to the reasons forimmigration – as a dist<strong>in</strong>ction can bemade between permits issued under differentimmigration rules regard<strong>in</strong>g thereunification of families, economic migrants,and persons admitted as students.A further aspect of the Regulation is thatmost of the statistics to be collected will<strong>in</strong>clude a disaggregation by age and sex.This is of particular <strong>in</strong>terest when try<strong>in</strong>gto monitor policies aimed at prevent<strong>in</strong>gthe traffick<strong>in</strong>g of women and children.(21) Regulation (EC) No 862/2007 of the <strong>Europe</strong>an Parliament and of the Council of 11 July 2007; http://eur-lex.europa.eu/LexUriServ/site/en/oj/2007/l_199/l_19920070731en00230029.pdf.164 EUROPE IN FIGURES — <strong>Eurostat</strong> <strong>yearbook</strong> <strong>2009</strong>
Population 3A national citizen is def<strong>in</strong>ed as a personwho is a citizen of the country <strong>in</strong>which he or she is currently resident.Non-nationals are persons who are notcitizens of the country <strong>in</strong> which they arecurrently resident.Net migration is the difference betweenimmigration <strong>in</strong>to and emigration fromthe country dur<strong>in</strong>g the year (net migrationis therefore negative when the number ofemigrants exceeds the number of immigrants).S<strong>in</strong>ce several countries either donot have accurate <strong>figures</strong> on immigrationand emigration or have no <strong>figures</strong> at all,net migration is sometimes estimated onthe basis of the difference between populationchange and natural <strong>in</strong>crease betweentwo dates. These statistics on net migration(<strong>in</strong>clud<strong>in</strong>g corrections) are therefore affectedby the statistical <strong>in</strong>accuracies <strong>in</strong> thetwo components of the population changeas well as adm<strong>in</strong>istrative corrections. Netmigration gives no <strong>in</strong>dication of the relativescale of the separate immigration andemigration flows to and from a country;a country may report low net migrationbut experience very high immigration andemigration flows. Immigrants are thosepersons arriv<strong>in</strong>g or return<strong>in</strong>g from abroadto take up residence <strong>in</strong> a country for acerta<strong>in</strong> period, hav<strong>in</strong>g previously beenresident elsewhere. Emigrants are peopleleav<strong>in</strong>g their country of usual residenceand effectively tak<strong>in</strong>g up residence <strong>in</strong> anothercountry.The acquisition of citizenship refers togrants of citizenship of the report<strong>in</strong>gcountry to persons who have previouslybeen citizens of another country or whohave been stateless.An asylum applicant is def<strong>in</strong>ed as a personwho has requested protection under:either Article 1 of the 1951 Geneva(amended by the 1967 New York Protocol),or, <strong>with</strong><strong>in</strong> the remit of the United NationsConvention Aga<strong>in</strong>st Torture and otherforms of cruel or <strong>in</strong>human treatment(UNCAT) or the <strong>Europe</strong>an Conventionon Human Rights or other relevant <strong>in</strong>strumentsof protection. This def<strong>in</strong>itionis <strong>in</strong>tended to refer to all who apply forprotection on an <strong>in</strong>dividual basis, irrespectiveof whether they lodge their applicationon arrival at an airport or landborder, or from <strong>in</strong>side the country, andirrespective of whether they entered theterritory legally (for example, as a tourist)or illegally. An asylum seeker is a personawait<strong>in</strong>g a decision on an application forrefugee status or another form of <strong>in</strong>ternationalprotection. A refugee (as def<strong>in</strong>edby Article 1 of the 1951 UN Convention)is someone <strong>with</strong> a well-founded fear ofbe<strong>in</strong>g persecuted for reasons of race, religion,nationality, membership of a particularsocial group or political op<strong>in</strong>ion.Data on asylum decisions refer to thedate on which a decision was made, not tothe date of the asylum application. Datais collected on decisions at 1st <strong>in</strong>stance.Total decisions cover positive decisions,negative decisions and other non-statusdecisions. These <strong>figures</strong> only cover grantsof refugee status as def<strong>in</strong>ed by Article 1of the Geneva Convention of 28 July1951 relat<strong>in</strong>g to the status of refugees, asamended by the New York Protocol of31 January 1967; they therefore excludegrants of other types of protection statussuch as humanitarian protection.Ma<strong>in</strong> f<strong>in</strong>d<strong>in</strong>gsWhile net migration <strong>in</strong>to the EU hasbeen positive and generally ris<strong>in</strong>g s<strong>in</strong>cethe end of the 1980s, there is a volatilenature to migratory patterns over time.After a rapid <strong>in</strong>crease dur<strong>in</strong>g the firstyears of the 21st century, <strong>with</strong> 2 millionmore immigrants than emigrants <strong>in</strong>2003, net migration has decreased somewhats<strong>in</strong>ce <strong>in</strong> the EU-27. Net migrationEUROPE IN FIGURES — <strong>Eurostat</strong> <strong>yearbook</strong> <strong>2009</strong>165
3 Populationranged between 1.64 and 2.03 million perannum between 2002 and 2007, while netmigration was never over the threshold ofa million before 2002. When expressed asa ratio <strong>in</strong> relation to the total population,immigration accounted for 0.39 % of thetotal number of <strong>in</strong>habitants <strong>in</strong> the EU-27<strong>in</strong> 2007.The vast majority of the Member Statesreported positive net migration (<strong>in</strong>clud<strong>in</strong>gcorrections) the only exceptions <strong>with</strong>negative net migration (<strong>in</strong>clud<strong>in</strong>g corrections)<strong>in</strong> 2007 were Poland (-20 500),Lithuania (-5 200), the Netherlands(-1 600), Bulgaria (-1 400) and Latvia(-600). In relative terms, positive netmigration accounted for 1.64 % of thepopulation <strong>in</strong> Cyprus <strong>in</strong> 2007, whileSpa<strong>in</strong> (1.58 %), Ireland (1.49 %) andLuxembourg (1.26 %) were the only othercountries to record net migration abovethe threshold of 1 % of the total population.At the other end of the scale, theloss of population through net migrationranged from 0.01 % of the total populationof the Netherlands to 0.15 % <strong>in</strong>Lithuania.There are a number of different types ofmigration that may be identified: amongthem, economic migration (the searchfor work), family reunification, retirement,study, or asylum. In most of theMember States for which data are availablefor 2006, a majority of migrants wereat the lower end of the work<strong>in</strong>g age range(between 15 and 34 years). Indeed, <strong>in</strong> theUnited K<strong>in</strong>gdom this age group accountedfor more than three quarters of all immigrants(76.4 %).Most Member States counted more non-EU nationals than citizens of EU-27Member States among their foreign immigrants.The exceptions were Germany,Ireland, Luxembourg, Hungary, Austriaand Slovakia, where more EU-27 citizensthan non-EU citizens immigrated.Return<strong>in</strong>g nationals accounted for a m<strong>in</strong>orityof immigrants <strong>in</strong> most countries.However, <strong>in</strong> Denmark, Lithuania, Poland(permanent stays only) and F<strong>in</strong>land therewere more national immigrants return<strong>in</strong>ghome than either non-national EU-27immigrants or immigrants from countriesoutside of the EU.There are two different categories of personwhich should be taken <strong>in</strong>to accountwhen study<strong>in</strong>g asylum statistics. The first<strong>in</strong>cludes persons who have lodged anasylum claim and whose claim is underconsideration by a relevant authority. Thesecond is composed of persons who havebeen recognised, after consideration, asrefugees or have been granted anotherk<strong>in</strong>d of <strong>in</strong>ternational protection. Asylumseekersgenerally rema<strong>in</strong> <strong>with</strong><strong>in</strong> the territoryof the Member State concerneddur<strong>in</strong>g consideration of their claims. Thenumber of asylum-seekers has decreasedover the past few years <strong>in</strong> the EU, hav<strong>in</strong>gpeaked <strong>in</strong> 1992 (670 000 applications <strong>in</strong>the EU-15) and aga<strong>in</strong> <strong>in</strong> 2001 (424 000applications <strong>in</strong> the EU-27). By 2007, therewere an estimated 218 900 asylum applicationsreceived <strong>in</strong> the EU-27, a slightupturn on the figure for 2006. More applicationsfor asylum were lodged <strong>in</strong>Sweden than any other Member State <strong>in</strong>2007, <strong>with</strong> France, the United K<strong>in</strong>gdom,Greece and Germany be<strong>in</strong>g the otherma<strong>in</strong> recipients of applications. Only am<strong>in</strong>ority of asylum applicants are recognisedas refugees or are granted subsidiaryprotection. Over half (57.8 %) of allEU-27 asylum decisions <strong>in</strong> 2006 resulted<strong>in</strong> a rejection, while some 55 135 personswere granted refugee status or subsidiaryprotection the same year.166 EUROPE IN FIGURES — <strong>Eurostat</strong> <strong>yearbook</strong> <strong>2009</strong>
Population 3Table 3.16: Net migration (<strong>in</strong>clud<strong>in</strong>g corrections)(1 000)1997 1998 1999 2000 2001 2002 2003 2004 2005 2006 2007EU-27 (1) 430 529 980 725 600 1 852 2 035 1 875 1 660 1 639 1 908Euro area (1) : 434 835 975 1 235 1 658 1 806 1 606 1 404 1 319 1 579Belgium 10 12 16 14 36 41 35 36 51 53 62Bulgaria 0 0 0 0 -214 1 0 0 0 0 -1Czech Republic 12 9 9 7 -43 12 26 19 36 35 84Denmark 12 11 9 10 12 10 7 5 7 10 20Germany 93 47 202 168 275 219 142 82 82 26 48Estonia -7 -7 -1 0 0 0 0 0 0 0 0Ireland 17 16 24 32 39 33 31 48 66 67 64Greece 61 55 45 29 38 38 35 41 40 40 41Spa<strong>in</strong> 94 159 238 390 441 649 625 610 641 605 702France (1) : -1 150 158 173 184 189 105 92 90 71Italy 50 56 35 50 50 345 612 557 324 377 494Cyprus 5 4 4 4 5 7 12 16 14 9 13Latvia -9 -6 -4 -6 -5 -2 -1 -1 -1 -2 -1Lithuania -22 -22 -21 -20 -3 -2 -6 -10 -9 -5 -5Luxembourg 4 4 4 3 3 3 5 4 6 5 6Hungary 18 17 17 17 10 4 16 18 17 21 14Malta 1 0 0 10 2 2 2 2 2 2 2Netherlands 30 44 44 57 56 28 7 -10 -23 -26 -2Austria 2 8 20 17 44 35 38 62 56 29 31Poland -12 -13 -14 -410 -17 -18 -14 -9 -13 -36 -20Portugal 29 32 38 47 65 70 64 47 38 26 20Romania -13 -6 -3 -4 -558 -2 -7 -10 -7 -6 1Slovenia -1 -5 11 3 5 2 4 2 6 6 14Slovakia 2 1 1 -22 1 1 1 3 3 4 7F<strong>in</strong>land 5 4 3 2 6 5 6 7 9 11 14Sweden 6 11 14 24 29 31 29 25 27 51 54United K<strong>in</strong>gdom 58 97 138 144 151 158 178 227 193 247 175Croatia 0 -4 -23 -52 14 9 12 12 8 7 6FYR of Macedonia -2 -2 -2 -3 -3 -25 -3 0 -1 -1 0Turkey 101 99 79 58 2 -1 -3 1 -1 -3 0Iceland 0 1 1 2 1 0 0 1 4 5 4Liechtenste<strong>in</strong> 0 1 0 0 0 0 0 0 0 0 0Norway 10 13 19 10 8 17 11 13 18 24 40Switzerland -3 11 25 24 41 48 42 38 32 37 69(1) Break <strong>in</strong> series: for 1997 France <strong>in</strong>cludes metropolitan regions only.Source: <strong>Eurostat</strong> (tsdde230)EUROPE IN FIGURES — <strong>Eurostat</strong> <strong>yearbook</strong> <strong>2009</strong>167
3 PopulationFigure 3.18: Net migration (<strong>in</strong>clud<strong>in</strong>g corrections), EU-27 (1)(1 000)2 5002 0001 5001 0005000-500-1 0001961 1966 1971 1976 1981 1986 1991 1996 2001 2006(1) Break <strong>in</strong> series: up to and <strong>in</strong>clud<strong>in</strong>g 1997 France <strong>in</strong>cludes metropolitan regions only; 2007 data are provisional.Source: <strong>Eurostat</strong> (tsdde230)Figure 3.19: Net migration rate (<strong>in</strong>clud<strong>in</strong>g corrections) (1)(% of the total population)0.750.500.250.001997 1998 1999 2000 2001 2002 2003 2004 2005 2006 2007Euro areaEU-27(1) Break <strong>in</strong> series: for 1997 France <strong>in</strong>cludes metropolitan regions only; 2007 data are provisional.Source: <strong>Eurostat</strong> (tsdde230 and tps00001)168 EUROPE IN FIGURES — <strong>Eurostat</strong> <strong>yearbook</strong> <strong>2009</strong>
Population 3Figure 3.20: Net migration (<strong>in</strong>clud<strong>in</strong>g corrections), 2007 (1)(% of the population)2.01.51.00.50.0-0.5EU-27Euro areaCyprusSpa<strong>in</strong>IrelandLuxembourgItalyCzech RepublicSloveniaSwedenBelgiumMaltaAustriaDenmarkGreeceUnited K<strong>in</strong>gdomF<strong>in</strong>landPortugalHungarySlovakiaFranceGermanyEstoniaRomaniaNetherlandsBulgariaLatviaPolandLithuaniaIcelandSwitzerlandNorwayLiechtenste<strong>in</strong>CroatiaFYR of Macedonia(1) EU-27, euro area, Germany, Ireland, Greece, Spa<strong>in</strong>, France, Italy, Cyprus, Hungary, Malta, Portugal, Slovenia, the United K<strong>in</strong>gdom, theformer Yugoslav Republic of Macedonia and Liechtenste<strong>in</strong>, provisional.Source: <strong>Eurostat</strong> (tsdde230 and tps00001)Figure 3.21: Immigration by age, 2006 (1)(%)100%75%50%25%0%Czech RepublicDenmarkGermanyIrelandGreeceSpa<strong>in</strong>Italy (2)CyprusLatviaLithuaniaLuxembourgHungary65+ years15-64 years0-14 yearsNetherlandsAustriaPolandPortugalRomaniaSloveniaSlovakiaF<strong>in</strong>landUnited K<strong>in</strong>gdom (3)(1) Belgium, Bulgaria, Estonia, France and Malta, not available.(2) 2003.(3) 2005.Source: <strong>Eurostat</strong> (migr_immictz)EUROPE IN FIGURES — <strong>Eurostat</strong> <strong>yearbook</strong> <strong>2009</strong>169
3 PopulationTable 3.17: Immigration by age, 2006TotalimmigrantsImmigration by age (% of total immigration)(persons)
Population 3Figure 3.22: Immigration by broad group of citizenship, 2006 (1)(% of total immigrants)100%75%50%25%0%Belgium (2)Czech RepublicDenmarkGermanyIrelandSpa<strong>in</strong>Italy (2)CyprusLatviaLithuaniaLuxembourgHungaryNetherlandsAustriaPoland (3)Citizens of countries outside the EU-27Non nationals but citizens of other EU-27 countriesNationalsSloveniaSlovakiaF<strong>in</strong>landSwedenUnited K<strong>in</strong>gdom (4)(1) Bulgaria, Estonia, Greece, France, Malta, Portugal and Romania, not available.(2) 2003.(3) Immigrants for permanent stay only.(4) Exclud<strong>in</strong>g immigrants from Ireland, whatever their citizenship.Source: <strong>Eurostat</strong> (migr_immictz)Figure 3.23: Asylum applications, 2007 (1)(persons)40 00030 00020 00010 0000SwedenFranceUnited K<strong>in</strong>gdomGreeceGermanyAustriaBelgiumItalyPolandSpa<strong>in</strong>NetherlandsCyprusIrelandHungarySlovakiaDenmarkCzech RepublicF<strong>in</strong>landMaltaBulgariaRomaniaLuxembourgSloveniaPortugalLithuaniaLatviaEstoniaSwitzerlandNorwayIceland(1) Provisional <strong>figures</strong> for EU-27, 218 935 asylum applications <strong>in</strong> 2007; euro area, 136 100 asylum applications <strong>in</strong> 2007; Italy, Iceland,Norway and Switzerland, 2006.Source: <strong>Eurostat</strong> (tps00021)EUROPE IN FIGURES — <strong>Eurostat</strong> <strong>yearbook</strong> <strong>2009</strong>171
3 PopulationTable 3.18: Asylum applications(persons)1997 1998 1999 2000 2001 2002 2003 2004 2005 2006 2007EU-27 : 313 645 380 450 406 585 424 180 421 470 344 800 276 675 234 675 197 410 218 935Euro area : 231 670 265 105 273 400 271 355 245 335 215 480 181 720 168 720 129 855 136 100Belgium 11 790 21 965 35 780 42 690 24 505 18 800 13 585 12 400 12 575 8 870 11 575Bulgaria 370 835 1 350 1 755 2 430 2 890 1 320 985 700 500 815Czech Republic 2 110 4 085 7 355 8 790 18 095 8 485 11 400 5 300 3 590 2 730 1 585Denmark 5 100 5 700 6 530 10 345 12 510 5 945 4 390 3 235 2 280 1 960 2 225Germany 104 355 98 645 94 775 78 565 88 285 71 125 50 565 35 605 28 915 21 030 19 165Estonia 0 25 25 5 10 10 15 10 10 5 15Ireland 3 880 4 625 7 725 10 940 10 325 11 635 7 485 4 265 4 305 4 240 3 935Greece 4 375 2 950 1 530 3 085 5 500 5 665 8 180 4 470 9 050 12 265 25 115Spa<strong>in</strong> 4 975 4 935 8 405 7 925 9 490 6 310 5 765 5 365 5 050 5 295 7 195France 21 415 22 375 30 905 38 745 47 290 51 085 59 770 58 545 49 735 30 750 29 160Italy 1 890 13 100 18 450 15 195 17 400 16 015 13 705 9 630 9 345 10 350 :Cyprus : 225 790 650 1 620 950 4 405 9 675 7 715 4 540 6 780Latvia : 35 20 5 15 25 5 5 20 10 35Lithuania 240 160 145 305 425 365 395 165 100 145 125Luxembourg 435 1 710 2 930 625 685 1 040 1 550 1 575 800 525 425Hungary : 7 120 11 500 7 800 9 555 6 410 2 400 1 600 1 610 2 115 3 420Malta 70 160 255 160 155 350 455 995 1 165 1 270 1 380Netherlands 34 445 45 215 39 275 43 895 32 580 18 665 13 400 9 780 12 345 14 465 7 100Austria 6 720 13 805 20 130 18 285 30 125 39 355 32 360 24 635 22 460 13 350 11 920Poland 3 580 3 425 3 060 4 660 4 480 5 170 6 810 7 925 5 240 4 225 7 205Portugal 250 355 305 225 235 245 115 115 115 130 225Romania 1 425 1 235 1 665 1 365 2 280 1 000 885 545 485 380 660Slovenia 70 335 745 9 245 1 510 650 1 050 1 090 1 550 500 370Slovakia 645 505 1 320 1 555 8 150 9 745 10 300 11 395 3 550 2 850 2 640F<strong>in</strong>land 970 1 270 3 105 3 170 1 650 3 445 3 090 3 575 3 595 2 275 1 405Sweden 9 680 12 840 11 220 16 285 23 500 33 015 31 355 23 160 17 530 24 320 36 205United K<strong>in</strong>gdom 32 500 46 015 71 160 80 315 71 365 103 080 60 045 40 625 30 840 28 320 27 905Iceland : : : : : : : : 85 40 :Norway 2 270 8 375 10 160 10 845 14 770 17 480 16 020 7 950 5 400 5 320 :Switzerland 23 185 39 735 43 935 15 780 18 720 24 255 18 920 12 730 8 650 8 580 :Source: <strong>Eurostat</strong> (tps00021)172 EUROPE IN FIGURES — <strong>Eurostat</strong> <strong>yearbook</strong> <strong>2009</strong>
Population 3Table 3.19: Acquisition of citizenship and asylum applications(persons)Asylum decisionsAcquisition ofcitizenshipAsylumapplicationsNumber ofdecisionsof which,rejections (%)Number ofpositivedecisions2005 2006 2006 2007 2006 2007 2006 2007 2006 2007EU-27 : : 197 410 218 935 237 970 : 57.8 : 55 135 :Euro area : : 129 855 136 100 146 205 : 66.9 : 23 490 :Belgium : : 8 870 11 575 8 345 : 70.8 : 2 440 :Bulgaria : 6 738 500 815 695 770 30.9 31.8 95 335Czech Republic 2 626 2 346 2 730 1 585 3 020 2 280 72.7 68.9 365 390Denmark 10 197 7 961 1 960 2 225 925 850 81.6 44.1 170 475Germany 117 241 124 566 21 030 19 165 30 760 28 570 57.8 44.6 1 950 7 870Estonia 7 072 4 781 5 15 5 15 100.0 66.7 0 5Ireland 4 073 5 763 4 240 3 935 4 245 3 810 90.6 90.0 395 375Greece : 1 962 12 265 25 115 11 180 20 990 85.9 98.5 195 165Spa<strong>in</strong> 42 860 62 375 5 295 7 195 4 065 5 400 95.0 95.5 205 245France 154 827 147 868 30 750 29 160 37 495 29 150 92.4 88.5 2 855 3 350Italy : 35 266 10 350 : 9 260 : 39.7 : 5 215 :Cyprus 3 952 : 4 540 6 780 5 585 7 170 31.9 32.3 170 210Latvia 20 106 18 964 10 35 15 20 0.0 50.0 10 10Lithuania 435 467 145 125 130 145 19.2 34.5 95 60Luxembourg 954 1 128 525 425 890 1 035 55.6 41.5 370 540Hungary : 6 101 2 115 3 420 2 020 2 805 60.1 49.0 200 250Malta : 474 1 270 1 380 1 185 955 53.6 34.6 550 625Netherlands 28 488 29 089 14 465 7 100 14 180 : 53.0 : 4 345 :Austria 34 876 25 746 13 350 11 920 15 490 16 045 37.9 41.4 4 065 5 195Poland 2 866 989 4 225 7 205 7 280 6 185 12.8 29.7 2 465 3 035Portugal : 3 627 130 225 105 110 71.4 77.3 30 25Romania 767 29 380 660 365 590 74.0 57.6 55 135Slovenia 2 684 3 204 500 370 900 540 63.3 50.0 10 10Slovakia 1 393 1 125 2 850 2 640 2 815 2 970 30.6 39.7 10 95F<strong>in</strong>land 5 683 4 433 2 275 1 405 2 520 2 020 61.1 51.7 695 840Sweden 39 573 51 239 24 320 36 205 46 395 32 470 27.3 37.5 22 745 15 640United K<strong>in</strong>gdom 161 755 154 015 28 320 27 905 27 520 27 630 74.2 70.5 5 045 6 805Croatia : 12 292 : : : : : : : :FYR of Macedonia 2 660 2 147 : : : : : : : :Turkey 6 901 5 072 : : : : : : : :Iceland : : 40 : 30 : 66.7 : 0 :Norway 12 655 11 955 5 320 : 4 215 : 48.0 : 1 685 :Switzerland 38 437 46 711 8 580 : : : : : : :Source: <strong>Eurostat</strong> (tps00024, tps00021, tps00163 and tps00164)EUROPE IN FIGURES — <strong>Eurostat</strong> <strong>yearbook</strong> <strong>2009</strong>173
EducationEducation, vocational tra<strong>in</strong><strong>in</strong>g and more generally lifelong learn<strong>in</strong>g play a vital role<strong>in</strong> both an economic and social context. The opportunities which the EU offers itscitizens for liv<strong>in</strong>g, study<strong>in</strong>g and work<strong>in</strong>g <strong>in</strong> other countries make a major contributionto cross-cultural understand<strong>in</strong>g, personal development and the realisation of the EU’sfull economic potential. Each year, well over a million EU citizens of all ages benefitfrom EU-funded educational, vocational and citizenship-build<strong>in</strong>g programmes.The Treaty establish<strong>in</strong>g the <strong>Europe</strong>an Community (1) acknowledged the importanceof these areas by stat<strong>in</strong>g that ‘the Community shall contribute to the development ofquality education by encourag<strong>in</strong>g cooperation between Member States and, if necessary,by support<strong>in</strong>g and supplement<strong>in</strong>g their action … The Community shall implementa vocational tra<strong>in</strong><strong>in</strong>g policy which shall support and supplement the action ofthe Member States’. As such, the <strong>Europe</strong>an Commission follows up on policy cooperationand work <strong>with</strong> the Member States, while fund<strong>in</strong>g programmes, such as the LifelongLearn<strong>in</strong>g Programme (LLP).The <strong>Europe</strong>an Council adopted <strong>in</strong> 2001 a set of goals and objectives for education andtra<strong>in</strong><strong>in</strong>g systems that are to be atta<strong>in</strong>ed by 2010 (2) , <strong>with</strong> education m<strong>in</strong>isters agree<strong>in</strong>gon three goals:• to improve the quality and effectiveness of education and tra<strong>in</strong><strong>in</strong>g systems;• to ensure that they are accessible to all;• to open up education and tra<strong>in</strong><strong>in</strong>g to the wider world.These ambitious goals were subsequently subdivided <strong>in</strong>to specific objectives cover<strong>in</strong>gthe various types and levels of education and tra<strong>in</strong><strong>in</strong>g, <strong>in</strong>clud<strong>in</strong>g areas such as: teachertra<strong>in</strong><strong>in</strong>g; basic skills; the <strong>in</strong>tegration of <strong>in</strong>formation and communication technologies(ICTs); efficiency of <strong>in</strong>vestments; language learn<strong>in</strong>g; lifelong guidance; flexibility tomake learn<strong>in</strong>g accessible to all; mobility; and citizenship education.(1) Consolidated version of the Treaty establish<strong>in</strong>g the <strong>Europe</strong>an Community, Chapter 3, Articles 149(1) and 150(1) (OJ C 352,24.12.2002, p. 33); http://eur-lex.europa.eu/en/treaties/dat/12002E/pdf/12002E_EN.pdf.(2) http://ec.europa.eu/education/policies/2010/doc/repfutobjen.pdf.EUROPE IN FIGURES — <strong>Eurostat</strong> <strong>yearbook</strong> <strong>2009</strong>175
4 EducationUnder the pr<strong>in</strong>ciple of subsidiarity everyMember State reta<strong>in</strong>s responsibility fororganis<strong>in</strong>g their education system anddecid<strong>in</strong>g its content. The EU does howeverpromote cooperation <strong>in</strong> this fieldthrough a variety of fund<strong>in</strong>g and actionprogrammes. Indeed, political cooperationhas been strengthened throughthe Education and Tra<strong>in</strong><strong>in</strong>g 2010 workprogramme which <strong>in</strong>tegrates previousactions <strong>in</strong> the fields of education andtra<strong>in</strong><strong>in</strong>g at a <strong>Europe</strong>an level. Five EUbenchmarks were set for 2010:• to limit the rate of early school leaversto no more than 10 %;• to <strong>in</strong>crease to at least 15 % the totalnumber of graduates <strong>in</strong> maths, scienceand technology, while at the sametime, reduc<strong>in</strong>g the gender imbalance<strong>in</strong> these subjects;• to aim for 85 % of 22 year olds tohave completed an upper secondaryeducation;• to halve the number of low-achiev<strong>in</strong>g15 year olds <strong>in</strong> read<strong>in</strong>g, maths and science,and;• to <strong>in</strong>crease the EU average level ofparticipation <strong>in</strong> lifelong learn<strong>in</strong>g to atleast 12.5 % of the adult work<strong>in</strong>g-agepopulation (25 to 64 years old).As of 2007, the Lifelong Learn<strong>in</strong>g Programmebecome the flagship programme<strong>in</strong> the field of education and tra<strong>in</strong><strong>in</strong>g,cover<strong>in</strong>g all learn<strong>in</strong>g opportunitiesfrom childhood to old age. Over the period2007 to 2013, this programme has abudget of EUR 7 000 million <strong>in</strong> order tosupport projects that foster <strong>in</strong>terchange,cooperation and mobility between educationand tra<strong>in</strong><strong>in</strong>g systems <strong>with</strong><strong>in</strong> the EU.It is made-up of four sub-programmesthat focus on the different stages of educationand tra<strong>in</strong><strong>in</strong>g:• Comenius for schools;• Erasmus for higher education;• Leonardo da V<strong>in</strong>ci for vocational educationand tra<strong>in</strong><strong>in</strong>g, and;• Grundtvig for adult education.Quantified targets have been set for eachof the sub programmes:• Comenius should <strong>in</strong>volve at leastthree million pupils <strong>in</strong> jo<strong>in</strong>t educationalactivities, over the period of theprogramme;• Erasmus should reach a total of threemillion <strong>in</strong>dividual participants <strong>in</strong> studentmobility actions;• Leonardo da V<strong>in</strong>ci should <strong>in</strong>creaseplacements <strong>in</strong> enterprises to 80 000persons per year by the end of the programme,and;• Grundtvig should support the mobilityof 7 000 <strong>in</strong>dividuals <strong>in</strong>volved <strong>in</strong>adult education each year by 2013The measurement of progress towardsthese objectives <strong>with</strong><strong>in</strong> the field of educationpolicy requires a range of comparablestatistics on enrolment <strong>in</strong> educationand tra<strong>in</strong><strong>in</strong>g, numbers of graduates andteachers, language learn<strong>in</strong>g, student andresearcher mobility, educational expenditure,as well as data on educational atta<strong>in</strong>mentand adult learn<strong>in</strong>g.176 EUROPE IN FIGURES — <strong>Eurostat</strong> <strong>yearbook</strong> <strong>2009</strong>
Education 44.1 School enrolmentand levels of educationThe standards on <strong>in</strong>ternational statisticson education com<strong>in</strong>g from adm<strong>in</strong>istrativesources are set by three <strong>in</strong>ternationalorganisations, jo<strong>in</strong>tly manag<strong>in</strong>g datacollection:• the United Nations Educational, scientific,and Cultural Organisation <strong>in</strong>stitutefor statistics (UNESCO-UIS);• the Organisation for Economic Cooperationand Development (OE<strong>CD</strong>),and;• the Statistical Office of the <strong>Europe</strong>anUnion (<strong>Eurostat</strong>).The UNESCO / OE<strong>CD</strong> / <strong>Eurostat</strong> (UOE)questionnaire on education statistics constitutesthe ma<strong>in</strong> source of <strong>in</strong>formationand is the basis for the core componentsof the <strong>Eurostat</strong> database on educationstatistics; <strong>Eurostat</strong> also collects data onregional enrolments and foreign languagelearn<strong>in</strong>g. The def<strong>in</strong>itions and methodologicalrequirements for the jo<strong>in</strong>t UOEdata collection and for the <strong>Eurostat</strong> datacollection are available on the <strong>Eurostat</strong>website (3) . Data on educational atta<strong>in</strong>mentand adult learn<strong>in</strong>g are ma<strong>in</strong>ly providedby household surveys, i.e. the EU LabourForce Survey, which will soon be complementedby an adult education survey (4) ,while the cont<strong>in</strong>uous vocational tra<strong>in</strong><strong>in</strong>gsurvey (CVTS) provides <strong>in</strong>formation ontra<strong>in</strong><strong>in</strong>g participation, volume and costsfor enterprises.IntroductionSchool helps young people acquire basiclife skills and competences necessary fortheir personal development. Besides theirown personal development, the quality ofa pupil’s school experience affects theirplace <strong>in</strong> society, educational atta<strong>in</strong>ment,and employment opportunities too. Thequality of the education experienced bypupils is l<strong>in</strong>ked directly to the quality ofteach<strong>in</strong>g, which <strong>in</strong> turn is l<strong>in</strong>ked to thedemands placed upon teachers, the tra<strong>in</strong><strong>in</strong>gthey receive and the roles they areasked to fill. With this <strong>in</strong> m<strong>in</strong>d, severalMember States are <strong>in</strong> the process of revis<strong>in</strong>gtheir school curricula <strong>in</strong> l<strong>in</strong>e <strong>with</strong>the chang<strong>in</strong>g needs of society and theeconomy, as well as reflect<strong>in</strong>g on how toimprove teacher tra<strong>in</strong><strong>in</strong>g and evaluation.Demographic trends <strong>in</strong> the last threedecades reflect reductions <strong>in</strong> birth rates,that have resulted <strong>in</strong> the structure of theEU’s population age<strong>in</strong>g and the proportionof those aged under 30 decreas<strong>in</strong>g<strong>in</strong> the majority of Member States. Thesechanges can have a significant impact onhuman and material resources requiredfor the sound function<strong>in</strong>g of educationsystems – such as average class sizes orteacher recruitment strategies.Most <strong>Europe</strong>ans spend significantly longer<strong>in</strong> education than the legal m<strong>in</strong>imumrequirement. This reflects the choice toenrol <strong>in</strong> higher education, as well as <strong>in</strong>creasedenrolment <strong>in</strong> pre-primary educationand wider participation <strong>in</strong> lifelonglearn<strong>in</strong>g <strong>in</strong>itiatives, such as mature(adult) students return<strong>in</strong>g to education– often <strong>in</strong> order to retra<strong>in</strong> or equip themselvesfor a career change.(3) http://circa.europa.eu/Public/irc/dsis/edtcs/library?l=/public/unesco_collection.(4) http://epp.eurostat.ec.europa.eu/cache/ITY_OFFPUB/KS-CC-05-005/EN/KS-CC-05-005-EN.PDF.EUROPE IN FIGURES — <strong>Eurostat</strong> <strong>yearbook</strong> <strong>2009</strong>177
4 EducationAt the age of 4, a high proportion of children<strong>in</strong> the EU are already enrolled <strong>in</strong>pre-primary educational <strong>in</strong>stitutions. Thegeneral objectives for pre-primary educationare fairly similar across countries,focus<strong>in</strong>g on the development of children’s<strong>in</strong>dependence, well-be<strong>in</strong>g, self-confidence,citizenship, and preparation forlife and learn<strong>in</strong>g at school.On average, compulsory education lasts9 or 10 years <strong>in</strong> most of the EU: last<strong>in</strong>glongest <strong>in</strong> Hungary, the Netherlands andthe United K<strong>in</strong>gdom. Age is the sole criterionfor admission to compulsory primaryeducation, which starts at the ageof 5 or 6 <strong>in</strong> most countries, although theNordic countries, as well as Bulgaria andEstonia have a compulsory start<strong>in</strong>g ageof 7.While national curricula <strong>in</strong>clude broadlythe same subjects across the MemberStates, the amount of time allocated toeach subject varies considerably. In addition,there are wide-rang<strong>in</strong>g differences<strong>in</strong> the freedoms that teachers have toshape the content of their classes or followa strict curriculum. The most significantdifferences between countries tendto relate to the degree of <strong>in</strong>struction given<strong>in</strong> foreign languages, <strong>in</strong>formation andcommunication technology, or religion.In contrast, all countries allocate a considerableamount of time to teach theirmother tongue and mathematics.Teach<strong>in</strong>g time tends to be more evenlyspread across subjects <strong>in</strong> compulsorysecondary education, <strong>with</strong> more emphasisgiven to natural and social sciences,as well as foreign languages. Pupils froma particular country follow the samecommon curriculum throughout theirfull-time compulsory education <strong>in</strong> mostMember States, although <strong>in</strong> Germany,Luxembourg, the Netherlands and Austriaparents have to choose a particulartype of education for their child at theend of primary school.The Comenius programme addresses developments<strong>in</strong> education and school policyand has the follow<strong>in</strong>g goals:• to improve and <strong>in</strong>crease the mobilityof pupils and educational staff;• to enhance and <strong>in</strong>crease partnershipsbetween schools <strong>in</strong> different MemberStates, <strong>with</strong> at least three million pupilstak<strong>in</strong>g part <strong>in</strong> jo<strong>in</strong>t educationalactivities by 2010;• to encourage language learn<strong>in</strong>g, <strong>in</strong>novativeICT-based content, servicesand better teach<strong>in</strong>g techniques andpractices;• to enhance the quality and <strong>Europe</strong>andimension of teacher tra<strong>in</strong><strong>in</strong>g, and;• to improve pedagogical approachesand school management.Member States have themselves set anumber of other benchmarks for improv<strong>in</strong>geducation. These <strong>in</strong>clude benchmarksfor, among others, read<strong>in</strong>g proficiency,atta<strong>in</strong>ment <strong>in</strong> mathematics, science andtechnology, early school leav<strong>in</strong>g, and thecompletion of secondary school.178 EUROPE IN FIGURES — <strong>Eurostat</strong> <strong>yearbook</strong> <strong>2009</strong>
Education 4Def<strong>in</strong>itions and data availabilityThe International Standard Classificationof Education (ISCED) is the basisfor <strong>in</strong>ternational education statistics, describ<strong>in</strong>gdifferent levels of education, aswell as fields of education and tra<strong>in</strong><strong>in</strong>g (5) .The current version, ISCED 97 dist<strong>in</strong>guishesseven levels of education:• ISCED level 0: pre-primary education– def<strong>in</strong>ed as the <strong>in</strong>itial stage oforganised <strong>in</strong>struction; it is school- orcentre-based and is designed for childrenaged at least 3 years;• ISCED level 1: primary education –beg<strong>in</strong>s between 5 and 7 years of age, iscompulsory <strong>in</strong> all countries and generallylasts from four to six years;• ISCED level 2: lower secondary education– cont<strong>in</strong>ues the basic programmesof the primary level, althoughteach<strong>in</strong>g is typically moresubject-focused; usually, the end ofthis level co<strong>in</strong>cides <strong>with</strong> the end ofcompulsory education;• ISCED level 3: upper secondary education– generally beg<strong>in</strong>s at the end ofcompulsory education; the entranceage is typically 15 or 16 years and entrancequalifications and other m<strong>in</strong>imumentry requirements are usuallyneeded; <strong>in</strong>struction is often moresubject-oriented and typical durationvaries from two to five years;• ISCED level 4: post-secondary nontertiaryeducation – straddles theboundary between upper secondaryand tertiary education; typical examplesare programmes designed toprepare pupils for studies at level 5 orprogrammes designed to prepare pupilsfor direct labour market entry;• ISCED level 5: tertiary education(first stage) – entry normally requiresthe successful completion of level 3or 4; <strong>in</strong>cludes tertiary programmes<strong>with</strong> academic orientation which arelargely theoretically based and occupationorientation which are typicallyshorter and geared for entry <strong>in</strong>to thelabour market;• ISCED level 6: tertiary education(second stage) – leads to an advancedresearch qualification (Ph.D. ordoctorate).The <strong>in</strong>dicator for four-year-olds <strong>in</strong> educationpresents the percentage of fouryear-oldswho are enrolled <strong>in</strong> educationorientedpre-primary <strong>in</strong>stitutions. These<strong>in</strong>stitutions provide education-orientedcare for young children. They must recruitstaff <strong>with</strong> specialised qualifications<strong>in</strong> education. Day nurseries, playgroupsand day care centres, where the staff arenot required to hold a qualification <strong>in</strong> education,are not <strong>in</strong>cluded. The <strong>in</strong>dicatorfor 18-year-olds who are still <strong>in</strong> any k<strong>in</strong>dof school (all ISCED levels) provides an<strong>in</strong>dication of the number of young peoplewho have not abandoned their efforts toimprove their skills through <strong>in</strong>itial educationand it <strong>in</strong>cludes both those who hada regular education career <strong>with</strong>out anydelays as well as those who are cont<strong>in</strong>u<strong>in</strong>geven if they had to repeat some steps<strong>in</strong> the past.(5) http://www.unesco.org/education/<strong>in</strong>formation/nfsunesco/doc/isced_1997.htm.EUROPE IN FIGURES — <strong>Eurostat</strong> <strong>yearbook</strong> <strong>2009</strong>179
4 EducationPupil-teacher ratios are calculated bydivid<strong>in</strong>g the number of full-time-equivalentpupils and students <strong>in</strong> each level ofeducation by the number of full-timeequivalentteachers at the same level; all<strong>in</strong>stitutions, both public and private, are<strong>in</strong>cluded. This ratio should not be confused<strong>with</strong> average class-size, as: therecan be a difference between the numberof hours of teach<strong>in</strong>g provided by <strong>in</strong>dividualteachers and the number of hoursof <strong>in</strong>struction prescribed for pupils; morethan one teacher can be teach<strong>in</strong>g <strong>in</strong> aclass at the same time; or teachers for specialeducation needs can work <strong>with</strong> smallgroups or on a one-to-one basis.The <strong>in</strong>dicator youth education atta<strong>in</strong>mentlevel is def<strong>in</strong>ed as the proportion ofthe population aged 20 to 24 hav<strong>in</strong>g completedat least an upper secondary education,i.e. <strong>with</strong> an education level ISCED3a, 3b or 3c long m<strong>in</strong>imum (numerator).The denom<strong>in</strong>ator consists of the totalpopulation of the same age group, exclud<strong>in</strong>gnon-response.The <strong>in</strong>dicator for early school leavers isdef<strong>in</strong>ed as the proportion of the populationaged 18 to 24 <strong>with</strong> at most a lowersecondary level of education, who areno longer <strong>in</strong> further education or tra<strong>in</strong><strong>in</strong>g(respondents declared not hav<strong>in</strong>g receivedany education or tra<strong>in</strong><strong>in</strong>g <strong>in</strong> thefour weeks preced<strong>in</strong>g the survey). Thedenom<strong>in</strong>ator consists of the total populationof the same age group, exclud<strong>in</strong>gnon-response.Ma<strong>in</strong> f<strong>in</strong>d<strong>in</strong>gsThere were about 93.9 million pupilsand students enrolled <strong>in</strong> educational establishments<strong>in</strong> the EU-27 <strong>in</strong> 2006. Thehighest share of pupils and students <strong>in</strong>the EU-27 total was accounted for byGermany, where 14.4 million pupils andstudents attended education establishments<strong>in</strong> 2006; this figure was 1.7 millionhigher than the next largest student populationthat was registered <strong>in</strong> the UnitedK<strong>in</strong>gdom, and 2.1 million higher than <strong>in</strong>France.The proportion of students found <strong>in</strong> eachlevel of education varied considerably betweenthe Member States and reflects, tosome degree, the demographic structureof each population. The high proportionof pupils <strong>in</strong> primary education <strong>in</strong> Luxembourg(46.0 % <strong>in</strong> 2006) reflects the lackof a developed tertiary education sector<strong>in</strong> this country, whereas Ireland, Cyprusand Portugal also reported a relativelyhigh proportion of students <strong>with</strong><strong>in</strong> primaryeducation (upwards of 40 %) – reflect<strong>in</strong>grelatively high birth rates. At theother end of the spectrum, Greece, Slovenia,the Baltic Member States, Polandand F<strong>in</strong>land all had relatively high proportions(around one quarter or more)of their student populations <strong>with</strong><strong>in</strong> thetertiary education sector.The <strong>figures</strong> above exclude pre-primaryeducation – where 86.8 % of all four-yearolds attended establishments <strong>in</strong> the EU-27<strong>in</strong> 2006. Enrolment rates <strong>in</strong> pre-primaryeducation ranged from 100 % <strong>in</strong> Belgium,France and Italy, to less than one child <strong>in</strong>two across F<strong>in</strong>land, Ireland and Poland.180 EUROPE IN FIGURES — <strong>Eurostat</strong> <strong>yearbook</strong> <strong>2009</strong>
Education 4More than three quarters (77.4 %) of all18-year olds <strong>with</strong><strong>in</strong> the EU-27 rema<strong>in</strong>ed<strong>with</strong><strong>in</strong> the education system <strong>in</strong> 2006.There was a considerable variation <strong>in</strong>this proportion between the MemberStates: as six countries reported morethan n<strong>in</strong>e out of ten people of this agerema<strong>in</strong><strong>in</strong>g <strong>in</strong> education, while less thanhalf of all 18-year-olds were still attend<strong>in</strong>gan educational establishment <strong>in</strong> threeof the Member States (Cyprus, Malta andthe United K<strong>in</strong>gdom); note these <strong>figures</strong>may reflect a number of factors, <strong>in</strong> particular,the need for students to go abroadto cont<strong>in</strong>ue their (tertiary) education, orthe practise of mak<strong>in</strong>g students re-takea whole year if their performance at theend of each academic year is not deemedto be satisfactory.Pupil/teacher ratios <strong>with</strong><strong>in</strong> primary educationranged from an average of lessthan 11 pupils per teacher <strong>in</strong> Greece, Italy,Lithuania, Luxembourg (2004), Hungaryand Portugal <strong>in</strong> 2006, to almost doublethat rate <strong>in</strong> the Ireland, France (2005)and the United K<strong>in</strong>gdom (all above 19pupils per teacher). Between 2001 and2006 there was a general reduction <strong>in</strong> theaverage number of pupils per teacher <strong>in</strong>most of the Member States.The average number of pupils per teacherwas generally lower for secondary educationthan for primary education, <strong>with</strong> anaverage of less than ten pupils for everyteacher <strong>in</strong> Greece, Spa<strong>in</strong>, Luxembourg(2004) and Portugal <strong>with</strong><strong>in</strong> upper secondaryeducation. Germany had by farthe highest average number of pupils perteacher <strong>with</strong><strong>in</strong> the upper secondary educationsector (19.5) <strong>in</strong> 2006, ris<strong>in</strong>g from13.7 pupils per teacher <strong>in</strong> 2001.Data on educational atta<strong>in</strong>ment showthat, <strong>in</strong> 2007, just over three quarters(78.1 %) of the EU-27’s population aged20 to 24 had completed at least an uppersecondary level of education. However,14.8 % of those aged 18 to 24 (16.9 % ofmen and 12.7 % of women) were earlyschool leavers, <strong>with</strong> at most a lower secondaryeducation.EUROPE IN FIGURES — <strong>Eurostat</strong> <strong>yearbook</strong> <strong>2009</strong>181
4 EducationTable 4.1: Pupils and students (exclud<strong>in</strong>g pre-primary education) (1)Total(ISCED 1-6)(1 000)Breakdown of total number of pupils and students (% of total)Primary levelof education(ISCED 1)Lowersecondarylevel ofeducation(ISCED 2)Upper and postsecondarynon-tertiaryeducation(ISCED 3-4)Tertiaryeducation(ISCED 5-6)2001 2006 2001 2006 2001 2006 2001 2006 2001 2006EU-27 96 001 93 901 31.2 30.4 24.4 24.4 25.7 25.1 17.2 20.0Euro area (2) 56 630 57 796 31.0 30.4 27.5 26.3 21.7 23.5 18.2 19.3Belgium 2 304 2 410 33.5 30.4 17.1 18.0 33.8 35.2 15.6 16.4Bulgaria 1 322 1 193 28.3 22.9 27.7 25.2 25.3 31.5 18.7 20.4Czech Republic 1 932 1 869 32.6 25.3 26.8 26.1 27.1 30.5 13.5 18.0Denmark 1 029 1 142 38.5 36.4 20.0 20.6 23.0 22.9 18.5 20.0Germany 14 515 14 394 24.2 23.1 38.9 36.7 22.1 23.7 14.4 15.9Estonia 306 278 38.3 28.6 20.7 21.3 22.1 25.6 18.9 24.5Ireland 987 1 036 45.0 44.6 18.6 17.1 19.6 20.4 16.9 18.0Greece 1 906 2 042 33.4 31.6 18.9 16.6 22.6 19.8 25.1 32.0Spa<strong>in</strong> 7 597 7 529 33.0 35.2 26.2 26.3 16.6 14.8 24.1 23.8France 11 849 12 321 32.4 32.9 27.9 26.7 21.9 22.4 17.1 17.9Italy 9 144 9 464 30.9 29.7 19.9 19.1 29.4 29.8 19.8 21.4Cyprus 140 146 45.6 40.9 23.4 22.3 22.5 22.7 8.5 14.1Latvia 510 472 24.6 16.7 33.7 31.8 21.5 23.8 20.2 27.8Lithuania 787 784 26.9 19.2 42.2 39.2 13.7 16.2 17.3 25.4Luxembourg 70 77 47.3 46.0 22.9 23.7 26.1 26.8 3.6 3.5Hungary 1 924 1 952 25.5 21.3 26.3 24.5 31.1 31.8 17.2 22.5Malta 78 78 43.0 37.9 37.2 35.6 10.3 15.0 9.5 11.4Netherlands 3 217 3 318 39.8 38.5 24.1 23.7 20.3 20.3 15.7 17.5Austria 1 464 1 471 26.8 24.2 26.1 26.8 29.0 31.8 18.1 17.2Poland 9 153 8 663 35.2 30.0 13.1 18.6 32.4 26.6 19.4 24.8Portugal 2 002 1 862 40.0 40.4 20.6 21.1 20.0 18.8 19.4 19.7Romania 3 954 3 831 27.6 24.5 33.4 25.1 25.5 28.6 13.5 21.8Slovenia 403 403 21.4 23.2 24.7 19.3 31.2 29.1 22.7 28.5Slovakia 1 114 1 089 26.9 21.6 35.8 31.7 24.3 28.5 12.9 18.2F<strong>in</strong>land 1 172 1 246 33.5 29.9 16.4 16.4 26.2 29.0 23.9 24.8Sweden 2 085 2 096 37.3 33.0 17.1 20.1 27.5 26.7 17.0 20.2United K<strong>in</strong>gdom 15 038 12 736 30.6 35.5 15.4 17.9 40.3 28.2 13.7 18.3Croatia : 733 : 26.6 : 28.2 : 26.6 : 18.7FYR of Macedonia 387 366 32.0 28.7 33.2 31.6 24.4 26.4 10.4 13.2Turkey 14 893 16 275 70.2 65.6 : : : : 10.8 14.4Iceland 74 84 42.7 36.1 15.9 16.5 27.7 28.7 13.7 18.6Liechtenste<strong>in</strong> : 6 : 36.2 : 26.1 : 27.5 : 10.3Norway 993 1 068 42.9 40.2 16.3 17.9 21.6 21.8 19.1 20.1Switzerland : 1 340 : 38.6 : 22.4 : 23.0 : 15.3Japan 20 254 19 095 36.5 37.9 20.4 19.1 22.2 20.5 19.6 21.4United States 63 653 66 793 39.7 36.4 19.7 19.5 19.2 17.9 21.4 26.2(1) Refer to the Internet metadata file (http://epp.eurostat.ec.europa.eu/cache/ITY_SDDS/en/educ_esms.htm).(2) EA-13 <strong>in</strong>stead of EA-15 for 2001.Source: <strong>Eurostat</strong> (tps00051 and educ_enrl1tl)182 EUROPE IN FIGURES — <strong>Eurostat</strong> <strong>yearbook</strong> <strong>2009</strong>
Education 4Figure 4.1: Four-year-olds <strong>in</strong> education, 2006 (1)(% of all four-year-olds)1007550250EU-27Euro areaBelgiumFranceItalySpa<strong>in</strong>MaltaLuxembourgDenmarkGermanyHungaryUnited K<strong>in</strong>gdomCzech RepublicSwedenEstoniaAustriaPortugalSloveniaRomaniaNetherlandsLatviaSlovakiaCyprusBulgariaLithuaniaGreeceF<strong>in</strong>landIrelandPolandIcelandJapanNorwayUnited StatesLiechtenste<strong>in</strong>CroatiaSwitzerlandFYR of MacedoniaTurkey(1) Refer to the Internet metadata file (http://epp.eurostat.ec.europa.eu/cache/ITY_SDDS/en/educ_esms.htm).Source: <strong>Eurostat</strong> (tps00053)Figure 4.2: 18-year-olds <strong>in</strong> education, 2006 (1)(% of all 18-year-olds)1007550250EU-27Euro areaSwedenF<strong>in</strong>landPolandLithuaniaBelgiumGreeceIrelandSloveniaCzech RepublicLatviaGermanyItalySlovakiaHungaryNetherlandsEstoniaDenmarkFranceAustriaBulgariaLuxembourgSpa<strong>in</strong>PortugalRomaniaUnited K<strong>in</strong>gdomMaltaCyprusNorwayLiechtenste<strong>in</strong>SwitzerlandIcelandCroatiaUnited StatesFYR of MacedoniaTurkey(1) Refer to the Internet metadata file (http://epp.eurostat.ec.europa.eu/cache/ITY_SDDS/en/educ_esms.htm).Source: <strong>Eurostat</strong> (tps00060)EUROPE IN FIGURES — <strong>Eurostat</strong> <strong>yearbook</strong> <strong>2009</strong>183
4 EducationTable 4.2: Pupil/teacher ratio <strong>in</strong> primary, lower and upper secondary education (1)(average number of pupils per teacher)Primaryeducation(ISCED 1)Lower secondary/secondstage of basic education(ISCED 2)Upper secondaryeducation(ISCED 3)2001 2006 2001 2006 2001 2006Belgium 13.4 12.6 : 9.4 9.8 10.2Bulgaria 17.7 15.8 13.0 12.3 11.3 11.7Czech Republic 19.4 17.3 14.5 12.3 13.1 11.9Denmark 10.2 : 10.3 11.4 13.3 :Germany 19.4 18.7 15.7 15.5 13.7 19.5Estonia 14.7 14.1 11.2 12.3 10.3 13.3Ireland 20.3 19.4 15.1 : 15.1 14.6Greece 12.7 10.6 9.8 8.0 11.3 8.3Spa<strong>in</strong> 14.7 14.2 : 12.5 11.0 7.8France (2) 19.5 19.4 13.9 14.2 10.9 10.3Italy 10.8 10.7 9.9 10.3 10.4 11.0Cyprus 21.1 16.8 15.1 11.6 13.6 12.7Latvia 17.6 11.8 13.2 10.5 13.2 11.7Lithuania 16.9 10.7 12.0 8.5 : :Luxembourg (3) 11.0 10.7 9.1 : 9.1 9.0Hungary 11.3 10.4 11.2 10.2 12.5 12.3Malta 19.0 13.7 9.9 9.3 18.1 14.3Netherlands 17.2 15.3 : : 17.1 15.8Austria 14.3 13.9 9.8 10.4 9.9 11.3Poland 12.5 11.4 13.1 12.6 16.8 12.7Portugal 11.6 10.6 9.9 8.3 8.0 7.5Romania : 17.1 14.8 12.2 13.3 15.7Slovenia 13.1 14.9 13.3 10.2 13.8 14.0Slovakia 20.7 18.6 14.5 13.7 12.9 14.2F<strong>in</strong>land 16.1 15.0 10.9 9.7 17.0 15.8Sweden 12.4 12.1 12.4 11.4 16.6 13.8United K<strong>in</strong>gdom 20.8 19.8 17.5 16.7 18.9 11.4Croatia : 17.7 : 12.8 : 11.8FYR of Macedonia 21.2 : 11.4 : 18.9 17.3Turkey 29.8 26.7 : : 17.2 15.8Iceland 12.6 : : 10.6 10.9 10.8Liechtenste<strong>in</strong> : 10.5 : 7.3 : 11.4Norway : 10.9 10.9 10.2 9.2 9.7Japan 20.6 19.2 16.6 14.9 14.0 12.7United States : 14.6 : 14.7 : 15.7(1) Refer to the Internet metadata file (http://epp.eurostat.ec.europa.eu/cache/ITY_SDDS/en/educ_esms.htm).(2) 2005 <strong>in</strong>stead of 2006.(3) 2004 <strong>in</strong>stead of 2006.Source: <strong>Eurostat</strong> (tps00054 and educ_iste)184 EUROPE IN FIGURES — <strong>Eurostat</strong> <strong>yearbook</strong> <strong>2009</strong>
Education 4Table 4.3: Youth education atta<strong>in</strong>ment level and early school leavers (1)Youth educationEarly school leavers (%)atta<strong>in</strong>ment level (%) Total Male Female2002 2007 2002 2007 2002 2007 2002 2007EU-27 76.7 78.1 17.1 14.8 19.3 16.9 14.9 12.7Euro area 72.7 74.5 19.3 17.1 22.0 19.6 16.6 14.5Belgium 81.6 82.6 12.4 12.3 14.9 13.9 9.9 10.7Bulgaria 77.4 83.3 21.0 16.6 22.5 16.3 19.6 16.9Czech Republic (2) 92.2 91.8 5.5 5.5 5.3 5.7 5.7 5.4Denmark 78.6 70.8 8.6 12.4 10.3 15.7 6.9 8.9Germany 73.3 72.5 12.6 12.7 12.6 13.4 12.6 11.9Estonia 81.4 80.9 12.6 14.3 15.6 21.0 9.6 :Ireland 84.0 86.7 14.7 11.5 18.4 14.2 10.9 8.7Greece 81.1 82.1 16.7 14.7 20.7 18.6 12.6 10.7Spa<strong>in</strong> 63.7 61.1 29.9 31.0 36.4 36.1 23.1 25.6France 81.7 82.4 13.4 12.7 14.9 14.6 11.9 10.9Italy 69.6 76.3 24.3 19.3 27.9 22.6 20.7 15.9Cyprus 83.5 85.8 15.9 12.6 22.3 19.5 11.0 6.8Latvia 77.1 80.2 19.5 16.0 26.7 19.7 12.2 12.3Lithuania 81.3 89.0 14.3 8.7 15.1 11.4 13.4 5.9Luxembourg 69.8 70.9 17.0 15.1 14.4 19.2 19.6 11.1Hungary 85.9 84.0 12.2 10.9 12.5 12.5 11.8 9.3Malta 39.0 54.7 53.2 37.6 56.5 41.5 49.7 33.3Netherlands 73.1 76.2 15.0 12.0 15.7 14.4 14.3 9.6Austria 85.3 84.1 9.5 10.9 8.7 11.6 10.2 10.2Poland 89.2 91.6 7.6 5.0 9.5 6.4 5.6 3.6Portugal 44.4 53.4 45.1 36.3 52.6 42.0 37.5 30.4Romania 76.3 77.4 23.2 19.2 24.3 19.2 22.1 19.1Slovenia 90.7 91.5 4.8 4.3 6.2 5.7 3.3 2.7Slovakia 94.5 91.3 5.6 7.2 6.7 8.1 4.6 6.3F<strong>in</strong>land 85.8 86.5 9.9 7.9 12.6 9.7 7.3 6.3Sweden (2) 86.7 87.2 10.4 12.0 11.4 13.3 9.3 10.7United K<strong>in</strong>gdom (2) 77.1 78.1 17.8 13.0 18.8 14.6 16.7 11.4Croatia (3) 90.6 94.6 8.3 3.9 9.1 5.2 7.4 5.3Turkey 42.8 46.4 54.8 47.6 45.4 39.4 63.5 55.0Iceland (2, 3) 48.5 49.3 28.8 28.1 32.7 31.5 24.8 24.6Norway (2, 3) 94.8 93.3 14.0 5.9 14.9 7.4 13.1 4.3Switzerland (3) 79.4 78.1 6.7 7.6 6.3 8.5 7.1 6.7(1) Refer to the Internet metadata file (http://epp.eurostat.ec.europa.eu/cache/ITY_SDDS/en/educ_esms.htm).(2) 2006 <strong>in</strong>stead of 2007 for early school leavers.(3) 2006 <strong>in</strong>stead of 2007 for youth education atta<strong>in</strong>ment level.Source: <strong>Eurostat</strong> (tsiir110 and tsisc060)EUROPE IN FIGURES — <strong>Eurostat</strong> <strong>yearbook</strong> <strong>2009</strong>185
4 Education4.2 Foreign language learn<strong>in</strong>gIntroductionThe EU recognises 23 official languages,<strong>in</strong> addition to which there are regional,m<strong>in</strong>ority languages, and languages spokenby migrant populations. School is thema<strong>in</strong> opportunity for the vast majority ofpeople to learn these languages – as l<strong>in</strong>guisticdiversity is actively encouraged<strong>with</strong><strong>in</strong> schools, universities, adult educationcentres and the workplace.For several decades it has been mandatoryfor most <strong>Europe</strong>an children to learnat least one foreign language dur<strong>in</strong>g theircompulsory education, <strong>with</strong> the timedevoted to foreign language <strong>in</strong>structiongenerally <strong>in</strong>creas<strong>in</strong>g <strong>in</strong> recent years. In2002, the Barcelona <strong>Europe</strong>an Councilrecommended that at least two foreignlanguages should be learnt from a veryearly age by each pupil. This recommendationhas been implemented to vary<strong>in</strong>gdegrees, usually for compulsory secondaryeducation, either by mak<strong>in</strong>g it mandatoryto learn a second language, or ensur<strong>in</strong>gthat pupils have the possibility tostudy a second foreign language as partof their curriculum. In November 2005,the <strong>Europe</strong>an Commission published aCommunication (COM(2005) 596) titled‘A New Framework Strategy for Multil<strong>in</strong>gualism’(6) . The EU promotes multil<strong>in</strong>gualismand aims for a situation <strong>in</strong> whichevery EU citizen can speak at least twoforeign languages <strong>in</strong> addition to their ownmother tongue, based on the premise thatmultil<strong>in</strong>gual citizens are better equippedto take advantage of educational opportunitiesand employment opportunities.This Communication complements anaction plan for 2004-2006 for the promotionof language learn<strong>in</strong>g and l<strong>in</strong>guisticdiversity (7) , which focused on: extend<strong>in</strong>gthe benefits of language learn<strong>in</strong>g to allcitizens as a lifelong activity; improv<strong>in</strong>gthe quality of language teach<strong>in</strong>g, and;build<strong>in</strong>g an environment favourable tolanguages.Def<strong>in</strong>itions and data availabilityData on the number of pupils study<strong>in</strong>gforeign languages are related to the correspond<strong>in</strong>gnumbers of students enrolled;mentally handicapped students enrolled<strong>in</strong> special schools are excluded.The average number of foreign languageslearned per pupil is collected for differentISCED levels. The data refer to allpupils, even if teach<strong>in</strong>g languages doesnot start <strong>in</strong> the first years of <strong>in</strong>structionfor the particular ISCED level considered.This <strong>in</strong>dicator is def<strong>in</strong>ed as the sumof language students divided by the totalnumber of students enrolled <strong>in</strong> the educationallevel considered. Each studentstudy<strong>in</strong>g a foreign language is countedonce for each language he or she is study<strong>in</strong>g,i.e. students study<strong>in</strong>g more than onelanguage are counted as many times asthe number of languages studied. Irish,Luxembourgish and regional languagesare excluded, although provision may bemade for them <strong>in</strong> certa<strong>in</strong> Member States.Allow<strong>in</strong>g for exceptions, when one of thenational languages is taught <strong>in</strong> schoolswhere it is not the teach<strong>in</strong>g language, it isnot considered as a foreign language.(6) http://eur-lex.europa.eu/LexUriServ/LexUriServ.do?uri=COM:2005:0596:FIN:EN:PDF.(7) http://ec.europa.eu/education/doc/official/keydoc/actlang/act_lang_en.pdf.186 EUROPE IN FIGURES — <strong>Eurostat</strong> <strong>yearbook</strong> <strong>2009</strong>
Education 4Ma<strong>in</strong> f<strong>in</strong>d<strong>in</strong>gsWith<strong>in</strong> primary education establishments,there is a clear pre-em<strong>in</strong>ence <strong>in</strong>terms of the proportion of pupils that(choose to) study English. Learn<strong>in</strong>g Englishis mandatory <strong>in</strong> a number of countries<strong>with</strong><strong>in</strong> secondary education establishments,and a number of MemberStates witnessed (near) 100 % shares ofpupils learn<strong>in</strong>g this language <strong>in</strong> primaryeducation. The highest shares of primaryeducation pupils study<strong>in</strong>g English wererecorded <strong>in</strong> Greece, Spa<strong>in</strong>, Italy, Maltaand Austria, where upwards of n<strong>in</strong>e outof every ten children was study<strong>in</strong>g English.The relative importance of Englishas a foreign language may be furthermagnified because pupils tend to receivemore tuition <strong>in</strong> their first foreign languagethan they do for any subsequentlanguages they may choose to study.The 12 Member States that jo<strong>in</strong>ed theEU s<strong>in</strong>ce 2004 are <strong>in</strong> a particular position<strong>with</strong> respect to language teach<strong>in</strong>g, asmany of them used to make it compulsoryto study Russian. This situation has s<strong>in</strong>cechanged and now most pupils have a freechoice as to the language(s) they (wishto) study. In these countries too there hasbeen a marked <strong>in</strong>crease <strong>in</strong> the proportionof pupils learn<strong>in</strong>g English (often above50 % of all students). Luxembourg isalso of particular <strong>in</strong>terest, <strong>in</strong>sofar as thiscountry has three official languages, <strong>with</strong>most pupils receiv<strong>in</strong>g tuition <strong>in</strong> Luxembourgish,German and French at a primarylevel, while English is <strong>in</strong>troduced asa foreign language at secondary school.Turn<strong>in</strong>g to language learn<strong>in</strong>g <strong>with</strong><strong>in</strong> uppersecondary education, some 84.1 %of all EU-27 students at ISCED level 3were study<strong>in</strong>g English <strong>in</strong> 2006, compared<strong>with</strong> less than a quarter study<strong>in</strong>g French(24.3 %) or German (22.2 %).Luxembourg and Estonia stood out as thetwo countries <strong>with</strong> the highest averagenumber of foreign languages learnt perpupil; note this <strong>in</strong>dicator <strong>in</strong>cludes otherlanguages (such as Russian), besides English,French and German.Figure 4.3: Proportion of pupils learn<strong>in</strong>g foreign languages <strong>in</strong> primary education, by language,2006 (1)(%)1007550250EU-27BelgiumBulgariaCzech RepublicDenmarkGermanyEstonia (2)IrelandGreeceSpa<strong>in</strong>FranceItalyCyprusLatviaLithuaniaLuxembourgHungaryMalta (3)NetherlandsAustria (2)PolandPortugalRomaniaSloveniaSlovakiaF<strong>in</strong>landSwedenUnited K<strong>in</strong>gdomCroatiaFYR of MacedoniaTurkeyIcelandNorwayEnglish French German(1) Refer to the Internet metadata file (http://epp.eurostat.ec.europa.eu/cache/ITY_SDDS/en/educ_esms.htm); France, not available;Luxembourg, not available for English; the Netherlands and Norway, not available for French and German; Slovenia and Iceland, notavailable for French.(2) Estimates.(3) 2005 for French and German.Source: <strong>Eurostat</strong> (educ_ilang), Unesco, OE<strong>CD</strong>EUROPE IN FIGURES — <strong>Eurostat</strong> <strong>yearbook</strong> <strong>2009</strong>187
4 EducationTable 4.4: Foreign languages learnt per pupil <strong>in</strong> upper secondary education (ISCED level 3) (1)Average number offoreign languageslearnt per pupil(number)Pupils learn<strong>in</strong>gEnglish <strong>in</strong> generalprogrammes (%)Pupils learn<strong>in</strong>gFrench <strong>in</strong> generalprogrammes (%)Pupils learn<strong>in</strong>gGerman <strong>in</strong> generalprogrammes (%)2001 2006 2001 2006 2001 2006 2001 2006EU-27 1.3 1.3 71.0 84.1 18.1 22.2 19.4 24.3Belgium 1.8 1.7 94.1 94.4 48.3 48.1 30.3 28.4Bulgaria 1.4 1.5 79.0 86.1 20.8 15.3 38.6 40.3Czech Republic 1.3 1.4 96.6 100.0 14.7 25.0 75.7 72.2Denmark 1.5 1.5 91.0 99.9 22.9 22.6 69.6 71.9Germany 0.7 0.9 92.0 94.3 29.4 28.7 - -Estonia 2.2 2.2 90.9 92.6 4.3 6.1 46.3 44.1Ireland 0.9 0.9 - - 66.2 60.5 19.1 18.2Greece 1.0 1.0 94.3 94.0 14.0 8.6 3.1 2.9Spa<strong>in</strong> 1.2 1.2 95.5 94.6 23.9 27.1 0.9 1.1France 1.7 1.7 99.3 99.4 - - 31.2 22.8Italy 1.2 1.4 81.0 96.9 27.0 21.4 7.8 7.7Cyprus 1.6 1.6 89.8 88.1 68.7 38.3 1.3 2.4Latvia : 1.2 89.2 94.9 4.0 4.1 51.8 35.1Lithuania 1.6 1.4 73.7 82.3 7.8 5.4 37.0 27.2Luxembourg 2.3 2.3 93.1 97.0 89.4 97.0 87.6 97.0Hungary 1.2 1.2 60.6 73.3 6.1 6.2 47.8 49.9Malta (2) 0.7 0.6 80.7 63.5 8.1 7.9 0.8 1.7Netherlands 1.6 : 98.2 100.0 26.7 70.1 32.0 86.2Austria : 1.4 : 96.9 : 54.1 - -Poland 1.4 1.7 90.1 90.0 15.2 10.0 62.4 64.0Portugal : 0.8 : 50.7 : 15.1 : 1.6Romania 1.4 1.6 86.1 94.8 84.8 83.6 10.8 11.6Slovenia 1.4 1.6 95.6 98.9 7.8 10.2 83.3 77.0Slovakia 1.4 1.5 95.9 97.7 13.1 16.0 78.8 72.6F<strong>in</strong>land : : 99.5 99.5 22.2 19.7 43.3 35.4Sweden 1.7 1.6 99.8 99.9 25.6 22.4 53.5 32.4United K<strong>in</strong>gdom : 0.6 - - : 34.8 : 13.1Croatia : 1.4 : 98.3 : 3.4 : 65.6FYR of Macedonia 1.3 1.5 : : : : : :Turkey : 0.8 : 67.3 : 0.7 : 6.5Iceland 1.3 1.5 65.9 76.1 16.4 17.1 32.8 30.7Norway : 0.8 : : : : : :(1) Refer to the Internet metadata file (http://epp.eurostat.ec.europa.eu/cache/ITY_SDDS/en/educ_esms.htm).(2) 2005 <strong>in</strong>stead of 2006 for average number of foreign languages learnt per pupil.Source: <strong>Eurostat</strong> (tps00056, tps00057, tps00058 and tps00059), Unesco, OE<strong>CD</strong>188 EUROPE IN FIGURES — <strong>Eurostat</strong> <strong>yearbook</strong> <strong>2009</strong>
Education 44.3 Tertiary educationIntroduction<strong>Europe</strong> has around 4 000 higher education<strong>in</strong>stitutions, <strong>with</strong> over 17 millionstudents and 1.5 million staff; some <strong>Europe</strong>anuniversities are among the mostwell-respected <strong>in</strong> the world. Higher educationplays a central role <strong>in</strong> the developmentof human be<strong>in</strong>gs and modernsocieties, enhanc<strong>in</strong>g social, cultural andeconomic development, as well as activecitizenship and ethical values.The <strong>Europe</strong>an Commission has publisheda modernisation agenda for universitiesas part of the Lisbon strategy for growthand jobs. The ma<strong>in</strong> fields for reform wereidentified as:• Curricular reform: a three cycle system(bachelor-master-doctorate),competence based learn<strong>in</strong>g, flexiblelearn<strong>in</strong>g paths, recognition, mobility;• Governance reform: university autonomy,strategic partnerships, <strong>in</strong>clud<strong>in</strong>g<strong>with</strong> enterprises, quality assurance;• Fund<strong>in</strong>g reform: diversified sourcesof university <strong>in</strong>come better l<strong>in</strong>ked toperformance, promot<strong>in</strong>g equity, accessand efficiency, <strong>in</strong>clud<strong>in</strong>g the possiblerole of tuition fees, grants andloans.Curricular reforms are also promotedthrough the Bologna Process (8) , whichsets out plans to create a <strong>Europe</strong>an areafor higher education by 2010, facilitat<strong>in</strong>gstudent mobility, the transparency andrecognition of qualifications, while promot<strong>in</strong>ga <strong>Europe</strong>an dimension <strong>with</strong><strong>in</strong>higher education and the attractivenessof <strong>Europe</strong>an <strong>in</strong>stitutions to non-Communitystudents. This <strong>in</strong>itiative has beenextended to cover 46 countries <strong>with</strong><strong>in</strong> thewider <strong>Europe</strong>.The Erasmus programme is one of themost well-known <strong>Europe</strong>an <strong>in</strong>itiatives.Around 90 % of <strong>Europe</strong>an universitiestake part <strong>in</strong> it and some 1.9 million studentshave already participated <strong>in</strong> exchangess<strong>in</strong>ce it started <strong>in</strong> 1987. Erasmusbecame part of the EU’s lifelong learn<strong>in</strong>gprogramme <strong>in</strong> 2007 and was expanded tocover student placements <strong>in</strong> enterprises,university staff tra<strong>in</strong><strong>in</strong>g and teach<strong>in</strong>g forenterprise staff. The programme seeks toexpand its mobility actions <strong>in</strong> the com<strong>in</strong>gyears, <strong>with</strong> a target of 3 million Erasmusstudents by 2012.Some of the most recent policy <strong>in</strong>itiatives<strong>in</strong> this area <strong>in</strong>clude efforts to <strong>in</strong>stigate adialogue between universities and bus<strong>in</strong>essto develop l<strong>in</strong>ks between universitiesand bus<strong>in</strong>esses <strong>in</strong> areas such as, curriculumdevelopment, governance, entrepreneurship,cont<strong>in</strong>u<strong>in</strong>g education andknowledge transfer. Otherwise, a CouncilResolution on modernis<strong>in</strong>g universitiesfor <strong>Europe</strong>’s competitiveness <strong>in</strong> a globalknowledge economy was adopted on 23November 2007 (9) .(8) http://ec.europa.eu/education/policies/educ/bologna/bologna_en.html.(9) http://register.consilium.europa.eu/pdf/en/07/st16/st16096-re01.en07.pdf.EUROPE IN FIGURES — <strong>Eurostat</strong> <strong>yearbook</strong> <strong>2009</strong>189
4 EducationDef<strong>in</strong>itions and data availabilityISCED is used to def<strong>in</strong>e the levels ofeducation: tertiary education <strong>in</strong>cludesboth programmes which are largely theoretically-basedand designed to providequalifications for entry to advanced researchprogrammes and professions <strong>with</strong>high skill requirements, as well as programmeswhich are classified at the samelevel of competencies but are more occupationally-orientedand lead to directlabour market access. Persons who areenrolled <strong>in</strong> tertiary education (<strong>in</strong>clud<strong>in</strong>guniversity and non-university studies)<strong>in</strong> the regular education system <strong>in</strong> eachcountry correspond to the target populationfor policy <strong>in</strong> higher education. Itprovides an <strong>in</strong>dication of the number ofpersons who had access to tertiary educationand are expected to complete theirstudies, contribut<strong>in</strong>g to an <strong>in</strong>crease of theeducational atta<strong>in</strong>ment level of the population<strong>in</strong> the country <strong>in</strong> case they cont<strong>in</strong>ueto live and work <strong>in</strong> the country at theend of their studies.Student and teacher mobility are bothseen as important tools for <strong>in</strong>creas<strong>in</strong>g<strong>in</strong>novation, productivity and competitiveness.Historically, it has been rare forcountries to have precise details concern<strong>in</strong>gthe number of students that studyabroad <strong>in</strong> third countries. Instead, thesestatistics have usually been collected bysumm<strong>in</strong>g the numbers of students study<strong>in</strong>g<strong>in</strong> receiv<strong>in</strong>g countries. This methodhas a downside; as a lack of <strong>in</strong>formationon the distribution of students accord<strong>in</strong>gto their nationality is likely to lead to underestimation(for example, the numberof students study<strong>in</strong>g abroad may be acount of students enrolled on a certa<strong>in</strong>day, whereas the actual number of foreignstudents could be higher as many studentsstay abroad for just a few months).The number of foreign students may bedef<strong>in</strong>ed as all students <strong>with</strong> a foreign nationality– however, this means that permanentresidents <strong>with</strong> a foreign nationalityare been <strong>in</strong>cluded <strong>in</strong> the numerator,even though they have not changed countryfor their studies. The statistics <strong>in</strong> thisedition of the Yearbook present, for thefirst time, <strong>in</strong>formation on student mobilitythat is based on the actual numberof foreign students study<strong>in</strong>g <strong>in</strong> the hostcountry and excludes foreigners who areresident.Ma<strong>in</strong> f<strong>in</strong>d<strong>in</strong>gsThere were almost 19 million studentsactive <strong>with</strong><strong>in</strong> tertiary education <strong>in</strong> theEU-27 <strong>in</strong> 2006. Proportionally moreyoung men than women opt for a vocationaleducation, while women outnumbermen <strong>with</strong><strong>in</strong> tertiary education. Thismay reflect the desire of some young mento enter a vocational profession as rapidlyas possible, as well as chang<strong>in</strong>g socialattitudes and professional activity concern<strong>in</strong>gthe position of women. As theemphasis placed on qualifications grows<strong>in</strong> relation to enter<strong>in</strong>g further educationor obta<strong>in</strong><strong>in</strong>g a job, it is important to notethat the participation rate of young women<strong>in</strong> education after the completion ofcompulsory education is higher than thatfor young men <strong>in</strong> most Member States,and that young women obta<strong>in</strong> more uppersecondary education qualificationsthan young men.The highest number of students <strong>in</strong> tertiaryeducation was recorded <strong>in</strong> Germanyand the United K<strong>in</strong>gdom – around 2.3million <strong>in</strong> each country, equivalent tomore than 12 % of the EU-27 total, whilethere were 2.2 million <strong>in</strong> France, 2.1 million<strong>in</strong> Poland and 2 million <strong>in</strong> Italy.190 EUROPE IN FIGURES — <strong>Eurostat</strong> <strong>yearbook</strong> <strong>2009</strong>
Education 4Gender disparities <strong>in</strong> educational enrolmentand atta<strong>in</strong>ment at a tertiary levelhave been reversed <strong>in</strong> many MemberStates dur<strong>in</strong>g the last couple of decades,<strong>with</strong> women account<strong>in</strong>g for 55.1 % ofthe total number of tertiary students <strong>in</strong>2006 <strong>in</strong> the EU-27; Germany was the onlycountry where the proportion of maletertiary students (50.3 % of the total) washigher than the share accounted for bywomen.Educational policies have <strong>in</strong>creas<strong>in</strong>glyshifted to promote particular subjectareas, where take-up among female studentsrema<strong>in</strong>s relatively low (for example,science, mathematics and comput<strong>in</strong>g,or eng<strong>in</strong>eer<strong>in</strong>g, manufactur<strong>in</strong>g andconstruction-related studies). Instead,women appear to have a higher propensityto study health and welfare, humanitiesand arts, social sciences, bus<strong>in</strong>essand law, while a higher proportion ofmen chose to study science and technologyrelated subjects, as well as agricultureand veter<strong>in</strong>ary related subjects. Some39.7 % of tertiary students <strong>in</strong> science,mathematics and comput<strong>in</strong>g discipl<strong>in</strong>es<strong>in</strong> the EU-27 were female <strong>in</strong> 2006, whilethe proportion of female students amongthose study<strong>in</strong>g eng<strong>in</strong>eer<strong>in</strong>g, manufactur<strong>in</strong>gand construction-related studies was25.1 %, both these values marked an <strong>in</strong>creasecompared <strong>with</strong> the year before.Some 9.0 % of the tertiary education studentpopulation <strong>in</strong> the EU-27 <strong>in</strong> 2006 wasfound to be study<strong>in</strong>g <strong>in</strong> another country.Some of the most popular dest<strong>in</strong>ations forforeign students <strong>in</strong>clude countries whereEnglish, French or German are spoken,such as the United K<strong>in</strong>gdom, Austria,Belgium, Germany or France.EUROPE IN FIGURES — <strong>Eurostat</strong> <strong>yearbook</strong> <strong>2009</strong>191
4 EducationTable 4.5: Students <strong>in</strong> tertiary education, 2006 (1)Total numberof students<strong>in</strong> tertiaryeducationof which, study<strong>in</strong>g (%)SocialHumanitiesbus<strong>in</strong>esssciences,& arts & lawScience,math. &comput<strong>in</strong>gEng<strong>in</strong>.,manuf. &constructionAgricul.& veter<strong>in</strong>ary(1 000)Health &welfare ServicesEU-27 18 783 12.6 32.6 10.1 13.9 1.8 12.3 3.5Euro area 11 199 13.1 30.4 10.5 14.8 1.8 12.7 3.5Belgium 394 10.5 27.5 6.9 10.6 2.5 22.1 1.5Bulgaria 244 7.9 42.5 5.0 21.0 2.5 6.4 7.6Czech Republic 337 8.5 27.6 8.5 14.4 3.7 12.1 5.3Denmark 229 15.0 29.5 8.0 10.1 1.5 22.2 2.3Germany 2 290 15.6 27.4 15.2 15.7 1.4 14.7 2.5Estonia 68 11.6 39.0 10.0 12.3 2.5 8.5 8.5Ireland 186 15.7 23.1 11.6 10.4 1.2 12.8 4.5Greece (2) 653 11.6 31.9 15.7 16.5 5.9 6.9 5.0Spa<strong>in</strong> 1 789 10.4 31.9 11.4 17.8 3.4 9.9 5.6France 2 201 16.5 34.5 12.3 11.5 1.0 14.2 3.5Italy 2 029 15.5 36.5 7.9 15.6 2.3 12.5 2.6Cyprus 21 8.5 47.4 12.7 6.1 0.1 6.6 9.2Latvia 131 7.0 54.2 5.2 10.0 1.2 5.2 4.9Lithuania 199 7.0 41.8 6.1 18.0 2.3 9.2 3.4Luxembourg 3 8.2 45.2 8.4 15.0 0.0 0.4 0.0Hungary 439 8.0 41.6 5.2 12.4 2.9 8.2 8.3Malta 9 14.0 37.4 8.4 7.6 0.2 20.3 2.2Netherlands 580 8.4 38.0 6.7 8.3 1.2 16.4 5.9Austria 253 14.9 35.0 12.4 11.8 1.6 9.4 2.1Poland 2 146 9.2 40.9 9.7 12.6 2.2 5.7 5.4Portugal 367 8.6 31.5 7.3 21.9 1.9 16.0 5.6Romania 835 10.5 50.0 4.7 18.2 2.9 5.7 3.0Slovenia 115 7.5 43.5 5.4 15.6 3.1 7.4 8.7Slovakia 198 6.0 28.3 9.0 16.4 2.8 15.2 5.8F<strong>in</strong>land 309 14.5 22.5 11.4 25.9 2.2 13.3 4.8Sweden 423 12.6 26.2 9.7 16.3 0.9 17.2 1.8United K<strong>in</strong>gdom 2 336 17.0 27.0 13.7 8.2 0.9 18.8 0.7Croatia 137 9.9 40.5 7.4 16.3 3.8 7.5 10.2FYR of Macedonia 48 10.7 32.6 7.2 18.3 3.6 10.2 4.5Turkey 2 343 6.9 47.4 7.5 13.3 3.5 5.6 3.5Iceland 16 14.8 38.0 8.0 7.3 0.5 12.4 1.5Liechtenste<strong>in</strong> 1 1.4 71.4 0.0 25.0 0.0 2.2 0.0Norway 215 12.1 32.2 8.9 6.7 0.8 19.3 4.3Switzerland 205 13.0 37.1 10.7 13.4 1.2 10.2 3.8Japan 4 085 15.8 29.3 2.9 16.1 2.1 12.2 5.7United States 17 488 10.6 27.3 8.9 6.7 0.6 13.9 5.1(1) Refer to the Internet metadata file (http://epp.eurostat.ec.europa.eu/cache/ITY_SDDS/en/educ_esms.htm).(2) Breakdown by subject is for 2005.Source: <strong>Eurostat</strong> (tps00062 and educ_enrl5)192 EUROPE IN FIGURES — <strong>Eurostat</strong> <strong>yearbook</strong> <strong>2009</strong>
Education 4Figure 4.4: Median age <strong>in</strong> tertiary education, 2006 (1)(years)3020100EU-27Euro areaDenmarkSwedenF<strong>in</strong>landGermanyAustriaLatviaUnited K<strong>in</strong>gdomHungarySloveniaSpa<strong>in</strong>MaltaPortugalCzech RepublicEstoniaItalyLuxembourgSlovakiaRomaniaLithuaniaNetherlandsBulgariaPolandCyprusIrelandFranceBelgiumGreeceIcelandNorwayLiechtenste<strong>in</strong>SwitzerlandUnited StatesTurkeyFYR of MacedoniaCroatia(1) Refer to the Internet metadata file (http://epp.eurostat.ec.europa.eu/cache/ITY_SDDS/en/educ_esms.htm).Source: <strong>Eurostat</strong> (tps00061)Figure 4.5: Gender breakdown of tertiary students, 2006 (1)(% of total number of tertiary students)100%75%50%25%0%EU-27Euro areaGermanyGreeceCyprusNetherlandsLuxembourgBulgariaCzech RepublicAustriaSpa<strong>in</strong>F<strong>in</strong>landBelgiumIrelandPortugalFranceRomaniaItalyMaltaUnited K<strong>in</strong>gdomDenmarkPolandSlovakiaSloveniaHungarySwedenLithuaniaEstoniaLatviaLiechtenste<strong>in</strong>TurkeyJapanSwitzerlandCroatiaFYR of MacedoniaUnited StatesNorwayIcelandFemaleMale(1) Refer to the Internet metadata file (http://epp.eurostat.ec.europa.eu/cache/ITY_SDDS/en/educ_esms.htm).Source: <strong>Eurostat</strong> (tps00063)EUROPE IN FIGURES — <strong>Eurostat</strong> <strong>yearbook</strong> <strong>2009</strong>193
4 EducationTable 4.6: Graduates from tertiary education, by field of education, 2006 (1)Total numberof graduatesfrom tertiaryeducationof which, study<strong>in</strong>g (%)SocialHumanitiesbus<strong>in</strong>esssciences,& arts & lawScience,math. &comput<strong>in</strong>gEng<strong>in</strong>.,manuf. &constructionAgricul.& veter<strong>in</strong>ary(1 000)Health &welfare ServicesEU-27 3 846 12.2 35.3 9.9 12.5 1.7 14.4 3.8Euro area 2 113 12.9 33.8 10.2 14.3 1.8 15.2 4.3Belgium 82 9.8 28.3 7.7 9.3 2.3 18.9 2.1Bulgaria 45 8.4 47.8 5.3 15.6 2.0 6.2 7.7Czech Republic 69 7.5 28.7 7.6 15.0 3.6 12.4 5.6Denmark 48 13.8 30.4 7.2 10.9 2.1 23.8 3.3Germany 415 15.9 23.7 11.4 13.5 1.8 20.4 3.1Estonia 12 11.4 36.6 9.4 9.9 2.2 11.6 8.6Ireland 59 19.1 34.7 13.8 12.1 0.6 11.0 2.4Greece (2) 60 13.1 28.0 15.0 12.3 3.6 9.7 8.5Spa<strong>in</strong> 286 9.2 28.3 10.0 16.5 1.8 14.2 7.6France 644 12.1 41.6 11.1 14.7 1.5 13.0 3.9Italy 279 17.0 38.7 6.8 15.9 1.7 12.4 2.6Cyprus 4 10.0 43.7 9.7 4.2 0.2 6.7 14.3Latvia 26 6.2 56.0 4.6 6.8 1.0 5.2 4.9Lithuania 43 6.7 40.9 5.9 15.9 1.8 9.0 3.5Luxembourg : : : : : : : :Hungary 70 7.6 43.8 5.8 6.7 2.6 8.8 8.8Malta 3 15.5 44.2 6.3 4.8 1.0 13.0 3.1Netherlands 117 8.2 38.2 6.8 8.3 1.5 16.5 4.5Austria 35 8.7 29.7 12.6 19.8 2.1 9.9 3.7Poland 504 8.7 42.6 8.5 8.4 1.6 7.8 5.0Portugal 72 10.3 32.2 11.3 15.1 1.8 24.2 7.2Romania 175 11.9 48.2 4.5 15.8 2.7 9.6 2.1Slovenia 17 5.1 49.6 3.5 12.6 2.4 9.9 7.7Slovakia 40 6.3 27.4 8.6 15.0 2.9 17.1 6.7F<strong>in</strong>land 40 13.5 23.4 8.7 20.7 2.3 19.1 6.0Sweden 61 6.1 24.8 8.1 18.4 1.0 25.3 2.2United K<strong>in</strong>gdom 640 15.4 30.5 13.4 8.2 0.9 18.3 0.8Croatia 21 9.4 39.4 6.3 11.5 3.6 8.9 13.5FYR of Macedonia 7 13.4 26.9 7.4 13.8 4.0 12.3 5.4Turkey 373 6.4 37.7 7.8 14.3 4.0 5.7 6.2Iceland 3 11.2 34.1 8.0 6.4 0.7 11.7 1.4Liechtenste<strong>in</strong> 0 3.0 54.5 0.0 34.8 0.0 7.6 0.0Norway 34 8.8 27.0 8.2 7.5 1.1 24.5 4.8Switzerland 69 6.5 39.4 10.3 12.1 1.6 11.0 6.7Japan 1 068 15.2 27.0 3.0 18.2 2.2 12.8 9.7United States 2 639 13.2 38.1 8.9 7.2 1.1 13.5 6.5(1) Refer to the Internet metadata file (http://epp.eurostat.ec.europa.eu/cache/ITY_SDDS/en/educ_esms.htm).(2) 2005.Source: <strong>Eurostat</strong> (educ_grad5)194 EUROPE IN FIGURES — <strong>Eurostat</strong> <strong>yearbook</strong> <strong>2009</strong>
Education 4Figure 4.6: Graduates from tertiary education, by field of education and gender, EU-27, 2006 (1)(1 000)1 5001 0005000Social sciences,bus<strong>in</strong>ess & lawHealth &welfareEng<strong>in</strong>eer<strong>in</strong>g,manufactur<strong>in</strong>g &constructionHumanities &artsScience,mathematics &comput<strong>in</strong>gServicesAgriculture &veter<strong>in</strong>aryFemaleMale(1) Estimates.Source: <strong>Eurostat</strong> (educ_grad5)Figure 4.7: Student mobility <strong>in</strong> tertiary education (ISCED 5-6), 2006 (1)(foreign students as a % of all students <strong>in</strong> tertiary education)1007550250EU-27Euro areaUnited K<strong>in</strong>gdomLuxembourgCyprusAustriaSwedenFranceBelgiumGermanyDenmarkMaltaIrelandNetherlandsCzech RepublicPortugalBulgariaHungaryEstoniaF<strong>in</strong>landSpa<strong>in</strong>GreeceItalyRomaniaSloveniaLatviaSlovakiaLithuaniaPolandLiechtenste<strong>in</strong>SwitzerlandNorwayIcelandJapanTurkeyCroatiaFYR of Macedonia(1) Refer to the Internet metadata file (http://epp.eurostat.ec.europa.eu/cache/ITY_SDDS/en/educ_esms.htm).Source: <strong>Eurostat</strong> (educ_enrl8 and educ_enrl1tl)EUROPE IN FIGURES — <strong>Eurostat</strong> <strong>yearbook</strong> <strong>2009</strong>195
4 Education4.4 Lifelong learn<strong>in</strong>g andvocational tra<strong>in</strong><strong>in</strong>gIntroductionThe <strong>Europe</strong>an Commission has <strong>in</strong>tegratedits various educational and tra<strong>in</strong><strong>in</strong>g<strong>in</strong>itiatives under a s<strong>in</strong>gle umbrella,the Lifelong Learn<strong>in</strong>g Programme (LLP).This new programme replaces previouseducation, vocational tra<strong>in</strong><strong>in</strong>g and e-Learn<strong>in</strong>g programmes, which ended <strong>in</strong>2006.Lifelong learn<strong>in</strong>g is def<strong>in</strong>ed as encompass<strong>in</strong>glearn<strong>in</strong>g for personal, civic andsocial purposes, as well as for employment-relatedpurposes. It can take place<strong>in</strong> a variety of environments, both <strong>in</strong>sideand outside formal education and tra<strong>in</strong><strong>in</strong>gsystems. Lifelong learn<strong>in</strong>g impliesrais<strong>in</strong>g <strong>in</strong>vestment <strong>in</strong> people and knowledge;promot<strong>in</strong>g the acquisition of basicskills, <strong>in</strong>clud<strong>in</strong>g digital literacy andbroaden<strong>in</strong>g opportunities for <strong>in</strong>novative,more flexible forms of learn<strong>in</strong>g. The aimis to provide people of all ages <strong>with</strong> equaland open access to high-quality learn<strong>in</strong>gopportunities, and to a variety of learn<strong>in</strong>gexperiences throughout <strong>Europe</strong>.The EC Treaty recognised the importanceof vocational tra<strong>in</strong><strong>in</strong>g <strong>in</strong> Article 150 bystat<strong>in</strong>g that ‘Community action shall aimto … facilitate access to vocational tra<strong>in</strong><strong>in</strong>g…; stimulate cooperation on tra<strong>in</strong><strong>in</strong>gbetween educational or tra<strong>in</strong><strong>in</strong>g establishmentsand firms’ (10) .A <strong>Europe</strong>an Commission communicationof November 2001 entitled ‘Mak<strong>in</strong>ga <strong>Europe</strong>an area of lifelong learn<strong>in</strong>g a reality’(11) underl<strong>in</strong>es <strong>in</strong> paragraph 1.1 thatthe ‘Lisbon <strong>Europe</strong>an Council confirmedlifelong learn<strong>in</strong>g as a basic componentof the <strong>Europe</strong>an social model’. As such,learn<strong>in</strong>g is no longer given weight only <strong>in</strong>the area of education; it is also seen as acritical factor <strong>in</strong> the areas of employmentand social security, economic performanceand competitiveness.The <strong>Europe</strong>an employment strategy(EES) (12) , agreed on 22 July 2003, <strong>in</strong>troducedtwo guidel<strong>in</strong>es to tackle the needfor improved skills levels through lifelonglearn<strong>in</strong>g. These guidel<strong>in</strong>es calledupon the Member States to address labourshortages and skills bottlenecksand also encourage them to implementcomprehensive lifelong learn<strong>in</strong>g strategies<strong>in</strong> order to equip all <strong>in</strong>dividuals <strong>with</strong>the skills required of a modern workforce.The guidel<strong>in</strong>es stated that policiesshould aim to <strong>in</strong>crease <strong>in</strong>vestment <strong>in</strong> humanresources, <strong>in</strong> particular through thetra<strong>in</strong><strong>in</strong>g of adults by enterprises. At thebeg<strong>in</strong>n<strong>in</strong>g of 2005, the <strong>Europe</strong>an Commissionmade a proposal for a revisionof the Lisbon strategy, revis<strong>in</strong>g the EESby publish<strong>in</strong>g employment guidel<strong>in</strong>es <strong>in</strong>conjunction <strong>with</strong> macro-economic andmicro-economic guidel<strong>in</strong>es.The Leonardo da V<strong>in</strong>ci programme <strong>in</strong> thefield of vocational education and tra<strong>in</strong><strong>in</strong>g(VET) is designed to encourage projectswhich give <strong>in</strong>dividuals the chance to improvetheir competences, knowledge andskills through a period spent abroad, aswell as to encourage <strong>Europe</strong>-wide cooperationbetween tra<strong>in</strong><strong>in</strong>g organisations.(10) Consolidated version of the Treaty establish<strong>in</strong>g the <strong>Europe</strong>an Community, Chapter 3, Article 150(2) (OJ C 352, 24.12.2002,p. 33); http://eur-lex.europa.eu/en/treaties/dat/12002E/pdf/12002E_EN.pdf.(11) ‘Mak<strong>in</strong>g a <strong>Europe</strong>an area of lifelong learn<strong>in</strong>g a reality’, COM(2001) 678 f<strong>in</strong>al of 21 November 2001; http://ec.europa.eu/education/policies/lll/life/communication/com_en.pdf.(12) http://ec.europa.eu/social/ma<strong>in</strong>.jsp?catId=101&langId=en.196 EUROPE IN FIGURES — <strong>Eurostat</strong> <strong>yearbook</strong> <strong>2009</strong>
Education 4The Gruntvig programme was launched<strong>in</strong> 2000 and now forms part of the LifelongLearn<strong>in</strong>g Programme. It aims toprovide adults <strong>with</strong> ways of improv<strong>in</strong>gtheir knowledge and skills. It not onlycovers learners <strong>in</strong> adult education, butalso the teachers, tra<strong>in</strong>ers, education staffand facilities that provide these services.Def<strong>in</strong>itions and data availabilityLifelong learn<strong>in</strong>g encompasses all purposefullearn<strong>in</strong>g activity, whether formal,non-formal or <strong>in</strong>formal, undertaken onan ongo<strong>in</strong>g basis <strong>with</strong> the aim of improv<strong>in</strong>gknowledge, skills and competence.The <strong>in</strong>tention or aim to learn is the criticalpo<strong>in</strong>t that dist<strong>in</strong>guishes these learn<strong>in</strong>gactivities from non-learn<strong>in</strong>g activitiessuch as cultural activities or sportsactivities.With<strong>in</strong> the doma<strong>in</strong> of lifelong learn<strong>in</strong>gstatistics, formal education correspondsto education and tra<strong>in</strong><strong>in</strong>g <strong>in</strong> the regularsystem of schools, universities and colleges.Non-formal education and tra<strong>in</strong><strong>in</strong>g<strong>in</strong>cludes all types of taught learn<strong>in</strong>gactivities which are not part of a formaleducation programme. Note that the statisticspresented do not, therefore, cover<strong>in</strong>formal learn<strong>in</strong>g, which corresponds toself-learn<strong>in</strong>g (through the use of pr<strong>in</strong>tedmaterial, computer-based learn<strong>in</strong>g/tra<strong>in</strong><strong>in</strong>g,onl<strong>in</strong>e Internet-based web education,visit<strong>in</strong>g libraries, etc).The target population for lifelong learn<strong>in</strong>gstatistics refers to all persons <strong>in</strong> privatehouseholds aged between 25 and 64years old. Data are collected through theEU Labour Force Survey (LFS). The denom<strong>in</strong>atorused <strong>in</strong> this subchapter consistsof the total population of the sameage group, exclud<strong>in</strong>g those who did notanswer to the question participation toeducation and tra<strong>in</strong><strong>in</strong>g. From 27 October2006, this <strong>in</strong>dicator is based on annualaverages of quarterly data <strong>in</strong>stead of oneunique reference quarter <strong>in</strong> spr<strong>in</strong>g.Additional <strong>in</strong>formation is available fromtwo other surveys:• the third <strong>Europe</strong>an survey of cont<strong>in</strong>u<strong>in</strong>gvocational tra<strong>in</strong><strong>in</strong>g <strong>in</strong> enterprises(CVTS3) which was implemented<strong>with</strong> 2005 as reference year <strong>in</strong> theEU-27 Member States and Norway,and;• an adult education survey which wascarried out by EU, EFTA and candidatecountries between 2005 and2008; at the time of writ<strong>in</strong>g, the resultsof this survey are not yet available.Cont<strong>in</strong>u<strong>in</strong>g Vocational Tra<strong>in</strong><strong>in</strong>g (CVT)concerns persons employed by enterprises;the qualify<strong>in</strong>g criteria are: thetra<strong>in</strong><strong>in</strong>g must be planned <strong>in</strong> advance; thetra<strong>in</strong><strong>in</strong>g must be organised or supported<strong>with</strong> the specific goal of learn<strong>in</strong>g; thetra<strong>in</strong><strong>in</strong>g must be f<strong>in</strong>anced at least partlyby the enterprise.EUROPE IN FIGURES — <strong>Eurostat</strong> <strong>yearbook</strong> <strong>2009</strong>197
4 EducationMa<strong>in</strong> f<strong>in</strong>d<strong>in</strong>gsIn 2007, the proportion of persons aged25 to 64 receiv<strong>in</strong>g some form of lifelonglearn<strong>in</strong>g <strong>in</strong> the four weeks preced<strong>in</strong>g thesurvey was 9.7 % <strong>with</strong><strong>in</strong> the EU-27. Thisfigure was 1.2 po<strong>in</strong>ts higher than the correspond<strong>in</strong>gshare for 2003. The proportionof the population who had participated<strong>in</strong> lifelong learn<strong>in</strong>g activities washigher among women (10.6 % <strong>in</strong> 2007)than among men (8.8 %). Sweden, Denmark,the United K<strong>in</strong>gdom and F<strong>in</strong>landstood out as they reported considerablyhigher proportions of their respectivepopulations participat<strong>in</strong>g <strong>in</strong> lifelonglearn<strong>in</strong>g (between 32 % and 23 %); <strong>in</strong>contrast, Bulgaria and Romania reportedlifelong learn<strong>in</strong>g participation rates ofless than 2 %.As regards vocational tra<strong>in</strong><strong>in</strong>g, the proportionof all enterprises that providedtra<strong>in</strong><strong>in</strong>g to their employees <strong>in</strong> 2005ranged from 21 %, <strong>in</strong> Greece, to 90 % <strong>in</strong>the United K<strong>in</strong>gdom, and averaged 60 %across the EU.The prelim<strong>in</strong>ary EU results of the surveyreflect, on average, a slight decrease<strong>in</strong> the proportion of enterprises offer<strong>in</strong>gtra<strong>in</strong><strong>in</strong>g to their employees <strong>in</strong> comparison<strong>with</strong> the results of the previous survey(conducted <strong>in</strong> 1999). The northerncountries and especially the Scand<strong>in</strong>aviancountries, where considerable effortswere made <strong>in</strong> previous years, experienceda decrease <strong>in</strong> participation rates for vocationaltra<strong>in</strong><strong>in</strong>g, while the proportionrose considerably <strong>in</strong> most of the MemberStates that jo<strong>in</strong>ed the EU s<strong>in</strong>ce 2004.The rate of participation of employees <strong>in</strong>cont<strong>in</strong>uous vocational tra<strong>in</strong><strong>in</strong>g (CVT)activities was generally highest <strong>in</strong> theEU-15 Member States. On average, one<strong>in</strong> three employees (33 %) participated <strong>in</strong>CVT courses, <strong>with</strong> this proportion rang<strong>in</strong>gfrom 11 %, <strong>in</strong> Latvia, to nearly 60 %<strong>in</strong> the Czech Republic.The <strong>in</strong>tensity of cont<strong>in</strong>ual vocationaltra<strong>in</strong><strong>in</strong>g, as measured by the averagehours of tra<strong>in</strong><strong>in</strong>g per employee was similarbetween the EU-15 Member Statesand those that jo<strong>in</strong>ed the EU s<strong>in</strong>ce 2004.However, three groups of countries couldbe clearly dist<strong>in</strong>guished: those <strong>with</strong> highproportions of tra<strong>in</strong><strong>in</strong>g enterprises andhigh <strong>in</strong>tensity <strong>in</strong> CVT courses, those <strong>with</strong>high rates of tra<strong>in</strong><strong>in</strong>g enterprises andrelatively low <strong>in</strong>tensity <strong>in</strong> CVT courses,and those <strong>with</strong> low rates of tra<strong>in</strong><strong>in</strong>g enterprisesand relatively high <strong>in</strong>tensity <strong>in</strong>CVT courses.The third vocational tra<strong>in</strong><strong>in</strong>g survey <strong>in</strong>cluded,for the first time, <strong>in</strong>formationregard<strong>in</strong>g <strong>in</strong>itial vocational tra<strong>in</strong><strong>in</strong>g<strong>with</strong><strong>in</strong> enterprises (for example, apprentices).Germany, the United K<strong>in</strong>gdom,Austria, Denmark, the Netherlands, Italyand France had the highest proportion ofenterprises provid<strong>in</strong>g <strong>in</strong>itial vocationaltra<strong>in</strong><strong>in</strong>g <strong>in</strong> 2005. In these countries theshares were often close to 50 %, while <strong>in</strong>the majority of the other Member Statesit did not exceed 10 %.198 EUROPE IN FIGURES — <strong>Eurostat</strong> <strong>yearbook</strong> <strong>2009</strong>
Education 4Table 4.7: Lifelong learn<strong>in</strong>g (1)(% of the population aged 25 to 64 participat<strong>in</strong>g <strong>in</strong> education and tra<strong>in</strong><strong>in</strong>g)Total Male Female2003 2007 2003 2007 2003 2007EU-27 (2) 8.5 9.7 7.9 8.8 9.1 10.6Euro area (2) 6.5 8.4 6.4 8.0 6.6 8.8Belgium 7.0 7.2 7.0 7.0 6.9 7.4Bulgaria 1.3 1.3 1.1 1.4 1.4 1.3Czech Republic 5.1 5.7 4.8 5.5 5.4 5.9Denmark (2) 24.2 29.2 21.0 24.2 27.4 34.2Germany 6.0 7.8 6.4 8.0 5.6 7.6Estonia 6.7 7.0 5.0 4.6 8.2 9.3Ireland (2) 5.9 7.6 5.1 6.2 6.8 9.0Greece (2) 2.6 2.1 2.6 2.2 2.7 2.1Spa<strong>in</strong> 4.7 10.4 4.3 9.3 5.1 11.5France (2) 7.1 7.4 7.0 7.0 7.2 7.9Italy 4.5 6.2 4.2 5.9 4.8 6.6Cyprus (2) 7.9 8.4 7.1 8.1 8.5 8.6Latvia 7.8 7.1 5.4 4.6 10.0 9.3Lithuania 3.8 5.3 2.8 3.6 4.7 6.8Luxembourg (2) 6.5 7.0 6.8 6.5 6.1 7.4Hungary (2) 4.5 3.6 4.0 3.0 4.9 4.1Malta 4.2 6.0 4.7 6.4 3.6 5.7Netherlands (2) 16.4 16.6 16.1 16.1 16.8 17.0Austria (2) 8.6 12.8 8.6 11.6 8.6 14.0Poland 4.4 5.1 3.9 4.7 4.9 5.5Portugal 3.2 4.4 3.0 4.4 3.4 4.5Romania 1.1 1.3 1.1 1.2 1.2 1.4Slovenia (2) 13.3 14.8 12.0 13.5 14.7 16.1Slovakia (2) 3.7 3.9 3.5 3.4 3.9 4.3F<strong>in</strong>land (2) 22.4 23.4 18.6 19.4 26.2 27.5Sweden (2) 31.8 32.0 28.4 26.0 35.4 38.3United K<strong>in</strong>gdom (3) 27.2 26.6 22.7 22.0 30.9 31.2Croatia 1.8 2.9 1.8 3.1 1.9 2.8Turkey 1.2 1.5 1.7 1.8 0.7 1.2Iceland (2) 29.5 27.9 25.0 22.4 34.1 33.7Norway (2) 17.1 18.0 16.2 17.1 18.0 18.9Switzerland (2) 24.7 22.5 25.3 21.7 24.0 23.4(1) Refer to the Internet metadata file (http://epp.eurostat.ec.europa.eu/cache/ITY_SDDS/en/educ_esms.htm).(2) Break <strong>in</strong> series, 2003.(3) Break <strong>in</strong> series, 2003 and 2007.Source: <strong>Eurostat</strong> (tsiem080)EUROPE IN FIGURES — <strong>Eurostat</strong> <strong>yearbook</strong> <strong>2009</strong>199
4 EducationTable 4.8: Cont<strong>in</strong>uous vocational tra<strong>in</strong><strong>in</strong>g, 2005Tra<strong>in</strong><strong>in</strong>genterprises(% of allenterprises)Employeesparticipat<strong>in</strong>g<strong>in</strong> CVT courses(%)Cost of CVTcourses(% of totallabour cost)Average timespent <strong>in</strong> CVTcourses peremployee(hours)Share ofenterprisesprovid<strong>in</strong>gIVT(% of allenterprises)EU (1) 60 33 1.6 9 30Belgium 63 40 1.6 12 9Bulgaria 29 15 1.1 4 4Czech Republic 72 59 1.9 14 3Denmark 85 35 2.7 10 45Germany 69 30 1.3 9 55Estonia 67 24 1.6 7 1Ireland : : : : :Greece 21 14 0.6 3 3Spa<strong>in</strong> 47 33 1.2 9 14France 74 46 2.3 13 37Italy 32 29 1.3 7 40Cyprus 51 30 1.3 7 2Latvia 36 11 0.8 3 5Lithuania 46 15 1.2 5 17Luxembourg 72 49 2.0 16 28Hungary 49 16 2.6 6 6Malta 46 32 1.8 11 12Netherlands 75 34 2.0 12 41Austria 81 33 1.4 9 49Poland 35 21 1.3 6 9Portugal 44 28 1.1 7 5Romania 40 17 1.1 5 2Slovenia 72 50 2.0 14 9Slovakia 60 38 1.8 12 1F<strong>in</strong>land 77 39 1.5 10 17Sweden 78 46 2.1 15 7United K<strong>in</strong>gdom 90 33 1.3 7 51Norway 86 29 1.3 9 23(1) EU averages calculated on the basis of the available country data (i.e. exclud<strong>in</strong>g Ireland).Source: <strong>Eurostat</strong> (trng_cvts3_01, trng_cvts3_41, trng_cvts3_53, trng_cvts3_71 and trng_cvts3_85)200 EUROPE IN FIGURES — <strong>Eurostat</strong> <strong>yearbook</strong> <strong>2009</strong>
Education 44.5 Educational expenditureIntroductionExpenditure on education is an <strong>in</strong>vestmentthat may help foster economicgrowth, enhance productivity, contributeto personal and social development, andreduce social <strong>in</strong>equalities. The proportionof total f<strong>in</strong>ancial resources devotedto education is one of the key choicesmade <strong>in</strong> each country by governments,enterprises and <strong>in</strong>dividual students andtheir families.There is an ongo<strong>in</strong>g debate <strong>in</strong> many MemberStates as to how to <strong>in</strong>crease educationfund<strong>in</strong>g, improve efficiency and promoteequity. Possible approaches <strong>in</strong>cludecharg<strong>in</strong>g tuition fees, adm<strong>in</strong>istrative orexam<strong>in</strong>ation charges, the <strong>in</strong>troductionof grants, or <strong>in</strong>come-cont<strong>in</strong>gent loans totry to stimulate enrolment rates <strong>in</strong> highereducation, <strong>in</strong> particular among the lesswell-off members of society. Anotherpossible area for rais<strong>in</strong>g funds is throughpromot<strong>in</strong>g partnerships between bus<strong>in</strong>essand higher educational establishments.Education accounts for a significant proportionof public expenditure <strong>in</strong> all ofthe Member States – the most importantbudget item be<strong>in</strong>g expenditure on staff.The cost of teach<strong>in</strong>g <strong>in</strong>creases significantlyas a child moves through the educationsystem, <strong>with</strong> expenditure per pupil/studentconsiderably higher <strong>in</strong> universitiesthan primary schools. Although tertiaryeducation costs more per head, the highestproportion of total education spend<strong>in</strong>gis devoted to secondary educationsystems, as these teach a larger share ofthe total number of pupils/students.Def<strong>in</strong>itions and data availabilityIndicators on education expenditure coverschools, universities and other publicand private <strong>in</strong>stitutions <strong>in</strong>volved <strong>in</strong> deliver<strong>in</strong>gor support<strong>in</strong>g educational services.Expenditure on <strong>in</strong>stitutions is notlimited to expenditure on <strong>in</strong>structionalservices but also <strong>in</strong>cludes public and privateexpenditure on ancillary services forstudents and families, where these servicesare provided through educational <strong>in</strong>stitutions.At the tertiary level, spend<strong>in</strong>gon research and development can also besignificant and is <strong>in</strong>cluded, to the extentthat the research is performed by educational<strong>in</strong>stitutions.Total public expenditure on education<strong>in</strong>cludes direct public fund<strong>in</strong>g for educational<strong>in</strong>stitutions and transfers to householdsand enterprises. In general, the publicsector f<strong>in</strong>ances educational expenditure byassum<strong>in</strong>g direct responsibility for the currentand capital expenditure of schools (directpublic f<strong>in</strong>anc<strong>in</strong>g of schools), or by offer<strong>in</strong>gf<strong>in</strong>ancial support to pupils/studentsand their families (public-sector grants andloans) and by subsidis<strong>in</strong>g the education ortra<strong>in</strong><strong>in</strong>g activities of the private bus<strong>in</strong>esssector or non-profit organisations (transfersto households and enterprises). Expenditureon educational <strong>in</strong>stitutions fromprivate sources comprises school fees;materials (such as textbooks and teach<strong>in</strong>gequipment); transport to school (if organisedby the school); meals (if provided bythe school); board<strong>in</strong>g fees; and expenditureby employers on <strong>in</strong>itial vocational tra<strong>in</strong><strong>in</strong>g.Expenditure per pupil/student <strong>in</strong>public and private <strong>in</strong>stitutions measuresEUROPE IN FIGURES — <strong>Eurostat</strong> <strong>yearbook</strong> <strong>2009</strong>201
4 Educationhow much central, regional and local government,private households, religious <strong>in</strong>stitutionsand enterprises spend per pupil/student. It <strong>in</strong>cludes expenditure for personnel,as well as other current and capital expenditure.Public schools/<strong>in</strong>stitutions aredef<strong>in</strong>ed as those which are directly or <strong>in</strong>directlyadm<strong>in</strong>istered by a public educationauthority. Private schools/<strong>in</strong>stitutionsare directly or <strong>in</strong>directly adm<strong>in</strong>istered by anon-governmental organisation (such as achurch, trade union, a private bus<strong>in</strong>ess concernor another body) and are considered tobe <strong>in</strong>dependent if they get less than 50 % oftheir fund<strong>in</strong>g from any level of government(local, regional or national).Ma<strong>in</strong> f<strong>in</strong>d<strong>in</strong>gsPublic expenditure on education <strong>in</strong> theEU-27 <strong>in</strong> 2005 was equivalent to 5.0 % ofGDP, while the expenditure of both publicand private sources of funds on educational<strong>in</strong>stitutions amounted to 5.4 % ofGDP.The highest public spend<strong>in</strong>g on educationwas observed <strong>in</strong> Denmark (8.3 %of GDP), while Sweden (7.0 %), Cyprus(6.9 %), Malta (6.8 %) and F<strong>in</strong>land (6.3 %)also recorded relatively high rates. MostMember States reported that public expenditureon education accounted for between4 and 6 % of their GDP, althoughthe proportion of public expenditure oneducation fell to below 4 % of GDP <strong>in</strong>Greece, Slovakia, Luxembourg and Romania;note that the tertiary educationsystem <strong>in</strong> Luxembourg is underdevelopedand that the majority of tertiary studentsattend courses <strong>in</strong> another Member State.It should be noted that GDP growth canmask significant <strong>in</strong>creases that have beenmade <strong>in</strong> terms of education spend<strong>in</strong>g overthe last decade <strong>with</strong><strong>in</strong> the majority ofMember States. Note also that decl<strong>in</strong><strong>in</strong>gbirth rates will result <strong>in</strong> reduced schoolage populations, which will have an effecton ratios such as the average expenditureper pupil (given that expenditure is heldconstant). Annual expenditure on publicand private educational <strong>in</strong>stitutions perpupil/student shows that an average ofPPS 5 650 was spent per pupil/student <strong>in</strong>2005 <strong>in</strong> the EU-27.Figure 4.8: Total public expenditure on education, 2005 (1)(% of GDP)10.07.55.02.50.0EU-27 (2)Euro area (2)DenmarkSwedenCyprusMaltaF<strong>in</strong>landBelgiumSloveniaFrancePolandHungaryUnited K<strong>in</strong>gdomAustriaPortugalNetherlandsLatviaLithuaniaEstoniaIrelandGermanyBulgariaItalyCzech RepublicSpa<strong>in</strong>GreeceSlovakiaLuxembourgRomaniaIcelandNorwaySwitzerlandUnited StatesCroatiaTurkey (4)JapanFYR of Macedonia (3)Liechtenste<strong>in</strong>(1) Refer to the Internet metadata file (http://epp.eurostat.ec.europa.eu/cache/ITY_SDDS/en/educ_esms.htm).(2) Estimate. (3) 2003. (4) 2004.Source: <strong>Eurostat</strong> (tsiir010)202 EUROPE IN FIGURES — <strong>Eurostat</strong> <strong>yearbook</strong> <strong>2009</strong>
Education 4Table 4.9: Expenditure on educational <strong>in</strong>stitutions (1)Publicexpenditure(% of GDP) (2)Privateexpenditure(% of GDP) (3)Annual expenditure on public and privateeducational <strong>in</strong>stitutions per pupil/student(PPS for full-time equivalents)2005 2005 2000 2005EU-27 4.7 0.7 : 5 650Euro area 4.6 0.6 : 6 190Belgium 5.7 0.4 5 314 6 501Bulgaria 3.8 0.6 1 277 1 993Czech Republic 4.1 0.6 2 574 3 809Denmark 6.8 0.6 7 108 8 244Germany 4.2 0.9 5 677 6 503Estonia 4.6 0.4 : 2 868Ireland 4.3 0.3 4 481 6 012Greece 4.0 0.3 : 4 606Spa<strong>in</strong> 4.1 0.5 4 304 5 718France 5.4 0.6 5 712 6 364Italy 4.2 0.4 : 5 908Cyprus 6.0 1.2 4 879 6 684Latvia 4.7 0.8 1 818 2 746Lithuania 4.5 0.5 1 716 2 475Luxembourg 3.7 : : :Hungary 5.1 0.5 : 3 842Malta 6.8 0.4 3 189 5 882Netherlands 4.6 0.4 5 211 6 703Austria 5.0 0.5 7 144 8 293Poland 5.4 0.6 1 971 3 051Portugal 5.3 0.4 3 943 4 704Romania 3.3 0.4 : 1 454Slovenia 5.3 0.8 : 6 056Slovakia 3.7 0.7 1 681 2 699F<strong>in</strong>land 5.8 0.1 5 455 6 225Sweden 6.2 0.2 6 185 7 204United K<strong>in</strong>gdom 5.0 1.3 4 799 7 084Croatia 4.6 : : :FYR of Macedonia 3.3 : : :Turkey 3.8 0.1 : :Iceland 7.2 0.7 6 501 7 897Liechtenste<strong>in</strong> 2.1 : : 7 389Norway 5.7 0.1 7 812 9 133Switzerland 5.5 0.6 : :Japan 3.4 1.5 6 091 7 148United States 4.9 2.4 9 200 10 661(1) Refer to the Internet metadata file (http://epp.eurostat.ec.europa.eu/cache/ITY_SDDS/en/educ_esms.htm).(2) Turkey, 2004; the former Yugoslav Republic of Macedonia, 2003.(3) Turkey and Norway, 2004.Source: <strong>Eurostat</strong> (educ_figdp, tps00068 and tps00067), Unesco, OE<strong>CD</strong>EUROPE IN FIGURES — <strong>Eurostat</strong> <strong>yearbook</strong> <strong>2009</strong>203
HealthHealth is an important priority for <strong>Europe</strong>ans, who expect to be protected aga<strong>in</strong>stillness and disease – at home, <strong>in</strong> the workplace and when travell<strong>in</strong>g across the EU.Health issues cut across a range of topics – <strong>in</strong>clud<strong>in</strong>g consumer protection (food safetyissues), workplace safety, environmental or social policies – and thus have a considerableimpact on the EU’s revised Lisbon strategy. The vast majority of policy areascovered <strong>with</strong><strong>in</strong> this chapter are under the remit of the Directorate-General for Healthand Consumers.However, the competence for the organisation and delivery of health services andhealthcare is largely held by the Member States, while the EU has the responsibilityto give added value through launch<strong>in</strong>g actions such as those <strong>in</strong> relation to crossborderhealth threats and patient mobility, as well as reduc<strong>in</strong>g health <strong>in</strong>equalities andaddress<strong>in</strong>g key health determ<strong>in</strong>ants. Gather<strong>in</strong>g and assess<strong>in</strong>g accurate, detailed <strong>in</strong>formationon health issues is vital for the EU to effectively design policies and targetfuture actions.A first programme for Community action <strong>in</strong> the field of public health (1) for the period2003 to 2008 focused on three ma<strong>in</strong> areas, namely:• to improve health <strong>in</strong>formation and knowledge for the development of publichealth;• to enhance the capability of respond<strong>in</strong>g rapidly and <strong>in</strong> a coord<strong>in</strong>ated fashion tothreats to health, and;• to promote health and prevent disease through address<strong>in</strong>g health determ<strong>in</strong>antsacross all policies and activities.(1) Decision No 1786/2002/EC of the <strong>Europe</strong>an Parliament and of the Council of 23 September 2002 adopt<strong>in</strong>g a programme of Community action <strong>in</strong>the field of public health (2003-2008) (OJ L 271, 9.10.2002, p. 1); http://europa.eu/eur-lex/pri/en/oj/dat/2002/l_271/l_27120021009en00010011.pdf.EUROPE IN FIGURES — <strong>Eurostat</strong> <strong>yearbook</strong> <strong>2009</strong>205
5 Health5.1 Healthy life yearsOn 23 October 2007 – the <strong>Europe</strong>anCommission adopted a new strategy ‘Togetherfor Health: A Strategic Approachfor the EU 2008-2013’ (2) . In order to br<strong>in</strong>gabout the changes sought <strong>with</strong><strong>in</strong> the sectorand identified <strong>with</strong><strong>in</strong> the new strategy,the second programme of CommunityAction <strong>in</strong> the Field of Health (3) came<strong>in</strong>to force from 1 January 2008. It puts<strong>in</strong> place an overarch<strong>in</strong>g, strategic frameworkfor work on health at the EU level <strong>in</strong>the com<strong>in</strong>g years and encompasses worknot only <strong>in</strong> the health sector but across allpolicy areas. It has four ma<strong>in</strong> pr<strong>in</strong>ciplesand three strategic themes for improv<strong>in</strong>ghealth <strong>in</strong> the EU. The pr<strong>in</strong>ciples <strong>in</strong>cludetak<strong>in</strong>g a value-driven approach, recognis<strong>in</strong>gthe l<strong>in</strong>ks between health and economicprosperity, <strong>in</strong>tegrat<strong>in</strong>g health <strong>in</strong>all policies, and strengthen<strong>in</strong>g the EU’svoice <strong>in</strong> global health issues. The strategicthemes <strong>in</strong>clude foster<strong>in</strong>g good health<strong>in</strong> an age<strong>in</strong>g <strong>Europe</strong>, protect<strong>in</strong>g citizensfrom health threats, and dynamic healthsystems and new technologies. The programmeis valued at EUR 321.5 millionand will be implemented by means of annualwork plans which will set out priorityareas and fund<strong>in</strong>g criteria.IntroductionLife expectancy at birth rema<strong>in</strong>s one ofthe most frequently quoted <strong>in</strong>dicators ofhealth status and economic development.While most people are aware that successivegenerations are liv<strong>in</strong>g longer, less isknown about the condition of health of<strong>Europe</strong>’s age<strong>in</strong>g population. Life expectancyat birth has risen rapidly <strong>in</strong> the lastcentury due to a number of important factors,<strong>in</strong>clud<strong>in</strong>g reductions <strong>in</strong> <strong>in</strong>fant mortality,ris<strong>in</strong>g liv<strong>in</strong>g standards, improvedlifestyles and better education, as well asadvances <strong>in</strong> healthcare and medic<strong>in</strong>e.The health status of a population is difficultto measure because it is hard todef<strong>in</strong>e among <strong>in</strong>dividuals, populations,cultures, or even across time periods.As a result, the demographic measure oflife expectancy has often been used as ameasure of a nation’s health status becauseit is based on a simple and easy tounderstand characteristic – namely, thatof death. However, the use of life expectancyis limited <strong>in</strong>sofar as it does not provideany <strong>in</strong>formation on a population’shealth status.Indicators on healthy life years (HLY)<strong>in</strong>troduce the concept of the quality oflife, by focus<strong>in</strong>g on those years that maybe enjoyed by <strong>in</strong>dividuals free from thelimitations of illness or disability. Chronicdisease, frailty, mental disorders andphysical disability tend to become moreprevalent <strong>in</strong> older age, and the burden ofthese conditions may impact on healthcareand pension provisions, while result<strong>in</strong>g<strong>in</strong> a low quality of life for thosewho suffer from such conditions.(2) http://ec.europa.eu/health/ph_overview/Documents/strategy_wp_en.pdf.(3) Decision No 1350/2007/EC of the <strong>Europe</strong>an Parliament and of the Council of 23 October 2007 establish<strong>in</strong>g a secondprogramme of Community action <strong>in</strong> the field of health (2008-2013) (OJ L 301/3, 20.11.2007);http://eur-lex.europa.eu/LexUriServ/LexUriServ.do?uri=OJ:L:2007:301:0003:0013:EN:PDF.206 EUROPE IN FIGURES — <strong>Eurostat</strong> <strong>yearbook</strong> <strong>2009</strong>
Health 5HLY also monitor health as a productiveor economic factor: these <strong>in</strong>dicators formpart of the structural <strong>in</strong>dicators that areused to analyse progress be<strong>in</strong>g made <strong>in</strong>the EU <strong>with</strong> respect to the revised Lisboncriteria. An <strong>in</strong>crease <strong>in</strong> HLY is one of thema<strong>in</strong> goals for <strong>Europe</strong>an health policy,given that this would not only improvethe situation of <strong>in</strong>dividuals (as goodhealth and a long life are fundamental objectivesof human activity) but would alsoresult <strong>in</strong> lower levels of public healthcareexpenditure. If HLY are <strong>in</strong>creas<strong>in</strong>g morerapidly than life expectancy, then notonly are people liv<strong>in</strong>g longer, but they arealso liv<strong>in</strong>g a greater proportion of theirlives free from health problems. Any loss<strong>in</strong> health will, nonetheless, have importanteffects. These will <strong>in</strong>clude an alteredpattern of resource allocation <strong>with</strong><strong>in</strong> thehealthcare system, as well as wider rang<strong>in</strong>geffects on consumption and productionthroughout the economy.Def<strong>in</strong>itions and data availabilityThe structural <strong>in</strong>dicator on healthy lifeyears (HLY) (also called disability-freelife expectancy (DFLE)) measures thenumber of rema<strong>in</strong><strong>in</strong>g years that a personof a certa<strong>in</strong> age can be expected to live<strong>with</strong>out disability; <strong>in</strong> other words, thisis a health expectancy <strong>in</strong>dicator. The <strong>in</strong>dicatoris calculated separately for malesand females.There are two components to the calculationof HLY, namely, mortality statisticsand data on self-perceived disability.Mortality data comes from <strong>Eurostat</strong>’s demographicdatabase, while self-perceiveddisability data has come from the EU’ssurvey of statistics on <strong>in</strong>come and liv<strong>in</strong>gconditions (EU-SILC). The way this questionwas implemented by the MemberStates <strong>in</strong> EU-SILC hampers cross-countrycomparisons for the data up to 2008.The EU-SILC question is:For at least the past 6 months, to whatextent have you been limited because ofa health problem <strong>in</strong> activities people usuallydo? Would you say you have been:• strongly limited?• limited?• not limited at all?Life expectancy at birth is def<strong>in</strong>ed as themean number of years still to be lived bya person at birth, if subjected throughoutthe rest of his or her life to the currentmortality conditions.Ma<strong>in</strong> f<strong>in</strong>d<strong>in</strong>gsWhile life expectancy rises, political attentionhas been re-focused on healthylife years (HLY). One measure that canbe used to study the relative health of<strong>Europe</strong>’s population is the relationshipbetween healthy life years and total lifeexpectancy, <strong>in</strong> other words, what percentageof each person’s life is lived free fromdisability and disease. Men were likely tospend the largest proportion of their livesfree from disability. Women could expectto live a slightly lower proportion of theirlives free from disability; although theiroverall life expectancy at birth was higherthan for men. Indeed, the male populationconsistently reported a higher proportionof healthy life years <strong>in</strong> total lifeexpectancy when compared <strong>with</strong> ratesfor women, <strong>with</strong> differences of 8 percentagepo<strong>in</strong>ts or more <strong>in</strong> Portugal, Lithuaniaand Latvia.The HLY <strong>in</strong>dicator is calculated at twoages: birth and the age of 65. Healthy lifeyears at age 65 is of particular <strong>in</strong>terest <strong>in</strong>relation to the possible future demand forhealthcare and social services, or the potentialfor older persons to rema<strong>in</strong> <strong>with</strong><strong>in</strong>the workforce. For both men and women,Estonia, Latvia, Lithuania, Hungary andSlovakia were the countries where peoplecould expect to spend the shortest periodEUROPE IN FIGURES — <strong>Eurostat</strong> <strong>yearbook</strong> <strong>2009</strong>207
5 Healthafter the age of 65 <strong>with</strong>out a disability.The data for Estonia, Luxembourg, Hungary,Austria and Iceland showed almostidentical <strong>figures</strong> for men and women<strong>in</strong> terms of additional healthy life yearsthey may expect to live at the age of 65.The highest differences between the sexeswere recorded <strong>in</strong> Poland and Cyprus. InPoland, women aged 65 were expected tohave 1.8 years of healthy life more thanmen, while <strong>in</strong> Cyprus the opposite situationwas found, as men could expect tohave 1.9 additional years of healthy lifethan women.Figure 5.1: Healthy life years at birth, 2005 (1)(% of total life expectancy)1007550250MaltaDenmarkPolandGreeceItalyUnited K<strong>in</strong>gdomNetherlandsIrelandSwedenFranceSpa<strong>in</strong>BelgiumLuxembourgCzech RepublicSlovakiaSloveniaCyprusLithuaniaAustriaPortugalLatviaHungaryGermanyEstoniaF<strong>in</strong>landIcelandNorwayMaleFemale(1) Provisional data; Italy, life expectancy data is for 2004; Bulgaria and Romania, not available; the figure is ranked on the average ofmale and female.Source: <strong>Eurostat</strong> (tsdph100 and tps00025)Figure 5.2: Healthy life years at age 65, 2005 (1)(years)15129630DenmarkMaltaSwedenUnited K<strong>in</strong>gdomNetherlandsGreeceItalyIrelandSpa<strong>in</strong>BelgiumLuxembourgPolandFranceSloveniaCzech RepublicAustriaF<strong>in</strong>landGermanyCyprusPortugalLatviaSlovakiaHungaryLithuaniaEstoniaIcelandNorwayMaleFemale(1) Provisional data; Bulgaria and Romania, not available; the figure is ranked on the average of male and female.Source: <strong>Eurostat</strong> (tsdph220)208 EUROPE IN FIGURES — <strong>Eurostat</strong> <strong>yearbook</strong> <strong>2009</strong>
Health 55.2 Health problemsIntroductionAccord<strong>in</strong>g to the Directorate-General forHealth and Consumers (4) , the promotionof health and lifestyle choices can play animportant role <strong>in</strong> reduc<strong>in</strong>g disease anddeath. On average, <strong>Europe</strong>ans <strong>with</strong> betterjobs, more education or higher <strong>in</strong>comeshave better health and longer life expectancy.Actions to reduce health <strong>in</strong>equalitiesaim:• to improve everyone’s level of healthcloser to that of the most advantaged;• to ensure that the health needs ofthe most disadvantaged are fullyaddressed;• to help the health of people <strong>in</strong> countriesand regions <strong>with</strong> lower levels ofhealth to improve faster.Health problems l<strong>in</strong>ked to lifestyle relatedhealth determ<strong>in</strong>ants can be age specific(<strong>in</strong> childhood or <strong>in</strong> old age), as wellas result<strong>in</strong>g from socio-economic factors.Health promotion <strong>in</strong> various sett<strong>in</strong>gs,such as schools, workplaces, families orlocal communities has proven to be efficient<strong>in</strong> address<strong>in</strong>g health issues acrosscommunities, focus<strong>in</strong>g on specific diseasesor target groups.Six out of the seven most important riskfactors for premature death <strong>in</strong> the EU(blood pressure, cholesterol, body mass<strong>in</strong>dex, <strong>in</strong>adequate fruit and vegetable <strong>in</strong>take,physical <strong>in</strong>activity, excessive alcoholconsumption) relate to how people eat,dr<strong>in</strong>k and move (the only exception be<strong>in</strong>gtobacco). As such, a balanced diet andregular physical activity, along <strong>with</strong> restra<strong>in</strong><strong>in</strong>gfrom smok<strong>in</strong>g and dr<strong>in</strong>k<strong>in</strong>g toexcess, are important factors <strong>in</strong> the promotionand ma<strong>in</strong>tenance of good health.Nevertheless, smok<strong>in</strong>g is the s<strong>in</strong>gle largestcause of avoidable death <strong>in</strong> the EUaccount<strong>in</strong>g for over half a million deathseach year. The Directorate-General forHealth and Consumers estimates that25 % of all cancer deaths and 15 % ofall deaths <strong>in</strong> the EU can be attributed tosmok<strong>in</strong>g. Smok<strong>in</strong>g legislation has beenadopted by an <strong>in</strong>creas<strong>in</strong>g number ofMember States, restrict<strong>in</strong>g or forbidd<strong>in</strong>gsmok<strong>in</strong>g <strong>in</strong> public places and/or workplaces,as well as offer<strong>in</strong>g protection topassive smokers. The <strong>Europe</strong>an Commissionis develop<strong>in</strong>g a tobacco controlpolicy, focused on:• legislative measures;• support for <strong>Europe</strong>-wide smok<strong>in</strong>gprevention and cessation activities;• ma<strong>in</strong>stream<strong>in</strong>g tobacco control <strong>in</strong>toa range of other Community policies(such as agricultural, taxation or developmentpolicy);• mak<strong>in</strong>g sure that the pioneer<strong>in</strong>g roleplayed by the <strong>Europe</strong>an Community<strong>in</strong> many tobacco control areas has animpact at a global level.Overweightness and obesity are <strong>in</strong>creas<strong>in</strong>gat an alarm<strong>in</strong>g rate <strong>in</strong> <strong>Europe</strong>, especiallyamong children. Obesity is a seriouspublic health problem, as it <strong>in</strong>creasessignificantly the risk of chronic diseasessuch as cardiovascular disease, type 2 diabetesand certa<strong>in</strong> cancers. Lifestyle factors,<strong>in</strong>clud<strong>in</strong>g diet, eat<strong>in</strong>g habits and levels ofphysical activity (and <strong>in</strong>activity) are oftenadopted dur<strong>in</strong>g the early years of life. Assuch, childhood obesity is strongly l<strong>in</strong>kedto adult obesity. However, ma<strong>in</strong>ta<strong>in</strong><strong>in</strong>g a‘normal weight’ can be a challeng<strong>in</strong>g exercise,given the abundance of energy-richfoods, and lifestyle pressures that decrease(4) http://ec.europa.eu/health/ph_determ<strong>in</strong>ants/healthdeterm<strong>in</strong>ants_en.htm.EUROPE IN FIGURES — <strong>Eurostat</strong> <strong>yearbook</strong> <strong>2009</strong>209
5 Healthopportunities for physical activity both atwork and dur<strong>in</strong>g leisure time.Def<strong>in</strong>itions and data availabilityHealth Interview Surveys (HIS) are thesource of <strong>in</strong>formation for describ<strong>in</strong>g thehealth status and the health-related behavioursof the <strong>Europe</strong>an population.The follow<strong>in</strong>g topics are usually covered<strong>in</strong> a HIS:• height and weight which form thebasis for the calculation of the bodymass <strong>in</strong>dex (BMI);• self-perceived health;• activities that have been reduced becauseof health problems;• long-stand<strong>in</strong>g illnesses or healthproblems;• smok<strong>in</strong>g behaviour;• alcohol consumption.Many health-related <strong>in</strong>dicators are expressedas percentages <strong>with</strong><strong>in</strong> differentpopulation cohorts on the basis of backgroundvariables cover<strong>in</strong>g gender, age, activitystatus, and educational level. Notethat the <strong>in</strong>formation comes from nonharmonisednational surveys and thatthe Member States were asked to postharmonisethe data accord<strong>in</strong>g to a set ofcommon guidel<strong>in</strong>es. Member States havejo<strong>in</strong>ed efforts on a harmonised EU survey(EHIS) which is, at the time of writ<strong>in</strong>g,be<strong>in</strong>g implemented.The body mass <strong>in</strong>dex (BMI) is a measureof a person’s weight relative to his orher height that correlates fairly well <strong>with</strong>body fat. The BMI is accepted as the mostuseful measure of obesity for adults whenonly weight and height data are available.It is calculated as the result of divid<strong>in</strong>gbody weight (<strong>in</strong> kilograms) by bodyheight (<strong>in</strong> metres) squared. The follow<strong>in</strong>gsubdivisions are used to categorise theBMI <strong>in</strong>to four categories:• < 18.5: underweight;• ≥ 18.5 and < 25: normal weight;• ≥ 25 and < 30: overweight;• ≥ 30: obese.Note that the BMI is not calculated forchildren. Note that data for Germanyand for England relate to valid height andweight measurements, while for the othercountries the data correspond to selfdeclaredheight and weight.Ma<strong>in</strong> f<strong>in</strong>d<strong>in</strong>gsObesity is a serious public health problemthat <strong>in</strong>creases the risk of death anddisability; it may be associated primarily<strong>with</strong> poor dietary habits and a lackof physical activity. Obesity rates have<strong>in</strong>creased considerably <strong>in</strong> most MemberStates dur<strong>in</strong>g the last decade. Approximatelyhalf of the EU’s population wasoverweight or obese, a share that rose toas high as 61.0 % <strong>in</strong> England and 59.7 %<strong>in</strong> Germany, while Italy and France werethe only Member States to report that lessthan 40 % of their population were eitheroverweight or obese.The proportion of daily smokers wasclose to 50 % of the male population <strong>in</strong>Latvia and Estonia; Sweden (16.5 %) andF<strong>in</strong>land (21.6 %) reported the lowest proportionsof men smok<strong>in</strong>g. Daily smok<strong>in</strong>grates were lower among women (compared<strong>with</strong> men) <strong>in</strong> each of the MemberStates, <strong>with</strong> the exception of Sweden210 EUROPE IN FIGURES — <strong>Eurostat</strong> <strong>yearbook</strong> <strong>2009</strong>
Health 5where there was a slightly higher proportionof female daily smokers. Austria andDenmark recorded the highest <strong>in</strong>cidenceof daily smok<strong>in</strong>g among women, at justover 30 % of the female population, whilePortugal (6.8 %) was the only MemberState where the proportion of femaledaily smokers was <strong>in</strong> s<strong>in</strong>gle <strong>figures</strong>. Thelargest absolute differences <strong>in</strong> smok<strong>in</strong>ghabits between the sexes were reportedfor the Baltic States, where the proportionof men smok<strong>in</strong>g daily was upwardsof 30 po<strong>in</strong>ts more than the correspond<strong>in</strong>gshare for women. In relative terms, fourtimes as many men (as women) smokedon a daily basis <strong>in</strong> Portugal, while betweenthree and four times as many mensmoked on daily basis <strong>in</strong> Cyprus, Lithuania,Romania and Latvia.There would appear to be a shift <strong>in</strong> smok<strong>in</strong>gpatterns across <strong>Europe</strong> between thesexes. There was a much smaller differencebetween the proportion of menand women smok<strong>in</strong>g when study<strong>in</strong>gthe population aged between 15 and 24.Young females <strong>in</strong> Sweden and the UnitedK<strong>in</strong>gdom were more likely to smoke thanyoung males. Furthermore, <strong>in</strong> the majorityof Member States the proportion ofyoung women smok<strong>in</strong>g was often abovethe correspond<strong>in</strong>g average for women ofall ages; this was particularly the case <strong>in</strong>the United K<strong>in</strong>gdom, Spa<strong>in</strong>, Ireland andGermany.Information from the EU’s survey on <strong>in</strong>comeand liv<strong>in</strong>g conditions (EU-SILC)provides data on difficulties faced by<strong>Europe</strong>ans <strong>in</strong> their daily lives and theirpotential need for assistance; note thatthe data represents the perceived viewsof the population and does not specificallymeasure disability levels. With<strong>in</strong>the EU-25, some 6.9 % of men and 8.7 %of women (aged 15 or more) reported thatthey were severely hampered <strong>in</strong> activitiespeople usually do because of health problemsfor at least the six months prior tothe survey (conducted <strong>in</strong> 2006).The proportion of women that were severelyhampered <strong>in</strong> everyday activitiesdue to health problems was higher acrosseach of the Member States than the correspond<strong>in</strong>gshare for men (except <strong>in</strong> Ireland,where the share among men was0.1 po<strong>in</strong>ts higher than for women). Thedifference <strong>in</strong> rates between the sexes roseto almost 4 percentage po<strong>in</strong>ts <strong>in</strong> Portugal,where 13.4 % of women were severelyhampered, and was above 3 percentagepo<strong>in</strong>ts <strong>in</strong> Slovakia, F<strong>in</strong>land, Lithuaniaand Latvia; each of these countries reportedthat <strong>in</strong> excess of 10 % of their femalepopulation was severely hampered<strong>in</strong> everyday activities because of healthproblems.EUROPE IN FIGURES — <strong>Eurostat</strong> <strong>yearbook</strong> <strong>2009</strong>211
5 HealthFigure 5.3: Overweight people, 2003 (1)(% of total population)706050403020100United K<strong>in</strong>gdom (2)GermanyMaltaGreeceHungaryPortugalF<strong>in</strong>landCzech RepublicSpa<strong>in</strong>LithuaniaSloveniaSlovakiaIrelandBulgariaCyprusLatviaEstoniaSwedenObeseOverweightAustriaPolandNetherlandsBelgiumDenmarkRomaniaItalyFranceIcelandSwitzerlandNorway(1) National health <strong>in</strong>terview survey (HIS) data, 1996-2003 depend<strong>in</strong>g on the country; note that data for Germany and for Englandrelate to valid height and weight measurements, while for the other countries the data correspond to self-declared height and weight.Luxembourg, not available.(2) Only England.Source: <strong>Eurostat</strong> (hlth_ls_bmia)Figure 5.4: Daily smokers, 2003 (1)(% of male / female population)6050403020100AustriaSloveniaEstoniaDenmarkLatviaBulgariaHungaryPolandLithuaniaSpa<strong>in</strong>NetherlandsGreeceUnited K<strong>in</strong>gdom (2)GermanyFrance (2)Czech RepublicItaly (2)CyprusBelgiumMaltaIrelandRomaniaSlovakiaF<strong>in</strong>landSwedenPortugalSwitzerlandNorwayIcelandMaleFemale(1) National health <strong>in</strong>terview survey (HIS) data, 1996-2003 depend<strong>in</strong>g on the country; Luxembourg, not available; the figure is rankedon the average of male and female.(2) No dist<strong>in</strong>ction between daily and occasional smok<strong>in</strong>g.Source: <strong>Eurostat</strong> (tps00169)212 EUROPE IN FIGURES — <strong>Eurostat</strong> <strong>yearbook</strong> <strong>2009</strong>
Health 5Figure 5.5: Daily smokers among the population aged 15-24, 2003 (1)(% of male/female population aged 15-24)50403020100AustriaHungaryGermanyUnited K<strong>in</strong>gdom (2)EstoniaSpa<strong>in</strong>BulgariaLatviaDenmarkIrelandNetherlandsSloveniaFrance (2)MaltaLithuaniaBelgiumGreeceCyprusCzech RepublicItaly (2)F<strong>in</strong>landPortugalSlovakiaPolandSwedenRomaniaSwitzerlandNorwayIcelandMaleFemale(1) National health <strong>in</strong>terview survey (HIS) data, 1996-2003 depend<strong>in</strong>g on the country; Luxembourg, not available; the figure is rankedon the average of male and female.(2) No dist<strong>in</strong>ction between daily and occasional smok<strong>in</strong>g.Source: <strong>Eurostat</strong> (tps00170)Figure 5.6: Persons severely hampered <strong>in</strong> activities people usually do because of healthproblems for at least the past 6 months, 2006 (1)(% of male/female population aged 15 years and over)20151050EU-25HungaryF<strong>in</strong>landPortugalSlovakiaLithuaniaLatviaEstoniaAustriaSpa<strong>in</strong>CyprusUnited K<strong>in</strong>gdomSloveniaGermanyNetherlandsSwedenBelgiumItalyLuxembourgCzech RepublicFrancePolandIrelandGreeceMaltaNorwayIcelandMaleFemale(1) Bulgaria, Denmark and Romania, not available; the figure is ranked on the average of male and female.Source: <strong>Eurostat</strong> (hlth_silc_06)EUROPE IN FIGURES — <strong>Eurostat</strong> <strong>yearbook</strong> <strong>2009</strong>213
5 Health5.3 HealthcareIntroductionMost <strong>Europe</strong>ans agree that there is a basicneed for universal access to healthcare,as the cost of many modern-dayhealth treatments can often be prohibitiveto the average person. The provisionof healthcare systems varies considerablybetween the Member States, althoughwidespread use is made of public provision(national or regional health services)and comprehensive healthcare <strong>in</strong>surance.Healthcare schemes generally cover theirentire resident population; nevertheless,an <strong>in</strong>creas<strong>in</strong>g proportion of <strong>in</strong>dividualschoose to adhere to private <strong>in</strong>suranceschemes (usually on top of the nationalprovision for care).Public regulation of the healthcare sectoris a complex task, as the healthcare marketis characterised by numerous market imperfections.Member States generally aimto balance the efficient use of resources<strong>with</strong> ensur<strong>in</strong>g that healthcare provisionsare available to all. There is no simple answerto the question of how much a countryshould spend on healthcare, as each ofthe Member States faces a different burdenof disease, while populations have differentexpectations of what services theirnational healthcare systems should offer.Indeed, the amount of money needed tofund a healthcare system is a function ofa large number of variables, the most obviousbe<strong>in</strong>g the burden of disease requir<strong>in</strong>gtreatment – although there is no simplel<strong>in</strong>ear relationship between the burdenof disease and the need for resources, assome conditions can be treated simplyand at low cost while others may require acomplex and expensive care.The ma<strong>in</strong> consumers of healthcare areolder people – a section of the <strong>Europe</strong>anpopulation that is grow<strong>in</strong>g rapidly, partlyas a result of the baby-boom cohortreach<strong>in</strong>g older age, but also because ofcont<strong>in</strong>ued <strong>in</strong>creases <strong>in</strong> life expectancy.The likely <strong>in</strong>crease <strong>in</strong> numbers of elderlypersons will probably drive demand formore healthcare provision <strong>in</strong> the future,while medical advances are also likelyto result <strong>in</strong> more and better treatmentsbe<strong>in</strong>g available. Demand for healthcareis also likely to rise <strong>in</strong> the com<strong>in</strong>g years<strong>in</strong> relation to long-term care provision(nurs<strong>in</strong>g and convalescence homes).In addition, more patients are travell<strong>in</strong>gacross borders to receive treatment,to avoid wait<strong>in</strong>g lists or to seek specialisttreatment that may only be availableabroad. The EU works towards ensur<strong>in</strong>gthat people who move across bordershave access to healthcare anywhere <strong>with</strong><strong>in</strong>the Union. Indeed, healthcare systemsand health policies across the EU are becom<strong>in</strong>gmore <strong>in</strong>terconnected. This is notonly a result of the movement of patientsand professionals between countries, butmay also be attributed to a set of commonpublic expectations of health servicesacross <strong>Europe</strong>, as well as more rapid dissem<strong>in</strong>ationof new medical technologiesand techniques. On 2 July 2008, as part ofa Renewed Social Agenda, the <strong>Europe</strong>anCommission adopted a draft Directiveon the application of patients’ rights tocross-border healthcare (5) .(5) http://ec.europa.eu/health/ph_overview/co_operation/healthcare/docs/COM_en.pdf.214 EUROPE IN FIGURES — <strong>Eurostat</strong> <strong>yearbook</strong> <strong>2009</strong>
Health 5Def<strong>in</strong>itions and data availabilityInformation on healthcare can be divided<strong>in</strong>to two broad groups of data: resourcerelatedhealthcare data on human andtechnical resources; and output-relateddata that focuses on hospital patients andthe treatment(s) they receive. Healthcaredata are largely based on adm<strong>in</strong>istrativedata sources, and, to a large degree, theyreflect country-specific ways of organis<strong>in</strong>ghealthcare; as such, the <strong>in</strong>formationcollected may not always be completelycomparable.Hospitals are def<strong>in</strong>ed accord<strong>in</strong>g to theclassification of healthcare providers ofthe System of Health Accounts (SHA);all public and private hospitals should becovered.Data on healthcare staff, <strong>in</strong> the form ofhuman resources available for provid<strong>in</strong>ghealthcare services, is provided irrespectiveof the sector of employment(i.e. whether the personnel are <strong>in</strong>dependent,employed by a hospital, or any otherhealthcare provider). These statistics coverhealthcare professionals such as physicians,dentists, nurses, pharmacists andphysiotherapists. In the context of compar<strong>in</strong>ghealthcare services across MemberStates, <strong>Eurostat</strong> gives preference tothe concept of ‘practis<strong>in</strong>g professionals’,as this best describes the availability ofhealthcare resources. By way of example,physicians may be counted as licensed,economically active or practis<strong>in</strong>g. Datafor two or more concepts are available<strong>in</strong> the majority of Member States. Thepreference, however, is for practis<strong>in</strong>gphysicians who are def<strong>in</strong>ed as those see<strong>in</strong>gpatients either <strong>in</strong> a hospital, practiceor elsewhere. Practis<strong>in</strong>g physicians’ tasks<strong>in</strong>clude: conduct<strong>in</strong>g medical exam<strong>in</strong>ationand mak<strong>in</strong>g diagnosis, prescrib<strong>in</strong>gmedication and giv<strong>in</strong>g treatment for diagnosedillnesses, disorders or <strong>in</strong>juries,giv<strong>in</strong>g specialised medical or surgicaltreatment for particular types of illnesses,disorders or <strong>in</strong>juries, giv<strong>in</strong>g advice onand apply<strong>in</strong>g preventive medic<strong>in</strong>e methodsand treatments.Hospital bed numbers provide <strong>in</strong>formationon healthcare capacities, i.e. on themaximum number of patients who canbe treated by hospitals. Hospital beds arethose which are regularly ma<strong>in</strong>ta<strong>in</strong>ed andstaffed and immediately available for thecare of admitted patients. These <strong>in</strong>clude:beds <strong>in</strong> all hospitals, <strong>in</strong>clud<strong>in</strong>g generalhospitals, mental health and substanceabuse hospitals, and other specialty hospitals:occupied and unoccupied beds.The statistics exclude surgical tables, recoverytrolleys, emergency stretchers,beds for same-day care, cots for healthy<strong>in</strong>fants, beds <strong>in</strong> wards which were closedfor any reason, provisional and temporarybeds, or beds <strong>in</strong> nurs<strong>in</strong>g and residentialcare facilities. They cover beds accommodat<strong>in</strong>gpatients who are formally admitted(or hospitalised) to an <strong>in</strong>stitution fortreatment and/or care and who stay fora m<strong>in</strong>imum of one night <strong>in</strong> the hospitalor other <strong>in</strong>stitution provid<strong>in</strong>g <strong>in</strong>-patientcare. Curative care (or acute care) beds<strong>in</strong> hospitals are beds that are available forcurative care; these form a subgroup oftotal hospital beds.EUROPE IN FIGURES — <strong>Eurostat</strong> <strong>yearbook</strong> <strong>2009</strong>215
5 HealthOutput-related <strong>in</strong>dicators focus on hospitalpatients and covers the <strong>in</strong>teractionbetween patients and healthcare systems,namely <strong>in</strong> the form of the treatment received.Data <strong>in</strong> this doma<strong>in</strong> are availablefor a range of <strong>in</strong>dicators <strong>in</strong>clud<strong>in</strong>g hospitaldischarges of <strong>in</strong>-patients and daycases by age, sex, and selected (groups of)diseases; the average length of stay of <strong>in</strong>patients;or the medical procedures performed<strong>in</strong> hospitals; the number of hospitaldischarges is the most commonly usedmeasure of the utilisation of hospitalservices. Discharges, rather than admissions,are used because hospital abstractsfor <strong>in</strong>-patient care are based on <strong>in</strong>formationgathered at the time of discharge. Ahospital discharge is def<strong>in</strong>ed as the formalrelease of a patient from a hospitalafter a procedure or course of treatment.A discharge occurs whenever a patientleaves because of f<strong>in</strong>alisation of treatment,signs out aga<strong>in</strong>st medical advice,transfers to another healthcare <strong>in</strong>stitutionor on death; healthy newborn babiesshould be <strong>in</strong>cluded; transfers to anotherdepartment <strong>with</strong><strong>in</strong> the same <strong>in</strong>stitutionare excluded.Ma<strong>in</strong> f<strong>in</strong>d<strong>in</strong>gsThe highest number of physicians per100 000 <strong>in</strong>habitants was recorded <strong>in</strong>Greece (almost 500 professionally activephysicians <strong>in</strong> 2005), followed by Belgium(405 practis<strong>in</strong>g physicians <strong>in</strong> 2007) andAustria (376 practis<strong>in</strong>g physicians <strong>in</strong>2007); note the methodological differencesbetween the various types of physiciansreported <strong>in</strong> each country.In 2005 there was an average of 590 hospitalbeds per 100 000 <strong>in</strong>habitants <strong>with</strong><strong>in</strong>the EU-27, compared <strong>with</strong> 695 beds <strong>in</strong>1997 (an overall reduction of 15 %); Austriawas the only Member State to reportan <strong>in</strong>crease <strong>in</strong> hospital bed numbers, ris<strong>in</strong>gby 24.6 beds per 100 000 <strong>in</strong>habitantsover the period 1996 to 2005. A more detailedbreakdown shows that reductions<strong>in</strong> bed numbers were spread across differentcategories, <strong>with</strong> an average of 406.3curative care beds available per 100 000<strong>in</strong>habitants <strong>in</strong> the EU-27 <strong>in</strong> 2005, whilethere were 60.4 psychiatric beds <strong>in</strong> hospitalsper 100 000 <strong>in</strong>habitants; compared<strong>with</strong> 1997 these latest <strong>figures</strong> representedoverall reductions of 16.6 % and 22.6 %respectively.The general reduction <strong>in</strong> hospital bednumbers may result from a more efficientuse of resources, <strong>with</strong> an <strong>in</strong>creas<strong>in</strong>gnumber of operations be<strong>in</strong>g dealt <strong>with</strong> <strong>in</strong>out-patient treatment, and shorter periodsbe<strong>in</strong>g spent <strong>in</strong> hospital follow<strong>in</strong>g an operation.Nevertheless, the output of eachNational Health Service, as measured bythe number of <strong>in</strong>-patient discharges, willusually (at least to some degree), reflectthe number of physicians and hospitalbeds available. The highest number ofhospital discharges <strong>in</strong> 2006 was recorded<strong>in</strong> Austria (more than 27 000 per 100 000<strong>in</strong>habitants), which was almost 25 %more than the next highest figure, 21 866discharges <strong>in</strong> Lithuania. At the other endof the range, the number of hospital dischargesof <strong>in</strong>-patients was relatively low<strong>in</strong> both Malta (2004) and Cyprus (below7 000 per 100 000 <strong>in</strong>habitants).216 EUROPE IN FIGURES — <strong>Eurostat</strong> <strong>yearbook</strong> <strong>2009</strong>
Health 5Diseases of the circulatory system accountedfor the highest number of hospitaldischarges <strong>in</strong> 2006 <strong>in</strong> the vast majorityof countries for which data are available,often <strong>with</strong> upwards of 3 000 dischargesper 100 000 <strong>in</strong>habitants. In Bulgaria andRomania (both 2005), higher numbers ofdischarges were recorded for diseases ofthe respiratory system. In Ireland, Spa<strong>in</strong>(2005) and Malta (2005) there were moredischarges from pregnancies, while <strong>in</strong>Cyprus the highest number of dischargesresulted from <strong>in</strong>jury or poison<strong>in</strong>g.Ireland, Spa<strong>in</strong>, Cyprus and Malta werecharacterised by relatively low levels ofhospital discharges, which may, at least<strong>in</strong> some cases, be due to patients travell<strong>in</strong>gabroad <strong>in</strong> order to receive specialisttreatment.The average length of stay <strong>in</strong> hospital wasgenerally longest for those patients suffer<strong>in</strong>gfrom cancer or from circulatorysystem problems. The average time spent<strong>in</strong> hospital is a function of hospital efficiency,as well as the type of treatmentsthat are on offer; France, Cyprus, Maltaand Poland reported the shortest averagestays <strong>in</strong> hospital. At the other end of therange, some of the longest average stayswere registered <strong>in</strong> F<strong>in</strong>land, the CzechRepublic, Germany and Lithuania, <strong>with</strong>lengthy average stays for diseases of thecirculatory system a common feature.EUROPE IN FIGURES — <strong>Eurostat</strong> <strong>yearbook</strong> <strong>2009</strong>217
5 HealthTable 5.1: Healthcare <strong>in</strong>dicators(per 100 000 <strong>in</strong>habitants)Practis<strong>in</strong>g physicians (1)Hospital bedsHospital discharges of<strong>in</strong>-patients (exclud<strong>in</strong>ghealthy new born babies)1996 2006 (2) 1996 (3) 2006 (4) 2001 2006 (5)EU-27 : : 694.8 590.4 : :Belgium 360.3 404.7 798.3 672.3 16 162 16 084Bulgaria 354.8 366.1 1 049.6 621.4 : 20 217Czech Republic 298.6 355.7 886.9 817.0 : 20 799Denmark 252.3 308.4 459.8 : 16 326 :Germany 310.8 345.5 957.8 829.1 20 060 21 481Estonia 317.0 328.9 795.5 565.3 : :Ireland 208.5 282.4 673.7 524.7 14 025 13 656Greece 386.3 499.4 517.3 473.8 : :Spa<strong>in</strong> 290.2 368.3 389.1 334.1 10 904 10 780France 324.4 338.2 853.8 707.5 17 937 16 445Italy 409.9 366.6 655.0 395.2 : :Cyprus 246.9 250.4 498.7 373.7 7 031 6 536Latvia 282.1 286.1 1 038.3 755.4 : 19 970Lithuania 373.2 364.8 1 092.0 801.0 23 454 21 866Luxembourg 212.6 327.7 1 079.9 : 18 172 17 242Hungary 304.3 303.7 903.0 792.1 : :Malta : 332.8 576.8 237.8 : 6 871Netherlands 189.9 : 522.2 438.2 : 10 135Austria 280.6 375.7 746.3 770.9 : 27 119Poland 235.1 218.0 766.3 647.5 : 17 955Portugal 262.3 267.8 399.3 365.1 : 9 127Romania : 215.8 757.0 658.6 : :Slovenia : 235.8 566.6 477.5 : 16 045Slovakia 257.1 315.9 832.7 671.4 20 534 19 124F<strong>in</strong>land 213.7 244.5 803.0 695.6 : 19 620Sweden 289.0 356.6 559.8 287.7 14 997 :United K<strong>in</strong>gdom : 235.6 433.4 388.7 : :Croatia 219.9 : 618.5 545.0 12 268 13 307FYR of Macedonia 226.4 245.2 523.0 470.2 : :Turkey : : 248.5 241.2 : :Iceland 310.9 364.0 : : 16 789 16 084Norway 283.1 377.7 400.6 402.7 15 999 17 424Switzerland 180.0 : 665.9 555.6 : 15 656(1) Greece, France, Italy and the former Yugoslav Republic of Macedonia, professionally active physicians; Ireland and Malta, licensedphysicians.(2) Belgium, Spa<strong>in</strong>, Latvia, Malta and Austria, 2007; Denmark, Greece, F<strong>in</strong>land, the United K<strong>in</strong>gdom and the former Yugoslav Republicof Macedonia, 2005; Luxembourg and Portugal, 2004.(3) EU-27, Denmark and the United K<strong>in</strong>gdom,1997.(4) France, Latvia and Malta, 2007; EU-27, Greece, Austria, the United K<strong>in</strong>gdom, Croatia, the former Yugoslav Republic of Macedoniaand Switzerland, 2005; Portugal and Turkey, 2004.(5) Belgium, Bulgaria, Spa<strong>in</strong>, Latvia, Luxembourg, the Netherlands, Poland, Portugal, Slovakia, Croatia, Iceland, Norway andSwitzerland, 2005; Malta, 2004.Source: <strong>Eurostat</strong> (tps00044, hlth_rs_prs, tps00046 and hlth_co_disch2)218 EUROPE IN FIGURES — <strong>Eurostat</strong> <strong>yearbook</strong> <strong>2009</strong>
Health 5Table 5.2: Hospital beds(per 100 000 <strong>in</strong>habitants)Curative care beds <strong>in</strong> hospitalsPsychiatric care beds <strong>in</strong> hospitals1996 (1) 2001 (2) 2006 (3) 1996 (1) 2001 (2) 2006 (4)EU-27 487.2 450.7 406.3 78.0 66.0 60.4Belgium 503.3 472.6 441.1 257.9 252.8 182.8Bulgaria : 583.1 469.0 88.0 71.1 67.1Czech Republic 728.7 609.6 568.6 100.2 99.3 94.9Denmark 380.2 349.5 327.8 79.6 75.1 :Germany 744.5 680.3 634.9 : : :Estonia 638.8 528.1 382.2 100.5 70.6 55.3Ireland 306.3 281.1 279.8 168.8 126.9 90.3Greece 389.7 387.3 : 107.1 93.5 86.9Spa<strong>in</strong> 303.9 287.2 259.9 58.5 51.0 46.2France 460.8 416.0 372.1 123.6 104.5 91.2Italy 552.6 407.0 331.7 54.9 14.4 13.1Cyprus 366.4 370.4 349.1 87.8 38.1 26.9Latvia 903.9 609.0 531.8 177.0 153.0 136.7Lithuania 871.4 625.0 529.9 134.0 122.6 102.6Luxembourg 618.8 572.2 549.4 128.0 83.8 :Hungary 627.3 563.7 552.0 105.3 42.4 38.3Malta 387.7 372.7 280.4 47.8 41.4 51.6Netherlands 331.7 306.5 287.6 172.2 155.9 130.8Austria 665.4 628.7 606.6 75.2 53.2 61.7Poland 576.4 509.9 463.2 83.5 73.3 68.0Portugal : : : : : :Romania 569.2 551.5 456.3 88.8 83.9 79.7Slovenia 475.4 446.1 388.2 80.3 75.2 71.4Slovakia 620.5 566.5 501.1 90.6 93.0 83.8F<strong>in</strong>land 295.8 241.2 223.7 120.5 101.1 92.1Sweden 304.5 245.2 : 82.3 58.6 49.1United K<strong>in</strong>gdom 321.0 315.0 309.7 103.0 85.9 73.7Croatia 390.0 378.1 340.2 106.6 102.7 94.4FYR of Macedonia 354.2 329.8 312.6 75.6 68.2 60.7Turkey 190.6 218.0 231.1 12.8 12.5 12.1Iceland 375.7 : : : : :Norway 334.2 311.4 292.4 71.2 72.9 102.3Switzerland 551.4 412.3 365.9 128.8 113.2 106.1(1) EU-27, Denmark, Malta and the United K<strong>in</strong>gdom, 1997.(2) Hungary and Sweden, break <strong>in</strong> series.(3) France, Latvia and Malta, 2007; EU-27, Greece, Austria, the United K<strong>in</strong>gdom, Croatia, the former Yugoslav Republic of Macedoniaand Switzerland, 2005; Luxembourg and Turkey, 2004.(4) France, Latvia and Malta, 2007; EU-27, Greece, Austria, the United K<strong>in</strong>gdom, Croatia, the former Yugoslav Republic of Macedoniaand Switzerland, 2005; Turkey, 2004.Source: <strong>Eurostat</strong> (tps00168 and tps00047)EUROPE IN FIGURES — <strong>Eurostat</strong> <strong>yearbook</strong> <strong>2009</strong>219
5 HealthTable 5.3: Hospital discharges of <strong>in</strong>-patients by diagnosis (ISHMT - <strong>in</strong>ternational shortlist forhospital morbidity tabulation), 2006(per 100 000 <strong>in</strong>habitants)Diseasesof thecirculatorysystemDiseasesof therespiratorysystemDiseasesof thedigestivesystemInjury,poison<strong>in</strong>g &Pregnancy, certa<strong>in</strong> otherchildbirth consequences& the of externalpuerperiumcausesNeoplasms(cancers)Belgium (1) 1 243.6 2 135.3 1 440.6 1 698.0 1 361.8 1 633.9Bulgaria (1) 1 715.0 3 002.9 3 180.3 1 636.5 1 948.8 1 317.1Czech Republic 1 760.7 3 225.3 1 367.5 1 837.7 1 520.3 1 730.8Denmark : : : : : :Germany 2 359.9 3 322.2 1 322.6 2 077.5 1 071.0 2 127.8Estonia (1) 1 571.8 3 243.1 2 024.7 1 624.4 1 832.3 1 191.0Ireland 860.6 1 234.3 1 399.1 1 238.8 2 482.7 1 347.2Greece : : : : : :Spa<strong>in</strong> (1) 916.1 1 338.9 1 146.7 1 270.4 1 386.3 898.3France (1) 1 277.0 1 972.7 1 005.3 1 696.7 1 566.6 1 460.7Italy (2) 1 330.5 2 480.7 1 144.3 1 461.5 1 336.1 1 323.5Cyprus 411.8 721.0 656.0 689.7 405.0 842.8Latvia (1) 1 799.7 3 538.9 2 221.7 1 831.8 1 619.2 2 243.1Lithuania 1 664.4 4 441.5 2 063.8 1 852.3 1 636.1 1 963.9Luxembourg (1) 1 743.7 2 275.1 1 436.2 1 664.5 1 329.9 1 262.8Hungary : : : : : :Malta (2) 183.4 694.3 540.8 591.9 971.7 580.2Netherlands (1) 997.4 1 527.5 731.2 915.8 857.5 848.3Austria 2 809.2 3 720.3 1 685.7 2 502.8 1 331.9 2 909.3Poland (1) 1 908.4 3 024.1 1 557.4 1 765.5 1 577.4 1 615.1Portugal (1) 920.3 1 206.2 955.9 1 061.9 1 089.3 684.7Romania (1) 1 274.6 2 588.1 2 785.3 2 070.8 1 697.3 1 279.2Slovenia 1 836.4 1 971.8 1 221.7 1 419.5 1 248.7 1 529.9Slovakia (1) 1 764.1 3 054.4 1 660.4 1 889.0 1 630.9 1 586.2F<strong>in</strong>land 1 769.3 3 032.6 1 411.9 1 414.9 1 316.9 1 932.3Sweden : : : : : :United K<strong>in</strong>gdom : : : : : :Croatia (1) 1 828.4 1 849.4 1 147.3 1 179.1 223.4 1 041.9FYR of Macedonia (1) 1 164.0 1 553.7 1 424.1 1 038.9 753.5 579.2Iceland (1) 1 393.8 1 824.9 980.3 1 346.7 2 113.7 1 020.4Norway (1) 1 794.8 2 467.0 1 531.0 1 237.9 1 487.3 1 854.1Switzerland (1) 1 123.6 1 735.1 869.4 1 353.3 1 181.9 1 846.2(1) 2005.(2) 2004.Source: <strong>Eurostat</strong> (hlth_co_disch2)220 EUROPE IN FIGURES — <strong>Eurostat</strong> <strong>yearbook</strong> <strong>2009</strong>
Health 5Table 5.4: Hospital discharges of <strong>in</strong>-patients by diagnosis (ISHMT - <strong>in</strong>ternational shortlist forhospital morbidity tabulation), average length of stay, 2006(days)Diseasesof thecirculatorysystemDiseasesof therespiratorysystemDiseasesof thedigestivesystemInjury,poison<strong>in</strong>g &Pregnancy, certa<strong>in</strong> otherchildbirth consequences& the of externalpuerperiumcausesNeoplasms(cancers)Belgium (1) 9.4 8.4 8.4 6.1 5.0 8.5Bulgaria (1) 7.9 7.6 8.5 6.4 4.8 6.6Czech Republic 10.2 13.6 9.2 7.7 5.5 10.3Denmark : : : : : :Germany 10.4 10.5 8.9 7.6 4.9 9.3Estonia (1) 8.0 10.6 5.0 5.2 3.1 8.8Ireland 11.5 10.2 6.9 6.4 2.9 5.8Greece : : : : : :Spa<strong>in</strong> 9.6 8.4 7.1 5.9 3.2 8.5France 7.7 7.0 6.9 5.3 4.9 5.7Italy (2) 9.7 8.7 8.1 6.8 4.0 7.8Cyprus 8.5 5.9 5.0 4.8 5.5 4.9Latvia (1) 9.1 9.2 7.9 6.2 5.6 7.5Lithuania 10.5 13.0 7.9 6.7 4.7 8.5Luxembourg (1) 8.9 7.9 6.0 5.9 4.8 7.7Hungary : : : : : :Malta (3) 7.5 6.5 4.9 3.9 3.5 5.9Netherlands (1) 8.5 7.8 7.6 6.8 3.8 7.7Austria 7.8 11.0 8.2 6.8 5.5 8.7Poland (1) 6.6 7.9 8.1 5.8 5.1 5.3Portugal (1) 8.7 7.9 8.2 5.9 3.3 9.3Romania (1) 7.7 8.5 7.5 6.9 5.4 6.5Slovenia 7.9 8.4 7.5 6.1 4.6 7.0Slovakia (1) 9.1 9.0 8.2 6.5 5.8 7.1F<strong>in</strong>land 9.0 16.3 13.4 6.0 3.7 11.1Sweden : : : : : :United K<strong>in</strong>gdom : : : : : :Croatia 10.0 10.3 8.9 8.6 8.5 8.7FYR of Macedonia (1) 8.5 10.9 8.2 6.3 4.4 9.1Iceland (1) 7.2 6.4 6.2 4.0 2.4 6.4Norway (1) 7.2 5.4 6.1 4.9 3.7 4.8Switzerland (1) 10.6 9.3 8.8 7.4 6.1 8.0(1) 2005.(2) 2004.(3) 2007.Source: <strong>Eurostat</strong> (hlth_co_<strong>in</strong>pst)EUROPE IN FIGURES — <strong>Eurostat</strong> <strong>yearbook</strong> <strong>2009</strong>221
5 Health5.4 Causes of death and <strong>in</strong>fantmortalityIntroductionBroadly speak<strong>in</strong>g, the EU has witnesseda very significant reduction <strong>in</strong> mortalitydur<strong>in</strong>g the last century or so – both <strong>in</strong>terms of reduced <strong>in</strong>fant mortality and asa result of decl<strong>in</strong>es <strong>in</strong> <strong>in</strong>fectious and degenerativediseases. Non-communicablediseases – a group of conditions that <strong>in</strong>cludescardiovascular disease, cancer,mental health problems, diabetes mellitus,chronic respiratory disease, andmusculoskeletal conditions – cause morethan 85 % of deaths <strong>in</strong> <strong>Europe</strong>. Thesedisorders are largely preventable and arel<strong>in</strong>ked by common risk factors, underly<strong>in</strong>gdeterm<strong>in</strong>ants and opportunities for<strong>in</strong>tervention. Among these, cancer andcardiovascular diseases are currently byfar the most important causes of death <strong>in</strong>the EU for both men and women.Mortality dur<strong>in</strong>g the first year of life hasdecreased considerably <strong>in</strong> all MemberStates, such that current levels are amongthe lowest <strong>in</strong> the world. There howeverrema<strong>in</strong> persistent differences <strong>in</strong> ratesacross different social groups or acrossgeographical regions.Def<strong>in</strong>itions and data availabilityThe <strong>in</strong>fant mortality rate represents theratio between deaths of children underone year and the number of live births<strong>in</strong> a given year; the value is expressed per1 000 live births. Note that some countriesuse different def<strong>in</strong>itions for spontaneousabortion, early foetal death andlate foetal death (or stillbirth).<strong>Eurostat</strong> began collect<strong>in</strong>g and dissem<strong>in</strong>at<strong>in</strong>gmortality data <strong>in</strong> 1994, brokendown by:• a shortlist of 65 causes of death basedon the International Statistical Classificationof Diseases and RelatedHealth Problems (I<strong>CD</strong>), that is developedand ma<strong>in</strong>ta<strong>in</strong>ed by the WorldHealth Organisation (WHO);• gender;• age;• geographical region (NUTS level 2).Causes of death (COD) statistics arebased on <strong>in</strong>formation derived from medicalcertificates; the medical certificationof death is an obligation <strong>in</strong> all MemberStates. They target the underly<strong>in</strong>g causeof death, <strong>in</strong> other words, ‘the disease or<strong>in</strong>jury which <strong>in</strong>itiated the tra<strong>in</strong> of morbidevents lead<strong>in</strong>g directly to death, orthe circumstances of the accident or violencewhich produced the fatal <strong>in</strong>jury’ (adef<strong>in</strong>ition adopted by the World HealthAssembly). Although def<strong>in</strong>itions are harmonised,the statistics may not be fullycomparable as classifications may varywhen the cause of death is multiple ordifficult to evaluate and because of differentnotification procedures. Annualdata are provided <strong>in</strong> absolute numbers,as crude death rates and as standardiseddeath rates.The standardised death rate (SDR) is aweighted average of the age-specific mortalityrates. The weights are the age distributionof the population whose mortalityexperience is be<strong>in</strong>g observed. S<strong>in</strong>ce most222 EUROPE IN FIGURES — <strong>Eurostat</strong> <strong>yearbook</strong> <strong>2009</strong>
Health 5causes of death vary significantly by ageand sex, the use of standardised deathrates improves comparability over timeand between countries.Ma<strong>in</strong> f<strong>in</strong>d<strong>in</strong>gsThe progress made <strong>in</strong> medical healthcareservices is reflected <strong>in</strong> a decreas<strong>in</strong>g<strong>in</strong>fant mortality rate. In the course ofthe last four decades the <strong>in</strong>fant mortalityrate <strong>in</strong> the EU fell from almost 28deaths per 1000 live births <strong>in</strong> 1965 to4.7 deaths <strong>in</strong> 2006. Indeed, as a result ofdecl<strong>in</strong><strong>in</strong>g <strong>in</strong>fant mortality rates, mostof the Member States are now among agroup of countries <strong>with</strong> the lowest <strong>in</strong>fantmortality rates <strong>in</strong> the world, for example,1.8 deaths per 1 000 live births <strong>in</strong> Luxembourgor less than 3 deaths per 1 000 livebirths <strong>in</strong> Slovenia, F<strong>in</strong>land or Sweden.Infant mortality rates have levelled-off<strong>in</strong> some countries <strong>in</strong> recent years; thismay, <strong>in</strong> part, be due to factors such as: an<strong>in</strong>creas<strong>in</strong>g number of women deferr<strong>in</strong>gchildbirth; or a higher number of multiplebirths as a result of the more commonuse of fertility treatments.By far the most important causes of deathamong men and women <strong>in</strong> the EU-27 <strong>in</strong>2006 were cancer (malignant neoplasm)and ischaemic heart diseases; there were,however, large differences between standardiseddeath rates for men and women.Deaths from cancer among men had an<strong>in</strong>cidence of 233 per 100 000, while thecorrespond<strong>in</strong>g rate for women was 134.The difference <strong>in</strong> the <strong>in</strong>cidence of deathfrom cancer between the sexes was oftenparticularly high among those MemberStates that jo<strong>in</strong>ed the EU s<strong>in</strong>ce 2004, althoughFrance and Spa<strong>in</strong> also recordedconsiderable disparities.Standardised death rates for ischaemicheart diseases were about twice as highfor men (at 132 per 100 000) as for women(68). Heart disease was particularlyprevalent among men and women <strong>in</strong> theBaltic Member States, Slovakia, Hungaryand Romania. Indeed, there was a higher<strong>in</strong>cidence of death from heart diseasethan from cancer <strong>in</strong> each of these countriesacross both genders, other than fordeaths from cancer among men <strong>in</strong> Hungary).Those countries report<strong>in</strong>g the lowest<strong>in</strong>cidence of death from heart disease<strong>in</strong>cluded France, Spa<strong>in</strong>, Portugal and theNetherlands.Men reported higher standardised deathrates (than women) for all of the ma<strong>in</strong>causes of death, <strong>with</strong> rates as much as fouror five times as high as those recorded forwomen for drug dependence and alcoholabuse, and between three and four timesas high for AIDS (HIV) and suicide and<strong>in</strong>tentional self-harm.EUROPE IN FIGURES — <strong>Eurostat</strong> <strong>yearbook</strong> <strong>2009</strong>223
5 HealthFigure 5.7: Infant mortality (1)(per 1 000 live births)2001501005001965 1970 1975 1980 1985 1990 1995 2000 2005AfricaAsiaWorldLat<strong>in</strong> America and the CaribbeanOceania<strong>Europe</strong>North America EU-25 (2)(1) All data (exclud<strong>in</strong>g EU-25) are averages of the five-year period up to and <strong>in</strong>clud<strong>in</strong>g the reference period referred to <strong>in</strong> the figure.(2) EU-27 for latest period; 2007 <strong>in</strong>stead of 2005.Source: <strong>Eurostat</strong> (demo_m<strong>in</strong>f<strong>in</strong>d), United Nations, Population Division of the Department of Economic and Social AffairsFigure 5.8: Causes of death - standardised death rate, EU-27, 2006 (1)(per 100 000 <strong>in</strong>habitants)25050200401503010020501000Cancer(malignantneoplasms)IschaemicheartdiseasesAccidentsNervoussystemPneumoniaChronic liverdiseaseDiabetesmellitusSuicide &self-harmAlcoholicabuseAIDS (HIV)Homicide,assaultDrugdependenceMaleFemale(1) Note the differences <strong>in</strong> the scales employed between the two parts of the figure; the figure is ranked on the average of male andfemale; EU-27 averages calculated on the basis of the latest year available for each Member State.Source: <strong>Eurostat</strong> (tps00116, tps00119, tps00125, tps00134, tps00128, tps00131, tps00137, tps00122, tps00140, tps00143, tps00146 andtps00149)224 EUROPE IN FIGURES — <strong>Eurostat</strong> <strong>yearbook</strong> <strong>2009</strong>
Health 5Table 5.5: Infant mortality(per 1 000 live births)1965 1970 1975 1980 1985 1990 1995 2000 2005 2007EU-27 (1) 28.6 25.5 20.8 15.8 12.8 10.3 7.5 5.9 4.9 4.7Euro area (1) 28.5 23.8 18.9 12.8 9.7 7.6 5.6 4.6 3.9 3.7Belgium 23.7 21.1 16.1 12.1 9.8 8.0 6.0 4.8 3.7 4.0Bulgaria 30.8 27.3 23.1 20.2 15.4 14.8 14.8 13.3 10.4 9.2Czech Republic 23.7 20.2 19.4 16.9 12.5 10.8 7.7 4.1 3.4 3.1Denmark 18.7 14.2 10.4 8.4 7.9 7.5 5.1 5.3 4.4 4.0Germany 24.1 22.5 18.9 12.4 9.1 7.0 5.3 4.4 3.9 3.9Estonia 20.3 17.7 18.2 17.1 14.1 12.3 14.9 8.4 5.4 5.0Ireland 25.2 19.5 17.5 11.1 8.8 8.2 6.4 6.2 4.0 3.1Greece 34.3 29.6 24.0 17.9 14.1 9.7 8.1 5.9 3.8 3.5Spa<strong>in</strong> 29.4 20.7 18.9 12.3 8.9 7.6 5.5 4.4 3.8 3.7France (1) 22.4 18.2 13.8 10.0 8.3 7.3 4.9 4.5 3.8 3.8Italy 35.0 : 20.8 14.6 10.5 8.2 6.2 4.5 : 3.7Cyprus 32.0 26.0 18.2 14.4 14.4 12.9 9.7 5.6 4.6 3.7Latvia 18.9 17.7 20.3 15.3 13.0 13.7 18.8 : 7.8 8.7Lithuania 24.7 19.3 19.6 14.5 14.2 10.2 12.5 8.6 6.8 5.9Luxembourg 24.0 24.9 14.8 11.5 9.0 7.3 5.5 5.1 2.6 1.8Hungary 38.8 35.9 32.8 23.2 20.4 14.8 10.7 9.2 6.2 5.9Malta 34.8 27.9 18.3 15.2 14.5 9.1 8.9 5.9 6.0 6.5Netherlands 14.4 12.7 10.6 8.6 8.0 7.1 5.5 : 4.9 4.1Austria 28.3 25.9 20.5 14.3 11.2 7.8 5.4 4.8 4.2 3.7Poland 41.6 36.4 24.8 25.4 22.1 19.4 13.6 8.1 6.4 6.0Portugal 64.9 55.5 38.9 24.2 17.8 11.0 7.5 5.5 3.5 3.4Romania 44.1 49.4 34.7 29.3 25.6 26.9 21.2 18.6 15.0 12.0Slovenia 29.6 24.5 17.3 15.3 13.0 8.4 5.5 4.9 4.1 2.8Slovakia 28.5 25.7 23.7 20.9 16.3 12.0 11.0 8.6 7.2 6.1F<strong>in</strong>land 17.6 13.2 9.6 7.6 6.3 5.6 3.9 3.8 3.0 2.7Sweden 13.3 11.0 8.6 6.9 6.8 6.0 4.1 3.4 2.4 2.5United K<strong>in</strong>gdom (2) 19.6 18.5 18.9 13.9 11.1 7.9 6.2 5.6 5.1 4.9Croatia 49.5 34.2 23.0 20.6 16.6 10.7 8.9 7.4 5.7 5.6FYR of Macedonia 105.8 87.9 65.1 54.2 43.4 31.6 22.7 11.8 12.8 10.3Turkey : : : : : : : 28.9 23.6 21.7Iceland 15.0 13.2 12.5 7.7 5.7 5.9 6.1 3.0 2.3 2.0Liechtenste<strong>in</strong> 22.8 11.8 6.5 7.6 10.7 : : : 2.6 0.0Norway 14.6 11.3 9.5 8.1 8.5 6.9 4.0 3.8 3.1 3.1Switzerland 17.8 15.1 10.7 9.1 6.9 6.8 5.0 4.9 4.2 3.9(1) 2006 <strong>in</strong>stead of 2007. France: <strong>in</strong>clud<strong>in</strong>g overseas departments start<strong>in</strong>g <strong>with</strong> 2000.(2) 2006 <strong>in</strong>stead of 2007.Source: <strong>Eurostat</strong> (demo_m<strong>in</strong>f<strong>in</strong>d)EUROPE IN FIGURES — <strong>Eurostat</strong> <strong>yearbook</strong> <strong>2009</strong>225
5 HealthTable 5.6: Causes of death - standardised death rate, 2006 (1)(per 100 000 <strong>in</strong>habitants)Heartdisease(3)ChronicliverdiseaseCancer(2)NervoussystemPneumoniaDiabetesmellitusAccidentsAlc.abuseAIDS(HIV)EU-27 (5) 175.6 96.2 17.1 15.7 13.8 13.6 25.8 10.4 2.7 1.0 1.1 0.6Belgium : : : : : : : : : : : :Bulgaria 168.3 147.9 8.8 16.5 15.9 18.7 30.2 10.5 0.5 1.7 0.0 0.0Czech Republic 212.5 168.8 15.7 22.7 15.9 10.7 32.5 12.2 1.8 1.0 0.0 0.0Denmark : : : : : : : : : : : :Germany 165.0 97.9 14.2 13.3 14.2 15.1 17.1 9.8 4.7 0.6 0.6 0.8Estonia 198.9 253.3 17.4 10.7 22.0 12.8 75.5 16.2 9.9 7.1 3.6 0.1Ireland 180.2 103.4 15.0 38.0 5.8 10.9 17.8 9.1 2.1 0.8 0.1 2.0Greece 154.7 76.3 7.5 4.9 5.4 7.2 26.7 3.1 0.2 0.8 0.2 0.0Spa<strong>in</strong> 158.3 51.9 20.6 9.9 9.0 12.5 21.7 6.2 0.6 0.8 2.7 0.2France 176.1 40.4 25.4 10.2 11.2 11.7 29.6 15.8 4.7 0.8 1.4 0.3Italy : : : : : : : : : : : :Cyprus 116.4 79.4 14.0 10.4 4.7 36.5 28.4 2.4 0.4 1.7 0.2 0.7Latvia 199.7 279.4 13.5 20.4 17.8 8.9 94.9 19.3 3.4 9.1 1.3 0.0Lithuania 195.4 347.2 14.9 17.3 35.1 8.0 99.4 28.9 0.9 7.3 0.2 0.5Luxembourg 162.2 67.1 22.8 14.0 11.3 7.6 29.0 9.9 4.5 1.5 0.2 0.4Hungary 239.9 240.7 12.5 5.1 44.7 21.9 39.9 21.8 4.5 1.9 0.0 0.0Malta 145.3 149.5 18.1 14.7 6.4 22.1 19.9 4.2 0.4 0.5 0.3 :Netherlands 186.5 54.3 16.8 22.1 4.2 15.0 15.2 8.7 1.1 0.8 0.3 0.1Austria 161.9 107.7 15.5 9.3 14.7 26.9 23.4 13.4 3.6 0.8 0.5 2.5Poland 210.1 111.2 10.9 19.6 15.4 13.1 38.1 14.3 4.6 1.4 0.3 0.0Portugal 156.0 53.4 15.9 27.5 12.2 27.2 19.9 7.2 0.8 1.3 7.8 0.1Romania 179.8 213.2 7.9 24.8 39.7 7.9 40.8 11.9 2.2 2.1 0.9 0.0Slovenia 197.8 68.0 8.8 23.4 23.9 13.4 36.7 22.8 3.0 0.6 0.1 0.1Slovakia 203.5 248.4 11.9 31.8 25.8 12.3 37.6 9.4 : 1.5 0.0 0.0F<strong>in</strong>land 140.5 136.7 36.6 7.2 17.2 6.3 46.1 19.0 2.9 1.9 0.2 0.1Sweden 152.3 98.4 17.8 10.1 5.6 11.9 20.7 12.0 2.8 0.9 0.2 0.2United K<strong>in</strong>gdom 185.2 128.6 18.1 33.5 10.0 7.7 16.5 6.6 1.5 0.4 0.3 1.9Croatia 209.8 159.6 11.2 18.8 21.7 17.2 35.2 15.5 3.9 1.7 0.2 0.4FYR of Macedonia 169.5 107.0 7.1 4.5 7.5 36.3 22.3 8.3 0.6 2.5 0.1 0.1Iceland 159.3 92.3 36.0 14.5 4.0 5.6 19.9 11.5 1.2 1.0 0.3 0.3Norway 161.9 75.4 19.1 19.1 3.2 10.7 28.6 11.2 3.7 1.0 0.3 0.5Switzerland 146.1 72.4 21.8 11.3 7.0 11.3 19.2 15.0 2.4 0.9 0.9 3.0Suicide(4)Homicide,assaultDrugdependence(1) France, Luxembourg, Malta, Portugal, the United K<strong>in</strong>gdom and Switzerland, 2005; Iceland, 2005 except for AIDS (HIV), 2004;Slovenia, 2005 for AIDS (HIV); Estonia and Romania, 2005 for drug dependence; Slovakia, 2004 for drug dependence.(2) Malignant neoplasms.(3) Ischaemic heart diseases.(4) Suicide and <strong>in</strong>tentional self-harm.(5) Average calculated on the basis of the latest year available for each Member State.Source: <strong>Eurostat</strong> (tps00116, tps00119, tps00134, tps00128, tps00131, tps00137, tps00125, tps00122, tps00140, tps00146, tps00143 andtps00149)226 EUROPE IN FIGURES — <strong>Eurostat</strong> <strong>yearbook</strong> <strong>2009</strong>
Health 5Figure 5.9: Deaths from cancer (malignant neoplasms) - standardised death rate, 2006 (1)(per 100 000 <strong>in</strong>habitants)4003002001000EU-27 (2)HungaryPolandCzech RepublicEstoniaLatviaSlovakiaLithuaniaSloveniaNetherlandsUnited K<strong>in</strong>gdomRomaniaIrelandFranceBulgariaGermanyAustriaLuxembourgSpa<strong>in</strong>PortugalGreeceSwedenMaltaF<strong>in</strong>landCyprusCroatiaFYR of MacedoniaNorwayIcelandSwitzerlandMaleFemale(1) France, Luxembourg, Malta, Portugal, the United K<strong>in</strong>gdom, Iceland and Switzerland, 2005; Belgium, Denmark and Italy, notavailable; the figure is ranked on the average of male and female.(2) Average calculated on the basis of the latest year available for each Member State.Source: <strong>Eurostat</strong> (tps00116)Figure 5.10: Deaths from ischaemic heart diseases - standardised death rate, 2006 (1)(per 100 000 <strong>in</strong>habitants)5004003002001000EU-27 (2)LithuaniaLatviaEstoniaSlovakiaHungaryRomaniaCzech RepublicMaltaBulgariaF<strong>in</strong>landUnited K<strong>in</strong>gdomPolandAustriaIrelandSwedenGermanyCyprusGreeceSloveniaLuxembourgNetherlandsPortugalSpa<strong>in</strong>FranceCroatiaFYR of MacedoniaIcelandNorwaySwitzerlandMaleFemale(1) France, Luxembourg, Malta, Portugal, the United K<strong>in</strong>gdom, Iceland and Switzerland, 2005; Belgium, Denmark and Italy, notavailable; the figure is ranked on the average of male and female.(2) Average calculated on the basis of the latest year available for each Member State.Source: <strong>Eurostat</strong> (tps00119)EUROPE IN FIGURES — <strong>Eurostat</strong> <strong>yearbook</strong> <strong>2009</strong>227
5 HealthFigure 5.11: Deaths from suicide - standardised death rate, 2006 (1)(per 100 000 <strong>in</strong>habitants)6040200EU-27 (2)LithuaniaSloveniaHungaryLatviaF<strong>in</strong>landEstoniaFrancePolandAustriaCzech RepublicRomaniaSwedenBulgariaLuxembourgGermanySlovakiaIrelandNetherlandsPortugalUnited K<strong>in</strong>gdomSpa<strong>in</strong>MaltaGreeceCyprusCroatiaSwitzerlandIcelandNorwayFYR of MacedoniaMaleFemale(1) France, Luxembourg, Malta, Portugal, the United K<strong>in</strong>gdom, Iceland and Switzerland, 2005; Belgium, Denmark and Italy, notavailable; the figure is ranked on the average of male and female.(2) Average calculated on the basis of the latest year available for each Member State.Source: <strong>Eurostat</strong> (tps00122)Figure 5.12: Deaths from accidents - standardised death rate, 2006 (1)(per 100 000 <strong>in</strong>habitants)200150100500EU-27 (2)LithuaniaLatviaEstoniaF<strong>in</strong>landRomaniaHungaryPolandSlovakiaSloveniaCzech RepublicBulgariaFranceLuxembourgCyprusGreeceAustriaSpa<strong>in</strong>SwedenPortugalMaltaIrelandGermanyUnited K<strong>in</strong>gdomNetherlandsCroatiaNorwayFYR of MacedoniaIcelandSwitzerlandMaleFemale(1) France, Luxembourg, Malta, Portugal, the United K<strong>in</strong>gdom, Iceland and Switzerland, 2005; Belgium, Denmark and Italy, notavailable; the figure is ranked on the average of male and female.(2) Average calculated on the basis of the latest year available for each Member State.Source: <strong>Eurostat</strong> (tps00125)228 EUROPE IN FIGURES — <strong>Eurostat</strong> <strong>yearbook</strong> <strong>2009</strong>
Health 55.5 Safety at workIntroductionWork<strong>in</strong>g conditions change over time. Ahigh proportion of people spend 8 hoursa day, 5 days a week at work. While therehave been many studies concern<strong>in</strong>g thebenefits of work as a source of wealth (forboth the <strong>in</strong>dividual and the enterprise),there has, until recently, been less <strong>in</strong>terest<strong>in</strong> the negative effects that work canhave on human and public health. Manyaspects of work have the potential tobr<strong>in</strong>g about illness (or death) and theseare not restricted to safety issues and accidents.Rather, health and safety <strong>in</strong> theworkplace has been redef<strong>in</strong>ed <strong>in</strong> order totake account of the move from traditional,<strong>in</strong>dustrial, heavy <strong>in</strong>dustries, to focuson the modern-day world of work, whichis characterised more by issues such asstress and psychological risks, musculoskeletaldisorders, noise, or the abuse oftobacco, alcohol, or dangerous substancesrelated to work.Health at work also <strong>in</strong>volves physical,moral and social well-be<strong>in</strong>g (issuessuch as <strong>in</strong>timidation and violence <strong>in</strong> theworkplace), which are considered especiallyimportant determ<strong>in</strong>ants regard<strong>in</strong>gthe quality of work and the productivityof the workforce. A strategic healthand safety policy is therefore not justcrucial to ensur<strong>in</strong>g the well-be<strong>in</strong>g of <strong>Europe</strong>’sworkers; it is also a key issue <strong>in</strong>competitiveness.Def<strong>in</strong>itions and data availability<strong>Europe</strong>an statistics on accidents at workand occupational diseases respond to therequirements of the Community strategyon health and safety at work 2002-06, aswell as the new strategy for the period2007-2012 (6) . The adoption and application<strong>in</strong> recent decades of a large body ofCommunity laws has improved work<strong>in</strong>gconditions <strong>in</strong> the Member States and reducedthe <strong>in</strong>cidence of work-related accidentsand illnesses. The new strategyfor 2007-2012 aims for a 25 % reduction<strong>in</strong> the total <strong>in</strong>cidence rate of accidents atwork by 2012 <strong>in</strong> the EU-27, which as wellas hav<strong>in</strong>g direct effects on employees,will also play a role <strong>in</strong> contribut<strong>in</strong>g towardsthe success of the Growth and JobsStrategy.Harmonised data on accidents at workare collected <strong>in</strong> the framework of the <strong>Europe</strong>anStatistics on Accidents at Work(ESAW). The ESAW methodology is <strong>in</strong>accordance <strong>with</strong> the International LabourOffice (ILO) Resolution of 1998 concern<strong>in</strong>g‘Statistics of Occupational Injuries:result<strong>in</strong>g from Occupational Accidents’.National sources are typically declarationsof accidents at work, either to thepublic (social security) or private <strong>in</strong>surancesystems, or to other relevant nationalauthorities. Data are presented <strong>in</strong>numbers or as <strong>in</strong>cidence rates. Incidencerates are calculated as follows: (numberof persons <strong>in</strong>volved <strong>in</strong> (fatal) accidents atwork / number of persons <strong>in</strong> employment<strong>in</strong> the reference population) x 100 000.(6) Council Resolution 2002/C 161/01 of 3 June 2002 on a new Community strategy on health and safety at work (2002-06)(OJ C 161, 5.7.2002, p. 1); http://eur-lex.europa.eu/LexUriServ/site/en/oj/2002/c_161/c_16120020705en00010004.pdf.Council Resolution 2007/C 145/01 of 25 June 2007 on a new Community strategy on health and safety at work (2007-2012)(OJ C 145, 30.6.2007, p. 1); http://eur-lex.europa.eu/LexUriServ/site/en/oj/2007/c_145/c_14520070630en00010004.pdf.EUROPE IN FIGURES — <strong>Eurostat</strong> <strong>yearbook</strong> <strong>2009</strong>229
5 HealthThe data on serious accidents at work referto accidents that result <strong>in</strong> more thanthree days absence from work. An accidentat work is a discrete occurrencedur<strong>in</strong>g the course of work which leads tophysical or mental harm. This <strong>in</strong>cludes accidents<strong>in</strong> the course of work outside thepremises of his bus<strong>in</strong>ess, even if causedby a third party (on clients’ premises, onanother company’s premises, <strong>in</strong> a publicplace or dur<strong>in</strong>g transport, <strong>in</strong>clud<strong>in</strong>groad traffic accidents) and cases of acutepoison<strong>in</strong>g. The <strong>in</strong>formation presentedexcludes accidents on the way to or fromwork (commut<strong>in</strong>g accidents), occurrenceshav<strong>in</strong>g only a medical orig<strong>in</strong> (such asa heart attack at work) and occupationaldiseases.A fatal accident at work is def<strong>in</strong>ed as anaccident which leads to the death of avictim generally <strong>with</strong><strong>in</strong> one year of theaccident. In practice the notification ofan accident as fatal ranges from nationalregistration procedures where the accidentis registered as fatal when the victimdied the same day (the Netherlands) tocases where no time limits are laid down(Belgium, Greece, France, Italy, Luxemburg,Austria, Sweden and Norway).Ma<strong>in</strong> f<strong>in</strong>d<strong>in</strong>gsThe <strong>Europe</strong>an Agency for Safety andHealth at Work (7) is located <strong>in</strong> Bilbao,Spa<strong>in</strong>. It claims that every three and ahalf m<strong>in</strong>utes, somebody <strong>in</strong> the EU diesfrom work-related causes, which equatesto more than 150 000 deaths a year.In recent years the <strong>in</strong>cidence rate of seriousaccidents at work has fallen, such thatby 2005 it had decreased by 22 % <strong>in</strong> relationto 1998 for the EU-27. Dur<strong>in</strong>g thesame period there was a 24 % reduction<strong>in</strong> fatal accidents at work <strong>in</strong> the EU-27.Note that these <strong>figures</strong> may <strong>in</strong> part reflectthe structural shift of the <strong>Europe</strong>an economytowards services, where the risks ofaccident and death at work are usuallyless than <strong>with</strong><strong>in</strong> agriculture, <strong>in</strong>dustry orconstruction.There were only three Member States thatreported a higher <strong>in</strong>cidence of serious accidentsat work <strong>in</strong> 2005 when compared<strong>with</strong> 1998: Estonia (26 % higher), Lithuania(4 % higher) and Ireland (1 % higher).At the other end of the scale, the <strong>in</strong>cidenceof serious accidents <strong>in</strong> Bulgaria,Greece and Romania was almost halvedbetween 1998 and 2004.The majority of the Member States alsoreported a reduction <strong>in</strong> the <strong>in</strong>cidenceof fatal accidents at work, although thiswas not the case <strong>in</strong> Lithuania (33 % <strong>in</strong>crease),Sweden (31 % <strong>in</strong>crease), Slovenia(28 % <strong>in</strong>crease) and Ireland (17 % <strong>in</strong>crease).Greece, Malta and France eachreduced their <strong>in</strong>cidence of fatal accidentsat work by at least half over the periodconsidered.In absolute terms the highest <strong>in</strong>cidenceof serious and fatal accidents at work wasrecorded <strong>with</strong><strong>in</strong> the construction sector,<strong>with</strong> agriculture and transport alsorecord<strong>in</strong>g relatively high values. Men areconsiderably more likely to have an accidentor to die at work. This is due, at least<strong>in</strong> part, to a higher proportion of menwork<strong>in</strong>g <strong>in</strong> ‘higher risk’ sectors and occupations,while men are also more likelyto work on a full-time basis; these characteristicsmay also expla<strong>in</strong> why the <strong>in</strong>cidenceof accidents has tended to fall at amore rapid pace for men than for women.For example, the <strong>in</strong>cidence of serious accidentsfor men fell by 19 % between 1998and 2005, while the correspond<strong>in</strong>g reductionfor women was 15 %.(7) http://osha.europa.eu/en.230 EUROPE IN FIGURES — <strong>Eurostat</strong> <strong>yearbook</strong> <strong>2009</strong>
Health 5Figure 5.13: Incidence of accidents at work, 2005(1998=100, based on the number of accidents per 100 000 persons employed)1501251007550250EU-27Euro area (1)LithuaniaSwedenSloveniaIrelandAustriaUnited K<strong>in</strong>gdomBulgariaBelgiumPortugalSlovakiaF<strong>in</strong>landGermanyPolandNetherlands (2)LatviaHungaryCzech RepublicDenmarkCyprusSpa<strong>in</strong>RomaniaEstoniaLuxembourgItalyFranceMaltaGreeceUnited StatesJapanTurkeyNorwaySerious accidentsFatal accidents(1) EA-12 <strong>in</strong>stead of EA-15.(2) Break <strong>in</strong> series for serious accidents (re-based, 2005=100).Source: <strong>Eurostat</strong> (tsiem090 and tsiem100)Figure 5.14: Incidence of serious accidents at work, by gender, 2005 (1)(1998=100, based on the number of serious accidents per 100 000 persons employed)1501251007550250EU-27Euro area (2)EstoniaLithuaniaIrelandCyprusNetherlands (3)FranceSloveniaF<strong>in</strong>landSpa<strong>in</strong>DenmarkSlovakiaSwedenCzech RepublicPolandHungaryUnited K<strong>in</strong>gdomAustriaMaltaPortugalItalyLuxembourgGermanyBelgiumBulgariaRomaniaGreeceNorwayUnited StatesMaleFemale(1) Latvia, not available; the figure is ranked on the average of male and female.(2) EA-12 <strong>in</strong>stead of EA-15, estimates.(3) Break <strong>in</strong> series for serious accidents (re-based, 2005=100).Source: <strong>Eurostat</strong> (tsiem090)EUROPE IN FIGURES — <strong>Eurostat</strong> <strong>yearbook</strong> <strong>2009</strong>231
Liv<strong>in</strong>g conditions and welfare<strong>Eurostat</strong> data on liv<strong>in</strong>g conditions and welfare aims to show a comprehensive pictureof the current liv<strong>in</strong>g conditions <strong>in</strong> the EU, cover<strong>in</strong>g variables related to <strong>in</strong>come, poverty,social exclusion and other liv<strong>in</strong>g conditions – all social exclusion and hous<strong>in</strong>gcondition <strong>in</strong>formation is collected at the household level.The demand for <strong>in</strong>formation on liv<strong>in</strong>g conditions and welfare received a new impetusfollow<strong>in</strong>g the social chapter of the Amsterdam Treaty (1997) which became the driv<strong>in</strong>gforce for EU social statistics. This impetus was re<strong>in</strong>forced by successive <strong>Europe</strong>anCouncils that have kept the social dimension high on the political agenda.This data is supplemented by additional <strong>in</strong>formation from household budget surveysthat detail the breakdown of consumption expenditure, while the third subchapterfocuses on hous<strong>in</strong>g (status of tenure and average numbers of people liv<strong>in</strong>g perhousehold).Income, poverty and social exclusion are multidimensional problems. To monitorthem effectively at a <strong>Europe</strong>an level, a subset of so-called ‘social cohesion <strong>in</strong>dicators’has been developed <strong>with</strong><strong>in</strong> the structural <strong>in</strong>dicators. Additionally, a broader portfolioof social <strong>in</strong>clusion <strong>in</strong>dicators are calculated under the Open Method of Coord<strong>in</strong>ationfor Social Protection and Social Inclusion (1) .The chapter concludes <strong>with</strong> a snapshot of <strong>in</strong>dicators relat<strong>in</strong>g to good governance, <strong>in</strong>other words, whether political/public <strong>in</strong>stitutions allocate resources effectively andtake decisions <strong>in</strong> an efficient and responsible manner. The public’s perception of suchideals may be gauged through <strong>in</strong>dicators such as voter turnout or measures of the public’sconfidence <strong>in</strong> <strong>in</strong>stitutions.(1) http://ec.europa.eu/employment_social/soc-prot/soc-<strong>in</strong>cl/<strong>in</strong>dicator_en.htm.EUROPE IN FIGURES — <strong>Eurostat</strong> <strong>yearbook</strong> <strong>2009</strong>233
6 Liv<strong>in</strong>g conditions and welfare6.1 Liv<strong>in</strong>g conditionsIntroductionFavourable liv<strong>in</strong>g conditions depend on awide range of factors, which may be divided<strong>in</strong>to two broad groups – those thatare <strong>in</strong>come-related and those that are not.The second group <strong>in</strong>cludes factors suchas: quality healthcare services, educationand tra<strong>in</strong><strong>in</strong>g opportunities or goodtransport facilities – aspects that affecteveryday lives and work. Analysis of thedistribution of <strong>in</strong>comes <strong>with</strong><strong>in</strong> a countryprovides a picture of <strong>in</strong>equalities. On theone hand <strong>in</strong>equalities may create <strong>in</strong>centivesfor people to improve their situationthrough work, <strong>in</strong>novation or acquir<strong>in</strong>gnew skills, while on the other, crime, povertyand social exclusion are often seen asl<strong>in</strong>ked to <strong>in</strong>equalities <strong>in</strong> the distributionof <strong>in</strong>comes.Def<strong>in</strong>itions and data availability<strong>Eurostat</strong> statistical <strong>in</strong>dicators <strong>with</strong><strong>in</strong> theILC (Income and Liv<strong>in</strong>g Conditions) doma<strong>in</strong>cover a range of topics relat<strong>in</strong>g to<strong>in</strong>come poverty and social exclusion. Onegroup of <strong>in</strong>dicators relate to monetarypoverty analysed <strong>in</strong> various ways (for example,by age, gender and activity status),across space and over time. Another setrelates to <strong>in</strong>come distribution and <strong>in</strong>come<strong>in</strong>equalities, while there are also<strong>in</strong>dicators relat<strong>in</strong>g to non-monetary povertyand social exclusion (for example,material deprivation, social participation)across space and over time. A newlydeveloped set of child-care arrangement<strong>in</strong>dicators complements the <strong>in</strong>formation<strong>in</strong> this doma<strong>in</strong>.To calculate liv<strong>in</strong>g condition <strong>in</strong>dicators,<strong>Eurostat</strong> <strong>in</strong>itially used micro-data (2) fromthe <strong>Europe</strong>an Community HouseholdPanel (ECHP) survey which was launched<strong>in</strong> 1994. However, after eight years of us<strong>in</strong>gthis source, a new <strong>in</strong>strument was <strong>in</strong>troduced<strong>in</strong> 2003, namely, data collectionunder a framework regulation on Communitystatistics on <strong>in</strong>come and liv<strong>in</strong>gconditions (EU-SILC). One of the ma<strong>in</strong>reasons for this change was the need toadapt the content and timel<strong>in</strong>ess of dataproduction to reflect current politicaland research needs. EU-SILC is now <strong>Eurostat</strong>’sma<strong>in</strong> reference source for comparative<strong>in</strong>come distribution and socialexclusion statistics. It comprises both across-sectional dimension and a longitud<strong>in</strong>aldimension. From 2005, EU-SILCcovered the EU-25 Member States, as wellas Norway and Iceland. Bulgaria, Romania,Turkey and Switzerland launchedEU-SILC <strong>in</strong> 2007. Note that for 2006 Bulgariaand Romania provided <strong>in</strong>dicatorsfrom national Household Budget Surveysand that as such, these <strong>in</strong>dicators are notfully harmonised.While comparisons between countries ofstandards of liv<strong>in</strong>g are frequently basedon GDP per capita, such <strong>figures</strong> say littleabout the distribution of <strong>in</strong>come <strong>with</strong><strong>in</strong> acountry. In this section, <strong>in</strong>dicators measur<strong>in</strong>gthe distribution of <strong>in</strong>come andrelative poverty are presented. Householddisposable <strong>in</strong>come is established bysumm<strong>in</strong>g up all monetary <strong>in</strong>comes receivedfrom any source by each memberof the household (<strong>in</strong>clud<strong>in</strong>g <strong>in</strong>come fromwork, <strong>in</strong>vestments and social benefits)(2) Data gathered at the micro level, for example, from <strong>in</strong>dividuals, households or enterprises, rather than aggregate datacompiled at the level of the economy.234 EUROPE IN FIGURES — <strong>Eurostat</strong> <strong>yearbook</strong> <strong>2009</strong>
Liv<strong>in</strong>g conditions and welfare 6plus <strong>in</strong>come received at household leveland deduct<strong>in</strong>g taxes and social contributionspaid and certa<strong>in</strong> unavoidable expenditures.In order to reflect differences<strong>in</strong> household size and composition, thistotal is divided by the number of ‘equivalentadults’ us<strong>in</strong>g a standard (equivalence)scale (the so-called ‘modifiedOE<strong>CD</strong>’ scale, which attributes a weightof 1 to the first adult <strong>in</strong> the household, aweight of 0.5 to each subsequent memberof the household aged 14 and over anda weight of 0.3 to household membersages less than 14). The result<strong>in</strong>g figureis called equivalised disposable <strong>in</strong>comeand is attributed to each member of thehousehold. For the purpose of poverty<strong>in</strong>dicators, the equivalised disposable <strong>in</strong>comeis calculated from the total disposable<strong>in</strong>come of each household divided bythe equivalised household size. Consequently,each person <strong>in</strong> the household isconsidered to have the same equivalised<strong>in</strong>come.The S80/S20 <strong>in</strong>come qu<strong>in</strong>tile share ratiois a measure of the <strong>in</strong>equality of <strong>in</strong>comedistribution and is calculated as the ratioof total <strong>in</strong>come received by the 20 % ofthe population <strong>with</strong> the highest <strong>in</strong>come(the top qu<strong>in</strong>tile) to that received by the20 % of the population <strong>with</strong> the lowest<strong>in</strong>come (the bottom qu<strong>in</strong>tile); where all<strong>in</strong>comes are compiled as equivalised disposable<strong>in</strong>come. Note that the f<strong>in</strong>al chapterat the end of this publication presentsregional data for the disposable <strong>in</strong>comeper habitant.The relative median <strong>in</strong>come ratio is def<strong>in</strong>edas the ratio of the median equivaliseddisposable <strong>in</strong>come of persons agedabove 65 to the median equivalised disposable<strong>in</strong>come of persons aged below 65.The at-risk-of-poverty rate is def<strong>in</strong>ed asthe share of persons <strong>with</strong> an equivaliseddisposable <strong>in</strong>come that is below the atrisk-of-povertythreshold, set at 60 % ofthe national median equivalised disposable<strong>in</strong>come. This rate may be expressedbefore or after social transfers, <strong>with</strong> thedifference measur<strong>in</strong>g the hypotheticalimpact of national social transfers <strong>in</strong> reduc<strong>in</strong>gpoverty risk. Retirement and survivor’spensions are counted as <strong>in</strong>comebefore transfers and not as social transfers.Various breakdowns of this <strong>in</strong>dicatorare calculated: by age, gender, activitystatus, household type, education level,etc. It should be noted that this <strong>in</strong>dicatordoes not measure wealth but low current<strong>in</strong>come (<strong>in</strong> comparison <strong>with</strong> otherpersons <strong>in</strong> the same country) which doesnot necessarily imply a low standard ofliv<strong>in</strong>g.The relative median at-risk-of-povertygap is calculated as the difference betweenthe median equivalised disposable<strong>in</strong>come of persons below the at-risk-ofpovertythreshold and the at-risk-of-povertythreshold, expressed as a percentageof the at-risk-of-poverty threshold(cut-off po<strong>in</strong>t: 60 % of national medianequivalised <strong>in</strong>come). The EU aggregateis a population weighted average of <strong>in</strong>dividualnational <strong>figures</strong>.In l<strong>in</strong>e <strong>with</strong> decisions of the <strong>Europe</strong>anCouncil, the at-risk-of-poverty rate ismeasured relative to the situation <strong>in</strong> eachcountry rather than apply<strong>in</strong>g a commonthreshold to all countries.The <strong>in</strong>dicators related to jobless households(the share of children aged 0-17and the share of persons aged 18-59 whoare liv<strong>in</strong>g <strong>in</strong> households where no oneworks) are calculated as the proportionEUROPE IN FIGURES — <strong>Eurostat</strong> <strong>yearbook</strong> <strong>2009</strong>235
6 Liv<strong>in</strong>g conditions and welfareof persons of the specified age who live<strong>in</strong> households where no one is work<strong>in</strong>g.Students aged 18 to 24 who live <strong>in</strong> householdscomposed solely of students of thesame age class are counted neither <strong>in</strong> thenumerator nor the denom<strong>in</strong>ator of theratio; the data comes from the EU LabourForce Survey (LFS).Ma<strong>in</strong> f<strong>in</strong>d<strong>in</strong>gsIn 2006, the 20 % of the EU-25 population<strong>with</strong> the highest equivalised disposable<strong>in</strong>come received almost five times asmuch <strong>in</strong>come as the 20 % of the population<strong>with</strong> the lowest equivalised disposable<strong>in</strong>come. With<strong>in</strong> the Member States,the widest <strong>in</strong>equalities were recorded <strong>in</strong>Latvia (a ratio of 7.9) and Portugal (6.8).In contrast, the narrowest <strong>in</strong>come <strong>in</strong>equalitieswere <strong>in</strong> the Nordic MemberStates, Bulgaria, the Czech Republic andSlovenia, <strong>with</strong> S80/S20 <strong>in</strong>come qu<strong>in</strong>tileshare ratios of between 3.4 and 3.6.A comparison between the number ofpeople on low <strong>in</strong>comes before social benefitsother than pensions and those onlow <strong>in</strong>comes after social benefits (<strong>in</strong> otherwords, old age pensions and survivors’benefits are <strong>in</strong>cluded <strong>in</strong> <strong>in</strong>come both ‘before’and ‘after’ social benefits), illustratesone of the ma<strong>in</strong> purposes of such benefits:their redistributive effect and, <strong>in</strong> particular,their ability to alleviate the riskof poverty and reduce the percentage ofpopulation hav<strong>in</strong>g to manage <strong>with</strong> a low<strong>in</strong>come. In 2006, social transfers reducedthe at-risk-of-poverty rate from 26 % beforetransfers for the EU-25 populationto 16 % after transfers <strong>in</strong> 2006; as such,social transfers lifted 38 % of those <strong>in</strong>poverty above the poverty risk threshold.Social benefits other than pensions reducedthe percentage of people at-risk-ofpoverty<strong>in</strong> all countries, but to very disparatedegrees. The proportion of personswho were removed from be<strong>in</strong>g at-risk-ofpovertyby social transfers was smallest<strong>in</strong> some of the Mediterranean MemberStates (Greece, Spa<strong>in</strong>, and Italy), as wellas Latvia and Bulgaria. Those countrieswhose social protection and support systemsremoved the highest proportion ofpersons out of be<strong>in</strong>g threatened by poverty(over half) <strong>in</strong>cluded Sweden, Denmark,F<strong>in</strong>land, the Czech Republic, theNetherlands, Slovenia and Germany.With a grow<strong>in</strong>g proportion of the EU’spopulation aged over 65 years and persistentlylow fertility rates (see Chapter3 for more details), there are <strong>in</strong>creas<strong>in</strong>gconcerns both about how Member Stateswill be able to pay for the pension andhealthcare costs l<strong>in</strong>ked to age<strong>in</strong>g, as wellas <strong>in</strong>creased poverty risks for the elderly.By compar<strong>in</strong>g the relative median equivaliseddisposable <strong>in</strong>come of persons agedabove 65 to the median equivalised disposable<strong>in</strong>come of persons aged below 65,the relative standard of liv<strong>in</strong>g among theelderly can be gauged. With the exceptionof Poland, those aged over 65 years had anaverage disposable <strong>in</strong>come <strong>in</strong> 2006 thatwas less than those aged below 65 years.In Luxembourg, Hungary, Austria andGermany, the difference <strong>in</strong> <strong>in</strong>comes betweenthese two age groups was less than10 %. In 2006, <strong>in</strong> the majority of MemberStates, the difference between the equivaliseddisposable <strong>in</strong>comes of those aged65 and over and those aged between 0and 64 was between 10°% and 30°%.However, this widened to between 30 %and 35 % <strong>in</strong> Estonia, Ireland and Latvia,while <strong>in</strong> Cyprus the median equivaliseddisposable <strong>in</strong>come of those aged over 65years was only 57 % of that for personsaged less than 65 years.236 EUROPE IN FIGURES — <strong>Eurostat</strong> <strong>yearbook</strong> <strong>2009</strong>
Liv<strong>in</strong>g conditions and welfare 6This relatively low level of <strong>in</strong>come amongpensioners <strong>in</strong> Cyprus was highlighted asa majority (52 %) of persons aged over65 <strong>in</strong> Cyprus were at-risk-of-poverty <strong>in</strong>2006. Some 31 % of persons aged over65 <strong>in</strong> Spa<strong>in</strong> and 30 % <strong>in</strong> Latvia were atrisk-of-poverty,which was <strong>in</strong> contrast toshares of less than 10 % <strong>in</strong> Hungary, Luxembourg,Poland, Slovakia, the CzechRepublic and the Netherlands.The elderly and retired were not the onlygroup at-risk-of-poverty <strong>in</strong> 2006. Acrossthe population of the EU-25, an estimated15 % of persons aged 18 years orover were at-risk-of-poverty after socialtransfers. The most vulnerable groupwere the unemployed (self-assessed mostfrequent activity status), about two fifths(41 %) of whom were at-risk-of poverty,a share that rose to around 60 % <strong>in</strong> eachof the Baltic Member States. Nearly onethird (32 %) of s<strong>in</strong>gle parent households<strong>with</strong> dependent children were at-risk-ofpovertyacross the EU-25 <strong>in</strong> 2006, whichwas the highest proportion of any type ofhousehold covered by the survey. In contrast,multi-adult households <strong>with</strong>out dependentchildren tended to be the households<strong>with</strong> the least risk of poverty (3) .In 2007, some 9.3 % of the EU-27’s populationaged between 18 and 59 years lived<strong>in</strong> a jobless household; the proportion ofchildren (up to 17 years) liv<strong>in</strong>g <strong>in</strong> joblesshouseholds was almost at the same level(9.4 %). The highest proportion of childrenliv<strong>in</strong>g <strong>in</strong> jobless households was recorded<strong>in</strong> the United K<strong>in</strong>gdom (16.7 %),followed by Hungary (14.0 %) and Belgium(13.5 %); these two Member Statesalso recorded the highest shares of adultsaged 18 to 59 years old liv<strong>in</strong>g <strong>in</strong> joblesshouseholds, along <strong>with</strong> Poland. Notethat these statistics may be affected by anumber of factors, <strong>in</strong>clud<strong>in</strong>g differences<strong>in</strong> average numbers of children and <strong>in</strong>activityrates between different socio-economicgroups.(3) Please note that the at-risk-of-poverty rate emphasises a relative concept of <strong>in</strong>come poverty, relative to the levelof <strong>in</strong>come <strong>in</strong> one country and does not take <strong>in</strong>to account wealth or actual purchas<strong>in</strong>g power; it also assumes thathousehold members share their resources. Additionally, it is <strong>in</strong>fluenced by the equivalence scale chosen. In the future,the at-risk-of-poverty rate will be complemented by other poverty <strong>in</strong>dicators.Figure 6.1: Inequality of <strong>in</strong>come distribution, 2006(S80/S20 <strong>in</strong>come qu<strong>in</strong>tile share ratio)86420EU-25 (1)Euro area (1,2)LatviaPortugal (3)LithuaniaGreecePolandEstoniaItalyHungaryUnited K<strong>in</strong>gdomRomania (4)Spa<strong>in</strong>IrelandCyprusMalta (3)BelgiumLuxembourgGermanyFranceSlovakiaNetherlandsAustriaF<strong>in</strong>landBulgaria (4)Czech RepublicSwedenDenmarkSloveniaNorwayIceland (3)(1) <strong>Eurostat</strong> estimates based on population-weighted averages of national data.(2) EA-13 <strong>in</strong>stead of EA-15.(3) Provisional.(4) National HBS.Source: <strong>Eurostat</strong> (tsisc010)EUROPE IN FIGURES — <strong>Eurostat</strong> <strong>yearbook</strong> <strong>2009</strong>237
6 Liv<strong>in</strong>g conditions and welfareFigure 6.2: Relative median <strong>in</strong>come ratio, 2006 (1)(ratio)1.251.000.750.500.250.00EU-25 (2)Euro area (2, 3)PolandLuxembourgHungaryAustriaGermanyFranceItalyNetherlandsSloveniaSlovakiaBulgaria (4)Malta (5)SwedenCzech RepublicGreecePortugal (5)LithuaniaF<strong>in</strong>landSpa<strong>in</strong>United K<strong>in</strong>gdomBelgiumDenmarkEstoniaIrelandLatviaCyprusIceland (5)Norway(1) Romania, not available.(2) <strong>Eurostat</strong> estimates based on population-weighted averages of national data.(3) EA-13 <strong>in</strong>stead of EA-15.(4) National HBS.(5) Provisional.Source: <strong>Eurostat</strong> (ilc_ov7a)Figure 6.3: Relative median at-risk-of-poverty gap, 2006(%)3020100EU-25 (1)LithuaniaGreeceSpa<strong>in</strong>LatviaPolandItalyHungaryPortugal (2)Romania (3)United K<strong>in</strong>gdomEstoniaSwedenMalta (2)GermanySlovakiaBelgiumFranceCyprusLuxembourgSloveniaBulgaria (3)Czech RepublicDenmarkNetherlandsIrelandAustriaF<strong>in</strong>landIceland (2)Norway(1) <strong>Eurostat</strong> estimates based on population-weighted averages of national data.(2) Provisional.(3) National HBS.Source: <strong>Eurostat</strong> (tsdsc250)238 EUROPE IN FIGURES — <strong>Eurostat</strong> <strong>yearbook</strong> <strong>2009</strong>
Liv<strong>in</strong>g conditions and welfare 6Table 6.1: At-risk-of-poverty rate by most frequent activity status, 2006 (1)(%)TotalpopulationPersonsemployedNotemployed Unemployed RetiredInactivepopulation,othersEU-25 (2) 15 8 23 41 16 26Euro area (2, 3) 15 7 22 38 15 25Belgium 15 4 24 31 20 25Bulgaria (4) 14 6 20 36 17 16Czech Republic 8 3 14 44 7 15Denmark 12 4 22 25 16 28Germany 12 5 19 43 13 18Estonia 18 8 32 59 29 29Ireland 18 6 31 50 26 31Greece 20 14 26 33 24 26Spa<strong>in</strong> 19 10 29 38 24 30France 13 6 19 31 13 25Italy 19 10 26 44 16 30Cyprus 17 7 30 31 51 16Latvia 22 11 37 64 35 29Lithuania 20 10 30 61 23 28Luxembourg 13 10 15 48 7 17Hungary 14 7 20 53 12 25Malta 13 5 20 40 22 18Netherlands 9 4 14 27 6 19Austria 12 6 18 43 13 21Poland 18 13 22 46 7 23Portugal 18 11 26 31 23 29Romania : : : : : :Slovenia 11 5 18 33 17 17Slovakia 11 6 15 41 8 17F<strong>in</strong>land 13 4 24 42 20 24Sweden 11 7 18 24 12 29United K<strong>in</strong>gdom 18 8 32 57 28 34Iceland 9 7 15 14 10 21Norway 10 6 18 31 18 16(1) Persons aged 18 years and over.(2) <strong>Eurostat</strong> estimates based on population-weighted averages of national data.(3) EA-13 <strong>in</strong>stead of EA-15.(4) National HBS.Source: <strong>Eurostat</strong> (ilc_li04)EUROPE IN FIGURES — <strong>Eurostat</strong> <strong>yearbook</strong> <strong>2009</strong>239
6 Liv<strong>in</strong>g conditions and welfareFigure 6.4: At-risk-of-poverty rate, 2006(%)403020100EU-25 (1)Euro area (1, 2)LatviaGreeceSpa<strong>in</strong>ItalyLithuaniaPolandRomania (3)United K<strong>in</strong>gdomEstoniaIrelandPortugal (4)CyprusHungaryBelgiumBulgaria (3)LuxembourgMalta (4)GermanyFranceAustriaF<strong>in</strong>landDenmarkSloveniaSlovakiaSwedenCzech RepublicNetherlandsNorwayIceland (4)At-risk-of-poverty rate before social transfersAt-risk-of-poverty rate after social transfers(1) <strong>Eurostat</strong> estimates based on population-weighted averages of national data.(2) EA-13 <strong>in</strong>stead of EA-15.(3) National HBS.(4) Provisional.Source: <strong>Eurostat</strong> (tsisc020 and tsisc030)Figure 6.5: At-risk-of-poverty rate after social transfers, by household type, EU-25, 2006 (1)(%)All householdsS<strong>in</strong>gle parent <strong>with</strong> dependent childrenOne adult older than 65 yearsS<strong>in</strong>gle femaleTwo adults <strong>with</strong> three or more dependent childrenOne adult younger than 64 yearsS<strong>in</strong>gle maleThree or more adults <strong>with</strong> dependent childrenTwo adults, at least one aged 65 years and overTwo adults <strong>with</strong> two dependent childrenTwo adults <strong>with</strong> one dependent childThree or more adultsTwo adults younger than 65 years(1) <strong>Eurostat</strong> estimates based on population-weighted averages of national data.Source: <strong>Eurostat</strong> (tsdsc240)0 10 20 30 40240 EUROPE IN FIGURES — <strong>Eurostat</strong> <strong>yearbook</strong> <strong>2009</strong>
Liv<strong>in</strong>g conditions and welfare 6Figure 6.6: At-risk-of-poverty rate after social transfers, persons aged 65 years and over, 2006(%)6050403020100EU-25 (1)CyprusSpa<strong>in</strong>LatviaUnited K<strong>in</strong>gdomIrelandGreecePortugal (2)EstoniaBelgiumItalyLithuaniaF<strong>in</strong>landMalta (2)SloveniaRomania (3)Bulgaria (3)DenmarkFranceAustriaGermanySwedenHungaryLuxembourgPolandSlovakiaCzech RepublicNetherlandsNorwayIceland (2)(1) <strong>Eurostat</strong> estimate based on population-weighted averages of national data.(2) Provisional.(3) National HBS.Source: <strong>Eurostat</strong> (tsdsc230)Figure 6.7: Persons liv<strong>in</strong>g <strong>in</strong> jobless households, by age, 2007 (1)(% of respective age group liv<strong>in</strong>g <strong>in</strong> households where no-one works)20151050EU-27 (2)BelgiumBulgariaCzech RepublicDenmark (3)GermanyEstoniaIrelandGreeceSpa<strong>in</strong>FranceItalyCyprusLatviaLithuaniaLuxembourgHungaryMaltaNetherlandsAustriaPolandPortugalRomaniaSloveniaSlovakiaF<strong>in</strong>land (3)United K<strong>in</strong>gdomCroatia (3)Children aged up to 17 Adults aged 18 to 59(1) Sweden, not available.(2) Estimates.(3) 2006.Source: <strong>Eurostat</strong> (tsdsc310)EUROPE IN FIGURES — <strong>Eurostat</strong> <strong>yearbook</strong> <strong>2009</strong>241
6 Liv<strong>in</strong>g conditions and welfareFigure 6.8: Persons liv<strong>in</strong>g <strong>in</strong> jobless households, by gender, 2007 (1)(% of respective gender aged 18-59 who are liv<strong>in</strong>g <strong>in</strong> households where no-one works)151050EU-27 (2)Euro area (2)BelgiumBulgariaCzech RepublicDenmark (3)GermanyEstoniaIrelandGreeceSpa<strong>in</strong>FranceItalyCyprusLatviaLithuaniaLuxembourgHungaryMaltaNetherlandsAustriaPolandPortugalRomaniaSloveniaSlovakiaF<strong>in</strong>land (3)United K<strong>in</strong>gdomCroatia (3)MaleFemale(1) Sweden, not available.(2) Estimates.(3) 2006.Source: <strong>Eurostat</strong> (tsisc090)242 EUROPE IN FIGURES — <strong>Eurostat</strong> <strong>yearbook</strong> <strong>2009</strong>
Liv<strong>in</strong>g conditions and welfare 66.2 Household consumptionexpenditureIntroductionThe f<strong>in</strong>al consumption expenditure ofhouseholds is the biggest component ofthe expenditure approach of GDP. Itsevolution allows an assessment of purchasesmade by households, reflect<strong>in</strong>gchanges <strong>in</strong> wages and other <strong>in</strong>comes, butalso <strong>in</strong> employment and <strong>in</strong> the behaviourtowards sav<strong>in</strong>gs. Therefore, the growthof household consumption can be somewhatdifferent from the growth of wagesand <strong>in</strong>comes.Def<strong>in</strong>itions and data availabilityF<strong>in</strong>al consumption expenditure of householdsrefers to expenditure <strong>in</strong>curred onthe domestic territory (by residents andnon-residents) on goods and servicesused for the direct satisfaction of <strong>in</strong>dividualneeds. It covers the purchase ofgoods and services, the consumption ofown production (such as garden produce)and the imputed rent of owner-occupieddwell<strong>in</strong>gs. The Council regulation for the<strong>Europe</strong>an system of accounts 1995 (4) providesthe underly<strong>in</strong>g basis for the collectionof data on household consumptionexpenditure <strong>with</strong> respect to data providedby <strong>Eurostat</strong>’s national accounts statistics.Note that the data from national accountsshould <strong>in</strong>clude <strong>in</strong>stitutional households.The household budget survey (HBS) describesthe level and the structure ofhousehold expenditure. HBS are nationalsurveys that focus on consumption expenditure,and nationally are used to calculateweights for consumer price <strong>in</strong>dices;they may also be used <strong>in</strong> the compilationof national accounts. HBS are samplesurveys conducted <strong>in</strong> all of the MemberStates, as well as Croatia, the former YugoslavRepublic of Macedonia, Turkey,Norway and Switzerland, on a periodicbasis (about every five to six years).HBS provide a picture of the total consumptionexpenditure of private households,analysed by a variety of socio-economichousehold characteristics such asthe employment status of the ma<strong>in</strong> referenceperson, their <strong>in</strong>come, their age, thenumber of active persons liv<strong>in</strong>g <strong>in</strong> thehousehold, the type of household, the locationof the household (rural or urban),or the ma<strong>in</strong> source of <strong>in</strong>come. Informationis available at a detailed level us<strong>in</strong>gthe classification of <strong>in</strong>dividual consumptionby purpose (COICOP), <strong>with</strong> over 230head<strong>in</strong>gs for different goods and services(<strong>in</strong>clud<strong>in</strong>g aggregates).HBS data are conf<strong>in</strong>ed to the populationresid<strong>in</strong>g <strong>in</strong> private households. In otherwords, the survey excludes collective or<strong>in</strong>stitutional households (such as hospitals,old persons’ homes, prisons, or militarybarracks), as well as persons <strong>with</strong>outa fixed place of residence – <strong>in</strong> contrast tothe data collected for national accounts.The basic unit for the collection of <strong>in</strong>formationis the household (def<strong>in</strong>ed as a socialunit which shares household expensesor daily needs, <strong>in</strong> addition to hav<strong>in</strong>g acommon residence) – <strong>in</strong> other words, thehousehold is seen as a housekeep<strong>in</strong>g unit.Nevertheless, it is also important to identifythe head of the household, as theirpersonal characteristics are often used asthe basis to classify <strong>in</strong>formation on socioeconomiccharacteristics. The head of the(4) Council Regulation (EC) No 2223/96 (see http://forum.europa.eu.<strong>in</strong>t/irc/dsis/nfaccount/<strong>in</strong>fo/data/esa95/esa95-new.htmfor a consolidated version that takes account of subsequent changes).EUROPE IN FIGURES — <strong>Eurostat</strong> <strong>yearbook</strong> <strong>2009</strong>243
6 Liv<strong>in</strong>g conditions and welfarehousehold is def<strong>in</strong>ed, for the purpose ofthe HBS, as the person who contributesthe most to the <strong>in</strong>come of the household(the ma<strong>in</strong> earner). To take economies ofscale <strong>in</strong>to account, household expenditurescan be expressed per adult equivalent(see previous subchapter for moredetails).For the HBS, household consumption expenditureis def<strong>in</strong>ed as the value of goodsand services used for directly meet<strong>in</strong>ghuman needs. Household consumptioncovers expenditure on purchases of goodsand services, own consumption, and theimputed rent of owner-occupied dwell<strong>in</strong>gs(the rent that the household wouldpay if it were a tenant). The expenditureeffected by households to acquire goodsand services is recorded at the price actuallypaid, which <strong>in</strong>cludes <strong>in</strong>direct taxes(VAT and excise duties) borne by thepurchaser. <strong>Eurostat</strong> guidel<strong>in</strong>es encouragenon-monetary components of consumptionto be <strong>in</strong>cluded <strong>with</strong><strong>in</strong> the survey results,<strong>with</strong> <strong>in</strong>ternal production valued atretail prices, as if the product had beenbought <strong>in</strong> a shop. Examples of <strong>in</strong>ternalproduction <strong>in</strong>clude own production offood (either by a farm<strong>in</strong>g household or bya family that has a different professionalactivity but grows their own food <strong>in</strong> akitchen/vegetable garden or allotment),or <strong>with</strong>drawals from stocks for own-use<strong>in</strong> the case of tradesmen or retailers. HBSdata should also reflect benefits <strong>in</strong> k<strong>in</strong>dprovided by employers <strong>in</strong> exchange forwork done. Notional rents are imputed toowner-occupiers and households accommodatedfree of charge.Ma<strong>in</strong> f<strong>in</strong>d<strong>in</strong>gsThe consumption habits of householdsvary substantially among the 27 MemberStates. Factors such as culture, <strong>in</strong>come,weather, household composition, economicstructure and degree of urbanisationcan <strong>in</strong>fluence habits <strong>in</strong> each country.Accord<strong>in</strong>g to national accounts, the f<strong>in</strong>alconsumption expenditure of householdswas the equivalent of at least one half ofGDP <strong>in</strong> the majority of Member States;the share was highest <strong>in</strong> Cyprus (75.3 %),Bulgaria and Greece (both 73.9 %) <strong>in</strong>2006 and only less than 50 % <strong>in</strong> F<strong>in</strong>land,Denmark, the Netherlands, Sweden, Irelandand Luxembourg. Average householdconsumption expenditure per capitawas by far the highest <strong>in</strong> Luxembourg(PPS 25800), followed by Greece (PPS17 900) and Austria (PPS 16 900). Averagehousehold expenditure tended to belowest <strong>in</strong> those countries that jo<strong>in</strong>ed theEU s<strong>in</strong>ce 2004, the pr<strong>in</strong>cipal exceptionsbe<strong>in</strong>g Cyprus and Malta.National accounts data also reveals that alittle over one fifth (21.9 %) of total householdconsumption expenditure <strong>in</strong> theEU-27 <strong>in</strong> 2006 was devoted to hous<strong>in</strong>g,water, electricity, gas and other hous<strong>in</strong>gfuels. Transport expenditure (13.6 %) andexpenditure on food and non-alcoholicbeverages (12.7 %), together accountedfor a little more than a quarter of totalhouseholds consumption expenditure,mak<strong>in</strong>g these the next two most importantcategories <strong>in</strong> the EU-27.244 EUROPE IN FIGURES — <strong>Eurostat</strong> <strong>yearbook</strong> <strong>2009</strong>
Liv<strong>in</strong>g conditions and welfare 6Both the household budget survey (HBS)and national accounts provide a far moredetailed breakdown of these aggregatedconsumption expenditure statistics.Switch<strong>in</strong>g to HBS data, the proportionof household expenditure devoted toeach of the consumption categories variedgreatly between the Member States <strong>in</strong>2005. The highest proportion of the meanconsumption expenditure of households(<strong>in</strong> PPS) spent on hous<strong>in</strong>g, water, electricity,gas and other fuels <strong>in</strong> 2005 wasrecorded <strong>in</strong> Sweden (32.2 %), which wasabout three times as high as <strong>in</strong> Malta(9.1 %). The proportion of householdconsumption spent on food and nonalcoholicbeverages tended to be highest<strong>in</strong> those Member States where household<strong>in</strong>comes were lowest; <strong>in</strong> Romania suchitems accounted for 44.2 % of the meanconsumption expenditure of households,which could be compared <strong>with</strong> an averageof 9.3 % <strong>in</strong> Luxembourg.Household consumption expenditure wasalso reflected <strong>in</strong> certa<strong>in</strong> broad socio-demographicpatterns. The mean consumptionexpenditure of households whosehead was aged 30 to 59 years old tendedto be much higher than the equivalentexpenditure of households whose headwas either aged under 30 or over 60. In anumber of the Member States that jo<strong>in</strong>edthe EU s<strong>in</strong>ce 2004, average householdconsumption expenditure of those householdsheaded by a person aged under 30was generally much closer to the expenditureof households headed by someoneof an older work<strong>in</strong>g age (30 to 59), and <strong>in</strong>Latvia and Romania was higher.Households headed by the self-employedor non-manual workers <strong>in</strong> <strong>in</strong>dustry andservices <strong>in</strong> the EU-27 had, on average, thehighest mean consumption expenditureof about PPS 32 500 <strong>in</strong> 2005, <strong>with</strong> that ofhouseholds headed by manual workersabout 25 % lower.As may be expected, there was a strongl<strong>in</strong>k between household <strong>in</strong>come and expenditureacross the EU-27; the 20 % ofhouseholds <strong>with</strong> the highest <strong>in</strong>comesspent an average of about two and threequarters times as much as the poorest20 % of households <strong>in</strong> 2005. There wasalso a strong correlation between averagehousehold consumption expenditure, thesize of households and the number of activepersons <strong>in</strong> the household. Householdconsumption expenditure was highest<strong>in</strong> households <strong>with</strong> three or more adults<strong>with</strong> dependent children and lowest <strong>with</strong><strong>in</strong>s<strong>in</strong>gle person households, while households<strong>with</strong> three or more active personsspent more than households <strong>with</strong> no activepersons. Nevertheless, <strong>in</strong> both casesthe relationship was not l<strong>in</strong>ear: economiesof scale (for example, shar<strong>in</strong>g a flator a car, heat<strong>in</strong>g a room, etc.) may, at leastto some degree, expla<strong>in</strong> why the expenditureof a s<strong>in</strong>gle person is generally considerablymore than half the expenditureof a couple.EUROPE IN FIGURES — <strong>Eurostat</strong> <strong>yearbook</strong> <strong>2009</strong>245
6 Liv<strong>in</strong>g conditions and welfareTable 6.2: Total consumption expenditure of households (domestic concept)As a proportion of GDP (%)Per capita (PPS)1996 2001 2006 (1) 1996 2001 2006 (1)EU-27 57.0 57.4 56.3 8 800 11 400 13 300Euro area 56.8 56.9 56.0 : 12 700 14 600Belgium 52.5 52.3 50.5 10 200 12 800 14 200Bulgaria 76.1 73.8 73.9 3 300 4 300 5 800Czech Republic 53.2 54.0 50.8 6 200 7 500 9 400Denmark 50.0 46.7 47.5 10 200 11 800 12 900Germany 55.4 56.5 53.9 10 800 13 000 15 100Estonia 64.8 59.5 56.2 3 800 5 400 8 900Ireland 52.1 45.3 43.2 8 700 11 900 14 800Greece : 75.8 73.9 : 13 000 17 900Spa<strong>in</strong> 62.7 62.4 59.5 8 900 12 100 14 700France 56.2 55.5 56.0 9 900 12 700 15 400Italy 59.0 60.1 59.7 10 900 14 000 15 000Cyprus 81.8 82.8 75.3 11 000 14 900 16 300Latvia 65.1 60.8 63.2 3 300 4 700 8 000Lithuania 66.6 66.2 65.6 3 700 5 400 8 700Luxembourg 47.5 46.6 39.3 16 200 21 600 25 800Hungary 55.9 56.5 53.9 4 300 6 600 8 200Malta 78.8 77.3 68.9 9 600 11 900 13 200Netherlands 49.1 48.8 45.7 9 400 12 900 15 000Austria 58.5 58.1 56.3 12 100 14 400 16 900Poland 61.3 64.5 61.5 4 200 6 100 7 600Portugal 65.4 64.2 65.9 7 600 9 800 11 600Romania : 69.0 67.8 : 3 800 6 200Slovenia 61.3 57.8 55.5 7 100 9 000 11 500Slovakia 53.9 58.8 56.2 4 100 6 100 8 400F<strong>in</strong>land 50.6 47.4 48.4 8 300 10 900 14 000Sweden 47.7 46.6 45.4 9 200 11 200 12 600United K<strong>in</strong>gdom 61.4 62.1 59.9 10 700 14 400 16 600Turkey 67.3 74.9 73.9 3 200 5 300 7 800Iceland 54.7 52.2 52.5 11 200 13 700 16 100Norway 47.0 41.7 39.8 10 400 13 300 18 200Switzerland 59.1 59.5 57.3 13 800 16 600 18 500(1) Germany, Greece, France, Italy, Malta, the Netherlands, F<strong>in</strong>land, Turkey and Norway, 2007; Bulgaria and Sweden, 2005; Denmark, 2004.Source: <strong>Eurostat</strong> (nama_fcs_c)246 EUROPE IN FIGURES — <strong>Eurostat</strong> <strong>yearbook</strong> <strong>2009</strong>
Liv<strong>in</strong>g conditions and welfare 6Table 6.3: Mean consumption expenditure of households, 2005(PPS)COICOP code (1)01 02 03 04 05 06 07 08 09 10 11 12EU-27 3 594 560 1 412 6 936 1 416 796 3 078 738 2 187 238 1 417 2 291Euro area (2) 4 027 602 1 679 7 869 1 588 1 016 3 531 804 2 309 248 1 585 2 845Belgium 4 043 669 1 425 7 610 1 687 1 400 3 863 878 2 868 136 1 894 3 576Bulgaria 2 238 269 218 2 461 213 305 355 325 204 34 255 220Czech Republic 2 503 347 679 2 444 815 239 1 351 555 1 289 66 619 1 234Denmark 2 872 785 1 168 7 194 1 459 639 3 331 583 2 738 100 960 2 233Germany 3 185 489 1 355 8 445 1 543 1 024 3 790 828 3 168 236 1 212 3 226Estonia 2 440 300 601 3 240 568 282 1 087 596 691 145 339 559Ireland 4 491 2 032 1 851 8 520 2 613 904 4 203 1 255 3 670 687 2 190 3 956Greece 4 801 1 045 2 154 7 442 1 929 1 824 3 222 1 174 1 285 738 2 661 2 701Spa<strong>in</strong> 4 685 586 1 786 7 874 1 211 577 2 743 701 1 659 292 2 414 1 499France 3 733 650 1 853 7 339 1 693 1 167 3 777 914 1 926 165 1 277 3 392Italy 5 359 506 2 013 8 512 1 670 1 132 3 420 621 1 680 202 1 428 2 242Cyprus 5 158 646 2 649 7 381 2 008 1 624 4 980 1 164 2 044 1 354 2 830 2 370Latvia 3 091 329 778 1 810 546 394 1 155 610 667 145 557 508Lithuania 3 166 332 743 1 776 392 445 762 435 402 102 429 393Luxembourg 4 851 865 3 343 15 611 3 702 1 351 8 403 1 139 3 869 223 4 098 4 478Hungary 2 413 380 537 2 073 498 440 1 511 696 909 90 343 803Malta 6 082 786 2 387 2 596 3 070 869 4 758 837 2 879 352 2 030 1 960Netherlands 3 089 625 1 694 7 513 1 888 371 3 196 903 3 193 306 1 647 4 945Austria 3 933 847 1 682 6 732 1 868 946 4 863 793 3 809 242 1 660 2 792Poland 2 704 262 489 3 341 478 485 862 512 662 138 180 571Portugal 3 243 477 861 5 560 994 1 264 2 693 616 1 182 356 2 263 1 359Romania 2 355 307 333 832 201 205 344 259 224 45 58 162Slovenia 3 966 575 1 678 5 483 1 389 356 3 717 950 2 234 202 1 035 2 220Slovakia 2 910 333 661 2 517 494 330 986 506 712 92 520 713F<strong>in</strong>land 3 086 588 934 6 614 1 238 852 3 818 693 2 731 51 1 021 2 733Sweden 2 913 531 1 270 8 250 1 640 638 3 623 791 3 398 8 981 1 569United K<strong>in</strong>gdom 3 159 753 1 585 9 458 2 092 383 4 305 852 3 943 457 2 558 2 415Croatia 4 564 548 1 059 4 983 697 315 1 484 729 853 105 465 1 039Norway 3 402 898 1 618 7 633 1 892 872 5 270 770 3 593 95 1 111 1 951(1) COICOP codes - 01: food and non-alcoholic beverages; 02: alcoholic beverages and tobacco; 03: cloth<strong>in</strong>g and footwear; 04: hous<strong>in</strong>g,water, electricity, gas and other fuels; 05: furnish<strong>in</strong>gs, household equipment and rout<strong>in</strong>e ma<strong>in</strong>tenance of the house; 06: health;07: transport; 08: communications; 09: recreation and culture; 10: education; 11: restaurants and hotels; 12: miscellaneous goods andservices.(2) EA-13 <strong>in</strong>stead of EA-15.Source: <strong>Eurostat</strong> (hbs_exp_t121)EUROPE IN FIGURES — <strong>Eurostat</strong> <strong>yearbook</strong> <strong>2009</strong>247
6 Liv<strong>in</strong>g conditions and welfareTable 6.4: Mean consumption expenditure of households by age of the head of household, 2005(PPS)Less than 30 Aged 30-49 Aged 45-59 60 or moreEU-27 20 882 27 467 29 018 19 606Euro area (1) 22 904 31 055 33 375 22 787Belgium 27 820 33 971 32 513 23 965Bulgaria 8 435 8 922 8 145 5 212Czech Republic 11 962 14 551 13 812 8 293Denmark 18 549 27 912 28 828 18 685Germany 19 121 30 218 34 207 25 428Estonia 10 422 14 039 11 630 7 630Ireland 38 889 42 513 43 039 22 634Greece 25 747 37 247 39 564 21 543Spa<strong>in</strong> 23 095 27 928 31 830 20 464France 23 632 31 728 32 181 22 041Italy 24 955 31 594 34 558 23 405Cyprus 38 327 38 559 43 721 19 153Latvia 13 206 12 902 11 723 6 313Lithuania 10 537 11 608 10 256 6 193Luxembourg 44 541 53 941 59 954 43 792Hungary 11 827 12 905 12 680 7 022Malta 33 060 31 315 34 051 19 483Netherlands 22 177 33 447 33 445 22 849Austria 26 197 33 404 35 516 23 603Poland 10 627 12 424 11 152 8 270Portugal 20 688 23 750 25 159 14 838Romania 6 261 5 919 3 685 2 841Slovenia 25 230 27 486 26 912 16 322Slovakia 11 504 12 589 11 929 6 956F<strong>in</strong>land 19 735 30 868 28 184 17 853Sweden 18 665 28 669 28 677 22 985United K<strong>in</strong>gdom 28 918 35 742 38 198 24 334Croatia 13 988 21 215 20 691 12 487Norway 20 637 33 500 32 373 24 566(1) EA-13 <strong>in</strong>stead of EA-15.Source: <strong>Eurostat</strong> (hbs_exp_t135)248 EUROPE IN FIGURES — <strong>Eurostat</strong> <strong>yearbook</strong> <strong>2009</strong>
Liv<strong>in</strong>g conditions and welfare 6Figure 6.9: Consumption expenditure of households on goods and services, EU-27, 2006 (1)(% of total household consumption expenditure)Communications2.7%Alcoholic beverages,and tobacco3.5%Furnish<strong>in</strong>gs, householdequipment and rout<strong>in</strong>ema<strong>in</strong>tenance6.2%Education1.0%Health3.4%Cloth<strong>in</strong>gand footwear5.7%Restaurantsand hotels9.0%Miscellaneousgoods and services10.8%Recreationand culture9.4%Hous<strong>in</strong>g, water, electricity,gas and other fuels21.9%Transport13.6%Food andnon-alcoholic beverages12.7%(1) Figures do not sum to 100 % due to round<strong>in</strong>g.Source: <strong>Eurostat</strong> (nama_co2_c)Figure 6.10: Mean consumption expenditure of households by <strong>in</strong>come, EU-27, 2005 (1)(PPS)40 00030 00020 00010 0000AverageFifth <strong>in</strong>comequ<strong>in</strong>tileFourth <strong>in</strong>comequ<strong>in</strong>tileThird <strong>in</strong>comequ<strong>in</strong>tileSecond <strong>in</strong>comequ<strong>in</strong>tileFirst <strong>in</strong>comequ<strong>in</strong>tile(1) Estimates.Source: <strong>Eurostat</strong> (hbs_exp_t133)EUROPE IN FIGURES — <strong>Eurostat</strong> <strong>yearbook</strong> <strong>2009</strong>249
6 Liv<strong>in</strong>g conditions and welfareTable 6.5: Mean consumption expenditure of households by employment status, 2005(PPS)Manualworkers <strong>in</strong><strong>in</strong>dustryand servicesNon-manualworkers <strong>in</strong><strong>in</strong>dustryand servicesInactivepopulation -otherSelfemployedUnemployed RetiredEU-27 25 442 32 263 32 621 17 968 20 120 18 336Euro area 28 055 34 943 36 319 19 833 22 933 19 422Belgium 28 499 36 508 : 16 741 24 012 32 622Bulgaria 8 102 10 205 8 729 5 135 5 051 5 923Czech Republic 13 090 14 359 14 790 : 7 198 :Denmark 26 414 30 050 26 282 : : 20 861Germany 27 655 34 122 41 554 17 943 24 397 15 255Estonia 10 675 16 045 15 378 6 986 6 657 7 241Ireland 39 927 47 206 41 326 25 837 25 316 25 707Greece 31 449 44 510 39 691 23 926 23 375 18 179Spa<strong>in</strong> 26 525 33 942 29 325 20 128 20 644 23 309France 27 287 35 524 35 038 20 078 22 686 17 520Italy 28 766 35 298 36 685 22 135 24 411 21 106Cyprus 33 701 46 544 37 139 32 342 17 600 21 959Latvia 10 589 15 905 13 537 5 735 5 239 6 163Lithuania 10 143 13 874 9 504 5 596 5 638 7 041Luxembourg 47 073 59 758 66 495 35 441 45 674 38 342Hungary 10 942 15 175 15 724 7 440 7 169 8 534Malta 30 198 39 245 34 275 15 156 19 570 :Netherlands 31 269 34 335 41 961 21 112 22 811 22 348Austria 30 627 36 156 39 283 20 025 23 716 27 240Poland 10 271 15 186 12 401 6 504 8 138 7 367Portugal 23 991 23 991 25 448 17 124 14 441 13 255Romania : : : : : :Slovenia 22 820 32 299 32 113 12 570 16 331 20 190Slovakia 11 633 13 924 14 215 6 766 6 741 7 037F<strong>in</strong>land 25 245 33 075 34 285 13 899 16 961 17 550Sweden 25 545 31 083 : 15 233 20 754 15 823United K<strong>in</strong>gdom 30 938 41 664 41 524 21 575 22 148 25 344Croatia 19 742 25 545 18 496 14 578 13 405 10 584Norway : : 29 222 19 214 22 121 30 606Source: <strong>Eurostat</strong> (hbs_exp_t131)250 EUROPE IN FIGURES — <strong>Eurostat</strong> <strong>yearbook</strong> <strong>2009</strong>
Liv<strong>in</strong>g conditions and welfare 6Figure 6.11: Mean consumption expenditure of households by type of household, EU-27, 2005 (1)(PPS)40 00030 00020 00010 0000AverageThree or moreadults <strong>with</strong>dependentchildrenThree or moreadultsTwo adults <strong>with</strong>dependentchildrenTwo adultsS<strong>in</strong>gle parent<strong>with</strong> dependentchildrenS<strong>in</strong>gle person(1) Estimates.Source: <strong>Eurostat</strong> (hbs_exp_t134)Figure 6.12: Mean consumption expenditure of households by number of active persons, EU-27,2005 (1)(PPS)40 00030 00020 00010 0000AverageThree or more activepersonsTwo active persons One active person Zero active persons(1) Estimates.Source: <strong>Eurostat</strong> (hbs_exp_t132)EUROPE IN FIGURES — <strong>Eurostat</strong> <strong>yearbook</strong> <strong>2009</strong>251
6 Liv<strong>in</strong>g conditions and welfare6.3 Hous<strong>in</strong>gIntroductionAs seen <strong>in</strong> the previous subchapter, hous<strong>in</strong>g,water, electricity, gas and other fuelsform the ma<strong>in</strong> expenditure item of householdbudgets <strong>in</strong> the EU. Questions of socialhous<strong>in</strong>g, homelessness or <strong>in</strong>tegrationplay an important role <strong>with</strong><strong>in</strong> the socialpolicy agenda. The Charter of FundamentalRights stipulates <strong>in</strong> Article 34 (3)that ‘<strong>in</strong> order to combat social exclusionand poverty, the Union recognises andrespects the right to social and hous<strong>in</strong>gassistance so as to ensure a decent existencefor all those who lack sufficient resources,<strong>in</strong> accordance <strong>with</strong> Communitylaw and national laws and practices’.However, the EU does not have any responsibilities<strong>in</strong> respect of hous<strong>in</strong>g;rather, national governments have theresponsibility for develop<strong>in</strong>g their ownhous<strong>in</strong>g policies. Many countries facesimilar challenges: for example, how torenew hous<strong>in</strong>g stocks, how to plan andcombat urban sprawl and promote susta<strong>in</strong>abledevelopment, how to help youngand disadvantaged groups to get on thehous<strong>in</strong>g ladder, or how to promote energyefficiency among house-owners. Thesocial and economic cost of the absenceof decent hous<strong>in</strong>g is generally acceptedto compromise the efficiency of a countryor region. Indeed, decent hous<strong>in</strong>g, atan affordable price <strong>in</strong> a safe environmentis likely to alleviate poverty and socialexclusion.Def<strong>in</strong>itions and data availabilityFrom 2005 onwards, EU-SILC covers theEU-25 Member States as well as Norwayand Iceland. Bulgaria, Romania, Turkeyand Switzerland launched EU-SILC<strong>in</strong> 2007. The reference population ofEU-SILC is all private households andtheir current members resid<strong>in</strong>g <strong>in</strong> theterritory of the Member State at the timeof data collection. Persons liv<strong>in</strong>g <strong>in</strong> collectivehouseholds and <strong>in</strong> <strong>in</strong>stitutionsare generally excluded from the targetpopulation.Ma<strong>in</strong> f<strong>in</strong>d<strong>in</strong>gsThe average number of persons liv<strong>in</strong>g<strong>in</strong> a household <strong>in</strong> the EU-27 was 2.4 <strong>in</strong>2007. The highest average <strong>in</strong> 2007 was recordedfor Malta (3.0), the equivalent ofalmost one additional person per householdwhen compared <strong>with</strong> the average<strong>in</strong> Germany (2.1), where the lowest valuewas recorded. Generally speak<strong>in</strong>g, thenorthern Member States tended to reportthe lowest average number of persons perhousehold, while there were higher <strong>figures</strong>among the Mediterranean countriesand those countries which jo<strong>in</strong>ed the EUs<strong>in</strong>ce 2004.252 EUROPE IN FIGURES — <strong>Eurostat</strong> <strong>yearbook</strong> <strong>2009</strong>
Liv<strong>in</strong>g conditions and welfare 6There were wide rang<strong>in</strong>g differencesacross the Member States as regardshous<strong>in</strong>g ownership status <strong>in</strong> 2006: <strong>in</strong> theBaltic Member States, Slovakia, Hungary,Slovenia and Spa<strong>in</strong> more than 80 % ofhouseholds owned their own house/flat,while there was a tendency for lower levelsof ownership (and therefore a higherpropensity to rent) <strong>in</strong> Germany, Austria,the Netherlands and Poland. It is difficultto p<strong>in</strong>po<strong>in</strong>t the reasons for such differences,as the distribution of households maybe related to a range of factors <strong>in</strong>clud<strong>in</strong>gthe degree of urbanisation, the quality ofaccommodation, or the supply of new orrenovated hous<strong>in</strong>g.Figure 6.13: Average number of persons per private household, 2007 (1)(persons)43210EU-27Euro areaMaltaCyprusPolandRomaniaSlovakiaSpa<strong>in</strong>PortugalSloveniaLatviaLithuaniaHungaryBulgariaCzech RepublicGreeceItalyLuxembourgBelgiumEstoniaFranceAustriaUnited K<strong>in</strong>gdomDenmark (2)NetherlandsF<strong>in</strong>landGermanyTurkeyCroatia(1) Ireland and Sweden, not available.(2) 2006.Source: <strong>Eurostat</strong> (lfst_hhantych)Figure 6.14: Tenure status of households, 2006 (1)(%)100%75%50%25%0%EU-25 (2)LithuaniaPolandEstoniaSloveniaHungarySpa<strong>in</strong>SlovakiaCyprusLatviaPortugal (3)Malta (3)ItalyGreeceIrelandCzech RepublicLuxembourgBelgiumF<strong>in</strong>landUnited K<strong>in</strong>gdomSwedenDenmarkFranceNetherlandsAustriaGermanyIceland (3)NorwayTenantOwner(1) Bulgaria and Romania, not available.(2) <strong>Eurostat</strong> estimates based on population-weighted averages of national data.(3) Provisional.Source: <strong>Eurostat</strong> (EU-SILC)EUROPE IN FIGURES — <strong>Eurostat</strong> <strong>yearbook</strong> <strong>2009</strong>253
6 Liv<strong>in</strong>g conditions and welfare6.4 Social protectionIntroductionSocial protection systems are highly developed<strong>in</strong> the EU: they are designed toprotect people aga<strong>in</strong>st the risks associated<strong>with</strong> unemployment, parental responsibilities,ill health and <strong>in</strong>validity, the lossof a spouse or parent, old age, hous<strong>in</strong>gand social exclusion. The organisationand f<strong>in</strong>anc<strong>in</strong>g of social protection systemsis under the responsibility of eachof the Member States. The model used <strong>in</strong>each Member State is therefore somewhatdifferent, while the EU plays a coord<strong>in</strong>at<strong>in</strong>grole to ensure that people who moveacross borders cont<strong>in</strong>ue to receive adequateprotection. This role also promotesactions among the Member States tocombat poverty and social exclusion, andto reform social protection systems onthe basis of policy exchanges and mutuallearn<strong>in</strong>g: this policy is known as the socialprotection and social <strong>in</strong>clusion process.The process underp<strong>in</strong>s the revisedLisbon objectives for 2010, promot<strong>in</strong>g amore <strong>in</strong>clusive <strong>Europe</strong> that, it is argued,will be vital to achieve the EU’s goals ofsusta<strong>in</strong>ed economic growth, more andbetter jobs and greater social cohesion.The social <strong>in</strong>clusion process was established<strong>in</strong> 2000 <strong>with</strong> the aim of eradicat<strong>in</strong>gpoverty by 2010, it has also led to generalconsensus on the follow<strong>in</strong>g challenges:• to eradicate child poverty by break<strong>in</strong>gthe vicious circle of <strong>in</strong>tergenerational<strong>in</strong>heritance;• to make labour markets truly<strong>in</strong>clusive;• to ensure decent hous<strong>in</strong>g foreveryone;• to overcome discrim<strong>in</strong>ation and <strong>in</strong>creasethe <strong>in</strong>tegration of people <strong>with</strong>disabilities, ethnic m<strong>in</strong>orities andimmigrants;• to tackle f<strong>in</strong>ancial exclusion and over<strong>in</strong>debtedness.Def<strong>in</strong>itions and data availabilityData on expenditure and receipts of socialprotection are drawn up accord<strong>in</strong>g to the<strong>Europe</strong>an System of <strong>in</strong>tegrated SocialProtection Statistics (ESSPROS) methodology;this system has been designed toallow a comparison of social protectionflows between Member States. In April2007 a legal basis was established for theprovision of ESSPROS data (<strong>with</strong> data deliverydue to start <strong>in</strong> 2008 <strong>with</strong> referenceto 2006 data); this basis is provided for byRegulation (EC) No 458/2007 of the <strong>Europe</strong>anParliament and of the Council (5) .Social protection encompasses all <strong>in</strong>terventionsfrom public or private bodies<strong>in</strong>tended to relieve households and <strong>in</strong>dividualsof the burden of a def<strong>in</strong>ed set ofrisks or needs, associated <strong>with</strong> old age,sickness and/or healthcare, childbear<strong>in</strong>gand family, disability, unemployment,etc. Expenditure on social protection<strong>in</strong>cludes: social benefits, which consistof transfers, <strong>in</strong> cash or <strong>in</strong> k<strong>in</strong>d, to householdsand <strong>in</strong>dividuals to relieve them ofthe burden of a def<strong>in</strong>ed set of risks orneeds; adm<strong>in</strong>istration costs, which representthe costs charged to the schemefor its management and adm<strong>in</strong>istration;and other expenditure, which consistsof miscellaneous expenditure by socialprotection schemes (payment of property<strong>in</strong>come and other).(5) http://eur-lex.europa.eu/LexUriServ/LexUriServ.do?uri=OJ:L:2007:113:0003:0008:EN:PDF.254 EUROPE IN FIGURES — <strong>Eurostat</strong> <strong>yearbook</strong> <strong>2009</strong>
Liv<strong>in</strong>g conditions and welfare 6Social protection benefits are directtransfers, <strong>in</strong> cash or <strong>in</strong> k<strong>in</strong>d, by socialprotection schemes to households and<strong>in</strong>dividuals to relieve them of the burdenof one or more of the def<strong>in</strong>ed dist<strong>in</strong>ctrisks or needs; benefits via the fiscal systemare excluded. Social benefits are paidto households by social security funds,other government units, NPISHs (nonprofit<strong>in</strong>stitutions serv<strong>in</strong>g households),employers adm<strong>in</strong>ister<strong>in</strong>g unfunded social<strong>in</strong>surance schemes, <strong>in</strong>surance enterprisesor other <strong>in</strong>stitutional units adm<strong>in</strong>ister<strong>in</strong>gprivately funded social <strong>in</strong>suranceschemes. Benefits are classified accord<strong>in</strong>gto eight social protection functions(which represent a set of risks or needs):• sickness/healthcare benefits – <strong>in</strong>clud<strong>in</strong>gpaid sick leave, medical careand provision of pharmaceuticalproducts;• disability benefits – <strong>in</strong>clud<strong>in</strong>g disabilitypensions and the provision ofgoods and services (other than medicalcare) to the disabled;• old age benefits – <strong>in</strong>clud<strong>in</strong>g old agepensions and the provision of goodsand services (other than medical care)to the elderly;• survivors’ benefits – <strong>in</strong>clud<strong>in</strong>g <strong>in</strong>comema<strong>in</strong>tenance and support <strong>in</strong> connection<strong>with</strong> the death of a family member,such as survivors’ pensions;• family/children benefits – <strong>in</strong>clud<strong>in</strong>gsupport (except healthcare) <strong>in</strong> connection<strong>with</strong> the costs of pregnancy,childbirth, childbear<strong>in</strong>g and car<strong>in</strong>gfor other family members;• unemployment benefits – <strong>in</strong>clud<strong>in</strong>gvocational tra<strong>in</strong><strong>in</strong>g f<strong>in</strong>anced by publicagencies;• hous<strong>in</strong>g benefits – <strong>in</strong>clud<strong>in</strong>g <strong>in</strong>terventionsby public authorities to helphouseholds meet the cost of hous<strong>in</strong>g;• social exclusion benefits – <strong>in</strong>clud<strong>in</strong>g<strong>in</strong>come support, rehabilitationof alcohol and drug abusers andother miscellaneous benefits (excepthealthcare).The pensions aggregate comprises partof periodic cash benefits under the disability,old age, survivors and unemploymentfunctions. It is def<strong>in</strong>ed as the sumof the follow<strong>in</strong>g social benefits: disabilitypension, early-retirement benefit due toreduced capacity to work, old age pension,anticipated old age pension, partialpension, survivors’ pension, early-retirementbenefit for labour market reasons.Expenditure on care for the elderly isdef<strong>in</strong>ed as the percentage of social protectionexpenditure devoted to old agecare <strong>in</strong> GDP. These expenditures covercare allowance, accommodation, and assistance<strong>in</strong> carry<strong>in</strong>g out daily tasks. Theaggregate replacement ratio is def<strong>in</strong>ed asthe median <strong>in</strong>dividual gross pensions ofthose aged 65-74 relative to median <strong>in</strong>dividualgross earn<strong>in</strong>gs of those aged 50-59,exclud<strong>in</strong>g other social benefits; it is expressed<strong>in</strong> percentage terms.The units responsible for provid<strong>in</strong>g socialprotection are f<strong>in</strong>anced <strong>in</strong> different ways,their social protection receipts comprisesocial security contributions paid by employersand protected persons, contributionsby general government, and otherreceipts from a variety of sources (forexample, <strong>in</strong>terest, dividends, rent andclaims aga<strong>in</strong>st third parties). Social contributionsby employers are all costs <strong>in</strong>curredby employers to secure entitlementto social benefits for their employees,former employees and their dependants.They can be paid by resident or non-residentemployers. They <strong>in</strong>clude all paymentsby employers to social protectionEUROPE IN FIGURES — <strong>Eurostat</strong> <strong>yearbook</strong> <strong>2009</strong>255
6 Liv<strong>in</strong>g conditions and welfare<strong>in</strong>stitutions (actual contributions) andsocial benefits paid directly by employersto employees (imputed contributions).Social contributions made by protectedpersons comprise contributions paid byemployees, by the self-employed and bypensioners and other persons.Ma<strong>in</strong> f<strong>in</strong>d<strong>in</strong>gsSocial protection expenditure <strong>in</strong> theEU-27 represented 27.2 % of GDP <strong>in</strong>2005. The largest proportion of expenditureon social expenditure was recorded<strong>in</strong> Sweden, <strong>with</strong> slightly less than onethird (32 %) of GDP <strong>in</strong> 2005, closely followedby France (31.5 %). At the otherend of the spectrum, the Baltic MemberStates dedicated the lowest proportion oftheir GDP to social protection (between12.4 % and 13.2 %).The use of a purchas<strong>in</strong>g power standard(PPS) allows an unbiased comparison ofsocial protection expenditure per capitabetween countries, tak<strong>in</strong>g account of differences<strong>in</strong> price levels. The highest levelof expenditure on social protection percapita <strong>in</strong> 2005 was registered for Luxembourg(6) (PPS 12 946 per capita), whileSweden, Denmark, the Netherlands, Austria,Belgium and France all accountedfor between PPS 8 000 and PPS 8 500 percapita. In contrast, average expenditure<strong>in</strong> the Baltic Member States, Bulgariaand Romania was less than PPS 1 800 percapita. These disparities between countriesare partly related to differ<strong>in</strong>g levelsof wealth and also reflect differences <strong>in</strong>social protection systems, demographictrends, unemployment rates and other social,<strong>in</strong>stitutional and economic factors.Old age represented the largest social benefitfunction, account<strong>in</strong>g for a little morethan two fifths (41.4 %) of total socialbenefits <strong>in</strong> the EU-27 <strong>in</strong> 2005, followedby sickness and healthcare (28.6 %). Therelative importance of family/child benefit,disability benefit and unemploymentbenefit was quite similar, account<strong>in</strong>g forbetween 6.1 % and 8.0 % of the total <strong>in</strong>the EU-27, while survivors, hous<strong>in</strong>g andsocial exclusion benefits together accountedfor the rema<strong>in</strong><strong>in</strong>g 7.9 %.In relation to GDP, expenditure on pensionswas equivalent to 12.2 % <strong>with</strong><strong>in</strong>the EU-27 <strong>in</strong> 2005, rang<strong>in</strong>g from a highof 14.8 % <strong>in</strong> Italy to a low of 4.9 % <strong>in</strong> Ireland.Expenditure on care for elderly <strong>in</strong>the EU-27 accounted for some 0.5 % ofGDP <strong>in</strong> the same year, a proportion thatrose to 2.5 % <strong>in</strong> Sweden, but fell to lessthan 0.1 % of GDP <strong>in</strong> Greece, Estonia,Belgium, Bulgaria and Romania. The aggregatereplacement ratio measures thedifference between retirement benefitsfor pensioners (aged 65 to 74 years old)and salaries received by those aged 50 to64. This ratio was highest <strong>in</strong> 2006 <strong>in</strong> Luxembourgand Austria (where pensionersreceived on average 65 % of the salary receivedby those aged 50 to 64). The majorityof the rema<strong>in</strong><strong>in</strong>g Member States were<strong>with</strong><strong>in</strong> the range of 40 % to 60 %, <strong>with</strong>Denmark (37 %), Ireland (35 %) and Cyprus(28 %) below.The ma<strong>in</strong> contributors to EU-27 socialprotection receipts <strong>in</strong> 2005 were employers’social contribution (38.3 %) and generalgovernment contributions (37.6 %);social contributions paid by protectedpersons accounted for a further 20.8 % ofthe total.(6) Luxembourg is a special case <strong>in</strong>sofar as a significant proportion of benefits (primarily expenditure on healthcare,pensions and family benefits) are paid to persons liv<strong>in</strong>g outside the country.256 EUROPE IN FIGURES — <strong>Eurostat</strong> <strong>yearbook</strong> <strong>2009</strong>
Liv<strong>in</strong>g conditions and welfare 6Table 6.6: Total expenditure on social protection(% of GDP)1995 1996 1997 1998 1999 2000 2001 2002 2003 2004 2005EU (1) 27.7 27.9 27.5 27.1 27.0 26.6 26.8 27.1 27.4 27.3 27.2Euro area (2) 27.2 27.6 27.3 26.9 27.0 26.8 26.9 27.4 27.8 27.8 27.8Belgium 27.4 28.0 27.4 27.1 27.0 26.5 27.3 28.0 29.1 29.3 29.7Bulgaria : : : : : : : : : : 16.1Czech Republic 17.5 17.6 18.6 18.5 19.2 19.5 19.5 20.2 20.2 19.3 19.1Denmark 31.9 31.2 30.1 30.0 29.8 28.9 29.2 29.7 30.9 30.9 30.1Germany 28.2 29.3 28.9 28.8 29.2 29.3 29.4 30.0 30.3 29.6 29.4Estonia : : : : : 14.0 13.1 12.7 12.6 13.1 12.5Ireland 14.8 13.9 12.9 12.0 14.6 14.1 15.0 17.3 17.8 18.2 18.2Greece 19.9 20.5 20.8 21.7 22.7 23.5 24.1 23.8 23.6 23.6 24.2Spa<strong>in</strong> 21.6 21.5 20.8 20.2 19.8 20.3 20.0 20.3 20.4 20.6 20.8France 30.3 30.6 30.4 30.1 29.9 29.5 29.6 30.4 30.9 31.3 31.5Italy 24.2 24.3 24.9 24.6 24.8 24.7 24.9 25.3 25.8 26.0 26.4Cyprus : : : : : 14.8 14.9 16.2 18.4 17.8 18.2Latvia : : 15.3 16.1 17.2 15.3 14.3 13.9 13.8 12.9 12.4Lithuania : 13.4 13.8 15.2 16.4 15.8 14.7 14.1 13.6 13.3 13.2Luxembourg 20.7 21.2 21.5 21.2 20.5 19.6 20.9 21.6 22.2 22.3 21.9Hungary : : : : 20.7 19.3 19.3 20.4 21.1 20.7 21.9Malta 15.7 17.1 17.5 17.5 17.3 16.5 17.4 17.5 17.9 18.4 18.3Netherlands 30.6 29.6 28.7 27.8 27.1 26.4 26.5 27.6 28.3 28.3 28.2Austria 28.8 28.7 28.6 28.3 28.7 28.1 28.4 29.0 29.3 29.0 28.8Poland : : : : : 19.7 21.0 21.1 21.0 20.1 19.6Portugal 21.0 20.2 20.3 20.9 21.4 21.7 22.7 23.7 24.1 24.7 :Romania : : : : : 13.2 13.2 13.4 12.6 15.1 14.2Slovenia : 24.1 24.5 24.8 24.8 24.6 24.8 24.8 24.1 23.7 23.4Slovakia 18.4 19.3 19.6 20.0 20.0 19.3 18.9 19.0 18.2 17.3 16.9F<strong>in</strong>land 31.5 31.4 29.1 27.0 26.2 25.1 24.9 25.6 26.5 26.6 26.7Sweden 34.3 33.6 32.7 32.0 31.7 30.7 31.2 32.2 33.2 32.7 32.0United K<strong>in</strong>gdom 28.0 27.8 27.3 26.7 26.2 26.9 27.3 26.2 26.2 26.3 26.8Iceland 18.9 18.7 18.5 18.3 18.8 19.2 19.4 21.2 23.0 22.6 21.7Norway 26.5 25.8 25.1 26.9 26.9 24.4 25.4 26.0 27.2 25.9 23.9Switzerland 25.6 26.4 27.3 27.3 27.3 26.9 27.6 28.5 29.1 29.3 29.2(1) EU-15 for 1995-1999; EU-25 for 2000-2004; EU-27 for 2005.(2) EA-13 <strong>in</strong>stead of EA-15.Source: <strong>Eurostat</strong> (tps00098)EUROPE IN FIGURES — <strong>Eurostat</strong> <strong>yearbook</strong> <strong>2009</strong>257
6 Liv<strong>in</strong>g conditions and welfareFigure 6.15: Total expenditure on social protection per capita, 2005 (1)(PPS)15 00012 0009 0006 0003 0000EU-27Euro area (2)LuxembourgSwedenDenmarkNetherlandsAustriaBelgiumFranceGermanyUnited K<strong>in</strong>gdomF<strong>in</strong>landItalyIrelandGreeceSpa<strong>in</strong>SloveniaPortugalCyprusCzech RepublicHungaryMaltaSlovakiaPolandEstoniaLithuaniaLatviaBulgariaRomaniaNorwaySwitzerlandIceland(1) EU-27, euro area and the United K<strong>in</strong>gdom, estimates; Bulgaria, the Czech Republic, Germany, Spa<strong>in</strong>, France, Italy, Latvia, Lithuania,the Netherlands, Poland, Portugal, Romania, Slovenia, Slovakia and Sweden, provisional; Portugal, 2004.(2) EA-13 <strong>in</strong>stead of EA-15.Source: <strong>Eurostat</strong> (tps00100)Figure 6.16: Social benefits, EU-27, 2005 (1)(%, based on PPS)Survivors4.4%Unemployment6.1%Disability7.9%Family/children8.0%Hous<strong>in</strong>g2.2%Socialexclusion n.e.c.1.3%Old age41.4%Sickness/healthcare28.6%(1) Estimates; <strong>figures</strong> do not sum to 100 % due to round<strong>in</strong>g.Source: <strong>Eurostat</strong> (tps00107)258 EUROPE IN FIGURES — <strong>Eurostat</strong> <strong>yearbook</strong> <strong>2009</strong>
Liv<strong>in</strong>g conditions and welfare 6Figure 6.17: Expenditure on pensions, 2005 (1)(% of GDP)15129630EU-27Euro area (2)ItalyAustriaFranceGermanyPolandNetherlandsSwedenPortugalGreeceBelgiumF<strong>in</strong>landUnited K<strong>in</strong>gdomDenmarkSloveniaHungaryLuxembourgMaltaSpa<strong>in</strong>Czech RepublicBulgariaSlovakiaCyprusLithuaniaLatviaRomaniaEstoniaIrelandSwitzerlandNorwayIceland(1) EU-27, euro area and the United K<strong>in</strong>gdom, estimates; Bulgaria, the Czech Republic, Germany, Spa<strong>in</strong>, France, Italy, Latvia, Lithuania,the Netherlands, Poland, Portugal, Romania, Slovenia, Slovakia and Sweden, provisional; Portugal, 2004.(2) EA-13 <strong>in</strong>stead of EA-15.Source: <strong>Eurostat</strong> (tps00103)Figure 6.18: Expenditure on care for elderly, 2005 (1)(% of GDP)2.52.01.51.00.50.0EU-27SwedenDenmarkUnited K<strong>in</strong>gdomAustriaNetherlandsF<strong>in</strong>landMaltaHungaryGermanyCzech RepublicFranceSpa<strong>in</strong>PolandPortugalIrelandSlovakiaSloveniaLithuaniaLatviaItalyGreeceEstoniaBelgiumBulgariaRomaniaCyprusIcelandNorwaySwitzerland(1) EU-27 and the United K<strong>in</strong>gdom, estimates; Bulgaria, the Czech Republic, Germany, Spa<strong>in</strong>, France, Italy, Cyprus, Latvia, Lithuania, theNetherlands, Poland, Portugal, Romania, Slovenia, Slovakia and Sweden, provisional; Portugal, 2004; Luxembourg, not available.Source: <strong>Eurostat</strong> (tsdde530)EUROPE IN FIGURES — <strong>Eurostat</strong> <strong>yearbook</strong> <strong>2009</strong>259
6 Liv<strong>in</strong>g conditions and welfareFigure 6.19: Aggregate replacement ratio, 2006 (1)(%)1007550250EU-25 (2)LuxembourgAustriaBulgaria (3)SwedenPolandPortugal (4)FranceItalySlovakiaHungaryCzech RepublicEstoniaGreeceLatviaMalta (4)Spa<strong>in</strong>F<strong>in</strong>landGermanyLithuaniaUnited K<strong>in</strong>gdomNetherlandsBelgiumSloveniaDenmarkIrelandCyprusNorwayIceland (4)(1) Romania, not available.(2) <strong>Eurostat</strong> calculation based on population-weighted averages of national data.(3) National HBS.(4) Provisional.Source: <strong>Eurostat</strong> (tsdde310)Figure 6.20: Social protection receipts, EU-27, 2005 (1)(% of total receipts)Social contributions paidby protected persons20.8%Other receipts3.4%Employers' socialcontributions38.3%General governmentcontributions37.6%(1) Estimates; <strong>figures</strong> do not sum to 100 % due to round<strong>in</strong>g.Source: <strong>Eurostat</strong> (tps00108)260 EUROPE IN FIGURES — <strong>Eurostat</strong> <strong>yearbook</strong> <strong>2009</strong>
Liv<strong>in</strong>g conditions and welfare 66.5 Good governanceIntroductionThe term ‘governance’ covers a wide rangeof concepts. Indeed, it is used <strong>in</strong> connection<strong>with</strong> several contemporary socialsciences, especially economics and politicalscience. It orig<strong>in</strong>ates from the needof economics (enterprise governance, for<strong>in</strong>stance) and political science (State governance).The term ‘governance’, <strong>in</strong> bothcorporate and State contexts, embracesaction by executive bodies, assemblies(such as national parliaments) and judicialbodies (national courts and tribunalsfor example).In July 2001, the <strong>Europe</strong>an Commissionadopted a White Paper on <strong>Europe</strong>anGovernance. This White Paper conta<strong>in</strong>eda series of recommendations on how toenhance democracy <strong>in</strong> <strong>Europe</strong> and boostthe legitimacy of its <strong>in</strong>stitutions. It def<strong>in</strong>edgovernance <strong>in</strong> a <strong>Europe</strong>an contextas the rules, processes and behaviourthat affect the way <strong>in</strong> which powers areexercised at <strong>Europe</strong>an level, particularlyas regards openness, participation, accountability,effectiveness and coherence(the five pr<strong>in</strong>ciples of good governance).The White Paper aims to modernise <strong>Europe</strong>anpublic action <strong>in</strong> order to <strong>in</strong>creasethe accountability of <strong>Europe</strong>an executivebodies to the elected assemblies and openup the EU’s decision-mak<strong>in</strong>g proceduresto allow citizens to participate <strong>in</strong> mak<strong>in</strong>gdecisions which concern them. Ultimately,it is hoped that these new formsof governance will br<strong>in</strong>g the EU closer toits citizens, mak<strong>in</strong>g it more effective, re<strong>in</strong>forc<strong>in</strong>gdemocracy and consolidat<strong>in</strong>gthe legitimacy of its <strong>in</strong>stitutions, whileimprov<strong>in</strong>g the quality of <strong>Europe</strong>an legislationand mak<strong>in</strong>g it clearer and moreeffective.Def<strong>in</strong>itions and data availabilityVoter turnout is the percentage of personswho cast a vote or ‘turn out’ at anelection as a share of the total populationentitled to vote. It <strong>in</strong>cludes those who castblank or <strong>in</strong>valid votes. In Belgium, Luxembourgand Greece, vot<strong>in</strong>g is compulsory.In Italy, vot<strong>in</strong>g is a civic obligation(no penalty).The level of citizens’ confidence <strong>in</strong> eachEU <strong>in</strong>stitution (Council of the <strong>Europe</strong>anUnion, <strong>Europe</strong>an Parliament and <strong>Europe</strong>anCommission) is expressed as theshare of positive op<strong>in</strong>ions (people whodeclare that they ‘tend to trust’) abouteach <strong>in</strong>stitution. Trust is not precisely def<strong>in</strong>edand could leave some room for <strong>in</strong>terpretationto the <strong>in</strong>terviewees. The dataare based on a twice-yearly Eurobarometersurvey which has been used, s<strong>in</strong>ce1973, to monitor the evolution of publicop<strong>in</strong>ion <strong>in</strong> the Member States and s<strong>in</strong>ce2004 <strong>in</strong> the candidate countries. The rema<strong>in</strong><strong>in</strong>gcategories, not shown <strong>in</strong> thetable, <strong>in</strong>clude the percentage of negativeop<strong>in</strong>ions (people who declare that they‘tend not to trust’), as well as ‘don’t know’and/or ‘no answer’.EUROPE IN FIGURES — <strong>Eurostat</strong> <strong>yearbook</strong> <strong>2009</strong>261
6 Liv<strong>in</strong>g conditions and welfareMa<strong>in</strong> f<strong>in</strong>d<strong>in</strong>gsVoter turnout at EU parliamentary elections<strong>in</strong> June 2004 ranged from 90.8 % <strong>in</strong>Belgium (where vot<strong>in</strong>g is compulsory) to17.0 % <strong>in</strong> Slovakia. Voter turnout <strong>in</strong> Bulgariaand Romania for their first electionsto the <strong>Europe</strong>an Parliament <strong>in</strong> 2007 wasa little less than 30 %, at the lower endof the range among Member States. Thenext parliamentary elections are plannedfor <strong>2009</strong>.Accord<strong>in</strong>g to the latest survey of publicop<strong>in</strong>ion <strong>in</strong> 2007, somewhat more thanhalf (55 %) of all citizens declared thatthey tended to trust the <strong>Europe</strong>an Parliament,while exactly half (50 %) tendedto trust the <strong>Europe</strong>an Commission. Lessthan half (44 %) of respondents tendedto trust the Council of the <strong>Europe</strong>an Union,the relative proportions <strong>in</strong> Denmark,Italy, Luxembourg and Sweden fall<strong>in</strong>grelatively sharply when compared <strong>with</strong>results from 2000.Figure 6.21: Voter turnout(%)1007550250EU-27MaltaLuxembourgBelgiumCyprusDenmarkSwedenAustriaItalyNetherlandsGermanySpa<strong>in</strong>GreeceIrelandF<strong>in</strong>landCzech RepublicHungaryPortugalSloveniaEstoniaUnited K<strong>in</strong>gdomLatviaFranceRomaniaBulgariaSlovakiaPolandLithuaniaLiechtenste<strong>in</strong>TurkeyIcelandNorwayCroatiaFYR of MacedoniaSwitzerlandNational parliamentary elections (1) EU parliamentary elections, 2004 (2)(1) Latest elections: Spa<strong>in</strong>, Italy, Lithuania, Malta, Austria, Slovenia and the former Yugoslav Republic of Macedonia, 2008; Belgium,Denmark, Estonia, Ireland, Greece, France, Poland, F<strong>in</strong>land, Croatia, Turkey, Iceland and Switzerland, 2007; the Czech Republic,Cyprus, Latvia, Hungary, the Netherlands, Slovakia and Sweden, 2006; Bulgaria, Denmark, Germany, Portugal, the United K<strong>in</strong>gdom,Liechtenste<strong>in</strong> and Norway, 2005; Luxembourg and Romania, 2004; EU-27, average estimated by <strong>Eurostat</strong> on the basis of the trendsobserved <strong>in</strong> each of the Member States for national parliamentary elections.(2) Bulgaria and Romania, 2007; non-EU Member States, not applicable; EU-25 <strong>in</strong>stead of EU-27.Source: <strong>Eurostat</strong> (tsdgo310), International Institute for Democracy and Electoral Assistance262 EUROPE IN FIGURES — <strong>Eurostat</strong> <strong>yearbook</strong> <strong>2009</strong>
Liv<strong>in</strong>g conditions and welfare 6Table 6.7: Level of citizens’ confidence <strong>in</strong> EU <strong>in</strong>stitutions(%)<strong>Europe</strong>anParliament2002 2007 2002 2007 2002 2007EU-27 : 55 : 44 : 50Belgium 69 68 54 56 64 67Bulgaria : 58 : 40 : 46Czech Republic : 61 : 53 : 57Denmark 59 70 55 48 65 61Germany 58 52 41 43 47 46Estonia : 61 : 52 : 57Ireland 71 63 60 50 67 60Greece 61 77 53 68 56 69Spa<strong>in</strong> 64 62 57 49 59 53France 62 58 47 46 58 54Italy 74 53 57 45 65 50Cyprus : 59 : 57 : 57Latvia : 44 : 37 : 39Lithuania : 57 : 47 : 53Luxembourg 75 65 67 52 74 55Hungary : 67 : 54 : 61Malta : 63 : 57 : 60Netherlands 65 61 49 47 60 59Austria 58 51 47 41 51 48Poland : 60 : 55 : 61Portugal 59 63 54 53 58 59Romania : 72 : 53 : 60Slovenia : 63 : 59 : 61Slovakia : 70 : 59 : 62F<strong>in</strong>land 57 53 49 49 55 53Sweden 51 57 46 30 45 49United K<strong>in</strong>gdom 34 25 20 17 31 22Croatia : 40 : 41 : 39FYR of Macedonia : 57 : 52 : 53Turkey : 20 : 17 : 17Source: <strong>Eurostat</strong> (tsdgo510), <strong>Europe</strong>an Commission, Eurobarometer surveyCouncil of the<strong>Europe</strong>an UnionCommission of the<strong>Europe</strong>an CommunitiesEUROPE IN FIGURES — <strong>Eurostat</strong> <strong>yearbook</strong> <strong>2009</strong>263
Labour marketLabour market statistics are at the heart of many EU policies follow<strong>in</strong>g the <strong>in</strong>troductionof an employment chapter <strong>in</strong>to the Amsterdam Treaty <strong>in</strong> 1997. The extraord<strong>in</strong>ary<strong>Europe</strong>an Council of Luxembourg <strong>in</strong> November 1997 endorsed an ambitious <strong>Europe</strong>anemployment strategy (EES) aimed at reduc<strong>in</strong>g unemployment and the gendergap, while promot<strong>in</strong>g susta<strong>in</strong>able <strong>in</strong>creases of employment rates. The Lisbon summit<strong>in</strong> the spr<strong>in</strong>g of 2000 put full employment <strong>with</strong> more and better jobs on the <strong>Europe</strong>anagenda, sett<strong>in</strong>g ambitious EU targets for the year 2010, namely:• 70 % for the total employment rate;• 60 % for the female employment rate.The Stockholm Council <strong>in</strong> the spr<strong>in</strong>g of 2001 subsequently added an employment ratetarget for persons aged between 55 and 64 years to reach 50 % <strong>in</strong> the EU by 2010.In its mid-term review of the EES <strong>in</strong> 2005, the <strong>Europe</strong>an Commission made a set ofnew proposals concern<strong>in</strong>g employment guidel<strong>in</strong>es for the period 2005-08, reflect<strong>in</strong>g aswitch of emphasis <strong>in</strong> favour of growth and employment, <strong>with</strong> the aim of:• attract<strong>in</strong>g and reta<strong>in</strong><strong>in</strong>g more people <strong>in</strong> employment, <strong>in</strong>creas<strong>in</strong>g labour supply andmodernis<strong>in</strong>g social protection systems;• improv<strong>in</strong>g the adaptability of the workforce and the bus<strong>in</strong>ess sector;• <strong>in</strong>creas<strong>in</strong>g <strong>in</strong>vestment <strong>in</strong> human capital through better education and skills.A Council Decision on 7 July 2008 on guidel<strong>in</strong>es for the employment policies of theMember States (1) <strong>in</strong>troduced a follow-on set of <strong>in</strong>tegrated guidel<strong>in</strong>es for the period2008-2010. These are based on three pillars: macroeconomic policies, microeconomicreforms and employment policies. The Decision <strong>in</strong>troduces a range of guidel<strong>in</strong>es andbenchmarks designed to set priorities for the Member States employment policies,such that these reflect the revised Lisbon strategy and take account of common socialobjectives, <strong>in</strong>clud<strong>in</strong>g the goals of full employment, improv<strong>in</strong>g quality and productivityat work and strengthen<strong>in</strong>g economic, social and territorial cohesion.(1) http://register.consilium.europa.eu/pdf/en/08/st10/st10614-re02.en08.pdf.EUROPE IN FIGURES — <strong>Eurostat</strong> <strong>yearbook</strong> <strong>2009</strong>265
7 Labour market7.1 People <strong>in</strong> the labour market– employmentIntroductionEU citizens have the right to work <strong>in</strong> anyMember State <strong>with</strong>out the need for workpermits. Although some temporary restrictionsapply for workers from countriesthat jo<strong>in</strong>ed the EU s<strong>in</strong>ce 2004, thisfreedom of movement is designed to helpcreate a s<strong>in</strong>gle market for jobs and couldpotentially provide a boost to the economywhile help<strong>in</strong>g thousands of peopleto achieve their career and lifestyleaspirations.All EU citizens that move to work <strong>in</strong> anotherMember State must be treated <strong>in</strong>the same way as nationals <strong>in</strong> terms of employmentrights that cover work-relatedissues like pay and dismissal. It is alsopossible for job hunters to get their unemploymentbenefits paid <strong>in</strong> another EUcountry for a period of time while theytry to secure employment.Flexible work<strong>in</strong>g conditions – for example,part-time work or work from home– are thought to stimulate employmentand activity rates, by encourag<strong>in</strong>g morepersons <strong>in</strong>to the labour force. Other <strong>in</strong>itiativesthat may encourage a higher proportionof persons <strong>in</strong>to the labour market<strong>in</strong>clude improvements <strong>in</strong> the availabilityof childcare facilities, or provid<strong>in</strong>g opportunitiesfor lifelong learn<strong>in</strong>g. Nevertheless,job mobility <strong>with</strong><strong>in</strong> the EU rema<strong>in</strong>srelatively low, as just 2 % of the work<strong>in</strong>gage population of the EU currently livesand works <strong>in</strong> another Member State.Central to this theme is the issue of ‘flexicurity’:policies that simultaneously addressthe flexibility of labour markets,work organisation and labour relations,while also tak<strong>in</strong>g <strong>in</strong>to account the reconciliationof work and private life, employmentsecurity and social protection. It isoften argued that if <strong>in</strong>dividuals and couplesare unable to achieve their desiredwork/family life balance, not only is theirwelfare lower but economic developmentis also curtailed through a reduction <strong>in</strong>the supply of labour. In this way, flexiblework<strong>in</strong>g arrangements can be viewedas encourag<strong>in</strong>g more people <strong>in</strong>to work,while liberat<strong>in</strong>g <strong>in</strong>dividuals to makefamily choices such as whether to try tohave a family or spend more time <strong>with</strong>children. In contrast, an <strong>in</strong>flexible labourmarket can be seen as one reason beh<strong>in</strong>da reduction <strong>in</strong> birth rates, which has clearrepercussions for future labour supply, aswell as the knock-on effects regard<strong>in</strong>g thef<strong>in</strong>ancial susta<strong>in</strong>ability of social protectionsystems.Def<strong>in</strong>itions and data availabilityGiven the considerable <strong>in</strong>terest <strong>in</strong> labourmarket policies post-Lisbon, the <strong>Europe</strong>anLabour Force Survey (LFS) has grown<strong>in</strong> importance and has become a key toolfor observ<strong>in</strong>g labour market developments.The LFS is a quarterly householdsample survey carried out <strong>in</strong> the MemberStates of the <strong>Europe</strong>an Union, candidatecountries and EFTA countries (except266 EUROPE IN FIGURES — <strong>Eurostat</strong> <strong>yearbook</strong> <strong>2009</strong>
Labour market 7Liechtenste<strong>in</strong>). It is the ma<strong>in</strong> source of<strong>in</strong>formation concern<strong>in</strong>g the situationand trends <strong>with</strong><strong>in</strong> the labour market ofthe EU. The LFS primarily reports on theEU’s population of work<strong>in</strong>g age (15 yearsand more) which is composed of persons<strong>in</strong> employment, unemployed personsand economically <strong>in</strong>active persons. Itprovides comprehensive <strong>in</strong>formation onthese three categories, describ<strong>in</strong>g the employmentsituation of employed personsby report<strong>in</strong>g on, for example, their educationlevel, the branches <strong>in</strong> which theywork, their occupations, as well as theirpropensity to engage <strong>in</strong> part-time work,the duration of their work contracts,and their search for new jobs. Note thatcoverage <strong>in</strong> terms of labour force statusis restricted to those aged 16 and over <strong>in</strong>Spa<strong>in</strong> and the United K<strong>in</strong>gdom. In Denmark,Estonia, Latvia, Hungary, F<strong>in</strong>land,Sweden (from 2001 onwards) and Norway,the coverage relates to those aged 15to 74, while <strong>in</strong> Sweden (prior to 2001) andIceland, coverage refers to those aged 16to 74. The sample size amounts approximatelyto 1.5 million <strong>in</strong>dividuals eachquarter, <strong>with</strong> quarterly sampl<strong>in</strong>g rates ofbetween 0.2 % and 3.3 % <strong>in</strong> each country.Dur<strong>in</strong>g the period from 1998 to 2005, thesurvey underwent a transition towardsa cont<strong>in</strong>uous quarterly survey. All EUMember States now provide quarterlyresults.The economically active population(labour force) comprises employed andunemployed persons. Employment/activityrates represent employed/activepersons as a percentage of same age totalpopulation.Employed persons are def<strong>in</strong>ed as personsaged 15 and over who dur<strong>in</strong>g the referenceweek performed some work, evenfor just one hour per week, for pay, profitor family ga<strong>in</strong> or were not at work but hada job or bus<strong>in</strong>ess from which they weretemporarily absent because of, for example,illness, holidays, <strong>in</strong>dustrial disputeand education or tra<strong>in</strong><strong>in</strong>g. Self-employedpersons work <strong>in</strong> their own bus<strong>in</strong>ess, farmor professional practice. A self-employedperson is considered to be work<strong>in</strong>g ifshe/he meets one of the follow<strong>in</strong>g criteria:works for the purpose of earn<strong>in</strong>gprofit; spends time on the operation of abus<strong>in</strong>ess, or; is <strong>in</strong> the process of sett<strong>in</strong>gupa bus<strong>in</strong>ess. Employees are def<strong>in</strong>ed aspersons who work for a public or privateemployer and who receive compensation<strong>in</strong> the form of wages, salaries, paymentby results or payment <strong>in</strong> k<strong>in</strong>d; non-conscriptmembers of the armed forces arealso <strong>in</strong>cluded.Annual employment growth gives thechange <strong>in</strong> percentage terms from oneyear to another of the total number ofemployed persons on the economic territoryof the country or the geographicalarea.A full-time/part-time dist<strong>in</strong>ction <strong>in</strong> thema<strong>in</strong> job is declared by the respondent,except <strong>in</strong> Germany, Ireland and theNetherlands, where thresholds for usualhours worked are used.The <strong>in</strong>dicator for employed persons <strong>with</strong>a second job refers to persons <strong>with</strong> morethan one job at the same time. Personshav<strong>in</strong>g changed job dur<strong>in</strong>g the referenceweek are not counted as hav<strong>in</strong>g two jobs.EUROPE IN FIGURES — <strong>Eurostat</strong> <strong>yearbook</strong> <strong>2009</strong>267
7 Labour marketA job is considered as temporary if employerand employee agree that its endis determ<strong>in</strong>ed by objective conditions,such as a specific date, the completion ofan assignment or return of the employeewho was temporarily replaced. Typicalcases <strong>in</strong>clude: persons <strong>with</strong> seasonal employment;persons engaged by an agencyor employment exchange and hired to athird party to perform a specific task (unlessthere is a written work contract ofunlimited duration); persons <strong>with</strong> specifictra<strong>in</strong><strong>in</strong>g contracts.The dispersion of regional (NUTS level2) employment rates shows regionaldifferences <strong>in</strong> employment <strong>with</strong><strong>in</strong> countriesand groups of countries (EU-27, euroarea). It is zero when the employmentrates <strong>in</strong> all regions are identical, and willrise if there is an <strong>in</strong>crease <strong>in</strong> the differencesbetween employment rates amongregions. The <strong>in</strong>dicator is not applicablefor several countries as these compriseonly one or a handful of NUTS level 2 regions.However, the employment rates ofthese countries are used to compute the<strong>in</strong>dicator at a <strong>Europe</strong>an level.Ma<strong>in</strong> f<strong>in</strong>d<strong>in</strong>gsThe employment rate among the EU-27’spopulation aged between 15 and 64 yearsold was 65.4 % <strong>in</strong> 2007. Although thisrepresented a further rise <strong>in</strong> the employmentrate s<strong>in</strong>ce the relative low of 60.7 %recorded <strong>in</strong> 1997, it rema<strong>in</strong>s below thetarget of 70 % that the Lisbon <strong>Europe</strong>anCouncil set for 2010. Employment ratesabove 70 % were achieved <strong>in</strong> seven of theMember States (Denmark, the Netherlands,Sweden, Austria, the United K<strong>in</strong>gdom,Cyprus and F<strong>in</strong>land). In contrast,employment rates below 60 % were recorded<strong>in</strong> Romania, Italy, Hungary, Polandand Malta.Employment rates <strong>with</strong><strong>in</strong> the MemberStates often varied considerably accord<strong>in</strong>gto regional patterns, <strong>with</strong> a relativelyhigh dispersion (16.3 %) observed acrossItaly (as measured by the coefficient ofvariation for regions at NUTS 2 level).In contrast, there was relatively little divergence<strong>in</strong> employment rates across theregions of Austria, Greece, Portugal orSweden (all below 4 %). The dispersion ofregional employment across the whole ofthe EU-27 was seen to be converg<strong>in</strong>g, asthe coefficient of variation decl<strong>in</strong>ed from13.2 % to 11.1 % between 2002 and 2007.The Lisbon <strong>Europe</strong>an Council of 2000set a target employment rate for womenof 60 % across the EU. In 2007, the employmentrate for women was 58.3 % <strong>in</strong>the EU-27, a significantly higher rate thanthat recorded <strong>in</strong> 2001 (54.3 %), althoughconsiderably lower than the correspond<strong>in</strong>grate for men (72.5 %). Some 15 of theMember States recorded employmentrates for women above the target of 60 %<strong>in</strong> 2007, <strong>with</strong> the rates <strong>in</strong> Denmark andSweden exceed<strong>in</strong>g 70 %.The Stockholm <strong>Europe</strong>an Council of2001 set a target employment rate forolder workers (aged between 55 and 64years) of 50 % by 2010. The employmentrate for older workers across the EU-27was 44.7 % <strong>in</strong> 2007, much higher thanthe correspond<strong>in</strong>g rate (37.7 %) recorded<strong>in</strong> 2001. The employment rate for olderworkers was higher than 50 % <strong>in</strong> 12 of theMember States, <strong>with</strong> the highest rates recorded<strong>in</strong> Sweden (70.0 %); note there isno official retirement age <strong>in</strong> this country.There were considerable differences betweenemployment rates, accord<strong>in</strong>g tothe level of educational atta<strong>in</strong>ment. Theemployment rate of those aged 25 to 64 (2)who had completed tertiary education(2) For statistics on education level atta<strong>in</strong>ment, the age group 25 to 64 is used <strong>in</strong>stead of 15 to 64.268 EUROPE IN FIGURES — <strong>Eurostat</strong> <strong>yearbook</strong> <strong>2009</strong>
Labour market 7was 85.3 % across the EU-27 <strong>in</strong> 2007,much higher than the rate (57.2 %) forthose who had only atta<strong>in</strong>ed a low educationallevel (primary or lower secondaryeducation).The proportion of the workforce work<strong>in</strong>gpart-time <strong>in</strong> the EU-27 <strong>in</strong>creased steadilyfrom 15.9 % <strong>in</strong> 1997 to 18.2 % by 2007.The highest proportion of people work<strong>in</strong>gpart-time was found <strong>in</strong> the Netherlands(46.8 % <strong>in</strong> 2007), followed by Germany,the United K<strong>in</strong>gdom, Sweden and Denmark,where part-time work accounted<strong>in</strong> each case for about a quarter of those<strong>in</strong> employment. In contrast, part-timeemployment was relatively uncommon <strong>in</strong>Bulgaria (1.7 % of those <strong>in</strong> employment),Slovakia (2.6 %) and Hungary (4.1 %). Alittle less than one third (31.2 %) of thewomen employed <strong>in</strong> the EU-27 did so ona part-time basis <strong>in</strong> 2007, a much higherproportion than the correspond<strong>in</strong>g share(7.7 %) for men. Three quarters (75.0 %) ofall women employed <strong>in</strong> the Netherlandsworked on a part-time basis <strong>in</strong> 2007, byfar the highest rate among the MemberStates (3) .Slightly less than one third (31.7 %) ofemployees <strong>in</strong> Spa<strong>in</strong> were employed on atemporary basis <strong>in</strong> 2007, and this sharewas more than a quarter (28.2 %) of employees<strong>in</strong> Poland. There was a considerablerange <strong>in</strong> the propensity to use limitedduration contracts between MemberStates that may, at least to some degree,reflect national practices, the supplyand demand of labour and the ease <strong>with</strong>which employers can hire or fire. Amongthe rema<strong>in</strong><strong>in</strong>g Member States, the proportionof employees work<strong>in</strong>g on a contractof limited duration ranged from22.4 % <strong>in</strong> Portugal down to just 1.6 % <strong>in</strong>Romania.(3) Anyone work<strong>in</strong>g fewer than 35 hours a week is considered as work<strong>in</strong>g part-time <strong>in</strong> the Netherlands.Figure 7.1: Employment rate, 2007(%)1007550250EU-27Euro areaDenmarkNetherlandsSwedenAustriaUnited K<strong>in</strong>gdomCyprusF<strong>in</strong>landGermanyEstoniaIrelandLatviaPortugalSloveniaCzech RepublicSpa<strong>in</strong>LithuaniaFranceLuxembourgBelgiumBulgariaGreeceSlovakiaRomaniaItalyHungaryPolandMaltaIceland (1)SwitzerlandNorwayUnited StatesJapanCroatiaTurkey(1) Provisional.Source: <strong>Eurostat</strong> (tsiem010)EUROPE IN FIGURES — <strong>Eurostat</strong> <strong>yearbook</strong> <strong>2009</strong>269
7 Labour marketTable 7.1: Employment rate(%)1997 1998 1999 2000 2001 2002 2003 2004 2005 2006 2007EU-27 60.7 61.2 61.8 62.2 62.5 62.3 62.6 62.9 63.5 64.5 65.4Euro area 58.5 59.2 60.4 61.5 62.2 62.4 62.7 63.2 63.8 64.8 65.7Belgium 56.8 57.4 59.3 60.5 59.9 59.9 59.6 60.3 61.1 61.0 62.0Bulgaria : : : 50.4 49.7 50.6 52.5 54.2 55.8 58.6 61.7Czech Republic : 67.3 65.6 65.0 65.0 65.4 64.7 64.2 64.8 65.3 66.1Denmark 74.9 75.1 76.0 76.3 76.2 75.9 75.1 75.7 75.9 77.4 77.1Germany (1) 63.7 63.9 65.2 65.6 65.8 65.4 65.0 65.0 66.0 67.5 69.4Estonia : 64.6 61.5 60.4 61.0 62.0 62.9 63.0 64.4 68.1 69.4Ireland 57.6 60.6 63.3 65.2 65.8 65.5 65.5 66.3 67.6 68.6 69.1Greece 55.1 56.0 55.9 56.5 56.3 57.5 58.7 59.4 60.1 61.0 61.4Spa<strong>in</strong> (1) 49.5 51.3 53.8 56.3 57.8 58.5 59.8 61.1 63.3 64.8 65.6France 59.6 60.2 60.9 62.1 62.8 63.0 64.0 63.7 63.9 63.8 64.6Italy (2) 51.3 51.9 52.7 53.7 54.8 55.5 56.1 57.6 57.6 58.4 58.7Cyprus : : : 65.7 67.8 68.6 69.2 68.9 68.5 69.6 71.0Latvia : 59.9 58.8 57.5 58.6 60.4 61.8 62.3 63.3 66.3 68.3Lithuania : 62.3 61.7 59.1 57.5 59.9 61.1 61.2 62.6 63.6 64.9Luxembourg 59.9 60.5 61.7 62.7 63.1 63.4 62.2 62.5 63.6 63.6 64.2Hungary 52.4 53.7 55.6 56.3 56.2 56.2 57.0 56.8 56.9 57.3 57.3Malta : : : 54.2 54.3 54.4 54.2 54.0 53.9 54.8 55.7Netherlands 68.5 70.2 71.7 72.9 74.1 74.4 73.6 73.1 73.2 74.3 76.0Austria (2) 67.8 67.9 68.6 68.5 68.5 68.7 68.9 67.8 68.6 70.2 71.4Poland 58.9 59.0 57.6 55.0 53.4 51.5 51.2 51.7 52.8 54.5 57.0Portugal (3) 65.7 66.8 67.4 68.4 69.0 68.8 68.1 67.8 67.5 67.9 67.8Romania (4) 65.4 64.2 63.2 63.0 62.4 57.6 57.6 57.7 57.6 58.8 58.8Slovenia 62.6 62.9 62.2 62.8 63.8 63.4 62.6 65.3 66.0 66.6 67.8Slovakia : 60.6 58.1 56.8 56.8 56.8 57.7 57.0 57.7 59.4 60.7F<strong>in</strong>land 63.3 64.6 66.4 67.2 68.1 68.1 67.7 67.6 68.4 69.3 70.3Sweden (1) 69.5 70.3 71.7 73.0 74.0 73.6 72.9 72.1 72.5 73.1 74.2United K<strong>in</strong>gdom (5) 69.9 70.5 71.0 71.2 71.4 71.3 71.5 71.6 71.7 71.5 71.3Croatia : : : : : 53.4 53.4 54.7 55.0 55.6 57.1Turkey : : : 48.8 47.8 46.9 45.8 46.1 46.0 45.9 45.8Iceland : : : : : : 83.3 82.3 83.8 84.6 85.1Norway : : : 77.5 77.2 76.8 75.5 75.1 74.8 75.4 76.8Switzerland 76.9 78.0 78.4 78.3 79.1 78.9 77.9 77.4 77.2 77.9 78.6Japan 70.0 69.5 68.8 68.8 68.7 68.2 68.3 68.6 69.2 69.9 70.6United States 73.5 73.8 73.9 74.0 73.1 71.9 71.2 71.2 71.5 71.9 71.7(1) Break <strong>in</strong> series, 2005.(2) Break <strong>in</strong> series, 2004.(3) Break <strong>in</strong> series, 1998.(4) Break <strong>in</strong> series, 2002.(5) Break <strong>in</strong> series, 2000.Source: <strong>Eurostat</strong> (tsiem010)270 EUROPE IN FIGURES — <strong>Eurostat</strong> <strong>yearbook</strong> <strong>2009</strong>
Labour market 7Figure 7.2: Dispersion of regional employment rates (1)(coefficient of variation of employment rates (of the age group 15-64) across regions (NUTS 2 level))20151050EU-27Euro area (2)ItalyHungarySpa<strong>in</strong>BelgiumSlovakiaFranceBulgaria (3)F<strong>in</strong>landUnited K<strong>in</strong>gdomPolandGermanyCzech RepublicRomaniaGreecePortugalSwedenAustriaNetherlandsNorway2002 2007(1) At the NUTS 2 level: Denmark, Estonia, Cyprus, Latvia, Lithuania, Luxembourg, Malta, Slovenia and Iceland are treated as one region;Ireland has two regions.(2) EA-13 <strong>in</strong>stead of EA-15.(3) 2003 <strong>in</strong>stead of 2002.Source: <strong>Eurostat</strong> (tsisc050)Figure 7.3: Employment rate by gender, 2007 (1)(%)1007550250EU-27Euro areaDenmarkNetherlandsSwedenAustriaUnited K<strong>in</strong>gdomCyprusF<strong>in</strong>landEstoniaGermanyIrelandLatviaPortugalSloveniaCzech RepublicSpa<strong>in</strong>LithuaniaFranceLuxembourgBelgiumBulgariaGreeceSlovakiaRomaniaItalyHungaryPolandMaltaIceland (2)SwitzerlandNorwayUnited StatesJapanCroatiaTurkeyMaleFemale(1) The figure is ranked on the average of male and female.(2) Provisional.Source: <strong>Eurostat</strong> (tsiem010)EUROPE IN FIGURES — <strong>Eurostat</strong> <strong>yearbook</strong> <strong>2009</strong>271
7 Labour marketTable 7.2: Employment rates for selected population groups(%)Male Female Older workers2002 2007 2002 2007 2002 2007EU-27 70.3 72.5 54.4 58.3 38.5 44.7Euro area 71.7 73.4 53.1 58.0 36.4 43.3Belgium 68.3 68.7 51.4 55.3 26.6 34.4Bulgaria 53.7 66.0 47.5 57.6 27.0 42.6Czech Republic 73.9 74.8 57.0 57.3 40.8 46.0Denmark 80.0 81.0 71.7 73.2 57.9 58.6Germany 71.8 74.7 58.9 64.0 38.9 51.5Estonia 66.5 73.2 57.9 65.9 51.6 60.0Ireland 75.4 77.4 55.4 60.6 48.0 53.8Greece 72.2 74.9 42.9 47.9 39.2 42.4Spa<strong>in</strong> 72.6 76.2 44.4 54.7 39.6 44.6France 69.5 69.3 56.7 60.0 34.7 38.3Italy 69.1 70.7 42.0 46.6 28.9 33.8Cyprus 78.9 80.0 59.1 62.4 49.4 55.9Latvia 64.3 72.5 56.8 64.4 41.7 57.7Lithuania 62.7 67.9 57.2 62.2 41.6 53.4Luxembourg 75.1 72.3 51.6 56.1 28.1 32.0Hungary 62.9 64.0 49.8 50.9 25.6 33.1Malta 74.7 74.2 33.9 36.9 30.1 28.3Netherlands 82.4 82.2 66.2 69.6 42.3 50.9Austria 76.4 78.4 61.3 64.4 29.1 38.6Poland 56.9 63.6 46.2 50.6 26.1 29.7Portugal 76.5 73.8 61.4 61.9 51.4 50.9Romania 63.6 64.8 51.8 52.8 37.3 41.4Slovenia 68.2 72.7 58.6 62.6 24.5 33.5Slovakia 62.4 68.4 51.4 53.0 22.8 35.6F<strong>in</strong>land 70.0 72.1 66.2 68.5 47.8 55.0Sweden 74.9 76.5 72.2 71.8 68.0 70.0United K<strong>in</strong>gdom 77.6 77.3 65.2 65.5 53.4 57.4Croatia 60.5 64.4 46.7 50.0 24.8 35.8Turkey 66.9 68.0 27.0 23.8 35.7 29.5Iceland : 89.1 : 80.8 : 84.7Norway 79.9 79.5 73.7 74.0 66.2 69.0Switzerland 86.2 85.6 71.5 71.6 64.6 67.2Japan 79.8 81.7 56.5 59.4 61.6 66.1United States 77.9 77.7 66.0 65.9 59.4 61.8Source: <strong>Eurostat</strong> (tsiem010 and tsiem020)272 EUROPE IN FIGURES — <strong>Eurostat</strong> <strong>yearbook</strong> <strong>2009</strong>
Labour market 7Table 7.3: Total employment rate, by highest level of education, 2007(% of age group 25-64 years)Pre-primary, primary &lower secondary -ISCED levels 0-2Upper secondary & postsecondarynon-tertiary -ISCED levels 3-4Tertiary -ISCED levels 5-6EU-27 57.2 74.6 85.3Belgium 49.8 74.2 84.9Bulgaria 44.5 75.7 85.1Czech Republic 45.7 76.1 85.2Denmark 66.6 82.5 87.8Germany 54.9 74.9 86.1Estonia 56.7 79.4 87.4Ireland 58.7 77.1 86.7Greece 59.9 69.5 83.0Spa<strong>in</strong> 60.6 76.3 84.4France 58.0 75.8 83.5Italy 52.8 74.5 80.2Cyprus 66.1 79.3 87.6Latvia 59.7 77.7 87.3Lithuania 49.1 75.8 89.4Luxembourg 62.3 73.9 84.5Hungary 38.5 70.2 80.4Malta 47.1 81.4 86.6Netherlands 61.9 80.3 87.7Austria 57.9 76.9 86.8Poland 41.0 65.2 84.5Portugal 71.6 79.8 85.9Romania 53.8 70.1 86.9Slovenia 56.2 75.1 87.7Slovakia 29.1 73.2 84.2F<strong>in</strong>land 58.6 76.2 85.2Sweden 66.6 83.1 88.5United K<strong>in</strong>gdom 64.3 81.2 88.0Croatia 44.6 67.8 82.2Turkey 45.3 62.3 75.6Iceland 84.1 88.6 92.2Norway 65.8 83.2 90.5Switzerland 66.3 81.4 90.1Source: <strong>Eurostat</strong> (tsdec430)EUROPE IN FIGURES — <strong>Eurostat</strong> <strong>yearbook</strong> <strong>2009</strong>273
7 Labour marketFigure 7.4: Employment rate by age group, 2007(%)1007550250EU-27Euro areaBelgiumBulgariaCzech RepublicDenmarkGermanyEstoniaIrelandGreeceSpa<strong>in</strong>FranceItalyCyprusLatviaLithuaniaLuxembourgHungaryMaltaNetherlandsAustriaPolandPortugalRomaniaSloveniaSlovakiaF<strong>in</strong>landSwedenUnited K<strong>in</strong>gdomCroatiaTurkeyIceland (1)NorwaySwitzerlandPersons aged 15-24 years Persons aged 25-54 years Persons aged 55-64 years(1) Provisional.Source: <strong>Eurostat</strong> (lfsi_emp_a)Figure 7.5: Annual employment growth(% change compared <strong>with</strong> previous year)3210-11997 1998 1999 2000 2001 2002 2003 2004 2005 2006 2007EU-27United States (1)(1) Estimate, 2007.Source: <strong>Eurostat</strong> (tsieb050)274 EUROPE IN FIGURES — <strong>Eurostat</strong> <strong>yearbook</strong> <strong>2009</strong>
Labour market 7Table 7.4: Annual employment growth(% change compared <strong>with</strong> previous year)1997 1998 1999 2000 2001 2002 2003 2004 2005 2006 2007EU-27 0.9 1.5 1.1 1.7 1.0 0.4 0.4 0.6 1.0 1.6 1.8Euro area 0.9 1.9 1.9 2.4 1.5 0.7 0.5 0.7 1.0 1.6 1.8Belgium 0.5 1.6 1.3 2.0 1.4 -0.1 0.0 0.7 1.2 1.2 1.7Bulgaria -3.9 -0.2 -2.1 4.9 -0.8 0.2 3.0 2.6 2.7 3.3 2.8Czech Republic 0.2 -1.5 -3.4 -0.2 0.5 0.6 -1.3 0.3 1.0 1.6 1.8Denmark 1.4 1.4 0.8 0.5 0.9 0.0 -1.1 -0.6 0.9 1.6 1.6Germany -0.1 1.2 1.4 1.9 0.4 -0.6 -0.9 0.4 -0.1 0.6 1.7Estonia 0.0 -1.9 -4.4 -1.5 0.9 1.3 1.4 0.0 2.0 5.4 0.7Ireland 5.6 8.6 6.2 4.6 3.0 1.8 2.0 3.1 4.7 4.3 3.6Greece -0.5 2.9 0.3 0.5 0.2 2.0 1.9 0.9 1.5 2.5 1.2Spa<strong>in</strong> 3.6 4.5 4.6 5.1 3.2 2.4 3.1 3.5 4.1 3.7 3.1France 0.4 1.5 2.0 2.7 1.8 0.6 0.1 0.1 0.6 1.0 1.3Italy 0.3 1.0 1.1 1.9 2.0 1.7 1.5 0.4 0.5 2.0 1.1Cyprus 0.6 1.6 1.9 1.7 2.2 2.1 3.8 3.8 3.6 1.8 3.2Latvia 4.4 -0.3 -1.8 -2.9 2.2 2.3 1.0 1.1 1.5 4.8 3.5Lithuania 0.6 -0.8 -2.2 -4.0 -3.8 3.6 2.2 0.0 2.5 1.7 2.9Luxembourg 3.1 4.5 5.0 5.5 5.6 3.2 1.8 2.2 2.9 3.7 4.2Hungary 0.2 1.8 3.4 1.3 0.3 0.0 1.3 -0.7 0.0 0.7 -0.1Malta : : : 8.4 1.8 0.6 1.0 -0.6 1.3 1.3 2.6Netherlands 3.1 2.6 2.6 2.2 2.1 0.5 -0.5 -0.9 0.5 1.8 2.4Austria 0.9 1.3 1.6 1.0 0.6 -0.1 0.0 0.2 0.8 1.2 2.2Poland (1) 2.6 1.3 -0.9 -2.4 -3.2 -1.9 -12.5 -0.3 1.0 1.9 4.5Portugal 2.6 2.8 1.4 2.1 1.8 0.6 -0.6 -0.1 -0.3 0.5 0.0Romania : : : : : : 0.0 -1.7 -1.5 2.8 1.3Slovenia -1.9 -0.2 1.4 1.9 0.5 1.5 -0.4 0.3 0.2 1.2 2.7Slovakia -1.0 -0.5 -2.5 -2.0 0.6 0.1 1.1 -0.2 1.4 2.3 2.1F<strong>in</strong>land 3.3 2.0 2.5 2.2 1.5 1.0 0.1 0.4 1.4 1.8 2.2Sweden -1.3 1.7 2.1 2.5 2.1 0.0 -0.6 -0.7 0.3 1.7 2.3United K<strong>in</strong>gdom 1.7 0.9 1.2 1.4 1.0 0.6 1.0 1.0 1.3 0.7 0.7Croatia 3.2 -3.0 -3.3 4.0 -5.4 4.2 0.6 1.7 0.8 0.8 2.0Turkey -2.5 2.8 2.1 -0.4 -1.0 -1.8 -1.0 3.0 1.4 1.3 1.1Norway 2.9 2.7 0.9 0.6 0.4 0.4 -1.0 0.5 1.2 3.4 4.0United States 2.2 1.4 1.5 2.5 0.0 -0.3 0.9 1.1 1.7 1.9 1.1(1) 2003, break <strong>in</strong> series.Source: <strong>Eurostat</strong> (tsieb050)EUROPE IN FIGURES — <strong>Eurostat</strong> <strong>yearbook</strong> <strong>2009</strong>275
7 Labour marketTable 7.5: Persons work<strong>in</strong>g part-time and persons <strong>with</strong> a second job(% of total employment)Persons employed work<strong>in</strong>g part-time Persons <strong>in</strong> employment <strong>with</strong> second job1997 (1) 2002 2007 (2) 1997 (3) 2002 2007 (4)EU-27 15.9 16.2 18.2 : 3.6 3.9Euro area 14.7 16.3 19.6 : 2.8 3.4Belgium 15.2 19.1 22.1 2.7 3.4 3.9Bulgaria : 2.5 1.7 : 0.8 0.8Czech Republic 5.7 4.9 5.0 3.9 2.4 1.7Denmark 22.5 20.0 24.1 7.3 10.6 9.9Germany (5) 17.6 20.8 26.0 2.6 2.2 3.8Estonia 8.6 7.7 8.2 9.2 4.4 3.6Ireland 13.6 16.5 16.8 2.1 2.0 2.7Greece 4.8 4.4 5.6 3.8 3.2 3.2Spa<strong>in</strong> (6) 7.9 8.0 11.8 1.6 1.7 2.6France 17.0 16.4 17.2 3.3 3.4 3.1Italy (7) 6.8 8.6 13.6 1.5 1.3 1.8Cyprus : 7.2 7.3 : 5.0 4.4Latvia 12.8 9.7 6.4 5.1 7.1 6.2Lithuania : 10.8 8.6 6.1 6.7 6.1Luxembourg 8.2 10.7 17.8 1.2 1.1 2.0Hungary 3.7 3.6 4.1 2.1 1.7 1.6Malta : 8.3 11.1 : 4.7 5.3Netherlands 37.9 43.9 46.8 5.4 5.9 7.2Austria (7) 14.7 19.0 22.6 4.1 3.7 4.3Poland 10.6 10.8 9.2 9.5 8.2 7.7Portugal (8) 10.6 11.2 12.1 6.5 6.8 6.7Romania (9) 14.9 11.8 9.7 8.3 4.6 3.9Slovenia : 6.1 9.3 2.6 2.2 3.8Slovakia 2.3 1.9 2.6 1.1 0.8 1.1F<strong>in</strong>land 10.9 12.8 14.1 4.2 3.9 4.3Sweden (6) 20.2 21.5 25.0 7.9 9.6 8.1United K<strong>in</strong>gdom (10) 24.6 25.4 25.5 4.8 4.2 3.7Croatia : 8.3 8.6 : 3.6 3.1Turkey : 6.9 8.8 : : 2.7Iceland : : 21.7 16.6 17.7 11.8Norway : 26.4 28.2 8.1 8.8 7.9Switzerland 29.4 31.7 33.5 5.3 6.3 7.4(1) The Czech Republic, Estonia, Latvia and Slovakia, 1998.(2) Ireland, 2004.(3) Latvia, Lithuania and Slovakia, 1998.(4) Iceland, 2006.(5) 2005, break <strong>in</strong> series for part-time.(6) 2005, break <strong>in</strong> series.(7) 2004, break <strong>in</strong> series.(8) 1998, break <strong>in</strong> series.(9) 2002, break <strong>in</strong> series.(10) 1999, break <strong>in</strong> series for part-time.Source: <strong>Eurostat</strong> (tps00159, tps00074 and lfsi_emp_a)276 EUROPE IN FIGURES — <strong>Eurostat</strong> <strong>yearbook</strong> <strong>2009</strong>
Labour market 7Figure 7.6: Persons employed part-time, 2007(% of total employment)7550250EU-27Euro areaNetherlandsGermanyUnited K<strong>in</strong>gdomSwedenDenmarkAustriaBelgiumLuxembourgIreland (2)FranceItalyMaltaF<strong>in</strong>landSpa<strong>in</strong>PortugalRomaniaPolandSloveniaLithuaniaEstoniaCyprusLatviaGreeceCzech RepublicHungarySlovakiaBulgariaSwitzerlandNorwayIceland (3)TurkeyCroatiaMaleFemale(1) The figure is ranked on the average of male and female.(2) 2004.(3) Provisional.Source: <strong>Eurostat</strong> (tps00159)Figure 7.7: Proportion of employees <strong>with</strong> a contract of limited duration, 2007(% of total employees)403020100EU-27Euro areaSpa<strong>in</strong>Poland (1)PortugalSloveniaNetherlandsSwedenF<strong>in</strong>landGermanyFranceItalyCyprusGreeceAustriaDenmarkBelgiumCzech RepublicIrelandHungaryLuxembourgUnited K<strong>in</strong>gdomBulgariaMaltaSlovakiaLatviaLithuaniaEstoniaRomaniaSwitzerland (1)CroatiaTurkeyIceland (1)Norway(1) Provisional.Source: <strong>Eurostat</strong> (tps00073)EUROPE IN FIGURES — <strong>Eurostat</strong> <strong>yearbook</strong> <strong>2009</strong>277
7 Labour market7.2 People <strong>in</strong> the labour market– unemploymentIntroductionYouth and long-term unemployment ratesappear to be more susceptible to cyclicaleconomic changes than the overall unemploymentrate. Indeed, social policymakersare often challenged to remedythese situations by design<strong>in</strong>g ways to<strong>in</strong>crease the employment opportunitiesopen to various (disadvantaged) groupsof society, those work<strong>in</strong>g <strong>in</strong> particulareconomic activities, or those liv<strong>in</strong>g <strong>in</strong>specific regions.Globalisation and technological progresshave an ever-<strong>in</strong>creas<strong>in</strong>g effect on manydaily lives, and the demand for differenttypes of labour and skills is evolv<strong>in</strong>g at arapid pace. While enterprises need to be<strong>in</strong>creas<strong>in</strong>gly <strong>in</strong>novative and productive,some of their risk may be passed on to thelabour force, as <strong>in</strong>creased flexibility is demandedboth from those <strong>in</strong> employmentand from those search<strong>in</strong>g for a new job.With<strong>in</strong> the context of the <strong>Europe</strong>an EmploymentStrategy, there are a number ofmeasures that are designed to help encouragepeople to rema<strong>in</strong> <strong>in</strong> work or f<strong>in</strong>da new job, <strong>in</strong>clud<strong>in</strong>g: the promotion of alifecycle approach to work, encourag<strong>in</strong>glifelong learn<strong>in</strong>g, improv<strong>in</strong>g support tothose seek<strong>in</strong>g a job, as well as ensur<strong>in</strong>gequal opportunities.The <strong>in</strong>tegrated employment guidel<strong>in</strong>esfor 2008-2010 encouraged Member Statesto:• work <strong>with</strong> renewed endeavour to buildemployment pathways for young peopleand reduce youth unemployment,<strong>in</strong> particular, through adapt<strong>in</strong>g educationand tra<strong>in</strong><strong>in</strong>g systems <strong>in</strong> orderto raise quality, broaden supply, diversifyaccess, ensure flexibility, respondto new occupational needs andskills requirements;• take action to <strong>in</strong>crease female participationand reduce gender gaps <strong>in</strong>employment, unemployment and pay,through better reconciliation of workand private life and the provision ofaccessible and affordable childcare facilitiesand care for other dependants;• give support to active age<strong>in</strong>g, <strong>in</strong>clud<strong>in</strong>g<strong>in</strong>itiatives for appropriate work<strong>in</strong>gconditions, improved health and<strong>in</strong>centives to work and discouragementof early retirement;• develop modern social protectionsystems, <strong>in</strong>clud<strong>in</strong>g pensions andhealthcare, ensur<strong>in</strong>g their social adequacy,f<strong>in</strong>ancial susta<strong>in</strong>ability andresponsiveness to chang<strong>in</strong>g needs,so as to support participation, betterretention <strong>in</strong> employment and longerwork<strong>in</strong>g lives.278 EUROPE IN FIGURES — <strong>Eurostat</strong> <strong>yearbook</strong> <strong>2009</strong>
Labour market 7The guidel<strong>in</strong>es also set a number of additionalbenchmarks, whereby MemberStates were encouraged:• to ensure that by 2010 every unemployedperson was offered a job, apprenticeship,additional tra<strong>in</strong><strong>in</strong>g oranother employability measure (foryoung persons leav<strong>in</strong>g school <strong>with</strong><strong>in</strong>4 months, and for adults <strong>with</strong><strong>in</strong> nomore than 12 months);• to work towards 25 % of the long-termunemployed participat<strong>in</strong>g <strong>in</strong> tra<strong>in</strong><strong>in</strong>g,retra<strong>in</strong><strong>in</strong>g, work practice, or otheremployability measures by 2010;• to guarantee that job seekers throughoutthe EU are able to consult all jobvacancies advertised <strong>in</strong> the nationalemployment services of each MemberState.Def<strong>in</strong>itions and data availabilityUnemployed persons are def<strong>in</strong>ed asthose persons aged 15-74 (4) who were<strong>with</strong>out work dur<strong>in</strong>g the reference week,were currently available for work andwere either actively seek<strong>in</strong>g work <strong>in</strong> thepast four weeks or had already found ajob to start <strong>with</strong><strong>in</strong> the next three months.For the purposes of this f<strong>in</strong>al po<strong>in</strong>t, thefollow<strong>in</strong>g are considered as specific steps<strong>in</strong> the search for a job: hav<strong>in</strong>g been <strong>in</strong>contact <strong>with</strong> a public employment officeto f<strong>in</strong>d work, whoever took the <strong>in</strong>itiative(renew<strong>in</strong>g registration for adm<strong>in</strong>istrativereasons only is not an active step); hav<strong>in</strong>gbeen <strong>in</strong> contact <strong>with</strong> a private agency(temporary work agency, firm specialis<strong>in</strong>g<strong>in</strong> recruitment, etc.) to f<strong>in</strong>d work;apply<strong>in</strong>g to employers directly; ask<strong>in</strong>gamong friends, relatives, unions, etc.,to f<strong>in</strong>d work; plac<strong>in</strong>g or answer<strong>in</strong>g jobadvertisements; study<strong>in</strong>g job advertisements;tak<strong>in</strong>g a recruitment test or exam<strong>in</strong>ationor be<strong>in</strong>g <strong>in</strong>terviewed; look<strong>in</strong>g forland, premises or equipment; apply<strong>in</strong>g forpermits, licences or f<strong>in</strong>ancial resources.This def<strong>in</strong>ition is <strong>in</strong> accordance <strong>with</strong> theInternational Labour Organisation (ILO)standards and Commission Regulation(EC) No 1897/2000.Unemployment data are generally presentedas rates. The unemployment rateis the share of unemployed persons overthe total number of active persons <strong>in</strong> thelabour market; active persons are thosewho are either employed or unemployed.This rate can then be broken down <strong>in</strong>to anumber of more detailed groups – for example,unemployment accord<strong>in</strong>g to educationalatta<strong>in</strong>ment, where the <strong>in</strong>dicatorprovides a measure of the difficulties thatpeople <strong>with</strong> different levels of educationface <strong>in</strong> the labour market, offer<strong>in</strong>g some<strong>in</strong>formation on the impact of education<strong>in</strong> reduc<strong>in</strong>g the chances of be<strong>in</strong>g unemployed.The unemployment rate is alsoavailable accord<strong>in</strong>g to the duration of unemployment,namely: the long-term unemploymentrate def<strong>in</strong>ed as the numberof persons who have been unemployed forat least 12 months, expressed as a share ofthe total number of active persons <strong>in</strong> thelabour market; the very long-term unemploymentrate represent<strong>in</strong>g the numberof persons who have been unemployedfor at least 24 months, aga<strong>in</strong> expressed asa share of the total number of active persons<strong>in</strong> the labour market.(4) In Spa<strong>in</strong> and the United K<strong>in</strong>gdom this is restricted to persons aged 16 to 74 years old.EUROPE IN FIGURES — <strong>Eurostat</strong> <strong>yearbook</strong> <strong>2009</strong>279
7 Labour marketMa<strong>in</strong> f<strong>in</strong>d<strong>in</strong>gsThe average unemployment rate acrossthe EU-27 <strong>in</strong> 2007 was 7.1 %, which representeda further improvement fromthe relative peak of 9.0 % that was recorded<strong>in</strong> 2003 and 2004. This latest figuremarked a reduction of 1.1 percentagepo<strong>in</strong>ts <strong>in</strong> comparison <strong>with</strong> 2006, whichwas the largest change <strong>in</strong> unemployment(<strong>in</strong> either a positive or negative direction)s<strong>in</strong>ce the series for the EU-27 was established<strong>in</strong> 2000.There rema<strong>in</strong> considerable differences<strong>in</strong> unemployment rates between MemberStates: the highest rates of 11.1 % and9.6 % be<strong>in</strong>g recorded <strong>in</strong> Slovakia andPoland; and the lowest (less than 4 %) <strong>in</strong>Cyprus, Denmark and the Netherlands.Nevertheless, the distribution of unemploymentrates across the EU narrowedconsiderably, as the gap between thehighest and the lowest unemploymentrates peaked <strong>in</strong> 2001 at 17.6 percentagepo<strong>in</strong>ts, fall<strong>in</strong>g <strong>in</strong> every subsequent year(and most rapidly <strong>in</strong> 2006 and 2007),such that it stood at 7.9 percentage po<strong>in</strong>ts<strong>in</strong> 2007.Long-term unemployment is one of thema<strong>in</strong> concerns of governments and socialplanners/policy-makers. Besides itseffects on personal life, long-term unemploymentlimits social cohesion and, ultimately,h<strong>in</strong>ders economic growth. Some3.1 % of those actively seek<strong>in</strong>g work <strong>in</strong>the EU-27 <strong>in</strong> 2007 had been unemployedfor more than one year and 1.8 % wereunemployed for more than two years.The unemployment rate for women(7.8 %) <strong>in</strong> the EU-27 <strong>in</strong> 2007 rema<strong>in</strong>edhigher than that for men (6.6 %); thispattern was reflected <strong>in</strong> the majority ofMember States, <strong>with</strong> exceptions limitedto the Baltic Member States, Romania,Ireland, the United K<strong>in</strong>gdom and Germany.The difference <strong>in</strong> unemploymentrates between the sexes was particularlymarked <strong>in</strong> the Mediterranean MemberStates.Unemployment rates by age group showthat persons under the age of 25 tend toface the most difficulty <strong>in</strong> secur<strong>in</strong>g a job.The average unemployment rate among15 to 24 year olds who were actively seek<strong>in</strong>gemployment was 15.3 % across theEU-27 <strong>in</strong> 2007. The highest youth unemploymentrate was <strong>in</strong> Greece (22.9 %) andthe same country reported the largestdifference between unemployment ratesfor those aged 25 or more and those agedless than 25 (15.8 percentage po<strong>in</strong>ts). Thismeasure of the relative difficulty fac<strong>in</strong>gyoung job seekers was also particularlyhigh <strong>in</strong> Italy (15.4 percentage po<strong>in</strong>ts difference),Romania (15.2 percentage po<strong>in</strong>tsdifference) and Sweden (14.8 percentagepo<strong>in</strong>ts difference). In contrast, youthunemployment rates were closest to (butnever lower than) the overall unemploymentrate <strong>in</strong> Germany, the Netherlands,Lithuania and Denmark – all less than 5percentage po<strong>in</strong>ts difference.A lack of qualifications can be anotherdiscrim<strong>in</strong>at<strong>in</strong>g factor for job seekers, asunemployment rates tend to decrease accord<strong>in</strong>gto the level of education atta<strong>in</strong>ed.This was a characteristic noted <strong>in</strong> almostevery Member State <strong>in</strong> 2007, as the averageunemployment rate <strong>in</strong> the EU-27 forthose hav<strong>in</strong>g atta<strong>in</strong>ed at most a lowersecondary education was 9.2 % <strong>in</strong> 2007,almost three times the rate of unemployment(3.6 %) for those that had a tertiaryeducation.280 EUROPE IN FIGURES — <strong>Eurostat</strong> <strong>yearbook</strong> <strong>2009</strong>
Labour market 7Table 7.6: Unemployment rate(%)1997 1998 1999 2000 2001 2002 2003 2004 2005 2006 2007EU-27 : : : 8.7 8.5 8.9 9.0 9.0 8.9 8.2 7.1Euro area 10.5 10.0 9.2 8.3 7.8 8.2 8.6 8.8 8.9 8.3 7.4Belgium 9.2 9.3 8.5 6.9 6.6 7.5 8.2 8.4 8.5 8.3 7.5Bulgaria : : : 16.4 19.5 18.2 13.7 12.1 10.1 9.0 6.9Czech Republic : 6.4 8.6 8.7 8.0 7.3 7.8 8.3 7.9 7.2 5.3Denmark 5.2 4.9 5.2 4.3 4.5 4.6 5.4 5.5 4.8 3.9 3.8Germany 9.4 9.1 8.2 7.5 7.6 8.4 9.3 9.8 10.7 9.8 8.4Estonia 9.6 9.2 11.3 12.8 12.4 10.3 10.0 9.7 7.9 5.9 4.7Ireland 9.9 7.5 5.7 4.3 4.0 4.5 4.7 4.5 4.4 4.5 4.6Greece 9.8 10.8 12.0 11.2 10.7 10.3 9.7 10.5 9.9 8.9 8.3Spa<strong>in</strong> 16.7 15.0 12.5 11.1 10.3 11.1 11.1 10.6 9.2 8.5 8.3France 11.5 11.0 10.4 9.0 8.3 8.6 9.0 9.3 9.2 9.2 8.3Italy 11.3 11.4 11.0 10.1 9.1 8.6 8.5 8.1 7.7 6.8 6.1Cyprus : : : 4.9 3.8 3.6 4.1 4.7 5.3 4.6 3.9Latvia : 14.3 14.0 13.7 12.9 12.2 10.5 10.4 8.9 6.8 6.0Lithuania : 13.2 13.7 16.4 16.5 13.5 12.5 11.4 8.3 5.6 4.3Luxembourg 2.7 2.7 2.4 2.2 1.9 2.6 3.8 5.0 4.6 4.6 4.1Hungary 9.0 8.4 6.9 6.4 5.7 5.8 5.9 6.1 7.2 7.5 7.4Malta : : : 6.7 7.6 7.5 7.6 7.4 7.2 7.1 6.4Netherlands 4.9 3.8 3.2 2.8 2.2 2.8 3.7 4.6 4.7 3.9 3.2Austria 4.4 4.5 3.9 3.6 3.6 4.2 4.3 4.8 5.2 4.8 4.4Poland 10.9 10.2 13.4 16.2 18.3 20.0 19.7 19.0 17.8 13.9 9.6Portugal 6.7 5.0 4.5 4.0 4.1 5.1 6.4 6.7 7.7 7.8 8.1Romania : : 7.1 7.3 6.8 8.6 7.0 8.1 7.2 7.3 6.4Slovenia 6.9 7.4 7.3 6.7 6.2 6.3 6.7 6.3 6.5 6.0 4.9Slovakia : 12.6 16.4 18.8 19.3 18.7 17.6 18.2 16.3 13.4 11.1F<strong>in</strong>land 12.7 11.4 10.2 9.8 9.1 9.1 9.0 8.8 8.4 7.7 6.9Sweden (1) 9.9 8.2 6.7 5.6 4.9 4.9 5.6 6.3 7.4 7.0 6.1United K<strong>in</strong>gdom 6.8 6.1 5.9 5.4 5.0 5.1 5.0 4.7 4.8 5.4 5.3Croatia : : : : : 14.8 14.2 13.7 12.7 11.2 9.6Turkey : : : : : : : : : 8.4 8.5Norway 4.0 3.2 3.2 3.4 3.6 3.9 4.5 4.4 4.6 3.5 2.6Japan 3.4 4.1 4.7 4.7 5.0 5.4 5.3 4.7 4.4 4.1 3.9United States 4.9 4.5 4.2 4.0 4.8 5.8 6.0 5.5 5.1 4.6 4.6(1) Break <strong>in</strong> series, 2005.Source: <strong>Eurostat</strong> (tsiem110)EUROPE IN FIGURES — <strong>Eurostat</strong> <strong>yearbook</strong> <strong>2009</strong>281
7 Labour marketFigure 7.8: Unemployment rates, 2007 (1)(%)151050EU-27Euro areaSlovakiaPolandGreeceSpa<strong>in</strong>GermanyFrancePortugalBelgiumHungaryBulgariaF<strong>in</strong>landMaltaItalyRomaniaSwedenLatviaCzech RepublicUnited K<strong>in</strong>gdomSloveniaEstoniaIrelandAustriaLithuaniaLuxembourgCyprusDenmarkNetherlandsCroatiaTurkeyUnited StatesJapanNorwayMaleFemale(1) The figure is ranked on the average of male and female.Source: <strong>Eurostat</strong> (tsiem110)Figure 7.9: Unemployment rates by duration, 2007(%)151050EU-27Euro areaBelgiumBulgariaCzech RepublicDenmarkGermanyEstoniaIrelandGreeceSpa<strong>in</strong>FranceItalyCyprusLatviaLithuaniaLuxembourgHungaryMaltaNetherlandsAustriaPolandPortugalRomaniaSloveniaSlovakiaF<strong>in</strong>landSwedenUnited K<strong>in</strong>gdomCroatiaTurkeyNorwayUnemployed less than 12 monthsLong-term unemployment rateSource: <strong>Eurostat</strong> (tsiem110 and tsisc070)282 EUROPE IN FIGURES — <strong>Eurostat</strong> <strong>yearbook</strong> <strong>2009</strong>
Labour market 7Table 7.7: Unemployment rates by age and gender, 2007(%)GenderAgeMale Female < 25 years > 25 yearsEU-27 6.6 7.8 15.3 6.1Euro area 6.6 8.4 14.8 6.5Belgium 6.7 8.5 18.8 6.3Bulgaria 6.5 7.3 15.1 6.1Czech Republic 4.2 6.7 10.7 4.8Denmark 3.5 4.2 7.9 3.1Germany 8.5 8.3 11.1 8.0Estonia 5.4 3.9 10.0 4.0Ireland 4.9 4.2 9.1 3.8Greece 5.2 12.8 22.9 7.1Spa<strong>in</strong> 6.4 10.9 18.2 7.0France 7.8 8.9 19.4 7.0Italy 4.9 7.9 20.3 4.9Cyprus 3.4 4.6 10.0 3.3Latvia 6.4 5.6 10.7 5.3Lithuania 4.3 4.3 8.2 3.9Luxembourg 3.4 5.0 15.3 3.3Hungary 7.1 7.7 18.0 6.5Malta 5.8 7.6 13.8 4.7Netherlands 2.8 3.6 5.9 2.6Austria 3.9 5.0 8.7 3.7Poland 9.0 10.4 21.7 8.1Portugal 6.7 9.7 16.6 7.2Romania 7.2 5.4 20.1 4.9Slovenia 4.0 5.9 10.1 4.2Slovakia 9.9 12.7 20.3 10.0F<strong>in</strong>land 6.5 7.2 16.5 5.4Sweden 5.8 6.4 19.1 4.3United K<strong>in</strong>gdom 5.6 5.0 14.3 3.6Croatia 8.4 11.2 24.0 8.0Turkey 8.5 8.5 16.8 6.7Norway 2.6 2.5 7.3 1.8Source: <strong>Eurostat</strong> (tsiem110 and une_rt_a)EUROPE IN FIGURES — <strong>Eurostat</strong> <strong>yearbook</strong> <strong>2009</strong>283
7 Labour marketTable 7.8: Unemployment rates, EU-27(%)2001 2002 2003 2004 2005 2006 2007Male 7.7 8.3 8.4 8.4 8.3 7.6 6.6Female 9.4 9.7 9.7 9.8 9.6 8.9 7.8< 25 years 17.3 17.9 18.0 18.4 18.3 17.1 15.3> 25 years 7.2 7.6 7.7 7.7 7.6 7.0 6.1Long-term unemployment rate 3.9 4.0 4.1 4.2 4.1 3.7 3.1Male 3.5 3.6 3.8 3.8 3.8 3.5 2.8Female 4.4 4.5 4.5 4.6 4.4 4.0 3.3Very long-term unemployment rate 1.9 1.9 1.9 2.0 2.3 2.2 1.8Source: <strong>Eurostat</strong> (tsiem110, une_rt_a, tsisc070 and une_ltu_a)Figure 7.10: Unemployment rates (among persons aged 25-64 years) by level of educationalatta<strong>in</strong>ment, 2007(%)20100EU-27Euro areaBelgiumBulgariaCzech RepublicDenmarkGermanyEstoniaIrelandGreeceSpa<strong>in</strong>FranceItalyCyprusLatviaLithuaniaLuxembourgHungaryMaltaNetherlandsAustriaPolandPortugalRomaniaSloveniaSlovakiaF<strong>in</strong>landSwedenUnited K<strong>in</strong>gdomCroatiaTurkeyNorwaySwitzerlandPre-primary, primary and lower secondary education (ISCED levels 0 to 2) (1)Upper secondary and post-secondary non-tertiary education (ISCED levels 3 and 4) (2)Tertiary education (ISCED levels 5 and 6) (3)(1) Estonia, not available; Lithuania, Luxembourg, Slovenia and Croatia, unreliable data; Slovakia, y-axis has been cut, 41.5 %.(2) Malta, not available; Estonia and Luxembourg, unreliable data.(3) Estonia and Malta, not available; Lithuania, Luxembourg, Slovenia and Croatia, unreliable data.Source: <strong>Eurostat</strong> (tps00066)284 EUROPE IN FIGURES — <strong>Eurostat</strong> <strong>yearbook</strong> <strong>2009</strong>
Labour market 77.3 Job vacanciesIntroductionPolicy developments <strong>in</strong> this area havepr<strong>in</strong>cipally focused on try<strong>in</strong>g to improvethe labour market by more closelymatch<strong>in</strong>g supply and demand, through:the modernisation and strengthen<strong>in</strong>g oflabour market <strong>in</strong>stitutions, notably employmentservices; remov<strong>in</strong>g obstacles tomobility for workers across <strong>Europe</strong>; betteranticipat<strong>in</strong>g skill needs, labour marketshortages and bottlenecks; provid<strong>in</strong>gappropriate management of economicmigration; improv<strong>in</strong>g the adaptability ofworkers and enterprises so that there is agreater capacity to anticipate, trigger andabsorb economic and social change.The EU believes that job seekers throughoutthe EU should be able to consult alljob vacancies advertised <strong>in</strong> each of theMember States’ employment services.With this goal <strong>in</strong> m<strong>in</strong>d, the EU set upEURES, the <strong>Europe</strong>an jobs and mobilityportal, which can be found at: www.eures.europa.eu. This website providesaccess to a range of job vacancies for 31<strong>Europe</strong>an countries (each of the MemberStates, as well as Iceland, Liechtenste<strong>in</strong>,Norway and Switzerland). At the time ofwrit<strong>in</strong>g (autumn 2008) there were morethan 1.2 million job vacancies advertisedby over 18 000 registered employers onthe website, while 314 thousand peoplehad posted their CVs.The 2008 <strong>Europe</strong>an Job Days marked thethird annual edition of another EU <strong>in</strong>itiative<strong>in</strong> this doma<strong>in</strong>. Dur<strong>in</strong>g Septemberand October 2008, a wide range of events(around 500) took place all over <strong>Europe</strong><strong>with</strong> the aim of rais<strong>in</strong>g awareness aboutthe opportunities and practicalities ofliv<strong>in</strong>g and work<strong>in</strong>g <strong>in</strong> another <strong>Europe</strong>ancountry. The events typically <strong>in</strong>cludedjob fairs, sem<strong>in</strong>ars, lectures, workshopsand cultural events, all aimed at improv<strong>in</strong>glabour mobility.Def<strong>in</strong>itions and data availabilityA job vacancy is def<strong>in</strong>ed as a post (newlycreated, unoccupied or about to becomevacant), which the employer:• is tak<strong>in</strong>g active steps to f<strong>in</strong>d a suitablecandidate from outside the enterpriseconcerned and is prepared to takemore steps; and• <strong>in</strong>tends to fill either immediately or<strong>in</strong> the near future.Under this def<strong>in</strong>ition, a job vacancyshould be open to candidates from outsidethe enterprise. However, this doesnot exclude the possibility of the employerappo<strong>in</strong>t<strong>in</strong>g an <strong>in</strong>ternal candidate tothe post. A vacant post that is open onlyto <strong>in</strong>ternal candidates is not treated as ajob vacancy.The job vacancy rate (JVR) measures thepercentage of total posts that are vacant,<strong>in</strong> l<strong>in</strong>e <strong>with</strong> the def<strong>in</strong>ition of a job vacancyabove, expressed as follows: JVR =number of job vacancies/(number of occupiedposts + number of job vacancies) *100. An occupied post is a post <strong>with</strong><strong>in</strong> anorganisation to which an employee hasbeen assigned.Data on job vacancies and occupied postsare broken down by economic activity,occupation, size of enterprise and region.The national <strong>in</strong>stitutions responsible forEUROPE IN FIGURES — <strong>Eurostat</strong> <strong>yearbook</strong> <strong>2009</strong>285
7 Labour marketcompil<strong>in</strong>g job vacancy statistics send aggregatedstatistics to <strong>Eurostat</strong>. These nationaldata are then used to compile thejob vacancy rate at EU-27 and euro arealevels. At present, job vacancy statisticsat the level of the Member States do notprovide complete coverage and as a resultthere are currently no EU totals forthe number of job vacancies or occupiedposts. The EU job vacancy rate is calculatedsimply on the basis of the <strong>in</strong>formationavailable; no estimates are made forany country not participat<strong>in</strong>g <strong>in</strong> the collection.As a result, it is also not possibleto provide EU-27 job vacancy rates brokendown by economic activity, occupationor size of enterprise.Ma<strong>in</strong> f<strong>in</strong>d<strong>in</strong>gsThe job vacancy rate, <strong>in</strong> part, reflects theunmet demand for labour, as well as a potentialmismatch between the skills andavailability of those who are unemployedand those sought by employers.Job vacancy statistics are used by the <strong>Europe</strong>anCommission and the <strong>Europe</strong>anCentral Bank to analyse and monitor theevolution of the labour market at nationaland <strong>Europe</strong>an level. These statistics arealso a key <strong>in</strong>dicator used for the assessmentof the bus<strong>in</strong>ess cycle and for structuralanalysis.There was a broad upward development<strong>in</strong> the job vacancy rate <strong>in</strong> the EU-27,reach<strong>in</strong>g 2.2 % <strong>in</strong> 2007. Among the MemberStates for which data are available,the job vacancy rate <strong>in</strong> 2007 was highest<strong>in</strong> Cyprus (4.6 %), Germany (3.5 %)and Estonia (3.3 %), and lowest <strong>in</strong> Spa<strong>in</strong>,Luxembourg and Portugal (2006), whererates were below 1.0 %.286 EUROPE IN FIGURES — <strong>Eurostat</strong> <strong>yearbook</strong> <strong>2009</strong>
Labour market 7Figure 7.11: Job vacancy rate (1)(%)2.502.252.001.751.501.251.002003 2004 2005 2006 2007EU-27Euro area(1) Provisional.Source: <strong>Eurostat</strong> (jvs_a)Figure 7.12: Job vacancy rate, 2007 (1)(%)543210EU-27 (2)Euro area (2)CyprusGermany (2)EstoniaCzech RepublicNetherlands (3)F<strong>in</strong>landUnited K<strong>in</strong>gdomBelgiumRomaniaLithuaniaPolandLatviaMaltaGreeceHungarySwedenSlovenia (2)SlovakiaBulgariaSpa<strong>in</strong>LuxembourgPortugal (3)(1) Denmark, Ireland, France, Italy and Austria, not available.(2) Provisional.(3) 2006.Source: <strong>Eurostat</strong> (jvs_a)EUROPE IN FIGURES — <strong>Eurostat</strong> <strong>yearbook</strong> <strong>2009</strong>287
7 Labour market7.4 Labour market policy<strong>in</strong>terventionsIntroductionLabour market policy (LMP) <strong>in</strong>terventionsare generally targeted at provid<strong>in</strong>gassistance to the unemployed and othergroups of people <strong>with</strong> particular difficultiesto enter the labour market. Theprimary target groups <strong>in</strong> most countriesrema<strong>in</strong> those people that are registeredas unemployed by national public employmentservices (PES). However, publicexpenditure on labour market policiesshould not be <strong>in</strong>terpreted exclusively asdemonstrat<strong>in</strong>g the strength of the politicalwill to combat unemployment. Indeed,policy objectives are <strong>in</strong>creas<strong>in</strong>glyfocused on a broader range of <strong>in</strong>activepersons <strong>with</strong><strong>in</strong> society. As such, LMP<strong>in</strong>terventions are <strong>in</strong>creas<strong>in</strong>gly be<strong>in</strong>g targetedat women, the young, the elderly,or other groups of society that may facedisadvantages and barriers that preventthem from jo<strong>in</strong><strong>in</strong>g the labour force.Def<strong>in</strong>itions and data availabilityThe LMP methodology provides guidel<strong>in</strong>esfor the collection of data on labourmarket policy <strong>in</strong>terventions: which <strong>in</strong>terventionsto cover and how to classify<strong>in</strong>terventions by type of action, how tomeasure expenditure associated <strong>with</strong>each <strong>in</strong>tervention and how to calculatethe numbers of participants <strong>in</strong> these <strong>in</strong>terventions(stocks, entrants and exits).LMP statistics cover all labour market<strong>in</strong>terventions which can be described as‘public <strong>in</strong>terventions <strong>in</strong> the labour marketaimed at reach<strong>in</strong>g its efficient function<strong>in</strong>gand correct<strong>in</strong>g disequilibria andwhich can be dist<strong>in</strong>guished from othergeneral employment policy <strong>in</strong>terventions<strong>in</strong> that they act selectively to favour particulargroups <strong>in</strong> the labour market’.The scope of LMP statistics is limited topublic <strong>in</strong>terventions which are explicitlytargeted at groups of persons <strong>with</strong> difficulties<strong>in</strong> the labour market: the unemployed,persons employed but at riskof <strong>in</strong>voluntary job loss and <strong>in</strong>active personswho would like to enter the labourmarket.LMP <strong>in</strong>terventions are classified <strong>in</strong>tothree ma<strong>in</strong> types:• LMP services refer to labour market<strong>in</strong>terventions where the ma<strong>in</strong> activityof participants is job-search relatedand where participation usually doesnot result <strong>in</strong> a change of labour marketstatus.• LMP measures refer to labour market<strong>in</strong>terventions where the ma<strong>in</strong>activity of participants is other thanjob-search related and where participationusually results <strong>in</strong> a change <strong>in</strong>labour market status. An activity thatdoes not result <strong>in</strong> a change of labourmarket status may still be consideredas a measure if the <strong>in</strong>tervention fulfilsthe follow<strong>in</strong>g criteria: 1) the activitiesundertaken are not job-search related,are supervised and constitute a fulltimeor significant part-time activityof participants dur<strong>in</strong>g a significantperiod of time, and 2) the aim is toimprove the vocational qualificationsof participants, or 3) the <strong>in</strong>terventionprovides <strong>in</strong>centives to take-up or toprovide employment (<strong>in</strong>clud<strong>in</strong>g selfemployment).288 EUROPE IN FIGURES — <strong>Eurostat</strong> <strong>yearbook</strong> <strong>2009</strong>
Labour market 7• LMP supports refer to <strong>in</strong>terventionsthat provide f<strong>in</strong>ancial assistance, directlyor <strong>in</strong>directly, to <strong>in</strong>dividualsfor labour market reasons, or whichcompensate <strong>in</strong>dividuals for disadvantagecaused by labour marketcircumstances.These ma<strong>in</strong> types are further brokendown <strong>in</strong>to n<strong>in</strong>e detailed categories accord<strong>in</strong>gto the type of action:LMP services1. Labour market services;LMP measures2. Tra<strong>in</strong><strong>in</strong>g;3. Job rotation and job shar<strong>in</strong>g;4. Employment <strong>in</strong>centives;5. Supported employment andrehabilitation;6. Direct job creation;7. Start-up <strong>in</strong>centives;LMP supports8. Out-of-work <strong>in</strong>come ma<strong>in</strong>tenanceand support;9. Early retirement.Ma<strong>in</strong> f<strong>in</strong>d<strong>in</strong>gsThe breakdown of expenditure and participantsfor different labour marketpolicy <strong>in</strong>terventions across the MemberStates was extremely varied, reflect<strong>in</strong>gthe different characteristics and problemsfaced <strong>with</strong><strong>in</strong> <strong>in</strong>dividual labour markets,as well as the political convictions of differentgovernments. With<strong>in</strong> the EU-27,the highest level of relative expenditureon labour market policy <strong>in</strong>terventions <strong>in</strong>2006 was reported <strong>in</strong> Germany and Belgium(almost 3 % of GDP); this share waslowest <strong>in</strong> the Czech Republic, Romania,Lithuania and Estonia (all below 0.5 % ofGDP). There was also a wide range of expenditurepatterns <strong>in</strong> terms of spend<strong>in</strong>gon labour market policy services, <strong>with</strong>the Netherlands and the United K<strong>in</strong>gdomreport<strong>in</strong>g the highest relative expenditure(around twice the EU-27 average).The largest share of expenditure on activelabour market policy measures <strong>in</strong>the EU-27 went on tra<strong>in</strong><strong>in</strong>g (41.1 %) toimprove the employability of the unemployedand other target groups. Almostone quarter (24.2 %) of EU-27 expenditurewas accounted for by employment<strong>in</strong>centives, <strong>with</strong> roughly another quarter(26.3 %) be<strong>in</strong>g relatively equally sharedbetween programmes developed to promotelabour market <strong>in</strong>tegration amongpersons <strong>with</strong> reduced work<strong>in</strong>g capacityand programmes to create additionaljobs.An estimate of the participation <strong>in</strong> labourmarket policy <strong>in</strong>itiatives suggests thatsome 11.4 million persons were engaged<strong>in</strong> the different types of action across theEU-27 <strong>in</strong> 2006. Of these, the most commontypes of action were employment<strong>in</strong>centives (4.6 million) and tra<strong>in</strong><strong>in</strong>g (3.8million).EUROPE IN FIGURES — <strong>Eurostat</strong> <strong>yearbook</strong> <strong>2009</strong>289
7 Labour marketTable 7.9: Labour market policy measures, participants by type of action, 2006 (1)(annual average stock <strong>in</strong> 1 000)Tra<strong>in</strong><strong>in</strong>gJob rotation& job shar<strong>in</strong>gEmployment<strong>in</strong>centivesSupportedemployment &rehabilitationDirect jobcreationStart-up<strong>in</strong>centivesEU-27 3 816.1 106.9 4 606.3 773.6 1 336.9 712.2Belgium 96.0 - 116.1 38.6 108.9 1.0Bulgaria 11.6 - 14.3 1.8 74.3 4.6Czech Republic 7.4 - 16.6 21.0 9.5 4.2Denmark : : : : : :Germany 1 585.4 0.4 126.8 23.2 372.9 407.8Estonia 1.1 - 0.7 0.1 0.0 0.0Ireland 26.8 - 4.3 1.6 23.8 4.4Greece : : : : : :Spa<strong>in</strong> 262.9 68.7 2 591.1 42.9 222.8 158.7France 553.8 - 556.2 129.5 279.3 76.4Italy : 17.4 579.4 - 35.1 8.2Cyprus 0.1 - 1.1 : - 0.1Latvia 5.0 - 2.6 0.5 1.5 -Lithuania 7.1 0.0 : : 6.5 0.2Luxembourg 2.3 - : 0.1 1.1 -Hungary 13.9 - 35.4 - 17.0 3.3Malta 1.5 - 0.4 - 0.0 :Netherlands 178.5 - 46.7 144.4 - -Austria 90.1 0.0 61.0 : 7.6 2.2Poland 98.8 : 98.0 : 8.2 3.4Portugal 48.0 : 79.1 5.7 21.2 4.3Romania 15.1 - 51.4 - 17.4 :Slovenia 12.0 - 2.4 - 3.3 3.3Slovakia 2.3 - 13.1 1.9 104.6 20.6F<strong>in</strong>land (2) 50.2 7.8 16.1 8.4 13.8 4.5Sweden 52.0 13.0 118.8 36.9 - 5.4United K<strong>in</strong>gdom 39.0 - 30.0 7.2 8.3 -Norway 34.5 - 4.6 12.6 7.6 0.5(1) A large number of the cells are unreliable.(2) 2007.Source: <strong>Eurostat</strong> (lmp_partsumm)290 EUROPE IN FIGURES — <strong>Eurostat</strong> <strong>yearbook</strong> <strong>2009</strong>
Labour market 7Figure 7.13: Public expenditure on labour market policy <strong>in</strong>terventions, 2006 (1)(% of GDP)3210EU-27 (2)Germany (3)Belgium (3)Netherlands (3)F<strong>in</strong>land (4)France (3)Sweden (5)Spa<strong>in</strong>Austria (4)PortugalIreland (3)Italy (3)Poland (5)Luxembourg (3)Cyprus (3)SloveniaSlovakiaHungaryBulgaria (4)LMP services (category 1)LMP measures (categories 2 to 7)LMP supports (categories 8 and 9)United K<strong>in</strong>gdom (3)Malta (4)Latvia (5)Czech RepublicRomania (5)LithuaniaEstoniaNorway(1) Denmark and Greece, not available.(2) Estimates.(3) Categories 1 to 7, estimates.(4) Categories 2 to 7, estimates.(5) Category 1, estimate.Source: <strong>Eurostat</strong> (lmp_expsumm)Figure 7.14: Public expenditure on labour market policy measures, EU-27, 2006 (1)(% of total)Start-up <strong>in</strong>centives7.7%Direct job creation14.1%Job rotation and jobshar<strong>in</strong>g0.7%Tra<strong>in</strong><strong>in</strong>g41.1%Supported employmentand rehabilitation12.2%(1) Estimates.Source: <strong>Eurostat</strong> (tps00077)Employment<strong>in</strong>centives24.2%EUROPE IN FIGURES — <strong>Eurostat</strong> <strong>yearbook</strong> <strong>2009</strong>291
Industry and servicesThe <strong>Europe</strong>an Commission’s enterprise policy aims to create a favourable environmentfor enterprises and bus<strong>in</strong>esses to thrive <strong>with</strong><strong>in</strong> <strong>Europe</strong>, thus creat<strong>in</strong>g the productivitygrowth, jobs and wealth that are necessary to achieve the objectives set by the revisedstrategy for growth and jobs that has superseded the Lisbon objectives.While competitiveness as a macro-economic concept is understood to mean <strong>in</strong>creasedstandards of liv<strong>in</strong>g and employment opportunities for those who wish to work, atthe level of <strong>in</strong>dividual enterprises or <strong>in</strong>dustrial sectors, competitiveness is more concerned<strong>with</strong> the issue of productivity growth. Enterprises have a variety of options toimprove their performance, such as tangible <strong>in</strong>vestment or spend<strong>in</strong>g on human capital,research and development, or other <strong>in</strong>tangible assets. This latter category coversnon-monetary assets created over time <strong>in</strong> the form of legal assets (such as patents orcopyrights, which protect <strong>in</strong>tellectual property) and competitive assets (such as collaboration),which can play an important role <strong>in</strong> determ<strong>in</strong><strong>in</strong>g the effectiveness andproductivity of an enterprise. Human capital is generally regarded as the primarysource of competitiveness <strong>in</strong> relation to <strong>in</strong>tangibles, re-enforc<strong>in</strong>g the belief that enterprisesneed to constantly <strong>in</strong>vest <strong>in</strong> their workforces, attract<strong>in</strong>g qualified staff, improv<strong>in</strong>gtheir skills, and ma<strong>in</strong>ta<strong>in</strong><strong>in</strong>g their motivation. Innovation is seen as a key elementtowards the competitiveness of enterprises, and the Competitiveness and InnovationFramework Programme (CIP) aims to support <strong>in</strong>novation <strong>in</strong>clud<strong>in</strong>g eco-<strong>in</strong>novation,see Chapter 1 for more details.EUROPE IN FIGURES — <strong>Eurostat</strong> <strong>yearbook</strong> <strong>2009</strong>293
8 Industry and services8.1 Bus<strong>in</strong>ess structuresThe legal basis for the <strong>Europe</strong>an Commission’sactivities <strong>with</strong> respect to enterprisepolicy is Article 157 of the EC Treaty,which ensures that the conditions necessaryfor <strong>in</strong>dustrial competitiveness exist.It also provides for conditions to encourageentrepreneurial <strong>in</strong>itiatives, particularlyamong small and medium-sized enterprises(SMEs). The EU seeks to:• reduce adm<strong>in</strong>istrative burden;• facilitate the rapid start-up of new enterprises,and;• create an environment more supportiveof bus<strong>in</strong>ess.In October 2007, the <strong>Europe</strong>an Commissionadopted a communication ‘Smalland medium-sized enterprises — Key fordeliver<strong>in</strong>g more growth and jobs: a midtermreview of modern SME policy’ (1) ,which outl<strong>in</strong>es progress s<strong>in</strong>ce 2005 <strong>in</strong>SME policy and notes encourag<strong>in</strong>g results<strong>in</strong> the ma<strong>in</strong>stream<strong>in</strong>g of SMEs’ <strong>in</strong>terests<strong>in</strong> policymak<strong>in</strong>g at both nationaland Community level.The bus<strong>in</strong>ess environment <strong>in</strong> which <strong>Europe</strong>anenterprises operate plays a significantrole <strong>in</strong> their potential successthrough factors such as access to capitalmarkets (<strong>in</strong> particular for venture capital),or the openness of markets. Ensur<strong>in</strong>g thatbus<strong>in</strong>esses can compete openly and fairlyis also important <strong>with</strong> respect to mak<strong>in</strong>g<strong>Europe</strong> an attractive place to <strong>in</strong>vest andwork <strong>in</strong>. Creat<strong>in</strong>g a positive climate <strong>in</strong>which entrepreneurs and bus<strong>in</strong>esses canflourish is considered by many as the keyto generat<strong>in</strong>g the growth and jobs that <strong>Europe</strong>needs. This is all the more important<strong>in</strong> the globalised economy, where somebus<strong>in</strong>esses have considerable leeway to selectwhere they wish to operate.IntroductionDespite the chang<strong>in</strong>g face of the bus<strong>in</strong>esseconomy, manufactur<strong>in</strong>g still plays a keyrole <strong>in</strong> <strong>Europe</strong>’s prosperity. The <strong>Europe</strong>anCommission adopted a Communicationon foster<strong>in</strong>g structural change: an <strong>in</strong>dustrialpolicy for an enlarged <strong>Europe</strong> (2)which rejected the claim that <strong>Europe</strong> wasexperienc<strong>in</strong>g a widespread process of de<strong>in</strong>dustrialisation.However, the comb<strong>in</strong>ationof a decl<strong>in</strong>e <strong>in</strong> the competitiveness of<strong>Europe</strong>an <strong>in</strong>dustry, and <strong>in</strong>creased <strong>in</strong>ternationalcompetition, were identified asthreats that could impede the process ofstructural change <strong>in</strong> <strong>Europe</strong>. The Communicationalso exam<strong>in</strong>ed how structuralchange could be brought aboutand fostered through better regulation,synergies between various Communitypolicies, and strengthen<strong>in</strong>g the sectoraldimension of <strong>in</strong>dustrial policy.Small and medium-sized enterprises(SMEs) are often referred to as the backboneof the <strong>Europe</strong>an economy, provid<strong>in</strong>ga potential source for jobs and economicgrowth. The <strong>Europe</strong>an Commission’snew strategy for SMEs aims to apply the‘th<strong>in</strong>k small first’ pr<strong>in</strong>ciple to make thebus<strong>in</strong>ess environment easier for SMEs.Policy is concentrated <strong>in</strong> five priorityareas, cover<strong>in</strong>g the promotion of entrepreneurshipand skills, the improvementof SMEs’ access to markets, cutt<strong>in</strong>g redtape, the improvement of SMEs’ growthpotential, and strengthen<strong>in</strong>g dialogueand consultation <strong>with</strong> SME stakeholders.A special SME envoy has been set-up <strong>in</strong>the <strong>Europe</strong>an Commission Directorate-General for Enterprise and Industry <strong>with</strong>(1) COM(2007) 592; http://ec.europa.eu/enterprise/entrepreneurship/docs/com_2007_0592_en.pdf.(2) COM(2004) 274 f<strong>in</strong>al; http://eur-lex.europa.eu/LexUriServ/site/en/com/2004/com2004_0274en01.pdf.294 EUROPE IN FIGURES — <strong>Eurostat</strong> <strong>yearbook</strong> <strong>2009</strong>
Industry and services 8the objective of better <strong>in</strong>tegrat<strong>in</strong>g theSME dimension <strong>in</strong>to EU policies. Via the<strong>Europe</strong>an charter for small enterprises,Member States have also committedthemselves to develop an SME-friendlybus<strong>in</strong>ess environment, <strong>in</strong> particularthrough learn<strong>in</strong>g from each other’s experience<strong>in</strong> design<strong>in</strong>g and implement<strong>in</strong>gpolicies, so each can apply the best practiceto their own situations.<strong>Eurostat</strong>’s structural bus<strong>in</strong>ess statistics(SBS) describe the structure, conduct andperformance of economic activities, downto the most detailed activity level (severalhundred sectors). SBS <strong>with</strong> a breakdownby size-class is the ma<strong>in</strong> source of datafor an analysis of SMEs. SBS may be usedto answer questions, such as: how muchwealth and how many jobs are created <strong>in</strong>an activity?; is there a shift from the <strong>in</strong>dustrialsector to the services sector and<strong>in</strong> which specific activities is this trendmost notable?; which countries are relativelyspecialised <strong>in</strong> the manufacture ofaerospace equipment?; what is the averagewage of an employee <strong>with</strong><strong>in</strong> the hotelsand restaurants sector?; how productive ischemicals manufactur<strong>in</strong>g and how doesit fare <strong>in</strong> terms of profitability? Withoutthis structural <strong>in</strong>formation, short-termdata on the economic cycle would lackbackground and be hard to <strong>in</strong>terpret.Def<strong>in</strong>itions and data availabilitySBS covers the ‘bus<strong>in</strong>ess economy’,which <strong>in</strong>cludes <strong>in</strong>dustry, constructionand many services (NACE Sections C toK). Note that f<strong>in</strong>ancial services (NACESection J) are treated separately becauseof their specific nature and the limitedavailability of most types of standardbus<strong>in</strong>ess statistics <strong>in</strong> this area. As such,the term ‘non-f<strong>in</strong>ancial bus<strong>in</strong>ess economy’is generally used <strong>with</strong><strong>in</strong> bus<strong>in</strong>essstatistics to refer to economic activitiescovered by Sections C to I and K of NACERev. 1.1 and the units that carry out thoseactivities. Note that SBS do not cover agriculture,forestry and fish<strong>in</strong>g, nor publicadm<strong>in</strong>istration and (largely) non-marketservices such as education and health.SBS describe the bus<strong>in</strong>ess economythrough the observation of units engaged<strong>in</strong> an economic activity; the unit <strong>in</strong> SBSis generally the enterprise. An enterprisecarries out one or more activities at oneor more locations and may comprise oneor more legal units. Note that enterprisesthat are active <strong>in</strong> more than one economicactivity (and the value added andturnover they generate and the personsthey employ, etc.) are classified under theNACE head<strong>in</strong>g (Statistical Classificationof Economic Activities <strong>in</strong> the <strong>Europe</strong>anCommunity) which is their pr<strong>in</strong>cipal activity,normally the one that generates thelargest amount of value added. An abbreviatedlist of the NACE Rev. 1.1 classificationis provided <strong>in</strong> an annex at the end ofthe publication. Note that a revised classification(NACE Rev. 2) was adopted atthe end of 2006, and its implementationhas s<strong>in</strong>ce begun – however, the first referenceyear for data us<strong>in</strong>g this new classificationwill be 2008.SBS are collected <strong>with</strong><strong>in</strong> the frameworkof a Council Regulation on StructuralBus<strong>in</strong>ess Statistics (EC, EURATOM)No. 58/97 of December 1996 (and lateramendments); accord<strong>in</strong>g to the def<strong>in</strong>itions,breakdowns, deadl<strong>in</strong>es for datadelivery, and various quality aspectsEUROPE IN FIGURES — <strong>Eurostat</strong> <strong>yearbook</strong> <strong>2009</strong>295
8 Industry and servicesspecified <strong>in</strong> the Commission Regulationsimplement<strong>in</strong>g it. Note that the breakdownof economic activities is very detailedand that the data <strong>in</strong>cluded <strong>in</strong> theSBS doma<strong>in</strong> of <strong>Eurostat</strong>’s dissem<strong>in</strong>ationdatabase goes <strong>in</strong>to much more detail thanthe short set of <strong>in</strong>formation which can(given space constra<strong>in</strong>ts) be presented <strong>in</strong>this <strong>yearbook</strong>.SBS conta<strong>in</strong> a comprehensive set of basicvariables describ<strong>in</strong>g bus<strong>in</strong>ess demographicand employment characteristics,as well as monetary variables (ma<strong>in</strong>lyconcern<strong>in</strong>g operat<strong>in</strong>g <strong>in</strong>come and expenditureor <strong>in</strong>vestment). In addition,a set of derived <strong>in</strong>dicators are compiled:for example, <strong>in</strong> the form of ratios of monetarycharacteristics or per head values.The variables presented <strong>in</strong> this section aredef<strong>in</strong>ed as follows:• The number of enterprises is a countof the number of enterprises activedur<strong>in</strong>g at least a part of the referenceperiod; the enterprise is the smallestcomb<strong>in</strong>ation of legal units that is anorganisational unit produc<strong>in</strong>g goodsor services, which benefits from a certa<strong>in</strong>degree of autonomy <strong>in</strong> decisionmak<strong>in</strong>g,especially for the allocationof its current resources. An enterprisecarries out one or more activities atone or more locations. An enterprisemay be a sole legal unit.• Value added represents the differencebetween the value of what is producedand <strong>in</strong>termediate consumption enter<strong>in</strong>gthe production, less subsidies onproduction and costs, taxes and levies.Value added at factor costs is def<strong>in</strong>edas the gross <strong>in</strong>come from operat<strong>in</strong>gactivities after adjust<strong>in</strong>g for operat<strong>in</strong>gsubsidies and <strong>in</strong>direct taxes; value adjustments(such as depreciation) arenot subtracted. It can be calculatedfrom turnover, plus capitalised production,plus other operat<strong>in</strong>g <strong>in</strong>come,plus or m<strong>in</strong>us the changes <strong>in</strong> stocks,m<strong>in</strong>us the purchases of goods andservices, m<strong>in</strong>us other taxes on productswhich are l<strong>in</strong>ked to turnover butnot deductible, m<strong>in</strong>us the duties andtaxes l<strong>in</strong>ked to production. Alternativelyit can be calculated from grossoperat<strong>in</strong>g surplus by add<strong>in</strong>g personnelcosts.• The number of persons employed isdef<strong>in</strong>ed as the total number of personswho work <strong>in</strong> the observationunit (<strong>in</strong>clusive of work<strong>in</strong>g proprietors,partners work<strong>in</strong>g regularly <strong>in</strong>the unit and unpaid family workers),as well as persons who work outsidethe unit who belong to it and are paidby it (for example, sales representatives,delivery personnel, repair andma<strong>in</strong>tenance teams); it excludes manpowersupplied to the unit by otherenterprises, persons carry<strong>in</strong>g outrepair and ma<strong>in</strong>tenance work <strong>in</strong> theenquiry unit on behalf of other enterprises,as well as those on compulsorymilitary service.• Average personnel costs (or unit labourcosts) equal personnel costsdivided by the number of employees(paid persons <strong>with</strong> an employmentcontract). Personnel costs are def<strong>in</strong>ed296 EUROPE IN FIGURES — <strong>Eurostat</strong> <strong>yearbook</strong> <strong>2009</strong>
Industry and services 8as the total remuneration, <strong>in</strong> cash or<strong>in</strong> k<strong>in</strong>d, payable by an employer toan employee (regular and temporaryemployees as well as home workers)<strong>in</strong> return for work done by the latterdur<strong>in</strong>g the reference period; personnelcosts also <strong>in</strong>clude taxes and employees’social security contributionsreta<strong>in</strong>ed by the unit as well as theemployer’s compulsory and voluntarysocial contributions.• Apparent labour productivity equalsvalue added divided by the number ofpersons employed.The SBS data collection consists of a commonmodule (Annex 1), <strong>in</strong>clud<strong>in</strong>g a setof basic statistics for all activities, as wellas six sector-specific annexes cover<strong>in</strong>g amore extended list of characteristics. Thesector-specific annexes are: <strong>in</strong>dustry (Annex2), distributive trades (Annex 3), construction(Annex 4), <strong>in</strong>surance services(Annex 5), credit <strong>in</strong>stitutions (Annex 6)and pension funds (Annex 7). A detailedoverview of the availability of characteristicsby sector is found <strong>in</strong> CommissionRegulation No 2701/98 (3) .SBS are also available broken down byregion or by enterprise size class. InSBS, size classes are def<strong>in</strong>ed based on thenumber of persons employed, except forspecific series <strong>with</strong><strong>in</strong> retail trade activitieswhere turnover size classes can also beused. A limited set of the standard SBSvariables (number of enterprises, turnover,persons employed, value added, etc.)is available mostly down to the 3-digit(group) level of the NACE Rev. 1.1 classificationdivided by size class. Accord<strong>in</strong>gto Commission Recommendation2003/361/EC adopted on 6 May 2003,small and medium-sized enterprises areclassified <strong>with</strong> regard to their number ofemployees, annual turnover, and their<strong>in</strong>dependence. For statistical purposes,small and medium-sized enterprises aregenerally def<strong>in</strong>ed as those enterprisesemploy<strong>in</strong>g fewer than 250 people. Thenumber of size classes available varies accord<strong>in</strong>gto the activity under consideration.However, the ma<strong>in</strong> groups used <strong>in</strong>this publication for present<strong>in</strong>g the resultsare:• small and medium-sized enterprises(SMEs): <strong>with</strong> 1-249 persons employed,further divided <strong>in</strong>to• micro enterprises: <strong>with</strong> less than10 persons employed;• small enterprises: <strong>with</strong> 10 to 49persons employed;• medium-sized enterprises: <strong>with</strong>50 to 249 persons employed;• large enterprises: <strong>with</strong> 250 or morepersons employed.(3) http://eur-lex.europa.eu/LexUriServ/LexUriServ.do?uri=CONSLEG:1998R2701:20031019:EN:PDF.EUROPE IN FIGURES — <strong>Eurostat</strong> <strong>yearbook</strong> <strong>2009</strong>297
8 Industry and servicesStructural bus<strong>in</strong>ess statistics also provide<strong>in</strong>formation on a number of specialtopics, of which bus<strong>in</strong>ess demographyis one. Bus<strong>in</strong>ess demography statisticspresent data on the active population ofenterprises, their birth, survival (followedup to five years after birth) and death.Special attention is paid to the impactof these demographic events on employmentlevels. Bus<strong>in</strong>ess demography variablespresented <strong>in</strong> this section are def<strong>in</strong>edas follows:• an enterprise birth amounts to thecreation of a comb<strong>in</strong>ation of productionfactors <strong>with</strong> the restriction thatno other enterprises are <strong>in</strong>volved <strong>in</strong>the event. Births do not <strong>in</strong>clude entries<strong>in</strong>to the population due to mergers,break-ups, split-off or restructur<strong>in</strong>gof a set of enterprises, nor dothe statistics <strong>in</strong>clude entries <strong>in</strong>to asub-population result<strong>in</strong>g only from achange of activity.• an enterprise death amounts to thedissolution of a comb<strong>in</strong>ation of productionfactors <strong>with</strong> the restrictionthat no other enterprises are <strong>in</strong>volved<strong>in</strong> the event. An enterprise is <strong>in</strong>cluded<strong>in</strong> the count of deaths only if it is notreactivated <strong>with</strong><strong>in</strong> two years. Equally,a reactivation <strong>with</strong><strong>in</strong> two years is notcounted as a birth.• survival occurs if an enterprise is active<strong>in</strong> terms of employment and/orturnover <strong>in</strong> the year of birth and thefollow<strong>in</strong>g year(s). Two types of survivalcan be dist<strong>in</strong>guished: an enterpriseborn <strong>in</strong> year x is considered tohave survived <strong>in</strong> year x+1 if it is active<strong>in</strong> terms of turnover and/or employment<strong>in</strong> any part of year x+1 (survival<strong>with</strong>out change); an enterpriseis also considered to have survived ifthe l<strong>in</strong>ked legal unit(s) have ceased tobe active, but their activity has beentaken over by a new legal unit set upspecifically to take over the factorsof production of that enterprise (survivalby take-over). The <strong>in</strong>formationpresented <strong>in</strong> this publication focuseson the two-year survival rate.Ma<strong>in</strong> f<strong>in</strong>d<strong>in</strong>gsThere were just over 19.6 million activeenterprises <strong>with</strong><strong>in</strong> the EU-27’s non-f<strong>in</strong>ancialbus<strong>in</strong>ess economy (def<strong>in</strong>ed as <strong>in</strong>dustry,construction, distributive trades andservices, and therefore exclud<strong>in</strong>g f<strong>in</strong>ancialservices) <strong>in</strong> 2005. More than three<strong>in</strong> every ten (31.9 %) of these enterpriseswere active <strong>in</strong> the distributive trades sector(composed of motor trades, wholesaletrade, and retail trade and repair), whichwere also relatively labour-<strong>in</strong>tensive activities,account<strong>in</strong>g for almost one quarterof the EU-27’s non-f<strong>in</strong>ancial bus<strong>in</strong>esseconomy workforce <strong>in</strong> 2005. It should benoted, though, that the employment datapresented here are head counts and not,for example, full-time equivalents, andthere may be a significant proportion ofpersons work<strong>in</strong>g part-time <strong>in</strong> distributivetrades. In terms of wealth creation,the manufactur<strong>in</strong>g sector generated thelargest proportion of the non-f<strong>in</strong>ancialbus<strong>in</strong>ess economy’s value added (30.4 %),followed by real estate, rent<strong>in</strong>g and bus<strong>in</strong>essactivities (21.9 %).298 EUROPE IN FIGURES — <strong>Eurostat</strong> <strong>yearbook</strong> <strong>2009</strong>
Industry and services 8Average personnel costs reached EUR41 000 per employee <strong>in</strong> the EU-27’s electricity,gas and water supply sector, a levelthat was almost 2.7 times that for hotelsand restaurants and 1.8 times that forthe distributive trades <strong>in</strong> 2005, reflect<strong>in</strong>g<strong>in</strong> large part the high rates of part-timeemployment <strong>in</strong> many service sectors. Thevariation <strong>in</strong> wages and salaries was moremarked between countries. For example,<strong>in</strong> manufactur<strong>in</strong>g, average personnelcosts were highest <strong>in</strong> Germany at EUR55 000 per employee, over 20 times thevalue recorded <strong>in</strong> the Member State <strong>with</strong>the lowest average, Bulgaria (EUR 2 400per employee).SBS broken down by enterprise size class(def<strong>in</strong>ed <strong>in</strong> terms of the number of personsemployed) show that large enterpriseswere particularly dom<strong>in</strong>ant <strong>with</strong><strong>in</strong>m<strong>in</strong><strong>in</strong>g and quarry<strong>in</strong>g; electricity, gasand water supply; and transport, storageand communication. These activities arecharacterised by relatively high m<strong>in</strong>imumefficient scales of production and/or by (transmission) networks that arerarely duplicated due to their high fixed<strong>in</strong>vestment cost. On the other hand, smalland medium-sized enterprises (SMEs)were relatively important <strong>with</strong><strong>in</strong> the activitiesof construction and hotels andrestaurants, where enterprises <strong>with</strong> lessthan 250 persons employed accounted formore than three quarters of the wealthcreated (value added) and the workforce.There are significant changes <strong>in</strong> the stockof enterprises <strong>with</strong><strong>in</strong> the bus<strong>in</strong>ess economyfrom one year to the next, reflect<strong>in</strong>gthe level of competition and entrepreneurialspirit. Newly born enterprisesaccounted for at least one out of every 10active enterprises <strong>in</strong> Romania, the UnitedK<strong>in</strong>gdom, Portugal, Bulgaria, Latvia,Luxembourg, Estonia and Spa<strong>in</strong> <strong>in</strong> 2005.Figure 8.1: Breakdown of number of enterprises <strong>in</strong> the non-f<strong>in</strong>ancial bus<strong>in</strong>ess economy,EU-27, 2005(%)Transport, storage andcommunication6.1%Hotels andrestaurants8.4%Manufactur<strong>in</strong>g11.8%Electricity, gasand water supply (1)0.1%Distributivetrades31.9%M<strong>in</strong><strong>in</strong>gand quarry<strong>in</strong>g0.1%Construction14.2%Real estate,rent<strong>in</strong>g andbus<strong>in</strong>ess activities27.4%(1) Estimate.Source: <strong>Eurostat</strong> (t<strong>in</strong>00050)EUROPE IN FIGURES — <strong>Eurostat</strong> <strong>yearbook</strong> <strong>2009</strong>299
8 Industry and servicesTable 8.1: Value added for non-f<strong>in</strong>ancial bus<strong>in</strong>ess economy sectors, 2005(EUR million)Elec.,gas &watersupplyTrans.,storage &communicationRealestate,rent<strong>in</strong>g &bus<strong>in</strong>essactivitiesM<strong>in</strong><strong>in</strong>g &quarry<strong>in</strong>gManufactur<strong>in</strong>gConstructionDistrib.tradesHotels &restaur.EU-27 83 059 1 629 914 190 000 465 771 1 022 427 167 792 629 936 1 171 191Belgium 310 48 132 5 358 10 249 29 140 3 673 20 107 26 459Bulgaria 378 3 209 972 732 1 714 282 1 876 683Czech Republic (1) 1 468 26 490 4 880 5 288 11 423 1 259 7 566 9 233Denmark 6 099 25 717 2 890 8 782 21 829 2 128 14 599 28 116Germany 5 981 429 471 41 633 55 527 187 228 20 803 113 369 226 967Estonia 88 1 592 336 547 1 317 136 901 949Ireland 657 34 121 : 5 828 14 745 3 308 10 408 22 567Greece 865 14 270 3 228 5 844 19 265 3 186 9 631 8 346Spa<strong>in</strong> 2 341 125 049 13 951 83 431 99 707 23 300 54 068 92 760France 3 943 214 014 23 763 62 977 144 972 26 866 94 525 188 929Italy 7 411 208 907 18 917 57 953 108 783 18 984 71 508 99 684Cyprus 41 1 089 268 1 072 1 579 847 1 034 :Latvia 33 1 481 319 587 1 970 154 1 402 874Lithuania 87 2 535 591 883 1 781 133 1 325 983Luxembourg 28 2 662 240 1 457 2 272 469 2 568 3 361Hungary 168 16 791 2 309 2 329 6 636 681 5 563 5 818Malta : : : : : : : :Netherlands 5 701 57 637 : 22 766 54 743 6 343 32 177 58 102Austria 914 41 601 4 842 11 552 25 182 5 952 15 044 23 544Poland 5 745 48 298 8 810 7 242 24 132 1 361 13 473 12 924Portugal 549 18 510 3 153 8 417 16 157 2 846 8 987 10 308Romania 2 303 9 130 2 060 1 984 5 272 424 3 990 3 024Slovenia 116 5 803 627 1 192 2 909 448 1 492 1 721Slovakia 188 5 868 2 238 811 2 488 145 1 854 1 518F<strong>in</strong>land 306 30 078 2 915 6 541 13 004 1 675 8 694 12 199Sweden 1 354 49 948 6 456 10 959 26 622 3 110 15 991 35 329United K<strong>in</strong>gdom 36 144 210 720 31 044 91 621 198 626 39 125 117 615 296 525Norway 57 995 19 774 4 304 8 797 18 524 2 211 16 138 20 345(1) 2006.Source: <strong>Eurostat</strong> (t<strong>in</strong>00002)300 EUROPE IN FIGURES — <strong>Eurostat</strong> <strong>yearbook</strong> <strong>2009</strong>
Industry and services 8Table 8.2: Number of persons employed for non-f<strong>in</strong>ancial bus<strong>in</strong>ess economy sectors, 2005(1 000)Elec.,gas &watersupplyTrans.,storage &communicationRealestate,rent<strong>in</strong>g &bus<strong>in</strong>essactivitiesM<strong>in</strong><strong>in</strong>g &quarry<strong>in</strong>gManufactur<strong>in</strong>gConstructionDistrib.tradesHotels &restaur.EU-27 772 34 644 1 600 13 548 30 964 8 846 11 824 24 500Belgium 3 615 24 252 606 159 273 474Bulgaria 30 645 58 158 449 111 215 150Czech Republic (1) 44 1 354 57 393 694 158 337 501Denmark 3 410 17 189 448 100 188 359Germany 90 7 171 278 1 515 4 411 1 176 1 900 4 131Estonia 6 131 9 41 94 17 44 56Ireland 6 217 : 50 286 136 89 191Greece 13 390 25 310 942 280 247 286Spa<strong>in</strong> 40 2 599 66 2 658 3 286 1 199 1 028 2 512France 34 3 737 196 1 538 3 245 888 1 547 3 203Italy 42 4 610 118 1 810 3 391 1 083 1 220 2 712Cyprus 1 37 2 37 59 34 24 :Latvia 3 167 16 62 178 29 80 88Lithuania 3 266 27 106 255 35 96 87Luxembourg 0 37 1 34 42 15 23 53Hungary 6 794 57 235 586 126 269 447Malta : : : : : : : :Netherlands 9 768 27 471 1 320 302 452 1 330Austria 6 620 32 250 601 231 241 387Poland 189 2 473 206 648 2 187 224 723 926Portugal 15 869 23 481 868 270 192 558Romania 134 1 621 149 388 904 113 362 367Slovenia 4 233 12 66 108 30 52 67Slovakia 9 405 40 69 180 20 102 104F<strong>in</strong>land 4 407 15 130 260 52 158 206Sweden 9 797 30 253 582 120 313 534United K<strong>in</strong>gdom 68 3 246 131 1 392 4 948 1 916 1 634 4 776Norway 38 254 14 146 350 81 164 236(1) 2006.Source: <strong>Eurostat</strong> (t<strong>in</strong>00004)EUROPE IN FIGURES — <strong>Eurostat</strong> <strong>yearbook</strong> <strong>2009</strong>301
8 Industry and servicesTable 8.3: Average personnel costs for non-f<strong>in</strong>ancial bus<strong>in</strong>ess economy sectors, 2005(EUR 1 000 per employee)Elec.,gas &watersupplyTrans.,storage &communicationRealestate,rent<strong>in</strong>g &bus<strong>in</strong>essactivitiesM<strong>in</strong><strong>in</strong>g &quarry<strong>in</strong>gManufactur<strong>in</strong>gConstructionDistrib.tradesHotels &restaur.EU-27 30.2 33.9 41.0 26.9 23.3 15.3 32.4 30.5Belgium 44.9 49.4 89.3 36.3 38.1 19.2 47.8 42.6Bulgaria 5.0 2.4 5.8 2.2 1.9 1.5 4.2 2.8Czech Republic (1) 14.8 11.1 16.1 11.0 10.9 6.7 12.6 13.4Denmark 59.0 44.5 39.6 38.4 33.8 16.5 42.1 38.3Germany 62.3 55.0 80.3 32.3 26.9 12.7 33.8 30.5Estonia 9.0 7.6 10.0 10.3 7.6 5.1 8.9 8.3Ireland 48.5 41.9 : 47.1 26.9 17.3 40.1 37.6Greece 40.2 24.3 44.7 16.0 18.0 13.9 35.6 29.7Spa<strong>in</strong> 33.0 29.7 50.5 25.3 22.3 17.1 31.1 22.8France 49.5 42.8 61.6 36.5 34.3 26.1 41.9 43.2Italy 47.0 33.1 49.9 26.3 28.6 18.0 37.2 27.5Cyprus 28.1 19.4 39.2 21.3 19.3 17.8 29.2 :Latvia 4.8 4.2 8.0 3.8 3.6 2.5 5.5 4.9Lithuania 7.8 5.0 8.4 5.6 4.5 2.8 6.1 5.7Luxembourg 41.9 47.6 74.8 34.6 37.7 24.0 53.2 38.8Hungary 12.8 10.4 16.5 6.7 7.9 5.0 12.2 10.2Malta : : : : : : : :Netherlands 60.6 46.1 : 44.7 27.3 15.2 39.7 29.5Austria 52.5 42.8 69.6 35.9 31.0 21.1 40.4 36.8Poland 16.6 7.6 13.0 6.6 5.9 4.3 9.3 7.5Portugal 15.8 13.6 37.5 11.7 12.1 8.6 23.6 12.1Romania 7.9 3.4 6.3 3.2 2.6 2.3 4.9 3.6Slovenia 26.2 17.2 24.7 17.7 18.0 12.6 20.1 22.7Slovakia 8.1 7.7 11.0 6.8 7.5 4.8 8.6 9.0F<strong>in</strong>land 38.3 43.0 49.2 37.9 33.3 26.2 38.3 39.0Sweden 53.6 46.2 56.2 39.8 39.2 24.8 41.6 47.7United K<strong>in</strong>gdom 70.0 39.5 51.1 36.8 24.0 13.4 40.8 35.2Norway 110.9 54.9 64.4 51.0 37.7 23.7 48.7 52.2(1) 2006.Source: <strong>Eurostat</strong> (t<strong>in</strong>00049)302 EUROPE IN FIGURES — <strong>Eurostat</strong> <strong>yearbook</strong> <strong>2009</strong>
Industry and services 8Figure 8.2: Value added by enterprise size class, EU-27, 2005 (1)(% of sectoral total)100%75%50%25%0%M<strong>in</strong><strong>in</strong>g &quarry<strong>in</strong>gManufactur<strong>in</strong>gElectricity,gas & watersupplyConstructionDistributivetradesHotels &restaurantsLarge (250+ persons employed)Medium (50-249 persons employed)Small (10-49 persons employed)Micro (1-9 persons employed)Transport,storage &communicationReal estate,rent<strong>in</strong>g &bus<strong>in</strong>essactivities(1) Estimates.Source: <strong>Eurostat</strong> (t<strong>in</strong>00053 )Figure 8.3: Employment by enterprise size class, EU-27, 2005 (1)(% of sectoral total)100%75%50%25%0%Manufactur<strong>in</strong>gElectricity,gas & watersupplyConstructionDistributivetradesHotels &restaurantsLarge (250+ persons employed)Medium (50-249 persons employed)Small (10-49 persons employed)Micro (1-9 persons employed)Transport,storage &communicationReal estate,rent<strong>in</strong>g &bus<strong>in</strong>essactivities(1) Estimates; m<strong>in</strong><strong>in</strong>g and quarry<strong>in</strong>g: not available due to <strong>in</strong>complete data.Source: <strong>Eurostat</strong> (t<strong>in</strong>00052)EUROPE IN FIGURES — <strong>Eurostat</strong> <strong>yearbook</strong> <strong>2009</strong>303
8 Industry and servicesTable 8.4: Value added by enterprise size class, non-f<strong>in</strong>ancial bus<strong>in</strong>ess economy, 2005Value addedMicro(1-9 personsemployed)Share <strong>in</strong> total value added (%)Small(10-49 personsemployed)Medium-sized(50-249 personsemployed)Large(250+ personsemployed)(EUR million)EU-27 (1) 5 360 072 : 18.9 17.8 42.3Belgium 143 426 : : : :Bulgaria 9 845 14.3 17.4 21.5 46.8Czech Republic 58 084 19.2 16.5 19.7 44.6Denmark 110 161 26.5 : : :Germany 1 080 980 15.4 : : :Estonia 5 865 20.2 24.9 : :Ireland : : : : :Greece 64 634 36.2 : : :Spa<strong>in</strong> 494 607 27.6 24.2 16.8 31.5France 759 988 20.2 18.5 15.6 45.8Italy 592 147 31.8 23.2 16.0 29.1Cyprus 6960 : : : :Latvia 6 819 17.2 : 27.9 :Lithuania 8 318 12.1 : : :Luxembourg 12 871 23.8 : : :Hungary 40 295 15.7 16.3 : :Malta : : : : :Netherlands : : : : :Austria 128 631 18.6 : : :Poland 121 985 16.8 11.5 20.1 51.6Portugal 68 926 24.4 22.0 : :Romania 28 188 : 15.0 19.3 :Slovenia 14 267 19.7 : : :Slovakia 15 109 10.7 15.3 18.5 55.5F<strong>in</strong>land : : : : :Sweden 149 766 20.2 17.4 17.9 44.4United K<strong>in</strong>gdom 1 021 418 18.9 15.9 16.8 48.4(1) Rounded estimates based on non-confidential data.Source: <strong>Eurostat</strong> (sbs_sc_1b_se02, sbs_sc_3ce_tr02, sbs_sc_4d_co02, sbs_sc_2d_mi02, sbs_sc_2d_dade02, sbs_sc_2d_dfdn02,sbs_sc_2d_el02)304 EUROPE IN FIGURES — <strong>Eurostat</strong> <strong>yearbook</strong> <strong>2009</strong>
Industry and services 8Table 8.5: Number of persons employed by enterprise size class,non-f<strong>in</strong>ancial bus<strong>in</strong>ess economy, 2005Number ofpersonsemployedMicro(1-9 personsemployed)Share <strong>in</strong> total employment (%)Small(10-49 personsemployed)Medium-sized(50-249 personsemployed)Large(250+ personsemployed)(1 000)EU-27 (1) 126 698 : : 16.8 32.9Belgium 2407 : : : :Bulgaria 1 816 28.4 22.0 22.2 27.4Czech Republic 3 502 29.6 19.1 19.5 31.8Denmark 1 714 20.1 : : :Germany 20 672 18.9 22.1 19.2 39.8Estonia 397 23.2 27.7 : :Ireland : : : : :Greece 2 492 56.2 : : :Spa<strong>in</strong> 13 387 38.6 25.7 14.5 21.3France 14 388 23.9 21.0 16.5 38.6Italy 14 987 47.1 21.7 12.4 18.7Cyprus 211 : : : :Latvia 623 24.0 26.2 25.4 24.3Lithuania 875 21.8 : : :Luxembourg 205 19.9 : : :Hungary 2 520 35.8 18.9 16.2 :Malta : : : : :Netherlands 4 679 29.2 21.1 17.0 32.7Austria 2 367 25.2 : : :Poland 7 576 39.2 12.0 18.7 30.2Portugal 3 276 42.6 23.1 : :Romania 4 038 20.1 18.5 22.3 39.0Slovenia 572 27.5 : : :Slovakia 929 13.0 17.5 23.4 46.0F<strong>in</strong>land : : : : :Sweden 2 638 24.9 20.4 17.9 36.8United K<strong>in</strong>gdom 18 111 21.4 17.5 15.2 46.0(1) Rounded estimates based on non-confidential data.Source: <strong>Eurostat</strong> (sbs_sc_1b_se02, sbs_sc_3ce_tr02, sbs_sc_4d_co02, sbs_sc_2d_mi02, sbs_sc_2d_dade02, sbs_sc_2d_dfdn02,sbs_sc_2d_el02)EUROPE IN FIGURES — <strong>Eurostat</strong> <strong>yearbook</strong> <strong>2009</strong>305
8 Industry and servicesTable 8.6: Enterprise demography, bus<strong>in</strong>ess economy, 2005Enterprise birth rates(% of enterprisebirths amongactive enterprises)Enterprise death rates(% of enterprisedeaths amongactive enterprises)Enterprise survival(% of enterprise birthsof year n-2 which arestill active <strong>in</strong> year n)Belgium : : :Bulgaria 11.9 : :Czech Republic 8.7 : 61.1Denmark : : :Germany : : :Estonia 11.0Ireland : 10.7 65.6Greece : : :Spa<strong>in</strong> 10.4 6.9 71.9France : : :Italy 7.8 : 75.4Cyprus 7.1 : :Latvia 11.5 3.9 69.4Lithuania : : :Luxembourg 11.1 : 73.9Hungary 9.0 : 66.2Malta : : :Netherlands 9.8 : 73.1Austria : : :Poland : : :Portugal 13.3 : :Romania 18.3 9.6 78.6Slovenia 8.8 4.4 82.5Slovakia 7.3 : 72.8F<strong>in</strong>land 8.3 : 66.7Sweden 7.0 5.6 85.8United K<strong>in</strong>gdom 13.7 10.9 81.2Norway (1) 9.8 : :Switzerland (2) 3.6 3.5 70.7(1) 2002.(2) Birth rate and death rate, 2004.Source: <strong>Eurostat</strong> (tsier150)306 EUROPE IN FIGURES — <strong>Eurostat</strong> <strong>yearbook</strong> <strong>2009</strong>
Industry and services 88.2 Industry and constructionIntroductionIn its mid-term review of <strong>in</strong>dustrial policy(4) , the <strong>Europe</strong>an Commission identifiedglobalisation and technologicalchange as key challenges for <strong>Europe</strong>an<strong>in</strong>dustry. Industrial policy <strong>with</strong><strong>in</strong> the EUis designed to complement measures takenby the Member States. Whether or nota bus<strong>in</strong>ess succeeds depends ultimatelyon the vitality and strength of the bus<strong>in</strong>essitself, but the environment <strong>in</strong> whichit operates can help or harm its prospects,<strong>in</strong> particular when faced <strong>with</strong> the challengesof globalisation and <strong>in</strong>tense <strong>in</strong>ternationalcompetition.A Communication on <strong>in</strong>dustrial policy<strong>in</strong> 2005 was based for the first time on an<strong>in</strong>tegrated approach: address<strong>in</strong>g sectorspecificas well as common issues. S<strong>in</strong>cethis date, the overall performance of <strong>Europe</strong>an<strong>in</strong>dustry cont<strong>in</strong>ued to developfavourably aga<strong>in</strong>st a background of an<strong>in</strong>creas<strong>in</strong>gly <strong>in</strong>tegrated world and the accelerat<strong>in</strong>gpace of technological change.The Commission’s new <strong>in</strong>dustrial policy<strong>in</strong>cludes seven new <strong>in</strong>itiatives on competitiveness,energy and the environment,<strong>in</strong>tellectual property rights, better regulation,<strong>in</strong>dustrial research and <strong>in</strong>novation,market access, skills, and manag<strong>in</strong>gstructural change. Seven additional <strong>in</strong>itiativesare targeted at key strategic sectors,<strong>in</strong>clud<strong>in</strong>g pharmaceuticals, defencerelated<strong>in</strong>dustries, and <strong>in</strong>formation andcommunication technologies.Def<strong>in</strong>itions and data availabilityFor background <strong>in</strong>formation relat<strong>in</strong>g tostructural bus<strong>in</strong>ess statistics (SBS), <strong>in</strong>clud<strong>in</strong>gdef<strong>in</strong>itions of value added andpersons employed, refer to the section titled‘def<strong>in</strong>itions and data availability’ <strong>in</strong>the previous section (8.1 Bus<strong>in</strong>ess structures).Additional variables presented <strong>in</strong>this section are def<strong>in</strong>ed as follows:• The wage adjusted labour productivityratio is def<strong>in</strong>ed as: (value added atfactor cost/personnel costs) * (numberof employees/number of persons employed);expressed as a percentage.• The gross operat<strong>in</strong>g rate is def<strong>in</strong>ed as:the size of the gross operat<strong>in</strong>g surplusrelative to turnover, and is one measureof profitability; the gross operat<strong>in</strong>gsurplus is the surplus generatedby operat<strong>in</strong>g activities after the labourfactor <strong>in</strong>put has been recompensed (itcan be calculated from value addedat factor cost less personnel costs);turnover is often referred to as sales;capital-<strong>in</strong>tensive activities will tendto report higher shares of the grossoperat<strong>in</strong>g surplus <strong>in</strong> turnover.PRODCOM (PRODuction COMmunautaire)is a system for the collection anddissem<strong>in</strong>ation of statistics on the productionof <strong>in</strong>dustrial (ma<strong>in</strong>ly manufactured)goods, both <strong>in</strong> value and quantity terms.It is based on a list of products called theProdcom List which consists of about4 500 head<strong>in</strong>gs relat<strong>in</strong>g to <strong>in</strong>dustrial(4) COM(2007) 374; http://ec.europa.eu/enterprise/enterprise_policy/<strong>in</strong>dustry/doc/mtr_<strong>in</strong>_pol_en.pdf.EUROPE IN FIGURES — <strong>Eurostat</strong> <strong>yearbook</strong> <strong>2009</strong>307
8 Industry and servicesproducts. These products are detailed atan 8-digit level, <strong>with</strong> the first four digitsreferr<strong>in</strong>g to the equivalent NACE class,and the next two digits referr<strong>in</strong>g to subcategories<strong>with</strong><strong>in</strong> the statistical classificationof products by activity <strong>in</strong> the <strong>Europe</strong>anEconomic Community (CPA). Mosthead<strong>in</strong>gs correspond to one or more comb<strong>in</strong>ednomenclature (CN) codes.Aside from SBS and PRODCOM, a largeproportion of the statistics presented <strong>in</strong>this section are derived from short-termbus<strong>in</strong>ess statistics (STS). Among these,some of the most important <strong>in</strong>dicatorsare a set of pr<strong>in</strong>cipal <strong>Europe</strong>an economic<strong>in</strong>dicators (PEEIs) that are essential tothe <strong>Europe</strong>an Central Bank (ECB) for review<strong>in</strong>gmonetary policy <strong>with</strong><strong>in</strong> the euroarea. These short-term statistics give <strong>in</strong>formationon a wide range of economicactivities accord<strong>in</strong>g to the NACE Rev. 1.1classification; they are based on surveysand adm<strong>in</strong>istrative sources. The MemberStates are encouraged to transmit seasonallyadjusted data and trend-cycle <strong>in</strong>dices.If they do not, <strong>Eurostat</strong> calculates the seasonaladjustment. The national statistical<strong>in</strong>stitutes are responsible for data collectionand the calculation of national <strong>in</strong>dices,<strong>in</strong> accordance <strong>with</strong> EC Regulations.<strong>Eurostat</strong> is responsible for euro area andEU aggregations.The presentation of short-term statisticsmay take a variety of different forms:• the adjustment of work<strong>in</strong>g days takesaccount of the calendar nature of agiven month <strong>in</strong> order to adjust the <strong>in</strong>dex.The adjustment of work<strong>in</strong>g daysis <strong>in</strong>tended to adjust calendar effects,whatever their nature. The numberof work<strong>in</strong>g days for a given monthdepends on the tim<strong>in</strong>g of certa<strong>in</strong> publicholidays (Easter can fall <strong>in</strong> Marchor <strong>in</strong> April depend<strong>in</strong>g on the year),the possible overlap of certa<strong>in</strong> publicholidays and non-work<strong>in</strong>g days (1May can fall on a Sunday), the factthat a year is a leap year or not andother reasons• seasonal adjustment, or the adjustmentof seasonal variations, aims,after adjust<strong>in</strong>g for calendar effects,to take account of the impact of theknown seasonal factors that havebeen observed <strong>in</strong> the past. For example,<strong>in</strong> the case of the production <strong>in</strong>dex,annual summer holidays have anegative impact on <strong>in</strong>dustrial production.Where necessary, <strong>Eurostat</strong> calculatesthe seasonal adjustment us<strong>in</strong>gthe methods TRAMO (time-seriesregression <strong>with</strong> ARIMA noise, miss<strong>in</strong>gobservations, and outliers) andSEATS (signal extraction <strong>in</strong> ARIMAtime series), referred to as TRAMO/SEATS.• the trend is a slow variation over along period of years, generally associated<strong>with</strong> the structural causes of thephenomenon <strong>in</strong> question. The cycle isa quasi periodic oscillation characterisedby alternat<strong>in</strong>g periods of higherand lower rates of change possibly,but not always, <strong>in</strong>volv<strong>in</strong>g expansionand contraction. If the irregular componentof the time-series is relativelyimportant, the trend-cycle series generallyoffers a better series for analysisof longer-term past developments.However, this advantage is less clearwhen analys<strong>in</strong>g very recent developments.Trend-cycle values for recentperiods may be subject to greater308 EUROPE IN FIGURES — <strong>Eurostat</strong> <strong>yearbook</strong> <strong>2009</strong>
Industry and services 8revisions than the equivalent seasonallyadjusted values and hence the lattermay be more appropriate for theanalysis of very recent developments;this is particularly true around turn<strong>in</strong>gpo<strong>in</strong>ts.Short-term bus<strong>in</strong>ess statistics are collected<strong>with</strong><strong>in</strong> the scope of the STS regulation(5) . Despite major changes brought <strong>in</strong>by the STS regulation, and improvements<strong>in</strong> the availability and timel<strong>in</strong>ess of <strong>in</strong>dicatorsthat followed its implementation,strong demands for further developmentwere voiced even as the STS regulationwas be<strong>in</strong>g adopted. The emergence of theECB fundamentally changed expectationsas regards STS. As a result, the STSregulation was amended (Regulation (EC)No 1158/2005) on 6 July 2005. Among thema<strong>in</strong> changes <strong>in</strong>troduced were:• new <strong>in</strong>dicators for the purpose ofanalysis, namely the <strong>in</strong>troduction of<strong>in</strong>dustrial import prices, services outputprices, and the division of nondomesticturnover, new orders and<strong>in</strong>dustrial output prices between euroarea and non-euro area markets;• more timely data, by shorten<strong>in</strong>g deadl<strong>in</strong>esfor the delivery of the <strong>in</strong>dustrialand construction production <strong>in</strong>dices,the retail trade and services turnover(and volume of sales) <strong>in</strong>dices, and employment<strong>in</strong>dices for all activities;• more frequent data, <strong>in</strong>creas<strong>in</strong>g thefrequency of the <strong>in</strong>dex of productionfor construction to monthly fromquarterly.The production <strong>in</strong>dex aims to providea measure of the volume trend <strong>in</strong> valueadded at factor cost over a given referenceperiod. The <strong>in</strong>dex of production shouldtake account of:• variations <strong>in</strong> type and quality ofthe commodities and of the <strong>in</strong>putmaterials;• changes <strong>in</strong> stocks of f<strong>in</strong>ished goodsand services and work <strong>in</strong> progress;• changes <strong>in</strong> technical <strong>in</strong>put-output relations(process<strong>in</strong>g techniques);• services such as the assembl<strong>in</strong>g ofproduction units, mount<strong>in</strong>g, <strong>in</strong>stallations,repairs, plann<strong>in</strong>g, eng<strong>in</strong>eer<strong>in</strong>g,creation of software.The data necessary for the compilation ofsuch an <strong>in</strong>dex are generally not availableon a sub-annual basis. In practice, suitableproxy values for the compilation ofthe <strong>in</strong>dices are needed. With<strong>in</strong> <strong>in</strong>dustrythese may <strong>in</strong>clude gross production values(deflated), production quantity data,turnover (deflated), work <strong>in</strong>put, raw material<strong>in</strong>put, or energy <strong>in</strong>put, while <strong>with</strong><strong>in</strong>construction they may <strong>in</strong>clude <strong>in</strong>put data(consumption of typical raw materials,energy or labour) or output data (productionquantities, deflated production values,or deflated sales values).The build<strong>in</strong>g construction production<strong>in</strong>dex and the civil eng<strong>in</strong>eer<strong>in</strong>g production<strong>in</strong>dex is a split of construction productionbetween build<strong>in</strong>g constructionand civil eng<strong>in</strong>eer<strong>in</strong>g accord<strong>in</strong>g to theClassification of types of Construction(CC); the aim of the <strong>in</strong>dices is to show thedevelopment of value added for each ofthe two ma<strong>in</strong> parts of construction.The output price <strong>in</strong>dex (sometimes referredto as the producer price <strong>in</strong>dex)shows monthly price changes <strong>in</strong> <strong>in</strong>dustrialoutput, which can be an <strong>in</strong>dicatorof <strong>in</strong>flationary pressure before it reachesthe consumer. The appropriate price isthe basic price that excludes VAT andsimilar deductible taxes directly l<strong>in</strong>ked(5) Council Regulation (EC) No 1165/98 of 19 May 1998 concern<strong>in</strong>g short-term statistics.EUROPE IN FIGURES — <strong>Eurostat</strong> <strong>yearbook</strong> <strong>2009</strong>309
8 Industry and servicesto turnover, as well as all duties and taxeson the goods and services <strong>in</strong>voiced by theunit, whereas subsidies on products receivedby the producer, if there are any,should be added. The price should refer tothe moment when the order is made, notthe moment when the commodities leavethe factory gates. Output price <strong>in</strong>dices arecompiled for the total, domestic and nondomesticmarkets, <strong>with</strong> the latter furthersplit between euro area and non-euroarea markets (the <strong>in</strong>formation presented<strong>in</strong> this publication refers only to price developments<strong>with</strong><strong>in</strong> the domestic market).All price-determ<strong>in</strong><strong>in</strong>g characteristicsshould be taken <strong>in</strong>to account, <strong>in</strong>clud<strong>in</strong>gthe quantity of units sold, transport provided,rebates, service conditions, guaranteeconditions and dest<strong>in</strong>ation.Ma<strong>in</strong> f<strong>in</strong>d<strong>in</strong>gsThe EU-27’s construction sector generatedalmost 20 % of the comb<strong>in</strong>ed <strong>in</strong>dustrialand construction sectors’ valueadded <strong>in</strong> 2005, while food products,beverages and tobacco was the largest ofthe manufactur<strong>in</strong>g sectors (at the NACEdivision level) <strong>with</strong> around 8 % of thetotal. The construction sector’s share ofemployment was even higher, more thanone quarter of the total. A few sectors recordeda notably lower share of employmentthan value added, and these wereconcentrated <strong>in</strong> energy-related activitiesand chemicals.Based on PRODCOM data, transportequipment products dom<strong>in</strong>ated the list ofthe most sold manufactur<strong>in</strong>g products <strong>in</strong>value terms <strong>in</strong> the EU-27 <strong>in</strong> 2007, occupy<strong>in</strong>gthe first two places, <strong>with</strong> a furtherthree products among the top 20.Domestic output prices and the volumeof <strong>in</strong>dustrial production both followedan upward path dur<strong>in</strong>g most of the last10 years, although there was a decl<strong>in</strong>e<strong>in</strong> activity evident for the EU-27’s <strong>in</strong>dexof production dur<strong>in</strong>g 2001, which wasapparent aga<strong>in</strong> s<strong>in</strong>ce February 2008.Otherwise, there was a marked <strong>in</strong>crease<strong>in</strong> prices from 2004 onwards, largely result<strong>in</strong>gfrom <strong>in</strong>creases <strong>in</strong> the price of oiland associated energy-related and <strong>in</strong>termediateproducts. The highest <strong>in</strong>dustrialprice <strong>in</strong>creases <strong>in</strong> 2007 were recorded<strong>in</strong> Lithuania, Romania and Bulgaria, although<strong>in</strong> Romania the <strong>in</strong>crease of 8.7 %<strong>in</strong> 2007 was considerably lower than <strong>in</strong>2006 and cont<strong>in</strong>ued a downward trend <strong>in</strong>the rate of price <strong>in</strong>creases.310 EUROPE IN FIGURES — <strong>Eurostat</strong> <strong>yearbook</strong> <strong>2009</strong>
Industry and services 8Figure 8.4: Breakdown of <strong>in</strong>dustrial and construction value added and employment, EU-27, 2005 (1)(% of <strong>in</strong>dustrial and construction value added and employment)0.0 2.5 5.0 7.5 10.019.7CONSTRUCTION (2)26.8SELECTED INDUSTRIAL ACTIVITIESFood products & beveragesChemicals & chemical productsMach<strong>in</strong>ery & equipment n.e.c.Electricity, gas, steam & hot water supply (3)Fabricated metal products (3)Motor vehicles, trailers & semi-trailers (3)Publish<strong>in</strong>g, pr<strong>in</strong>t<strong>in</strong>g, reproduction of recorded media (3)Rubber & plastic products (3)Electrical mach<strong>in</strong>ery & apparatus n.e.c.Other non-metallic m<strong>in</strong>eral productsBasic metals (3)Medical, precision & optical <strong>in</strong>struments, watches & clocks (4)Extraction of crude petroleum & natural gas (5)Furniture; manufactur<strong>in</strong>g n.e.c. (3)Other transport equipment (3)Radio, TV & communication equipmentPulp, paper & paper products (3)Coke, ref<strong>in</strong>ed petroleum products and nuclear fuelWood products (3)Textiles (3)Wear<strong>in</strong>g apparel; dress<strong>in</strong>g; dye<strong>in</strong>g of fur (3)Collection, purification & distribution of waterOther m<strong>in</strong><strong>in</strong>g & quarry<strong>in</strong>gTann<strong>in</strong>g, dress<strong>in</strong>g of leather; manufacture of luggageTobacco products (5)Office mach<strong>in</strong>ery & computers (4)M<strong>in</strong><strong>in</strong>g of coal & lignite; extraction of peatRecycl<strong>in</strong>g (3)M<strong>in</strong><strong>in</strong>g of metal ores (6)(1) M<strong>in</strong><strong>in</strong>g of uranium and thorium ores, not available(2) Note: the axis is cut.(3) Estimates.(4) Value added, estimate.(5) Employment, estimate.(6) Value added, not available.Source: <strong>Eurostat</strong> (ebd_all)Value addedEmploymentEUROPE IN FIGURES — <strong>Eurostat</strong> <strong>yearbook</strong> <strong>2009</strong>311
8 Industry and servicesFigure 8.5: Wage adjusted labour productivity ratio for construction and selected <strong>in</strong>dustrialactivities, EU-27, 2005 (1)(%)Extraction of crude petroleum & natural gas (2)Coke, ref<strong>in</strong>ed petroleum products & nuclear fuelElectricity, gas, steam & hot water supply (2)Collection, purification & distribution of waterOther m<strong>in</strong><strong>in</strong>g & quarry<strong>in</strong>gChemicals & chemical productsRecycl<strong>in</strong>g (2)Food products & beveragesBasic metals (2)Office mach<strong>in</strong>ery & computers (2)Other non-metallic m<strong>in</strong>eral productsPulp, paper & paper products (2)Radio, TV & communication equipmentPublish<strong>in</strong>g, pr<strong>in</strong>t<strong>in</strong>g, reproduction of recorded media (2)Rubber & plastic products (2)Tann<strong>in</strong>g, dress<strong>in</strong>g of leather; manufacture of luggageWear<strong>in</strong>g apparel; dress<strong>in</strong>g; dye<strong>in</strong>g of fur (2)Wood products (2)Medical, precision & optical <strong>in</strong>struments, watches & clocks (2)CONSTRUCTIONFabricated metal products (2)Other transport equipment (2)Textiles (2)Furniture; manufactur<strong>in</strong>g n.e.c. (2)Mach<strong>in</strong>ery & equipment n.e.c.Electrical mach<strong>in</strong>ery & apparatus n.e.c.M<strong>in</strong><strong>in</strong>g of coal & lignite; extraction of peatMotor vehicles, trailers & semi-trailers (2)0 200 400 600 800 1 000(1) M<strong>in</strong><strong>in</strong>g of uranium and thorium ores, m<strong>in</strong><strong>in</strong>g of metal ores and tobacco products, not available.(2) Estimate.Source: <strong>Eurostat</strong> (ebd_all)312 EUROPE IN FIGURES — <strong>Eurostat</strong> <strong>yearbook</strong> <strong>2009</strong>
Industry and services 8Figure 8.6: Gross operat<strong>in</strong>g rate for construction and selected <strong>in</strong>dustrial activities, EU-27, 2005 (1)(%)M<strong>in</strong><strong>in</strong>g of metal ores (2)Extraction of crude petroleum & natural gas (2)Collection, purification & distribution of waterOther m<strong>in</strong><strong>in</strong>g & quarry<strong>in</strong>gElectricity, gas, steam & hot water supply (2)Publish<strong>in</strong>g, pr<strong>in</strong>t<strong>in</strong>g, reproduction of recorded media (2)Medical, precision & optical <strong>in</strong>struments, watches & clocks (2)Other non-metallic m<strong>in</strong>eral productsCONSTRUCTIONChemicals & chemical productsTobacco productsFabricated metal products (2)Wood products (2)Recycl<strong>in</strong>g (2)Food products & beveragesRubber & plastic products (2)Wear<strong>in</strong>g apparel; dress<strong>in</strong>g; dye<strong>in</strong>g of fur (2)Furniture; manufactur<strong>in</strong>g n.e.c. (2)Pulp, paper & paper products (2)Tann<strong>in</strong>g, dress<strong>in</strong>g of leather; manufacture of luggageBasic metals (2)Textiles (2)M<strong>in</strong><strong>in</strong>g of coal & lignite; extraction of peatRadio, TV & communication equipmentOffice mach<strong>in</strong>ery & computers (2)Mach<strong>in</strong>ery & equipment n.e.c.Other transport equipment (2)Coke, ref<strong>in</strong>ed petroleum products & nuclear fuelElectrical mach<strong>in</strong>ery & apparatus n.e.c.Motor vehicles, trailers & semi-trailers (2)0 5 10 15 20 25 30 35 40(1) M<strong>in</strong><strong>in</strong>g of uranium and thorium ores, not available.(2) Estimate.Source: <strong>Eurostat</strong> (ebd_all)EUROPE IN FIGURES — <strong>Eurostat</strong> <strong>yearbook</strong> <strong>2009</strong>313
8 Industry and servicesFigure 8.7: Value added by enterprise size class, m<strong>in</strong><strong>in</strong>g and quarry<strong>in</strong>g and manufactur<strong>in</strong>gactivities, EU-27, 2005 (1)(% of sectoral total)M<strong>in</strong><strong>in</strong>g and quarry<strong>in</strong>gManufactur<strong>in</strong>gFood products; beverages and tobaccoTextiles and textile productsLeather and leather productsWood and wood productsPulp, paper and paper products; publish<strong>in</strong>g and pr<strong>in</strong>t<strong>in</strong>gCoke, ref<strong>in</strong>ed petroleum products and nuclear fuelChemicals, chemical products and man-made fibresRubber and plastic productsOther non-metallic m<strong>in</strong>eral productsBasic metals and fabricated metal productsMach<strong>in</strong>ery and equipment n.e.c.Electrical and optical equipmentTransport equipmentManufactur<strong>in</strong>g n.e.c.0% 25% 50% 75% 100%Micro (1-9 persons employed)Small (10-49 persons employed)Medium (50-249 persons employed)Large (250+ persons employed)(1) Includes rounded estimates based on non-confidential data.Source: <strong>Eurostat</strong> (t<strong>in</strong>00053)314 EUROPE IN FIGURES — <strong>Eurostat</strong> <strong>yearbook</strong> <strong>2009</strong>
Industry and services 8Table 8.7: Production sold <strong>in</strong> value terms, selected products, EU-27, 2007PRODCOMcode Product34.10.22.30 Motor vehicles <strong>with</strong> a petrol eng<strong>in</strong>e > 1 500 cm³ (<strong>in</strong>clud<strong>in</strong>g motor caravans of acapacity > 3 000 cm³) (exclud<strong>in</strong>g vehicles for transport<strong>in</strong>g>= 10 persons, snowmobiles, golf cars and similar vehicles)34.10.23.30 Motor vehicles <strong>with</strong> a diesel or semi-diesel eng<strong>in</strong>e > 1 500cm³ but= 10 persons,motor caravans, snowmobiles, golf cars and similar vehicles)Value(EURmillion)126 510106 824Round<strong>in</strong>gbase(million) (1)27.41.30.30 Plat<strong>in</strong>um, palladium, rhodium, iridium, osmium and ruthenium,103 435unwrought or <strong>in</strong> powder form29.42.91.00 Installation services of metalwork<strong>in</strong>g mach<strong>in</strong>e tools 98 95922.13.11.00 Newspapers; journals and periodicals; appear<strong>in</strong>g less than four timesa week published by you; or pr<strong>in</strong>ted and published by you(<strong>in</strong>clud<strong>in</strong>g advertis<strong>in</strong>g revenue)35 500 50015.70.10.Z3 Preparations for animal feeds (exclud<strong>in</strong>g dog or cat food, p.r.s.) 34 500 50022.12.11.00 Newspapers; journals and periodicals; appear<strong>in</strong>g at least four timesa week published by you; or pr<strong>in</strong>ted and published by you(<strong>in</strong>clud<strong>in</strong>g advertis<strong>in</strong>g revenue)32 000 800015.96.10.00 Beer made from malt (exclud<strong>in</strong>g non-alcoholic beer,29 992beer conta<strong>in</strong><strong>in</strong>g
8 Industry and servicesTable 8.8: Production sold <strong>in</strong> volume terms, selected products, EU-27, 2007PRODCOMcodeQuantity(1 000)Round<strong>in</strong>gbase(1 000) (1) UnitProduct27.10.32.10 Flat semi-f<strong>in</strong>ished products (slabs) (of sta<strong>in</strong>less steel) 179 689 kg26.51.12.30 Grey Portland cement (<strong>in</strong>clud<strong>in</strong>g blended cement) 228 698 020 kg15.93.11.30 Champagne (exclud<strong>in</strong>g alcohol duty) 254 200 50 litres24.52.11.50 Perfumes 9 763 litres24.11.11.70 Oxygen 28 018 317 m³20.10.10.34 Coniferous wood; sawn or chipped lengthwise; sliced or peeled;of a thickness > 6mm; planed (exclud<strong>in</strong>g end-jo<strong>in</strong>ted or sanded)16.00.11.50 Cigarettes conta<strong>in</strong><strong>in</strong>g tobacco or mixtures of tobacco andtobacco substitutes (exclud<strong>in</strong>g tobacco duty)32.30.20.60 Flat panel colour TV receivers, L<strong>CD</strong>/plasma, etc.exclud<strong>in</strong>g television projection equipment, apparatus <strong>with</strong> videorecorder/player, video monitors, television receivers <strong>with</strong> <strong>in</strong>tegral tube18 044 m³769 304 498 units27 246 units(1) Indicates the magnitude of the round<strong>in</strong>g employed to protect confidential cell (<strong>in</strong> the case of PRODCOM code 15.93.11.30, theconfidential value lies <strong>with</strong><strong>in</strong> the range +/- 50 000 litres of the reported value).Source: <strong>Eurostat</strong> (http://epp.eurostat.ec.europa.eu/newxtweb/)Figure 8.8: Production and domestic output price <strong>in</strong>dices for <strong>in</strong>dustry, EU-27(2000=100)14013012011010090July 1998 July 2000 July 2002 July 2004 July 2006 July 2008(1) Gross series.(2) Trend cycle.Source: <strong>Eurostat</strong> (sts_<strong>in</strong>pr_m and sts_<strong>in</strong>ppd_m)Domestic output price <strong>in</strong>dex (1)Index of production (2)316 EUROPE IN FIGURES — <strong>Eurostat</strong> <strong>yearbook</strong> <strong>2009</strong>
Industry and services 8Table 8.9: Annual growth rates for <strong>in</strong>dustry(%)Index of production (1)Domestic output price <strong>in</strong>dex (2)2003 2004 2005 2006 2007 2003 2004 2005 2006 2007EU-27 0.7 2.4 1.3 3.9 3.3 1.7 3.0 5.3 5.9 2.7Euro area 0.3 2.1 1.4 4.0 3.4 1.4 2.3 4.1 5.1 2.8Belgium 0.7 3.2 -0.3 5.1 2.6 0.6 4.5 2.2 4.8 3.0Bulgaria 13.7 17.3 6.9 5.9 9.1 4.9 6.0 6.9 9.2 8.6Czech Republic 5.6 9.2 6.7 11.4 8.8 -0.3 5.7 3.0 1.6 4.0Denmark 0.2 -0.2 1.8 3.5 0.4 3.0 3.0 9.4 7.6 0.3Germany 0.4 3.0 3.3 5.9 6.1 1.7 1.6 4.6 5.5 2.0Estonia 11.4 9.7 11.1 10.1 6.7 : : : : :Ireland 4.7 0.3 3.0 5.1 7.2 0.9 0.5 2.1 1.8 1.6Greece 0.3 1.2 -0.9 0.5 2.2 2.3 3.5 5.9 6.9 3.3Spa<strong>in</strong> 1.4 1.6 0.7 3.9 1.9 1.4 3.4 4.9 5.3 3.3France -0.2 1.8 0.3 0.9 1.3 0.9 2.0 3.0 3.4 2.5Italy -0.6 -0.3 -0.8 2.4 -0.2 1.6 2.7 4.0 5.6 3.5Cyprus 0.4 1.4 0.9 0.7 3.1 3.8 5.9 5.1 3.9 4.3Latvia 6.7 6.4 6.0 5.5 1.0 : : : : :Lithuania 16.1 10.8 7.1 7.3 4.0 -0.7 2.4 5.9 6.7 9.2Luxembourg 3.7 3.8 1.0 2.4 0.3 3.6 9.0 3.9 13.1 6.8Hungary 5.9 6.6 7.3 10.6 8.4 5.0 8.4 8.3 8.4 6.4Malta : : : : : : : : : :Netherlands -1.4 4.1 0.4 1.4 2.3 2.2 2.6 7.1 8.2 4.6Austria 2.1 6.3 4.2 7.3 4.9 0.4 1.8 3.3 2.1 4.4Poland 8.4 12.3 4.5 12.2 9.5 1.6 7.6 2.1 2.5 3.6Portugal 0.1 -2.7 0.3 2.8 1.8 0.8 2.7 4.1 4.7 3.2Romania 3.3 4.5 2.4 7.7 5.0 19.6 18.5 12.5 12.0 8.7Slovenia 1.0 4.5 4.0 6.5 6.2 2.6 4.3 2.7 2.4 5.3Slovakia 5.0 4.1 3.3 10.1 12.7 8.3 3.4 4.7 8.4 2.1F<strong>in</strong>land 1.2 5.0 0.3 9.8 4.4 0.2 -0.5 1.8 5.2 3.0Sweden 1.5 4.1 2.4 3.5 4.1 2.7 2.0 3.8 5.9 3.8United K<strong>in</strong>gdom -0.1 0.9 -1.1 0.8 0.3 1.6 4.3 10.9 9.0 1.1Croatia 4.0 3.0 5.4 4.6 5.6 2.0 3.5 3.0 2.9 3.4Turkey 8.7 9.8 5.7 5.8 4.4 : : : : :Norway -4.0 2.1 -0.7 -2.4 -0.9 5.9 3.6 6.0 8.8 -0.6Switzerland 0.1 4.4 2.7 7.8 9.5 : : : : :Japan 3.3 4.8 1.4 4.3 2.8 : : : : :United States 1.2 2.5 3.3 2.2 1.7 : : : : :(1) Work<strong>in</strong>g day adjusted.(2) Gross series.Source: <strong>Eurostat</strong> (sts_<strong>in</strong>prgr_a and sts_<strong>in</strong>ppdgr_a)EUROPE IN FIGURES — <strong>Eurostat</strong> <strong>yearbook</strong> <strong>2009</strong>317
8 Industry and servicesFigure 8.9: Average annual growth rate for the <strong>in</strong>dustrial <strong>in</strong>dex of production, EU-27, 2002-07 (1)(%)Electrical & optical equipmentMach<strong>in</strong>ery & equipment n.e.c.Transport equipmentBasic metals & fabricated metal productsRubber & plastic productsChemicals, chemical products & man-made fibresWood productsM<strong>in</strong><strong>in</strong>g & quarry<strong>in</strong>g of non-energy produc<strong>in</strong>g materialsOther non-metallic m<strong>in</strong>eral productsElectricity, gas & water supplyFood products; beverages & tobaccoCoke, ref<strong>in</strong>ed petroleum products & nuclear fuelPulp & paper; publish<strong>in</strong>g & pr<strong>in</strong>t<strong>in</strong>gManufactur<strong>in</strong>g n.e.c.Textiles & textile productsM<strong>in</strong><strong>in</strong>g & quarry<strong>in</strong>g of energy produc<strong>in</strong>g materialsLeather & leather products(1) Work<strong>in</strong>g day adjusted.Source: <strong>Eurostat</strong> (sts_<strong>in</strong>ppd_a)-8 -6 -4 -2 0 2 4 6Figure 8.10: Index of production, construction, EU-27 (1)(2000=100)1151101051009590July 1998 July 2000 July 2002 July 2004 July 2006 July 2008(1) Trend cycle.(2) Estimates, May 1998 to December 1999 and April 2008 to July 2008.(3) Estimates, May 1998 to December 1999 and July 2007.Source: <strong>Eurostat</strong> (sts_copr_m)Build<strong>in</strong>g (2)Construction (3)Civil eng<strong>in</strong>eer<strong>in</strong>g (2)318 EUROPE IN FIGURES — <strong>Eurostat</strong> <strong>yearbook</strong> <strong>2009</strong>
Industry and services 88.3 ServicesIntroductionServices accounted for 71.6 % of grossvalue added <strong>in</strong> the EU-27 <strong>in</strong> 2007, and asimilar (and ris<strong>in</strong>g) proportion of overallemployment. The relative importance ofservices <strong>in</strong> total value added ranged fromalmost 56 % of the economy <strong>in</strong> Romaniato upwards of 75 % <strong>in</strong> Belgium, Greece,France, Cyprus, Malta and the UnitedK<strong>in</strong>gdom, ris<strong>in</strong>g to a high of 84 % <strong>in</strong>Luxembourg.The <strong>in</strong>ternal market is one of the EU’smost important and cont<strong>in</strong>u<strong>in</strong>g priorities.The central pr<strong>in</strong>ciples govern<strong>in</strong>g the<strong>in</strong>ternal market for services are set out <strong>in</strong>the EC Treaty, which guarantees EU companiesthe freedom to establish themselves<strong>in</strong> other Member States, and thefreedom to provide services on the territoryof another Member State other thanthe one <strong>in</strong> which they are established. Theobjective of the Services Directive (6) is toelim<strong>in</strong>ate obstacles to trade <strong>in</strong> services,thus allow<strong>in</strong>g the development of crossborderoperations. It is <strong>in</strong>tended to improvecompetitiveness, not just of serviceenterprises, but also of <strong>Europe</strong>an <strong>in</strong>dustryas a whole. The directive was adoptedby the <strong>Europe</strong>an Parliament and theCouncil <strong>in</strong> December 2006 and will haveto be transposed by the Member Statesby the end of <strong>2009</strong>. It is hoped that thedirective will help achieve potential economicgrowth and job creation, and it isfor this reason that the directive is seen asa central element of the renewed Lisbonstrategy for growth and jobs. Moreover,by provid<strong>in</strong>g for adm<strong>in</strong>istrative simplification,it also supports the better regulationagenda.Def<strong>in</strong>itions and data availabilityFor background <strong>in</strong>formation relat<strong>in</strong>g tostructural bus<strong>in</strong>ess statistics (SBS), referto the section titled ‘def<strong>in</strong>itions anddata availability’ <strong>in</strong> section 8.1 (Bus<strong>in</strong>essstructures), which <strong>in</strong>cludes def<strong>in</strong>itionsof value added and persons employed,while def<strong>in</strong>itions of wage adjusted labourproductivity and gross operat<strong>in</strong>grate are available <strong>in</strong> section 8.2 (Industryand construction). Equally, a greatdeal of background <strong>in</strong>formation relat<strong>in</strong>gto short-term bus<strong>in</strong>ess statistics (STS) isprovided <strong>in</strong> the section titled ‘def<strong>in</strong>itionsand data availability’ <strong>in</strong> section 8.2 on <strong>in</strong>dustryand construction.The term ‘non-f<strong>in</strong>ancial bus<strong>in</strong>ess economy’is generally used <strong>with</strong><strong>in</strong> bus<strong>in</strong>essstatistics to refer to economic activitiescovered by Sections C to I and K of NACERev. 1.1 and the units that carry out thoseactivities.For STS, turnover comprises the totals <strong>in</strong>voicedby the observation unit dur<strong>in</strong>g thereference period, and this corresponds tomarket sales of goods or services suppliedto third parties. Turnover also <strong>in</strong>cludesall other charges (transport, packag<strong>in</strong>g,etc.) passed on to the customer, even ifthese charges are listed separately <strong>in</strong> the<strong>in</strong>voice. Turnover excludes VAT and othersimilar deductible taxes directly l<strong>in</strong>kedto turnover as well as all duties and taxeson the goods or services <strong>in</strong>voiced by theunit. Reductions <strong>in</strong> prices, rebates anddiscounts as well as the value of returnedpack<strong>in</strong>g must be deducted. Price reductions,rebates and bonuses conceded laterto clients, for example at the end of theyear, are not taken <strong>in</strong>to account.(6) Directive 2006/123/EC of the <strong>Europe</strong>an Parliament and of the Council of 12 December 2006 on services <strong>in</strong> the <strong>in</strong>ternal market.EUROPE IN FIGURES — <strong>Eurostat</strong> <strong>yearbook</strong> <strong>2009</strong>319
8 Industry and servicesRetail trade turnover <strong>in</strong>dices are bus<strong>in</strong>esscycle <strong>in</strong>dicators which show themonthly activity of the retail sector <strong>in</strong>value and volume terms. The volumemeasure of the retail trade turnover <strong>in</strong>dexis more commonly referred to as the<strong>in</strong>dex of the volume of (retail) sales. Retailtrade turnover <strong>in</strong>dices are short-term<strong>in</strong>dicators for f<strong>in</strong>al domestic demand.In order to elim<strong>in</strong>ate the price effect onturnover <strong>in</strong> retail trade a deflator of salesis used. The deflator of sales is an <strong>in</strong>dex<strong>with</strong> a similar methodology to that of anoutput price <strong>in</strong>dex adapted to the particularitiesof retail trade but reflect<strong>in</strong>gprice changes <strong>in</strong> the goods retailed ratherthan the retail service provided. These <strong>in</strong>dicesmay be split between food and nonfood products. Food products are sold,either <strong>in</strong> non-specialised stores (hypermarkets,supermarkets) or <strong>in</strong> specialisedstores (e.g. fruit and vegetable grocers). Agreater proportion of sales <strong>in</strong> specialisedstores is a sign of a more traditional patternof retail trade.Ma<strong>in</strong> f<strong>in</strong>d<strong>in</strong>gsBus<strong>in</strong>ess services play a particularly importantrole <strong>in</strong> the services economy.Many of the activities covered by this sectorof the economy (computer services,real estate, research and development,and other bus<strong>in</strong>ess activities such as legal,account<strong>in</strong>g, market research, advertis<strong>in</strong>g,<strong>in</strong>dustrial clean<strong>in</strong>g and security services)have taken advantage of the outsourc<strong>in</strong>gphenomenon, which may expla<strong>in</strong> theirrapid growth.With<strong>in</strong> the non-f<strong>in</strong>ancial services, otherbus<strong>in</strong>ess activities (as def<strong>in</strong>ed by NACEDivision 74) contributed more thanone fifth of the wealth generated (valueadded) <strong>in</strong> the EU-27 <strong>in</strong> 2005; wholesaletrade and retail trade and repair contributedrespectively another 16 % and 13 %.However, retail trade and other bus<strong>in</strong>essactivities accounted for similar proportionsof the EU-27’s total workforce <strong>in</strong> thenon-f<strong>in</strong>ancial services (22.5 % and 23.8 %respectively) <strong>in</strong> 2005, the large difference<strong>in</strong> the share for retail trade and repair be<strong>in</strong>gexpla<strong>in</strong>ed to some extent by the high<strong>in</strong>cidence of part-time employment.Over the five years from 2002 to 2007,water, air and land transport services hadthe fastest grow<strong>in</strong>g turnover among thenon-f<strong>in</strong>ancial services activities (<strong>in</strong> termsof NACE divisions), <strong>with</strong> average growthrates of 7.3 % or more per annum.320 EUROPE IN FIGURES — <strong>Eurostat</strong> <strong>yearbook</strong> <strong>2009</strong>
Industry and services 8Figure 8.11: Breakdown of non-f<strong>in</strong>ancial services value added and employment, EU-27, 2005(% of non-f<strong>in</strong>ancial services value added and employment)Other bus<strong>in</strong>ess activitiesWholesale tradeRetail trade and repairPost & telecommunicationsReal estate activities (1)Land transport (1)Computer & related activities (1)Hotels & restaurantsMotor tradeAuxiliary transport servicesRent<strong>in</strong>g (1)Air transport (1)Water transportResearch & development (1)(1) Estimates.Source: <strong>Eurostat</strong> (ebd_all)0 5 10 15 20 25Value addedEmploymentFigure 8.12: Wage adjusted labour productivity for non-f<strong>in</strong>ancial services, EU-27, 2005(%)Rent<strong>in</strong>g (1)Real estate activities (1)Water transport (1)Post & telecommunicationsAuxiliary transport servicesWholesale tradeMotor tradeOther bus<strong>in</strong>ess activitiesComputer & related activities (1)Retail trade and repairHotels & restaurantsLand transport (1)Air transport (1)Research & development (1)0 100 200 300 400(1) Estimate.Source: <strong>Eurostat</strong> (ebd_all)EUROPE IN FIGURES — <strong>Eurostat</strong> <strong>yearbook</strong> <strong>2009</strong>321
8 Industry and servicesFigure 8.13: Gross operat<strong>in</strong>g rate for non-f<strong>in</strong>ancial service activities, EU-27, 2005(%)Rent<strong>in</strong>g (1)Real estate activities (1)Post & telecommunicationsWater transport (1)Other bus<strong>in</strong>ess activitiesComputer & related activities (1)Hotels & restaurantsAuxiliary transport servicesLand transport (1)Research & development (1)Retail trade and repairMotor tradeWholesale tradeAir transport (2)0 15 30 45(1) Estimate.(2) Estimate, 2004.Source: <strong>Eurostat</strong> (ebd_all)Figure 8.14: Non-f<strong>in</strong>ancial services value added by enterprise size class, EU-27, 2005 (1)(% of sectoral total)Motor tradeWholesale tradeRetail trade and repairHotels & restaurantsLand transportWater transportAir transportAuxiliary transport servicesPost & telecommunicationsReal estate activitiesRent<strong>in</strong>gComputer & related activitiesResearch & developmentOther bus<strong>in</strong>ess activities0% 25% 50% 75% 100%Micro (1 to 9 persons employed)Small (10 to 49 persons employed)Medium-sized (50 to 249 persons employed)Large (250 or more persons employed)(1) Includes rounded estimates based on non-confidential data.Source: <strong>Eurostat</strong> (t<strong>in</strong>00053)322 EUROPE IN FIGURES — <strong>Eurostat</strong> <strong>yearbook</strong> <strong>2009</strong>
Industry and services 8Figure 8.15: Average annual growth rate of turnover, selected service activities, EU-27, 2002-2007 (1)(%)Water transportLand transportAir transportOther bus<strong>in</strong>ess activitiesWholesale tradeAuxiliary transport servicesComputer & related activitiesMotor tradePost & telecommunicationsHotels & restaurantsRetail trade and repair0 2 4 6 8 10(1) Work<strong>in</strong>g day adjusted; real estate activities, rent<strong>in</strong>g and research and development, not available.Source: <strong>Eurostat</strong> (sts_trtu_a and ebt_setu_a)Figure 8.16: Index of turnover, selected service activities, EU-27 (1)(2000=100)18016014012010080May 2000 May 2001 May 2002 May 2003 May 2004 May 2005 May 2006 May 2007 May 2008Water transportMotor tradeRetail trade and repairLand transportWholesale tradeHotels and restaurants18016014012010080May 2000 May 2001 May 2002 May 2003 May 2004 May 2005 May 2006 May 2007 May 2008Post and telecommunicationsComputer and related activitiesAir transportOther bus<strong>in</strong>ess activitiesAuxiliary transport services(1) Trend cycle; estimates, 2000 to 2002 and April to June 2008.Source: <strong>Eurostat</strong> (ebt_setu_m and sts_trtu_m)EUROPE IN FIGURES — <strong>Eurostat</strong> <strong>yearbook</strong> <strong>2009</strong>323
8 Industry and servicesFigure 8.17: Breakdown of turnover, retail sales of food, beverages and tobacco, 2005(% of total turnover)100%75%50%25%0%EU-27 (1)LithuaniaLatviaEstoniaSloveniaFranceDenmark (2)HungaryIrelandGermanyF<strong>in</strong>landUnited K<strong>in</strong>gdomSlovakiaCzech Republic (3)LuxembourgRomaniaBelgiumNetherlandsSwedenBulgariaPortugalAustriaItalyCyprusFood, beverages, tobacco <strong>in</strong> specialised storesNon-specialised stores <strong>with</strong> food, beverages or tobacco predom<strong>in</strong>at<strong>in</strong>gPolandSpa<strong>in</strong>GreeceMalta (4)(1) Non-specialised stores, estimate.(2) 2004.(3) 2006.(4) 2002.Source: <strong>Eurostat</strong> (t<strong>in</strong>00007)Figure 8.18: Volume of sales <strong>in</strong>dex, selected retail trade activities, EU-27 (1)(2000=100)1301201101009080January 2000 January 2002 January 2004 January 2006 January 2008(1) Trend cycle; estimates, June and July 2008.Source: <strong>Eurostat</strong> (sts_trtu_m)Textiles, cloth<strong>in</strong>g, footwear and leather goodsHousehold equipmentBooks, newspapers and other itemsFood, beverages, tobacco <strong>in</strong> specialised stores324 EUROPE IN FIGURES — <strong>Eurostat</strong> <strong>yearbook</strong> <strong>2009</strong>
Industry and services 88.4 TourismIntroductionThe demand for hotel services is split betweenthat from bus<strong>in</strong>esses and that fromhouseholds (for leisure, for example).Bus<strong>in</strong>ess demand tends to fluctuate <strong>with</strong>the economic cycle, as dur<strong>in</strong>g periods ofrecession bus<strong>in</strong>esses try to reduce theirexpenditure. In a similar way, <strong>in</strong>dividualsare also more likely to curb their spend<strong>in</strong>gon tourism-related activities dur<strong>in</strong>gperiods of low consumer confidence.<strong>Europe</strong> rema<strong>in</strong>s a major tourist dest<strong>in</strong>ationand six of the Member States areamong the world’s top ten dest<strong>in</strong>ationsfor holiday-makers. As a result, tourismplays an important role <strong>in</strong> terms ofits economic and employment potential,while present<strong>in</strong>g social and environmentalimplications; these tw<strong>in</strong> characteristicsdrive the demand for reliable andharmonised statistics <strong>with</strong><strong>in</strong> this field.Tourism can also be a significant factor<strong>in</strong> the development of <strong>Europe</strong>an regions.Infrastructure created for tourism purposescontributes to local development,while jobs that are created or ma<strong>in</strong>ta<strong>in</strong>edcan help counteract <strong>in</strong>dustrial or ruraldecl<strong>in</strong>e. ‘Susta<strong>in</strong>able tourism’ <strong>in</strong>volvesthe preservation and enhancement ofcultural and natural heritage, rang<strong>in</strong>gfrom the arts, to local gastronomy, or thepreservation of biodiversity.A new policy approach for tourism is <strong>in</strong>the process of be<strong>in</strong>g developed. The <strong>Europe</strong>anCommission adopted <strong>in</strong> 2006 aCommunication titled, ‘a renewed EUtourism policy: towards a stronger partnershipfor <strong>Europe</strong>an tourism’ (7) . Thedocument addressed a range of challengesthat will shape tourism <strong>in</strong> the com<strong>in</strong>gyears, <strong>in</strong>clud<strong>in</strong>g: <strong>Europe</strong>’s age<strong>in</strong>g population;grow<strong>in</strong>g external competition;consumer demand for more specialisedtourism; and the need to develop moresusta<strong>in</strong>able and environmentally-friendlytourism practices. The document arguedthat a more competitive tourism <strong>in</strong>dustryand susta<strong>in</strong>able dest<strong>in</strong>ations wouldcontribute further to the success of therenewed Lisbon strategy, tourist satisfaction,and secur<strong>in</strong>g the position of <strong>Europe</strong>as the world’s lead<strong>in</strong>g tourist dest<strong>in</strong>ation.This was followed by a Communicationfrom the <strong>Europe</strong>an Commission <strong>in</strong> October2007 – ‘Agenda for a susta<strong>in</strong>able andcompetitive <strong>Europe</strong>an tourism’ – whichoutl<strong>in</strong>ed the future steps for promot<strong>in</strong>gthe susta<strong>in</strong>ability of <strong>Europe</strong>an tourismand further contributes to the implementationof the renewed Lisbon strategy forgrowth and jobs and of the renewed susta<strong>in</strong>abledevelopment strategy, throughaddress<strong>in</strong>g stakeholders play<strong>in</strong>g a role <strong>in</strong><strong>Europe</strong>an tourism. The susta<strong>in</strong>able managementof dest<strong>in</strong>ations, the <strong>in</strong>tegrationof susta<strong>in</strong>ability concerns by bus<strong>in</strong>esses,and susta<strong>in</strong>ability awareness of touristsform the framework of the actionsproposed (8) .(7) http://ec.europa.eu/enterprise/services/tourism/communications_2006.htm.(8) http://ec.europa.eu/enterprise/services/tourism/doc/communications/com2007_0621en01.pdf.EUROPE IN FIGURES — <strong>Eurostat</strong> <strong>yearbook</strong> <strong>2009</strong>325
8 Industry and servicesDef<strong>in</strong>itions and data availabilityTourism can be def<strong>in</strong>ed as the activitiesserv<strong>in</strong>g persons travell<strong>in</strong>g to and stay<strong>in</strong>g<strong>in</strong> places outside their usual environmentfor not more than one consecutive year,for leisure or bus<strong>in</strong>ess purposes. A touristis any visitor who stays at least onenight <strong>in</strong> collective or private accommodation.A night spent is def<strong>in</strong>ed as eachnight that a guest is registered to stay <strong>in</strong>a hotel or similar establishment (his/herphysical presence there is not necessary).A breakdown of nights spent is providedfor residents and non-residents, theformer are identified as hav<strong>in</strong>g lived formost of the past year <strong>in</strong> a country/place,or hav<strong>in</strong>g lived <strong>in</strong> that country/place fora shorter period and <strong>in</strong>tend<strong>in</strong>g to return<strong>with</strong><strong>in</strong> a year to live there; note that asignificant proportion of tourism, us<strong>in</strong>gthe def<strong>in</strong>itions above, is accounted forby bus<strong>in</strong>ess customers. Tourism <strong>in</strong>tensityand <strong>in</strong>ternational tourism receiptsrelative to GDP both give an <strong>in</strong>dicationof the importance of the size of tourism.Tourism <strong>in</strong>tensity shows the number ofnights spent by tourists relative to thepopulation of the host country.On the supply side, tourism relies on enterprisesfrom a variety of sectors, whichcan be summarised as the provision of accommodation,food and dr<strong>in</strong>k, transportfacilities and services, and enterta<strong>in</strong>ment.The term tourist accommodation refersto all types of collective accommodation– thus, exclud<strong>in</strong>g privately rented touristaccommodation. This may be brokendown to cover hotels and similar establishmentswhich <strong>in</strong>clude the provision oflodg<strong>in</strong>g <strong>in</strong> hotels, motels, <strong>in</strong>ns and similarestablishments comb<strong>in</strong>ed <strong>with</strong> typicalhotel services like bed-mak<strong>in</strong>g and clean<strong>in</strong>gof the room and sanitary facilities,and other collective accommodationestablishments which consist of holidaydwell<strong>in</strong>gs, tourist campsites and othershort-stay accommodation, like youthhostels, tourist dormitories and holidayhomes. The number of bed places <strong>in</strong> anestablishment relates to the number ofpersons who can stay overnight <strong>in</strong> thebeds set up <strong>in</strong> the establishment, ignor<strong>in</strong>gany extra beds that may have been setup on customer request. One ‘bed place’applies to a s<strong>in</strong>gle bed, while a doublebed is counted as two bed places. Travelservices carried out by enterprises thatare engaged <strong>in</strong> arrang<strong>in</strong>g transport, accommodationand cater<strong>in</strong>g on behalf oftravellers, are classified <strong>with</strong><strong>in</strong> NACEGroup 63.3, which encompasses the follow<strong>in</strong>gactivities: furnish<strong>in</strong>g travel <strong>in</strong>formation,advice and plann<strong>in</strong>g; arrang<strong>in</strong>gcustom-made tours, accommodation andtransportation for travellers and tourists;furnish<strong>in</strong>g tickets; sell<strong>in</strong>g package tours;tour operat<strong>in</strong>g; and organis<strong>in</strong>g touristguides.Ma<strong>in</strong> f<strong>in</strong>d<strong>in</strong>gsAlthough the demand for tourism grewrapidly dur<strong>in</strong>g the latter part of the lastcentury, this trend was reversed from2001 until 2003 as an economic slowdown,coupled <strong>with</strong> concerns over terroristacts, health epidemics, and a series ofnatural disasters, contributed to a periodof reduced demand. This evolution wascounter-balanced by the rapid growth<strong>in</strong> low-cost airl<strong>in</strong>es and an <strong>in</strong>crease <strong>in</strong>the number of short breaks taken by<strong>Europe</strong>ans.326 EUROPE IN FIGURES — <strong>Eurostat</strong> <strong>yearbook</strong> <strong>2009</strong>
Industry and services 8There were 201 168 hotels and similarestablishments <strong>in</strong> the EU-27 <strong>in</strong> 2006 and221 483 other collective accommodationestablishments. While the number of hotelshas been <strong>in</strong> decl<strong>in</strong>e there has been an<strong>in</strong>crease <strong>in</strong> their capacity, as measured bythe number of bed places available, whichrose to 11.5 million by 2006.Occupancy rates for hotels and similarestablishments vary considerably <strong>in</strong>the ma<strong>in</strong> tourist dest<strong>in</strong>ations, largelyas a function of the season, whereas <strong>in</strong>bus<strong>in</strong>ess centres demand is more evenlyspread across the whole year (althoughit may be concentrated dur<strong>in</strong>g the work<strong>in</strong>gweek and limited dur<strong>in</strong>g weekends).There were just over 1 500 million nightsspent <strong>in</strong> EU-27 hotels and similar establishmentsdur<strong>in</strong>g 2006 by residents andnon-residents.In terms of tourism <strong>in</strong>tensity (the ratio ofnights spent relative to population size)the most popular holiday dest<strong>in</strong>ations <strong>in</strong>the EU-27 <strong>in</strong> 2007 <strong>in</strong>cluded the Mediterraneanisland dest<strong>in</strong>ations of Cyprus andMalta (2006), as well as the alp<strong>in</strong>e dest<strong>in</strong>ationof Austria. An alternative measureof the importance of tourism is providedby the ratio of <strong>in</strong>ternational tourism receiptsrelative to GDP: <strong>in</strong> 2007, this washighest <strong>in</strong> Cyprus (12.5 %) and Malta(12.2 %), confirm<strong>in</strong>g the importance oftourism to these island nations.Figure 8.19: Tourism dest<strong>in</strong>ations, 2007(1 000 nights spent <strong>in</strong> all collective accommodation <strong>in</strong> the country by non-residents)250 000200 000150 000100 00050 0000Spa<strong>in</strong>ItalyFranceUnited K<strong>in</strong>gdomAustriaGermanyGreeceNetherlandsPortugalIreland (1)Czech RepublicBelgiumCyprusBulgariaSwedenPoland (1)Hungary (1)DenmarkMaltaF<strong>in</strong>landSlovakiaSloveniaRomaniaEstoniaLuxembourg (1)LatviaLithuaniaCroatiaNorwayIcelandLiechtenste<strong>in</strong>(1) 2006.Source: <strong>Eurostat</strong> (tour_occ_ni)EUROPE IN FIGURES — <strong>Eurostat</strong> <strong>yearbook</strong> <strong>2009</strong>327
8 Industry and servicesTable 8.10: Lead<strong>in</strong>g tourism <strong>in</strong>dicatorsHotels & similarestablishmentsOther collectiveaccommodationestablishmentsBed places <strong>in</strong>hotels & similarestablishmentsNights spent <strong>in</strong>hotels & similarestablishments(units)(units)(1 000)(1 000) (1) <strong>in</strong> tourism2002 2007 (2) 2002 2007 (2) 2002 2007 (2) 2002 2007 (2) 2002 2007 (3)EU-27 204 675 201 168 189 359 221 483 10 686 11 541 : 1 525 008 : :Euro area 143 420 142 374 137 571 166 208 8 160 8 717 : 1 209 656 : :Belgium 2 010 2 013 1 638 1 503 123 125 14 500 16 197 0.41 0.45Bulgaria 755 1 526 159 492 133 231 9 980 16 736 : :Czech Republic 4 335 4 559 3 534 3 286 223 248 23 803 27 044 : 0.52Denmark 482 477 622 598 67 73 9 250 11 080 0.61 0.62Germany 38 129 35 941 17 508 17 817 1 608 1 644 189 970 214 675 0.67 0.81Estonia 193 346 227 638 16 29 2 337 3 843 0.26 0.23Ireland 5 009 4 087 2 803 4 890 145 157 24 716 28 282 : :Greece 8 329 9 207 337 324 606 701 53 478 64 086 0.42 0.42Spa<strong>in</strong> 16 732 18 426 13 748 19 032 1 394 1 639 222 555 272 733 0.51 0.44France 18 768 18 135 10 492 10 643 1 235 1 254 192 056 204 269 : 0.61Italy 33 411 34037 80 304 96957 1 930 2142 231 132 254 076 0.50 0.49Cyprus 813 735 133 167 90 88 16 103 14 298 0.77 :Latvia 223 318 74 82 14 21 1 527 2 759 : 0.19Lithuania 247 348 229 181 12 22 1 050 2 591 : 0.27Luxembourg 316 273 284 235 15 15 1 244 1 438 0.62 0.64Hungary 2 167 2 032 1 220 1 024 155 159 13 834 15 808 : 0.35Malta 194 173 2 6 40 40 : 7 307 : :Netherlands 2 933 3 196 3 729 4 072 177 200 28 515 34 159 0.68 0.68Austria 14 914 14 204 5 971 6 526 569 574 73 523 79 153 0.46 0.58Poland 1 478 2 443 5 572 4 275 128 190 13 381 24 307 : 0.34Portugal 1 898 : 273 : 240 : 34 209 : 0.33 0.27Romania 2 765 4 163 573 531 197 228 : 19 756 : 0.28Slovenia 393 396 457 423 28 33 4 763 5 546 : 0.62Slovakia 816 1 249 1 216 1 426 54 67 7 526 7 233 : :F<strong>in</strong>land 971 909 484 449 118 119 13 273 15 817 0.54 0.60Sweden 1 737 1 893 2 043 2 083 181 207 21 011 25 416 : :United K<strong>in</strong>gdom 44 657 40 130 35 727 40 878 1 188 1 251 178 937 169 440 0.44 0.60Croatia 788 800 485 1 011 188 163 19 596 20 940 : :FYR of Macedonia 150 : 175 : 16 : : : : :Iceland 273 294 399 286 14 18 1 261 1 917 : :Liechtenste<strong>in</strong> 50 47 120 113 1 1 108 129 : :Norway 1 124 1 112 1 151 1 153 144 154 16 188 18 510 0.70 0.72Switzerland 5 643 5 635 94 100 : 259 270 31 963 36 365 : :(1) Nights spent by residents and non-residents.(2) EU-27, euro area, Hungary and Malta, 2006.(3) Czech Republic, Germany, Estonia, Italy, Hungary and Portugal, 2006.Source: <strong>Eurostat</strong> (t<strong>in</strong>00039, t<strong>in</strong>00040, t<strong>in</strong>00041, t<strong>in</strong>00043, t<strong>in</strong>00045 and tps00001)Share of population(aged 15+)tak<strong>in</strong>g part328 EUROPE IN FIGURES — <strong>Eurostat</strong> <strong>yearbook</strong> <strong>2009</strong>
Industry and services 8Figure 8.20: Country of orig<strong>in</strong> for outbound holidays, 2007 (1)(average number of nights spent abroad per <strong>in</strong>habitant)201612840LuxembourgCyprusIrelandUnited K<strong>in</strong>gdomGermanyNetherlandsDenmarkSwedenAustriaBelgiumSloveniaF<strong>in</strong>landSlovakiaCzech RepublicLatviaHungaryLithuaniaFranceItalySpa<strong>in</strong>PolandEstoniaGreecePortugalRomaniaNorwayCroatia(1) Bulgaria and Malta, not available.Source: <strong>Eurostat</strong> (tour_dem_tnw and tps00001)Figure 8.21: Tourism <strong>in</strong>tensity, 2007(ratio of nights spent by residents and non-residents <strong>in</strong> hotels and similar establishments and other collectiveaccommodation establishments per <strong>in</strong>habitant)20151050EU-27 (1)Euro area (2)CyprusMalta (1)AustriaSpa<strong>in</strong>IrelandItalyGreeceNetherlandsSwedenLuxembourgDenmarkFranceUnited K<strong>in</strong>gdomPortugalSloveniaCzech RepublicGermanyF<strong>in</strong>landEstoniaBelgiumBulgariaSlovakiaHungary (1)LatviaPolandLithuaniaRomaniaCroatiaIcelandNorwayLiechtenste<strong>in</strong>(1) 2006.(2) EA-12 <strong>in</strong>stead of EA-15; 2006.Source: <strong>Eurostat</strong> (tour_occ_ni and tps00001)Figure 8.22: Proportion of the population aged 15+ go<strong>in</strong>g on holiday abroad for at least fournights, 2007 (1)(%)1007550250CyprusLuxembourgGermanySwedenDenmarkSloveniaBelgiumMaltaUnited K<strong>in</strong>gdomNetherlandsLithuania(1) Bulgaria, Ireland and Slovakia, not available.Source: <strong>Eurostat</strong> (tour_dem_toage, tps00001 and tps00010)AustriaEstoniaF<strong>in</strong>landCzech RepublicLatviaHungaryItalyPolandSpa<strong>in</strong>FrancePortugalGreeceRomaniaNorwayCroatiaEUROPE IN FIGURES — <strong>Eurostat</strong> <strong>yearbook</strong> <strong>2009</strong>329
8 Industry and servicesTable 8.11: Holiday trips of EU residents (aged 15 or more), 2007Number of trips(1 000)Shorttrips(1-3 nights)Longtrips(4+ nights)Shortdomestictrips(1-3 nights)Breakdown of all trips bydest<strong>in</strong>ation and duration (%)Longdomestictrips(4+ nights)Shortoutboundtrips(1-3 nights)Longoutboundtrips(4+ nights)AlltripsBelgium 10 458 3 453 7 005 16.1 11.7 16.9 55.3Bulgaria : : : : : : :Czech Republic (1) 26 754 17 821 8 933 62.7 18.6 3.9 14.8Denmark 10 368 4 377 5 991 32.5 15.2 9.7 42.6Germany 202 409 102 877 99 533 44.3 20.9 6.5 28.3Estonia 1 245 835 410 53.2 8.7 13.9 24.1Ireland 11 407 5 551 5 856 36.3 11.9 12.4 39.4Greece 14 630 6 107 8 522 41.0 51.7 0.8 6.5Spa<strong>in</strong> 111 903 71 723 40 180 62.2 30.8 1.9 5.1France 190 381 105 049 85 331 52.2 37.5 3.0 7.3Italy (1) 188 156 147 022 41 134 18.0 16.5 1.7 5.4Cyprus 1 663 846 817 45.3 12.3 5.6 36.9Latvia 4 197 3 330 867 71.2 7.3 8.2 13.3Lithuania 3 576 2 381 1 196 53.9 13.6 12.6 19.9Luxembourg (1) 1 099 419 680 1.2 0.2 37.0 61.6Hungary 25 224 17 481 7 742 64.0 19.9 5.3 10.8Malta : : : : : : :Netherlands (1) 28 574 10 189 18 385 24.9 24.4 10.8 39.9Austria 15 682 6 997 8 685 31.9 19.9 12.7 35.5Poland 33 948 16 584 17 364 46.1 40.7 2.7 10.4Portugal (1) 10 265 6 423 3 842 60.5 29.6 2.1 7.9Romania (1) 6 892 1 490 5 402 64.1 67.4 0.4 11.0Slovenia 3 654 1 989 1 665 33.7 11.0 20.8 34.6Slovakia 6 969 2 083 4 886 24.1 34.5 5.7 35.6F<strong>in</strong>land 29 467 22 885 6 582 69.4 15.1 8.3 7.2Sweden (1) 38 399 25 618 12 781 58.3 19.1 8.5 14.2United K<strong>in</strong>gdom (1) 112 695 40 080 72 615 35.7 25.3 9.5 29.5Croatia 5 434 2 467 2 967 31.8 36.6 13.6 18.0Norway 15 770 8 840 6 930 42.7 20.7 13.4 23.3(1) 2006.Source: <strong>Eurostat</strong> (tour_dem_ttmd)330 EUROPE IN FIGURES — <strong>Eurostat</strong> <strong>yearbook</strong> <strong>2009</strong>
Industry and services 8Table 8.12: Tourism receipts and expenditureReceiptsExpenditure(EUR million)Relativeto GDP,(EUR million)Relativeto GDP,1997 2002 2007 2007 (%) 1997 2002 2007 2007 (%)EU-27 (1) : : 76 612 0.6 : : 94 005 0.8Euro area (2) : : 100 437 1.1 : : 88 860 1.0Belgium : 7 317 7 655 2.3 : 10 736 12 044 3.6Bulgaria 963 1 207 2 287 7.9 339 563 1 331 4.6Czech Republic 3 220 3 126 4 820 3.8 2 101 1 673 2 648 2.1Denmark 2 809 5 047 4 495 2.0 3 712 6 193 6 210 2.7Germany 15 782 20 350 26 289 1.1 42 619 55 504 60 467 2.5Estonia 420 585 749 4.9 107 243 472 3.1Ireland 2 290 3 256 4 470 2.4 1 960 3 942 6 318 3.4Greece (3) 4 904 10 285 11 357 5.0 1 169 2 549 2 383 1.0Spa<strong>in</strong> 23 739 33 557 42 170 4.0 3 985 7 687 14 360 1.4France 24 724 34 190 39 643 2.1 14 632 20 580 26 430 1.4Italy 26 355 28 193 31 038 2.0 14 764 17 801 19 673 1.3Cyprus 1 461 2 048 1 961 12.5 340 537 1 070 6.8Latvia 170 170 488 2.4 287 243 677 3.4Lithuania 317 538 840 3.0 245 360 835 3.0Luxembourg : 2 542 2 919 8.1 : 2 042 2 593 7.2Hungary 3 074 3 452 3 451 3.4 819 1 820 2 147 2.1Malta 571 645 663 12.2 168 162 272 5.0Netherlands 5 580 8 150 9 798 1.7 9 107 13 665 13 910 2.5Austria 9 699 11 887 13 781 5.1 8 915 9 923 7 703 2.8Poland 2 026 4 554 7 721 2.5 519 3 388 6 205 2.0Portugal 4 063 6 094 7 393 4.5 1 818 2 247 2 858 1.8Romania 465 354 1 068 0.9 602 419 1 114 0.9Slovenia 1 044 1 145 1 618 4.8 461 636 803 2.4Slovakia 481 769 1 493 2.7 387 470 1 206 2.2F<strong>in</strong>land 1 684 1 664 2 060 1.1 1 939 2 118 2 907 1.6Sweden 3 291 4 979 8 743 2.6 6 138 7 740 10 242 3.1United K<strong>in</strong>gdom 19 941 21 620 28 175 1.4 25 196 44 045 53 059 2.6Croatia (3) : : 6 264 16.7 : : 584 1.6Turkey (3) 6 174 8 967 13 422 2.8 1 513 1 988 2 185 0.5Norway (3) 1 896 2 296 2 866 1.0 3 955 5 358 9 197 3.2Switzerland (3) : : 8 477 2.7 : : 7 873 2.5Japan (3) 3 823 3 711 6 745 0.2 29 101 28 171 21 407 0.7United States 75 989 89 628 86 696 0.9 47 332 65 290 59 538 0.6(1) Extra-EU-27.(2) EA-13 <strong>in</strong>stead of EA-15; extra-EA-13.(3) 2006 <strong>in</strong>stead of 2007.Source: <strong>Eurostat</strong> (bop_its_deth, bop_its_det and nama_gdp_c), Economic and Social Research Institute, Bureau of Economic AnalysisEUROPE IN FIGURES — <strong>Eurostat</strong> <strong>yearbook</strong> <strong>2009</strong>331
Agriculture, forestryand fisheriesAgriculture was one of the first sectors of the economy (follow<strong>in</strong>g coal and steel) to receivethe attention of <strong>Europe</strong>an policymakers. Article 39 of the Treaty of Rome on theEEC (1957) set out the objectives for the first common agricultural policy (CAP); thesewere focused on <strong>in</strong>creas<strong>in</strong>g agricultural productivity as a way to ensure a fair standardof liv<strong>in</strong>g for the agricultural community, stabilis<strong>in</strong>g markets and ensur<strong>in</strong>g security ofsupply at affordable prices to consumers.As the primary objective of produc<strong>in</strong>g more food was realised, food surpluses accrued,distort<strong>in</strong>g trade and rais<strong>in</strong>g environmental concerns. These were the pr<strong>in</strong>cipal driversfor changes <strong>in</strong> the CAP, a process that started <strong>in</strong> the early 1990s and has resulted<strong>in</strong> a change from support for production towards a market-oriented and a more environment-friendlyand susta<strong>in</strong>able form of agriculture. These reforms have focusedma<strong>in</strong>ly on <strong>in</strong>creas<strong>in</strong>g the competitiveness of agriculture by reduc<strong>in</strong>g support pricesand compensat<strong>in</strong>g farmers by the <strong>in</strong>troduction of direct aid payments. A decisive stepcame <strong>in</strong> the 2003/04 CAP reforms <strong>with</strong> the decoupl<strong>in</strong>g of direct aids from productionand a move to try to realign the CAP <strong>with</strong> consumer concerns. The scope of this latestreform of the CAP was widened <strong>with</strong> the <strong>in</strong>troduction of a comprehensive rural developmentpolicy. Together these policies aim to encourage entrepreneurial behaviour sothat farm managers can respond better to market signals, <strong>in</strong>troduce new techniquesand promote diversified activities such as rural crafts, food process<strong>in</strong>g facilities onfarms, tourism, or afforestation, as well as promot<strong>in</strong>g susta<strong>in</strong>able farm<strong>in</strong>g practicesand various other rural development measures.In November 2007, the <strong>Europe</strong>an Commission adopted a Communication ‘Prepar<strong>in</strong>gthe Health Check of the CAP reform’ <strong>with</strong> the objective of assess<strong>in</strong>g the implementationof the 2003 CAP reforms, and to <strong>in</strong>troduce those adjustments to the reform processthat were deemed necessary. Notably, these proposals <strong>in</strong>cluded a shift <strong>in</strong> fund<strong>in</strong>gfrom direct payments to greater rural development support.EUROPE IN FIGURES — <strong>Eurostat</strong> <strong>yearbook</strong> <strong>2009</strong>333
9 Agriculture, forestry and fisheries9.1 Agriculture – farm structureand land useContrary to what is happen<strong>in</strong>g <strong>in</strong> someother parts of the world, forest cover <strong>in</strong>the EU is slowly <strong>in</strong>creas<strong>in</strong>g. Forests arepresent <strong>in</strong> a huge variety of climatic, geographic,ecological and socioeconomicconditions. Ecologically, EU forests belongto numerous vegetation zones, rang<strong>in</strong>gfrom the coastal pla<strong>in</strong>s to the Alp<strong>in</strong>ezone, while socioeconomic managementconditions vary from small family hold<strong>in</strong>gsto large estates belong<strong>in</strong>g to vertically<strong>in</strong>tegrated enterprises.Fish are a natural, biological, mobile(sometimes over wide distances) and renewableresource. Aside from fish farm<strong>in</strong>g,fish can not be owned until they havebeen caught. For this reason, fish stockscont<strong>in</strong>ue to be regarded as a common resource,which therefore need to be managedcollectively. This has led to policiesthat regulate the amount of fish<strong>in</strong>g, aswell as the types of fish<strong>in</strong>g techniquesand gear used <strong>in</strong> fish capture.IntroductionThe structure of agriculture <strong>in</strong> the MemberStates varies considerably. Amongother factors, this reflects differences <strong>in</strong>geology, topography, climate and naturalresources, as well as the diversity <strong>in</strong>regional activities, <strong>in</strong>frastructure and socialcustoms. The survey on the Structureof Agricultural Hold<strong>in</strong>gs (also known asthe Farm Structure Survey – FSS) helpsassess the agricultural situation acrossthe EU, monitor<strong>in</strong>g trends and transitions<strong>in</strong> the structure of hold<strong>in</strong>gs, whilemodell<strong>in</strong>g the impact of external developmentsor policy proposals.Rural development policy aims to improvecompetitiveness <strong>in</strong> agricultureand forestry, improve the environmentand countryside, improve the qualityof life <strong>in</strong> rural areas and encourage thediversification of rural economies. Asagriculture modernised and the importanceof <strong>in</strong>dustry and services <strong>with</strong><strong>in</strong> theeconomy <strong>in</strong>creased, agriculture becamemuch less important as a source of jobs.Consequently, more and more emphasisis placed on the role farmers can play <strong>in</strong>rural development, <strong>in</strong>clud<strong>in</strong>g forestry,biodiversity, diversification of the ruraleconomy to create alternative jobs andenvironmental protection <strong>in</strong> rural areas.The FSS cont<strong>in</strong>ues to be adapted to try toprovide the necessary data to help analyseand follow these types of developments.334 EUROPE IN FIGURES — <strong>Eurostat</strong> <strong>yearbook</strong> <strong>2009</strong>
Agriculture, forestry and fisheries 9Def<strong>in</strong>itions and data availabilityThe basic Farm Structure Survey (FSS)is carried out by Member States every 10years (the full scope be<strong>in</strong>g the agriculturalcensus) and <strong>in</strong>termediate sample surveysare carried out three times betweenthese basic surveys. The Member Statescollect <strong>in</strong>formation from <strong>in</strong>dividual agriculturalhold<strong>in</strong>gs and, observ<strong>in</strong>g strictrules of confidentiality, data are forwardedto <strong>Eurostat</strong>. The <strong>in</strong>formation collectedcovers land use, livestock numbers, ruraldevelopment, management and farm labour<strong>in</strong>put (<strong>in</strong>clud<strong>in</strong>g age, gender and relationshipto the holder). The survey datacan then be aggregated to different geographiclevels (Member States, regions,and for basic surveys also districts) andcan be arranged by size class, area status,legal status of hold<strong>in</strong>g, objective zone andfarm type.The basic unit underly<strong>in</strong>g the FSS is theagricultural hold<strong>in</strong>g. A hold<strong>in</strong>g is a technical-economicunit under s<strong>in</strong>gle managementengaged <strong>in</strong> agricultural production.The FSS covers all agriculturalhold<strong>in</strong>gs <strong>with</strong> a utilised agricultural area(UAA) of at least one hectare (ha) andthose hold<strong>in</strong>gs <strong>with</strong> a UAA of less than1 ha if their market production exceedscerta<strong>in</strong> natural thresholds.The utilised agricultural area (UAA)is the sum of arable land, permanentpasture and meadow, land used for permanentcrops and kitchen gardens. TheUAA excludes unutilised agriculturalland, woodland and land occupied bybuild<strong>in</strong>gs, farmyards, tracks, ponds, etc.Permanent crops are those not grown<strong>in</strong> rotation, other than permanent grassland,which occupy the soil for a longperiod and yield crops over several years.Permanent grassland and meadow island used permanently (for five years ormore) to grow herbaceous forage crops,through cultivation (sown) or naturally(self-seeded) and that is not <strong>in</strong>cluded <strong>in</strong>the crop rotation on the hold<strong>in</strong>g; the landcan be used for graz<strong>in</strong>g or mowed for silageor hay. Arable land is land worked(ploughed or tilled) regularly, generallyunder a system of crop rotation. Woodedarea is land area covered <strong>with</strong> trees orforest shrubs, <strong>in</strong>clud<strong>in</strong>g poplar plantations<strong>in</strong>side or outside woods and foresttreenurseries grown <strong>in</strong> woodland forthe hold<strong>in</strong>g’s own requirements, as wellas forest facilities (forest roads, storagedepots for timber, etc.). Built -up andrelated land comprises residential land,<strong>in</strong>dustrial land, quarries, pits and m<strong>in</strong>es,commercial land, land used by publicservices, land of mixed use, land usedfor transport and communications, fortechnical <strong>in</strong>frastructure, recreational andother open land. Scattered farm build<strong>in</strong>gs,yards and annexes are excluded.Some <strong>figures</strong> may refer to the closest yearfor which data is available (limit +/- 1 or 2years before or after).Other ga<strong>in</strong>ful activity is any activity otherthan one relat<strong>in</strong>g to farm work, <strong>in</strong>clud<strong>in</strong>gactivities carried out on the hold<strong>in</strong>gitself (camp<strong>in</strong>g sites, accommodationsfor tourists, etc.) or that use its resources(mach<strong>in</strong>ery, etc.) or products (suchas process<strong>in</strong>g farm products, renewableenergy production), and which have aneconomic impact on the hold<strong>in</strong>g. Otherga<strong>in</strong>ful activity is carried out by theholder, his/her family members, or one ormore partners on a group hold<strong>in</strong>g.EUROPE IN FIGURES — <strong>Eurostat</strong> <strong>yearbook</strong> <strong>2009</strong>335
9 Agriculture, forestry and fisheriesThe farm labour force is made-up of allpersons hav<strong>in</strong>g completed their compulsoryeducation (hav<strong>in</strong>g reached schoolleav<strong>in</strong>gage) who carried out farm workon the hold<strong>in</strong>g under survey dur<strong>in</strong>g the12 months up to the survey day. The <strong>figures</strong><strong>in</strong>clude the holders, even when notwork<strong>in</strong>g on the hold<strong>in</strong>g, whereas theirspouses are counted only if they carry outfarm work on the hold<strong>in</strong>g.. The holder isthe natural person (sole holder or groupof <strong>in</strong>dividuals) or the legal person (e.g. aco-operative, an <strong>in</strong>stitution) on whose accountand <strong>in</strong> whose name the hold<strong>in</strong>g isoperated and who is legally and economicallyresponsible for the hold<strong>in</strong>g, i.e. whotakes the economic risks of the hold<strong>in</strong>g.For group hold<strong>in</strong>gs, only the ma<strong>in</strong> holder(one person) is counted. The regular labourforce covers the family labour force(even those who were work<strong>in</strong>g accidentallyon the hold<strong>in</strong>g) and permanentlyemployed (regular) non-family workers.The family labour force <strong>in</strong>cludes theholder and the members of his/her familywho carried out farm work (<strong>in</strong>clud<strong>in</strong>g allpersons of retir<strong>in</strong>g age who cont<strong>in</strong>ue towork on the hold<strong>in</strong>g). One annual workunit (AWU) corresponds to the work performedby one person who is occupied onan agricultural hold<strong>in</strong>g on a full-time basis.Full-time means the m<strong>in</strong>imum hoursrequired by the national provisions govern<strong>in</strong>gcontracts of employment. If thesedo not <strong>in</strong>dicate the number of hours, then1 800 hours are taken to be the m<strong>in</strong>imum(225 work<strong>in</strong>g days of eight hours each).Ma<strong>in</strong> f<strong>in</strong>d<strong>in</strong>gsAccord<strong>in</strong>g to the FSS, there were 14.5 millionagricultural hold<strong>in</strong>gs <strong>in</strong> the EU-27<strong>in</strong> 2005. Among the Member States thatjo<strong>in</strong>ed the EU <strong>in</strong> 2004 and 2007, there wasa period of land restitution <strong>in</strong> the run-upto accession. This led to large State farmsbe<strong>in</strong>g divided up and handed back to private<strong>in</strong>dividuals, lead<strong>in</strong>g to a substantialrise <strong>in</strong> numbers of farms and workers.Over a quarter of agricultural hold<strong>in</strong>gs(29.4 %) <strong>in</strong> the EU-27 were located <strong>in</strong>Romania.The total EU-27 farm labour force was theequivalent of 12.7 million full-time workers<strong>in</strong> 2005. Just over one third (35 %)of the regular agricultural labour force<strong>in</strong> the EU-27 was female, although <strong>in</strong>the Baltic Member States this share wascloser to a half, reach<strong>in</strong>g 50 % <strong>in</strong> Latvia.Farm holders and their family membersmake up the vast majority of the labourforce, 81 % <strong>in</strong> the EU-27, <strong>with</strong> only theCzech Republic and Slovakia record<strong>in</strong>ga significantly lower share, reflect<strong>in</strong>g thedifferent structure of hold<strong>in</strong>g ownership<strong>in</strong> these countries. There are relatively few(6.7 %) agricultural holders <strong>in</strong> the EU-27under the age of 35 years, but a relativelylarge proportion (33.2 %) over the age of65 years.The UAA <strong>in</strong> the EU accounted for 40 %of total land area <strong>in</strong> 2005; <strong>in</strong> addition,wooded areas on farm hold<strong>in</strong>gs accountedfor a further 7.3 % of the total landarea. Arable land made up three fifths ofthe UAA and permanent grassland onethird, while land for permanent crops accountedfor around 6 % of the UAA.336 EUROPE IN FIGURES — <strong>Eurostat</strong> <strong>yearbook</strong> <strong>2009</strong>
Agriculture, forestry and fisheries 9Table 9.1: Agricultural hold<strong>in</strong>gsNumber ofagricultural hold<strong>in</strong>gs(1 000)2003 2005 2007 2003 2005 2007 2005 2007EU-27 15 021.0 14 478.6 : : : : : :Euro area 5 975.2 5 565.6 : : : : : :Belgium 54.9 51.5 48.0 16.6 15.2 : 4.2 4.7Bulgaria 665.6 534.6 : 195.0 152.6 : 14.5 :Czech Republic 45.8 42.3 39.4 8.5 6.8 5.6 4.7 5.2Denmark 48.6 51.7 44.6 8.0 6.6 5.4 17.9 15.1Germany 412.3 389.9 : 121.8 110.4 : : :Estonia 36.9 27.8 23.3 12.4 9.2 6.1 : :Ireland 135.6 132.7 128.2 28.1 23.8 : 0.0 0.0Greece 824.5 833.6 : : : : 65.2 :Spa<strong>in</strong> 1 140.7 1 079.4 : 51.0 42.4 : 46.4 :France 614.0 567.1 : 113.9 103.9 : 18.0 :Italy 1 963.8 1 728.5 : 67.5 61.0 : 37.6 :Cyprus 45.2 45.2 : 0.3 0.2 : 77.3 :Latvia 126.6 128.7 107.8 63.7 50.9 43.7 0.3 0.2Lithuania 272.1 253.0 230.3 193.4 170.8 123.2 0.1 0.0Luxembourg 2.5 2.5 2.3 1.0 1.0 : : 0.0Hungary 773.4 714.8 626.3 22.0 16.3 : 2.5 0.2Malta 11.0 11.1 11.0 0.2 0.2 0.2 27.8 25.5Netherlands 85.5 81.8 76.7 25.0 23.5 24.5 23.6 26.1Austria 173.8 170.6 : 65.1 54.6 : 4.4 :Poland 2 172.2 2 476.5 2 391.0 873.8 727.1 651.1 1.0 1.1Portugal 359.3 323.9 : 27.1 15.9 : 62.2 :Romania 4 484.9 4 256.2 : 1 204.9 1 134.4 : 3.5 :Slovenia 77.2 77.2 75.3 17.2 19.7 19.2 2.3 2.3Slovakia 71.7 68.5 : 14.2 13.5 : 10.5 :F<strong>in</strong>land 75.0 70.6 68.2 19.4 16.9 : 8.1 8.5Sweden 67.9 75.8 72.6 9.7 8.6 7.1 6.0 5.2United K<strong>in</strong>gdom 280.6 286.8 : 28.2 26.3 : 1.4 :Norway 58.2 53.0 : 17.5 15.9 : 16.8 :Switzerland : 63.6 : : : : 0.0 :Source: <strong>Eurostat</strong> (tag00001, ef_r_nuts and ef_ov_lusum)Hold<strong>in</strong>gs <strong>with</strong>dairy cows(1 000)Hold<strong>in</strong>gs <strong>with</strong>irrigable area(% of UAA)EUROPE IN FIGURES — <strong>Eurostat</strong> <strong>yearbook</strong> <strong>2009</strong>337
9 Agriculture, forestry and fisheriesTable 9.2: Farm labour force, 2007 (1)Totalfarmlabourforce(1 000Regularfarmlabourforce(% oftotal)Full-timeregularfarmlabourforce(% of total)Femaleregularfarmlabourforce(% of total)Familyfarmlabourforce(% oftotal)Agric.holdersbe<strong>in</strong>g anaturalperson(1 000)Agric.holders=65yearsold(1 000)AWU) (2)EU-27 12 714 92 33 35 81 14 222 956 4 722Euro area 5 642 89 44 28 73 5 366 300 1 774Belgium 66 95 71 29 79 44 3 9Bulgaria 625 96 41 39 87 531 22 222Czech Republic 137 98 68 32 27 36 4 7Denmark 56 96 70 23 61 44 3 9Germany 643 92 51 29 70 385 35 28Estonia 32 98 46 46 61 22 1 7Ireland 148 98 60 21 93 128 9 32Greece 601 85 21 30 82 833 57 307Spa<strong>in</strong> 993 81 41 20 65 1 028 54 359France 855 89 66 25 49 474 42 75Italy 1 374 90 37 29 82 1 699 56 735Cyprus 29 89 30 31 73 45 1 12Latvia 105 99 30 50 84 108 8 32Lithuania 180 98 14 48 85 230 10 93Luxembourg 4 98 63 27 85 2 0 0Hungary 403 97 25 37 77 619 47 172Malta 4 99 41 14 88 11 0 3Netherlands 165 91 56 26 61 73 3 13Austria 166 97 51 41 89 167 18 19Poland 2 263 97 34 42 95 2 387 294 388Portugal 398 93 33 41 83 317 7 150Romania 2 596 93 3 43 91 4 238 218 1 849Slovenia 84 96 21 41 92 75 3 26Slovakia 99 97 43 33 43 67 3 20F<strong>in</strong>land 72 94 56 30 83 67 6 4Sweden 65 97 42 26 76 68 4 15United K<strong>in</strong>gdom 339 94 55 24 69 274 9 84Norway 59 95 35 25 83 53 5 4Switzerland : : : : : 63 : :(1) EU-27, euro area, Bulgaria, Germany, Greece, Spa<strong>in</strong>, France, Italy, Cyprus, Austria, Portugal, Romania, Slovakia, the United K<strong>in</strong>gdom,Norway and Switzerland, 2005.(2) AWU: annual work unit.Source: <strong>Eurostat</strong> (tag00020, ef_ov_lfft, ef_so_lfwtime, ef_so_lfaa, tag00028, tag00029 and tag00030)338 EUROPE IN FIGURES — <strong>Eurostat</strong> <strong>yearbook</strong> <strong>2009</strong>
Agriculture, forestry and fisheries 9Figure 9.1: Agricultural hold<strong>in</strong>gs <strong>with</strong> another ga<strong>in</strong>ful activity, 2007 (1)(%)403020100EU-27F<strong>in</strong>landFranceUnited K<strong>in</strong>gdomDenmarkSwedenGermanyRomaniaAustriaNetherlandsLuxembourgCzech RepublicLatviaPortugalEstoniaItalyCyprusHungaryPolandSloveniaBelgiumMaltaSpa<strong>in</strong>SlovakiaBulgariaGreeceLithuaniaIrelandNorway(1) EU-27, Bulgaria, Germany, Greece, Spa<strong>in</strong>, France, Italy, Cyprus, Austria, Portugal, Romania, Slovakia, the United K<strong>in</strong>gdom andNorway, 2005.Source: <strong>Eurostat</strong> (tag00096)Figure 9.2: Agricultural area by land use, EU (1)(% of land area)504030201001995 1997 2000 2003 2005Utilised agricultural areaArable landPermanent grasslandWooded areaLand under permanent crops(1) Data available for the years shown <strong>in</strong> the figure; EU total based on data for Belgium, Denmark, Ireland, Greece, Spa<strong>in</strong>, Italy,Luxembourg, the Netherlands, Austria, Portugal, F<strong>in</strong>land, Sweden and the United K<strong>in</strong>gdom.Source: <strong>Eurostat</strong> (ef_lu_ovcropesu and reg_d3area)EUROPE IN FIGURES — <strong>Eurostat</strong> <strong>yearbook</strong> <strong>2009</strong>339
9 Agriculture, forestry and fisheriesTable 9.3: Area by land useShare of land area, 2007 (%) (2)Landof which:Built-uparea, Utilised Land underWooded area,2005(1 000 ha) (1)agriculturalarea (total)permanentcropsPermanentgrasslandArablelandarea(not UAA)2000(%) (3)EU-27 430 296 40.0 2.5 13.0 24.3 7.3 :Euro area 256 562 40.4 3.8 13.3 23.2 7.2 :Belgium 3 033 45.3 0.7 16.9 27.8 0.2 18.6Bulgaria 11 100 24.6 0.7 1.0 22.7 10.1 :Czech Republic 7 726 45.5 0.5 11.8 33.3 18.9 10.5Denmark 4 310 61.8 0.2 4.7 56.9 4.8 16.9Germany 35 709 47.7 0.6 13.8 33.3 3.9 12.8Estonia 4 343 20.9 0.1 6.3 14.4 5.3 :Ireland 6 839 60.5 0.0 45.8 14.7 3.6 :Greece 13 071 30.5 8.3 6.3 15.7 0.4 :Spa<strong>in</strong> 50 600 49.1 8.4 17.1 23.6 9.6 :France 63 283 43.6 1.7 12.8 29.0 1.6 6.7Italy 29 511 43.1 7.7 11.3 23.9 12.8 :Cyprus 925 16.4 4.4 0.0 11.9 0.3 2.2Latvia 6 229 28.5 0.3 10.3 17.8 11.4 4.2Lithuania 6 268 42.3 0.3 13.1 28.9 2.6 3.2Luxembourg 259 50.6 0.6 26.4 23.6 2.5 8.5Hungary 9 303 45.5 1.7 5.4 38.2 14.6 :Malta 32 32.7 4.2 0.0 25.4 0.0 :Netherlands 3 376 56.7 1.0 24.3 31.4 0.3 17.0Austria 8 248 39.6 0.8 21.7 17.0 32.1 4.6Poland 31 269 49.5 1.2 10.5 37.6 3.8 6.6Portugal 9 212 39.9 7.0 19.2 13.5 9.2 17.8Romania 23 000 60.5 1.5 19.7 38.6 4.3 4.4Slovenia 2 014 24.3 1.3 14.3 8.6 18.8 3.9Slovakia 4 903 38.3 0.5 10.8 26.9 23.6 7.5F<strong>in</strong>land 30 409 7.5 0.0 0.1 7.4 10.4 2.5Sweden 41 034 7.6 0.0 1.2 6.4 9.1 :United K<strong>in</strong>gdom 24 250 65.8 0.1 40.4 25.2 2.3 :Croatia : : : : : : 8.6Iceland : : : : : : 1.4Norway 30 428 3.4 0.0 1.3 2.0 8.0 :Switzerland 4 000 26.5 0.6 15.8 10.2 2.8 7.0(1) Estonia, Ireland, Latvia, Lithuania, the Netherlands, Slovenia, F<strong>in</strong>land and Sweden, 2007.(2) EU-27, euro area, Bulgaria, Germany, Greece, Spa<strong>in</strong>, France, Italy, Cyprus, Austria, Portugal, Romania, Slovakia, the United K<strong>in</strong>gdom,Norway and Switzerland, 2005.(3) Latvia and Luxembourg, 1990; F<strong>in</strong>land and Switzerland, 1995.Source: <strong>Eurostat</strong> (ef_lu_ovcropesu, reg_d3area and tsdnr510)340 EUROPE IN FIGURES — <strong>Eurostat</strong> <strong>yearbook</strong> <strong>2009</strong>
Agriculture, forestry and fisheries 99.2 Agricultural output, price<strong>in</strong>dices and <strong>in</strong>comeIntroductionOne of the pr<strong>in</strong>cipal objectives of theCommon Agricultural Policy (CAP) rema<strong>in</strong>sthe aim of provid<strong>in</strong>g farmers <strong>with</strong>a reasonable standard of liv<strong>in</strong>g. Althoughthis concept is not def<strong>in</strong>ed explicitly, oneof the measures tracked is the developmentof <strong>in</strong>comes from farm<strong>in</strong>g activities.Economic Accounts for Agriculture(EAA) are one of the data sources thatprovide such <strong>in</strong>come measures (see def<strong>in</strong>itionsbelow). This macro-economic setof data is used to analyse the productionprocess of the agricultural activity andthe primary <strong>in</strong>come generated by it. TheEAA provide key <strong>in</strong>sights <strong>in</strong>to the economicviability of agriculture, its contributionto a Member State’s wealth, thestructure and composition of agriculturalproduction and <strong>in</strong>puts, the remunerationof factors of production, relationshipsbetween prices and quantities of both<strong>in</strong>puts and outputs, and responds to theneed to have <strong>in</strong>ternationally comparable<strong>in</strong>formation.<strong>Eurostat</strong> also collects annual agriculturalprices (<strong>in</strong> pr<strong>in</strong>ciple net of VAT) to compareagricultural price levels betweenMember States and study sales channels.Price <strong>in</strong>dices for agricultural productsand the means of agricultural production,on the other hand, are used pr<strong>in</strong>cipallyto analyse price developments andtheir effect on agricultural <strong>in</strong>come.Def<strong>in</strong>itions and data availabilityThe EAA comprise a production account,a generation of <strong>in</strong>come account, an entrepreneurial<strong>in</strong>come account and some elementsof a capital account. For the outputitems of agricultural, hunt<strong>in</strong>g and relatedservice activities, Member States transmitto <strong>Eurostat</strong> values at basic prices, aswell as their components (the value atproducer prices, subsidies on productsand taxes on products). For the items of<strong>in</strong>termediate consumption, values at purchaserprices are transmitted. The datafor the production account and for grossfixed capital formation are transmitted <strong>in</strong>both current prices and the prices of theprevious year.Agricultural <strong>in</strong>come <strong>in</strong>dicators (<strong>in</strong> theEAA) are presented <strong>in</strong> the form of an<strong>in</strong>dex of real <strong>in</strong>come of factors <strong>in</strong> agriculturalactivity per annual work unit(<strong>in</strong>dicator A); the <strong>in</strong>dex of real net agriculturalentrepreneurial <strong>in</strong>come, per unpaidannual work unit (<strong>in</strong>dicator B), and;net entrepreneurial <strong>in</strong>come of agriculture(<strong>in</strong>dicator C).The concept of output, for animal andcrop output, comprises sales, changes <strong>in</strong>stocks, and products used for process<strong>in</strong>gand own f<strong>in</strong>al use by producers. EUagricultural price <strong>in</strong>dices are obta<strong>in</strong>edby a base-weighted Laspeyres calculation(2000=100), and are expressed both<strong>in</strong> nom<strong>in</strong>al terms, and deflated us<strong>in</strong>g animplicit HICP deflator.EUROPE IN FIGURES — <strong>Eurostat</strong> <strong>yearbook</strong> <strong>2009</strong>341
9 Agriculture, forestry and fisheriesMa<strong>in</strong> f<strong>in</strong>d<strong>in</strong>gsAgricultural gross value added <strong>in</strong> theEU-27 <strong>in</strong>creased by 7.4 % <strong>in</strong> 2007 (compared<strong>with</strong> 2006) and as a result was at itshighest level <strong>in</strong> the last ten years. In 2006and 2007 both crop and animal output<strong>in</strong>creased, <strong>with</strong> the growth <strong>in</strong> crop outputparticularly strong.Deflated agricultural producer (output)prices rose on average by 0.8 % per annum<strong>in</strong> the EU-27 between 2002 and2007. An analysis of (nom<strong>in</strong>al) producerprice <strong>in</strong>dices over the same period showsthat price <strong>in</strong>creases averaged 3.4 % perannum, <strong>with</strong> crop output prices ris<strong>in</strong>gmore than twice as fast as animal outputprices (4.5 % per annum compared<strong>with</strong> 2.0 % per annum). Several cerealproducts recorded double-digit annualaverage price <strong>in</strong>creases over this five yearperiod – for example, rye, barley andwheat – due almost entirely to extremelyhigh price <strong>in</strong>creases <strong>in</strong> 2007. Only a fewagricultural products recorded a fall <strong>in</strong>prices, most notably sugar beet, for whichprices fell by 27 % <strong>in</strong> total between 2004(the latest peak <strong>in</strong> prices) and 2007, whilethere was almost no change <strong>in</strong> the priceof the output of pigs or sheep and goatsover the period considered (2002-2007).Alongside an <strong>in</strong>crease <strong>in</strong> gross valueadded, there was an average 5.8 % rise <strong>in</strong><strong>in</strong>come from agricultural activity (<strong>in</strong>dicatorA) across the EU-27 <strong>in</strong> 2007 (whencompared <strong>with</strong> the year before). Therewere large differences between MemberStates: Romania recorded a fall of 16.7 %<strong>in</strong> <strong>in</strong>come from agricultural activity <strong>in</strong>2007, <strong>with</strong> Malta, Portugal and Italy record<strong>in</strong>greductions of at least 3 %; <strong>in</strong>Lithuania this <strong>in</strong>dicator rose by 46.0 % <strong>in</strong>2007, while Belgium, Poland, the CzechRepublic and Germany all recorded <strong>in</strong>creases<strong>in</strong> excess of 20 %.342 EUROPE IN FIGURES — <strong>Eurostat</strong> <strong>yearbook</strong> <strong>2009</strong>
Agriculture, forestry and fisheries 9Table 9.4: Agricultural output and value added(EUR million)2000 2005 2007 2000 2005 2007 2000 2005 2007EU-27 130 634 129 933 142 726 149 884 157 679 185 220 126 095 128 459 137 791Euro area (1) 105 665 102 056 111 621 119 965 123 537 141 725 91 785 91 003 97 495Belgium 2 484 2 135 2 346 2 931 2 903 3 479 3 841 3 556 3 772Bulgaria 1 634 1 544 1 243 1 305 1 627 1 511 1 448 1 129 1 242Czech Republic 831 886 1 068 1 396 1 674 2 389 1 399 1 574 1 670Denmark 2 496 2 297 2 487 2 603 2 474 3 635 4 767 4 867 4 942Germany 13 571 13 000 14 565 18 425 18 167 23 293 19 344 19 042 20 382Estonia 137 186 254 141 201 309 183 265 293Ireland 1 617 1 642 1 933 1 229 1 380 1 598 3 655 3 652 4 105Greece 6 240 6 581 6 062 6 525 7 024 6 650 2 499 2 711 2 754Spa<strong>in</strong> 19 225 20 345 22 571 19 539 21 234 23 700 11 692 12 641 13 958France 23 890 21 252 25 544 30 337 29 864 36 780 22 242 21 663 22 299Italy 24 527 24 404 24 088 24 234 25 434 25 784 13 438 13 178 14 310Cyprus : 330 338 : 281 300 : 292 299Latvia 182 222 343 192 308 500 220 282 377Lithuania 394 407 521 626 657 881 481 693 836Luxembourg 103 102 124 76 81 99 148 155 165Hungary 1 814 1 887 2 083 2 343 3 020 3 704 2 073 2 117 2 211Malta 64 45 45 48 40 44 77 63 63Netherlands 9 053 7 829 8 786 9 480 10 131 11 645 8 548 7 906 8 906Austria 2 127 2 167 2 689 2 159 2 262 3 008 2 513 2 540 2 788Poland 4 598 5 161 7 186 5 992 6 043 9 463 5 886 7 585 8 930Portugal 2 160 1 998 2 212 3 597 3 584 3 783 2 178 2 241 2 333Romania 4 121 6 083 5 822 4 887 7 687 8 603 2 984 4 051 4 083Slovenia 399 397 388 444 496 585 493 468 499Slovakia 311 382 515 459 691 891 742 759 889F<strong>in</strong>land 670 602 702 1 434 1 473 1 908 1 689 1 718 1 724Sweden 1 094 1 060 1 323 1 805 1 634 2 218 2 303 2 047 2 101United K<strong>in</strong>gdom 7 147 6 975 8 120 7 677 7 309 8 461 11 252 11 262 12 160Norway 856 831 926 1 199 1 229 1 237 1 620 1 800 1 959Switzerland 3 053 2 582 2 334 3 118 2 855 2 824 3 359 3 171 3 042(1) EA-12 <strong>in</strong>stead of EA-15.Source: <strong>Eurostat</strong> (aact_eaa01)Gross value added at producerprices of agricultural <strong>in</strong>dustryCrop output atproducer pricesAnimal output atproducer pricesEUROPE IN FIGURES — <strong>Eurostat</strong> <strong>yearbook</strong> <strong>2009</strong>343
9 Agriculture, forestry and fisheriesFigure 9.3: Agricultural output and gross value added (nom<strong>in</strong>al), EU-27(2000=100)130120110100901998 1999 2000 2001 2002 2003 2004 2005 2006 2007Crop output at producer pricesGross value added at producer prices of the agricultural <strong>in</strong>dustryAnimal output at producer pricesSource: <strong>Eurostat</strong> (aact_eaa01)Figure 9.4: Evolution of deflated price <strong>in</strong>dices of agricultural output and means of agriculturalproduction, 2002-07(average annual growth rate, %)6420-2-4-6EU-27BelgiumBulgaria (1)Czech RepublicDenmarkGermanyEstonia (1)IrelandGreeceSpa<strong>in</strong>FranceItalyCyprusLatviaLithuania (1)LuxembourgHungaryMaltaNetherlandsAustriaPolandPortugalRomania (1)SloveniaSlovakiaF<strong>in</strong>landSwedenUnited K<strong>in</strong>gdomOutput <strong>in</strong>dex (2) Input <strong>in</strong>dex (3)(1) Input <strong>in</strong>dex, not available.(2) Estonia and Cyprus, 2004-07.(3) Cyprus and Slovakia, 2004-07; EU-27, provisional.Source: <strong>Eurostat</strong> (tag00046 and tag00052)344 EUROPE IN FIGURES — <strong>Eurostat</strong> <strong>yearbook</strong> <strong>2009</strong>
Agriculture, forestry and fisheries 9Table 9.5: Price <strong>in</strong>dices of agricultural output (nom<strong>in</strong>al), EU-27(2000=100)2000 2001 2002 2003 2004 2005 2006 2007CROP OUTPUT (<strong>in</strong>clud<strong>in</strong>g fruit and vegetables) 100.0 105.7 106.7 114.7 113.0 107.7 116.5 133.1Cereals (<strong>in</strong>clud<strong>in</strong>g seeds) 100.0 101.2 93.9 101.0 108.2 90.7 102.6 158.4Industrial crops 100.0 108.2 106.2 111.4 113.3 105.9 104.1 113.1Forage plants 100.0 113.7 113.8 116.5 125.6 105.8 103.1 118.6Vegetables and horticultural products 100.0 105.0 109.3 116.3 107.6 115.1 117.4 121.9Potatoes (<strong>in</strong>clud<strong>in</strong>g seeds) 100.0 125.2 126.0 145.7 141.1 128.8 201.4 198.1Fruits 100.0 109.8 115.3 129.3 124.4 120.4 122.3 134.2W<strong>in</strong>e 100.0 95.7 96.6 100.2 102.2 92.3 92.5 98.7Olive oil 100.0 96.9 105.4 114.3 124.7 146.1 162.9 135.2Other crop products 100.0 103.2 101.7 106.2 103.9 104.8 107.8 125.1ANIMAL OUTPUT 100.0 107.4 101.5 101.2 104.1 105.3 107.7 111.9Animals 100.0 106.1 97.8 97.0 103.5 106.5 110.9 108.2Cattle 100.0 88.5 94.2 96.6 101.4 108.5 116.7 113.8Cattle (exclud<strong>in</strong>g calves) 100.0 88.6 95.8 97.0 100.4 109.3 116.8 113Calves 100.0 95.2 96.2 103.4 107.1 103.7 115.4 117.5Pigs 100.0 119.9 98.4 91.3 102.6 103.7 107.4 98.5Equ<strong>in</strong>es 100.0 111.6 109.6 104.3 102.4 104.5 115.7 117.4Sheep and goats 100.0 117.4 116.9 119.9 119.6 120.0 122.5 116.1Poultry 100.0 107.4 101.5 104.4 104.7 103.6 104.0 117.4Other animals 100.0 109.5 91.4 102.5 102.8 102.5 106.8 96.3Animal products 100.0 105.8 101.6 102.0 104.8 103.7 103.2 117.2Milk 100.0 107.8 103.6 103.1 103.7 103.4 101.6 115.3Eggs 100.0 101.7 102.7 119.4 108.7 102.4 110.9 129.5Other animal products 100.0 113.2 114.0 105.4 124.0 121.5 129.9 123.2AGRICULTURAL GOODS (CROP & ANIMAL OUTPUT) 100.0 106.4 103.9 107.9 108.6 106.5 112.2 122.6Source: <strong>Eurostat</strong> (apri_pi00_outa)EUROPE IN FIGURES — <strong>Eurostat</strong> <strong>yearbook</strong> <strong>2009</strong>345
9 Agriculture, forestry and fisheriesTable 9.6: Index of <strong>in</strong>come from agricultural activity (<strong>in</strong>dicator A)(2000=100)1997 1998 1999 2000 2001 2002 2003 2004 2005 2006 2007EU-27 : : : 100.0 109.8 104.9 106.6 116.1 105.8 109.6 116.0Euro area (1) 100.8 98.3 97.2 100.0 103.7 96.6 97.9 99.5 92.4 95.2 103.2Belgium 99.7 95.2 88.8 100.0 91.7 81.1 89.6 91.1 68.0 70.5 89.5Bulgaria : : : 100.0 111.8 89.9 84.6 91.9 97.9 94.3 97.0Czech Republic : 97.8 82.3 100.0 127.2 99.6 87.3 137.5 152.1 153.9 186.2Denmark 112.2 81.1 78.5 100.0 119.8 85.3 83.3 93.8 95.3 102.5 107.5Germany 87.5 78.6 77.8 100.0 124.5 91.9 84.6 122.5 110.9 116.1 139.5Estonia 76.6 115.0 76.0 100.0 134.2 128.7 136.9 233.3 250.3 236.4 335.3Ireland 85.3 82.1 76.5 100.0 94.6 82.6 79.1 83.6 99.4 88.5 98.6Greece 104.9 103.7 102.1 100.0 101.0 97.7 90.1 84.9 86.1 85.3 86.0Spa<strong>in</strong> 106.5 102.1 95.8 100.0 107.9 104.5 118.1 108.6 96.0 95.4 105.3France 101.4 105.7 101.3 100.0 100.8 97.7 95.8 94.4 90.0 99.5 110.9Italy 102.0 99.7 105.5 100.0 98.1 96.4 96.7 97.0 84.6 81.5 79.1Cyprus : : 102.7 100.0 111.9 113.3 108.3 96.8 95.2 99.3 100.3Latvia : 132.0 94.8 100.0 129.8 127.7 140.0 233.2 243.0 314.3 336.7Lithuania 122.8 130.0 105.3 100.0 92.6 86.0 96.6 152.6 191.8 179.4 262.0Luxembourg 101.6 114.9 105.7 100.0 101.1 101.2 96.0 95.9 97.0 93.1 110.7Hungary 169.9 135.1 105.1 100.0 107.1 91.0 91.7 144.7 145.6 162.9 174.6Malta : 116.5 111.9 100.0 113.0 112.1 106.4 110.9 107.7 107.6 101.8Netherlands 119.3 106.9 99.1 100.0 93.4 79.6 85.5 79.5 79.0 94.1 92.4Austria 93.2 91.5 92.7 100.0 117.3 108.4 107.4 112.2 109.7 119.0 132.2Poland : 113.7 98.5 100.0 115.0 103.9 96.0 180.8 164.1 181.3 227.7Portugal 105.6 95.4 117.8 100.0 107.3 102.4 103.5 114.4 104.8 109.4 104.9Romania : 158.2 120.9 100.0 174.6 159.7 192.1 278.9 161.0 148.4 123.5Slovenia 93.3 91.3 89.8 100.0 86.8 114.6 90.3 139.2 139.9 136.4 150.6Slovakia 111.1 98.5 104.1 100.0 113.6 106.7 100.3 129.7 120.9 147.9 154.0F<strong>in</strong>land 80.6 65.8 82.2 100.0 97.0 97.6 103.8 101.5 114.9 110.6 125.0Sweden 101.1 104.5 91.1 100.0 107.8 119.0 117.5 106.5 105.9 105.6 123.1United K<strong>in</strong>gdom 120.2 103.3 100.5 100.0 105.1 117.0 133.3 125.3 119.2 126.7 134.3Norway 115.4 127.8 115.3 100.0 97.5 102.1 99.3 98.1 80.6 76.2 85.8Switzerland 98.4 100.9 97.0 100.0 93.0 99.1 92.1 102.8 96.9 94.5 101.3(1) EA-12 <strong>in</strong>stead of EA-15.Source: <strong>Eurostat</strong> (tag00057)346 EUROPE IN FIGURES — <strong>Eurostat</strong> <strong>yearbook</strong> <strong>2009</strong>
Agriculture, forestry and fisheries 99.3 Agricultural productsIntroductionIn October 2007 the Council adoptedlegislation to establish a s<strong>in</strong>gle CommonMarket Organisation (CMO) for agriculturalproducts. This is designed to reducethe volume of legislation <strong>in</strong> the farm<strong>in</strong>gsector, improve legislative transparency,and make agricultural policy more easilyaccessible. Dur<strong>in</strong>g the course of 2008, thes<strong>in</strong>gle CMO has replaced 21 CMOs fordifferent products such as bananas, eggs,sugar or w<strong>in</strong>e.Collect<strong>in</strong>g data on agricultural productsis important to understand developments<strong>in</strong> the markets across Member States,both current (estimated production levelsfor the current year) and historical(to help dist<strong>in</strong>guish between cycles andchang<strong>in</strong>g production patterns for example),and also to analyse the response topolicy actions or test<strong>in</strong>g policy scenarios.As predom<strong>in</strong>antly supply side <strong>in</strong>formation,agricultural product data are importantto understand correspond<strong>in</strong>g pricedevelopments (which are of particular<strong>in</strong>terest to agricultural commodity tradersand policy analysts) but can also illustratethe consequences of policy decisionstaken <strong>with</strong><strong>in</strong> agriculture.Def<strong>in</strong>itions and data availabilityAnnual statistics on the production of200 specific crops are mostly covered byCouncil regulations, although the datafor fresh fruit and vegetables are collectedunder gentlemen’s agreements fromMember States.Crop production <strong>figures</strong> relate to harvestedproduction. Agricultural productionof crops is harvested production (exclud<strong>in</strong>glosses to the harvest). The harvestedproduction <strong>in</strong>cludes marketed quantities,as well as quantities consumed directlyon the farm, losses and waste onthe hold<strong>in</strong>g, and losses dur<strong>in</strong>g transport,storage and packag<strong>in</strong>g. Cereals <strong>in</strong>cludewheat (common wheat and spelt anddurum wheat), rye, mesl<strong>in</strong>, barley, oats,mixed gra<strong>in</strong> other than mesl<strong>in</strong>, gra<strong>in</strong>maize, sorghum, triticale, other cereals,and rice. Vegetables <strong>in</strong>clude brassicas (forexample, cabbage, cauliflower and broccoli),other leafy or stalked vegetables (forexample, celery, leeks, lettuce, sp<strong>in</strong>achand asparagus), vegetables cultivated forfruit (for example, tomatoes, cucumbers,gherk<strong>in</strong>s, melons, egg plant (auberg<strong>in</strong>e),pumpk<strong>in</strong>s and red pepper), root and tubervegetables (for example, turnips, carrots,onions, garlic, beetroot and radishes),pulses (for example, peas and beans),cultivated mushrooms, wild productsand other fresh vegetables. Fruit <strong>in</strong>cludesapples, pears, stoned fruits (for example,peaches or apricots), nuts (for example,walnuts or hazelnuts), other top fruits(for example, figs or kiwi), berries, citrusfruits, grapes, olives and wild fruits.Statistics on milk, eggs and meat productsare also compiled accord<strong>in</strong>g toCommunity legislation. Milk productioncovers production on the farm of milkfrom cows, ewes, goats and buffaloes. Adist<strong>in</strong>ction should be made between milkcollected by dairies and milk productionEUROPE IN FIGURES — <strong>Eurostat</strong> <strong>yearbook</strong> <strong>2009</strong>347
9 Agriculture, forestry and fisherieson the farm. Milk collection is only a partof the total use of milk production on thefarm, the rema<strong>in</strong>der generally <strong>in</strong>cludesdomestic consumption, direct sale andcattle feed. Dairy cows are female bov<strong>in</strong>esthat have calved (<strong>in</strong>clud<strong>in</strong>g any aged lessthan 2 years). They are cows kept exclusivelyor pr<strong>in</strong>cipally for the productionof milk for human consumption and/ordairy produce, <strong>in</strong>clud<strong>in</strong>g cows for slaughter(fattened or not between last lactationand slaughter.Meat production is based on the carcassweight of meat fit for human consumption.The concept of carcass weight variesaccord<strong>in</strong>g to the animal under consideration.For pigs (the species Sus), it is theweight of the slaughtered pig’s cold body,either whole or divided <strong>in</strong> half along themid-l<strong>in</strong>e, after be<strong>in</strong>g bled and evisceratedand after removal of the tongue, bristles,hooves, genitalia, flare fat, kidneys anddiaphragm. Regard<strong>in</strong>g cattle (the speciesBos taurus), it is the weight of theslaughtered animal’s cold body after be<strong>in</strong>gsk<strong>in</strong>ned, bled and eviscerated, andafter removal of the external genitalia,the limbs, the head, the tail, the kidneysand kidney fats, and the udder. Forsheep and goats, the carcass weight is theslaughtered animal’s cold body after hav<strong>in</strong>gbeen bled, sk<strong>in</strong>ned and eviscerated,and after removal of the head, feet, tailand genital organs; kidneys and kidneyfats are <strong>in</strong>cluded. For poultry (def<strong>in</strong>ed ashens, chicken, ducks, turkey, gu<strong>in</strong>ea fowland geese), the weight is the cold body ofslaughtered farmyard poultry after be<strong>in</strong>gbled, plucked and eviscerated; the value<strong>in</strong>cludes poultry offal, <strong>with</strong> the exceptionof foie gras. For all other animal species,the carcass weight is considered to be theweight of the animal’s cold body.Ma<strong>in</strong> f<strong>in</strong>d<strong>in</strong>gsThe EU-27 produced 258.4 million tonnesof cereals <strong>in</strong> 2007, of which a little underhalf (46.0 %) was wheat, more than onefifth (22.1 %) barley, and less than onefifth gra<strong>in</strong> maize (18.4 %). France andGermany were by far the largest cereal,sugar beet and rape produc<strong>in</strong>g MemberStates, together account<strong>in</strong>g for nearly40 % of the EU-27’s cereal production,over 50 % of its sugar beet production,and over 60 % of its rape production <strong>in</strong>2007. While EU-27 production of cerealsfluctuated between 2000 and 2007, potatoesand sugar beet production decreasedthrough to 2006, while rape production<strong>in</strong>creased significantly (also to 2006).In the EU-27, the most important vegetables<strong>in</strong> terms of production were tomatoes,carrots and onions, while the mostimportant fruits were apples, orangesand peaches. Spa<strong>in</strong> and Italy had the largestvegetables and fruit production, bothexceed<strong>in</strong>g 13.5 million tonnes of vegetablesand around 20 million tonnes offruit production. Indeed, together thesetwo Member States produced more fruitthan all of the other Member States puttogether.The pr<strong>in</strong>cipal meat product <strong>in</strong> the EUis pig meat (22.9 million tonnes for theEU-27 <strong>in</strong> 2007), significantly more thanother types of meat, such as beef/veal(8.2 million tonnes). A little over onefifth (21.8 %) of pig meat production <strong>in</strong>the EU-27 came from Germany, the nexthighest contributions com<strong>in</strong>g from Spa<strong>in</strong>(15.4 %) and France (10.0 %): the 7.9 %share of Denmark is also notable. A littleunder one fifth (18.7 %) of beef/veal<strong>in</strong> the EU-27 was produced <strong>in</strong> France <strong>in</strong>2007, <strong>with</strong> further significant productioncom<strong>in</strong>g from Germany, Italy, the UnitedK<strong>in</strong>gdom, Spa<strong>in</strong> and Ireland.348 EUROPE IN FIGURES — <strong>Eurostat</strong> <strong>yearbook</strong> <strong>2009</strong>
Agriculture, forestry and fisheries 9Dairy production is structured quite differentlyamong Member States, both asa result of vary<strong>in</strong>g farm and dairy herdsizes as well as yields. However, milk productionhas been controlled under a systemof milk quotas s<strong>in</strong>ce 1984 that effectivelyputs a limit on the amount of milkproduced. Germany and France have byfar the largest quotas, and the 27.3 milliontonnes of milk collected <strong>in</strong> Germany <strong>in</strong>2007 was double the third highest levelthat was collected, <strong>in</strong> the United K<strong>in</strong>gdom.One third (32.6 %) of the milk collected<strong>in</strong> the EU-27 <strong>in</strong> 2007 was converted<strong>in</strong>to cheese, <strong>with</strong> butter account<strong>in</strong>g for thenext highest proportion (24.4 %). Onlyone tenth (10.1 %) of the milk collectedwas used as dr<strong>in</strong>k<strong>in</strong>g milk <strong>in</strong> 2007.Figure 9.5: Indices of the agricultural production of crops, EU-27(2000=100)16014012010080602000 2001 2002 2003 2004 2005 2006 2007Rape (1)CerealsSugar beet (1)Potatoes (1)(1) 2007, not available.Source: <strong>Eurostat</strong> (tag00104, tag00031, tag00106 and tag00108)EUROPE IN FIGURES — <strong>Eurostat</strong> <strong>yearbook</strong> <strong>2009</strong>349
9 Agriculture, forestry and fisheriesTable 9.7: Agricultural production of crops, 2007(1 000 tonnes)Cereals(1)Potatoes(2)Sugar beet(3)Rape(4)Vegetables(5)Fruit(6)EU-27 258 394 56 769 110 410 15 903 : :Euro area 162 521 32890 : : : :Belgium 2 787 3 190 5 731 41 1 531 572Bulgaria 3 171 299 16 93 490 487Czech Republic 7 153 821 2 890 1 032 296 397Denmark 8 220 1 626 2 255 596 245 72Germany 40 632 11 644 25 139 5 321 3 012 2 425Estonia 860 143 0 109 72 7Ireland 1 980 455 45 12 274 18Greece 3 622 830 862 : 3 575 5 423Spa<strong>in</strong> 23 305 2 518 5 297 35 13 575 19 810France 59 248 7 206 33 213 4 684 5 654 10 141Italy 18 756 1 782 4 630 15 13 550 20 722Cyprus 44 143 : : 144 226Latvia 1 535 630 11 212 141 37Lithuania 3 017 572 800 312 239 57Luxembourg 148 20 0 18 2 23Hungary 9 659 536 1 676 494 1 760 900Malta : 19 : : 67 9Netherlands 1 623 6 870 5 512 12 4 356 708Austria 4 758 669 2 656 145 549 1 180Poland 27 143 11 791 12 682 2 130 4 420 1 694Portugal 948 639 320 : 1 671 2 159Romania 7 910 3 708 753 349 2 145 2 124Slovenia 532 131 262 15 65 277Slovakia 2 793 288 847 321 99 95F<strong>in</strong>land 4 137 702 673 114 245 16Sweden 5 058 790 2 189 223 227 32United K<strong>in</strong>gdom 19 354 5 684 7 150 1 896 2 503 398Croatia 2 534 296 1 583 39 191 269FYR of Macedonia 453 181 8 0 696 :Turkey 30 427 4 246 12 415 29 24 671 14 399Iceland 3 9 : : : :Norway 1 229 317 : 11 : 33Switzerland 1 049 490 1 584 68 : :(1) Norway, 2006; Turkey, 2003; Iceland, 1997.(2) EU-27, euro area, Malta and the United K<strong>in</strong>gdom, 2006; Norway, 2005; Iceland, 1998.(3) EU-27, Slovenia, Sweden and the United K<strong>in</strong>gdom, 2006.(4) Ireland, 2008; EU-27, 2006; Norway, 2005.(5) Denmark and France, 2006; Spa<strong>in</strong>, 2005; Belgium, the Czech Republic, Poland and Portugal, 2003; Sweden, 2002; the formerYugoslav Republic of Macedonia, 2001; Germany and Ireland, 2000.(6) Denmark, Greece, France and Norway, 2006; Spa<strong>in</strong> and Romania, 2005; Germany and Portugal, 2003; Belgium and Sweden, 2002;the Czech Republic, 2001; Ireland and the Netherlands, 2000.Source: <strong>Eurostat</strong> (tag00031, tag00108, tag00106, tag00104, tag00097 and tag00112)350 EUROPE IN FIGURES — <strong>Eurostat</strong> <strong>yearbook</strong> <strong>2009</strong>
Agriculture, forestry and fisheries 9Figure 9.6: Production of cereals (<strong>in</strong>clud<strong>in</strong>g rice), EU-27, 2007 (1)(%)Rice1.1%Others12.4%Gra<strong>in</strong> maize18.4%Wheat46.0%Barley22.1%(1) Provisional.Source: <strong>Eurostat</strong> (apro_cpp_crop)Figure 9.7: Breakdown of production of vegetables, EU, 2007 (1)(% of total, based on tonnes)Tomatoes30.8%Others54.2%Carrots7.1%Onions7.9%(1) EU based on available data: Denmark and France, 2006; Spa<strong>in</strong>, 2005; exclud<strong>in</strong>g Belgium, the Czech Republic, Germany, Ireland,Poland and Portugal.Source: <strong>Eurostat</strong> (tag00035, tag00110, tag00111 and tag00097)EUROPE IN FIGURES — <strong>Eurostat</strong> <strong>yearbook</strong> <strong>2009</strong>351
9 Agriculture, forestry and fisheriesFigure 9.8: Breakdown of production of fruit, EU, 2007 (1)(% of total, based on tonnes)Apples12.9%Oranges (2)9.2%Pears3.4%Others74.6%(1) EU based on available data: Denmark, Greece and France, 2006; Spa<strong>in</strong> and Romania, 2005; exclud<strong>in</strong>g Belgium, Bulgaria, the CzechRepublic, Germany, Estonia, Ireland, the Netherlands, Portugal, F<strong>in</strong>land and Sweden.(2) Member States not report<strong>in</strong>g any production are assumed to have negligible or no production of oranges.Source: <strong>Eurostat</strong> (tag00036, tag00114, tag00113 and tag00112)Figure 9.9: Utilisation of milk, EU, 2007 (1)(%)Other fresh products6.8%Milk powder4.2%Other manufacturedproducts10.3%Cheese32.6%Cream for directconsumption11.7%Dr<strong>in</strong>k<strong>in</strong>g milk10.1%Butter24.4%(1) Figures do not sum to 100 % due to round<strong>in</strong>g; EU exclud<strong>in</strong>g Bulgaria, Ireland, Greece, Italy, Luxembourg, Austria, Slovenia and theUnited K<strong>in</strong>gdom; Sweden, 2006.Source: <strong>Eurostat</strong> (apro_mk_pobta)352 EUROPE IN FIGURES — <strong>Eurostat</strong> <strong>yearbook</strong> <strong>2009</strong>
Agriculture, forestry and fisheries 9Table 9.8: Agricultural production related to animals, 2007(1 000 tonnes)Collection ofcows' milk (1)Butter(2)Cheese(3)Meat:cattle (4)Meat:pigs (4)Meat: sheep& goats (5)EU-27 132 641 43 846 8 539 8 203 22 858 :Euro area 93 003 1 621 6 580 6 245 16 278 :Belgium 2 879 102 70 273 1 063 1Bulgaria 746 2 78 6 41 :Czech Republic 2 446 37 116 79 360 2Denmark 4 484 109 351 130 1 802 2Germany 27 321 445 1 927 1 185 4 985 44Estonia 593 7 32 15 38 :Ireland 5 241 223 : 581 205 70Greece 670 2 154 58 122 114Spa<strong>in</strong> 5 729 39 309 658 3 513 238France 22 967 396 1 884 1 532 2 281 129Italy 10 090 117 1 154 1 127 1 603 66Cyprus 144 0 11 4 55 7Latvia 631 7 35 23 40 0Lithuania 1 347 14 90 56 99 1Luxembourg 259 : : 9 10 0Hungary 1 448 8 72 35 499 1Malta 41 0 3 1 8 0Netherlands 10 799 174 732 386 1 290 5Austria 2 661 33 145 216 531 0Poland 8 744 162 594 365 2 091 1Portugal 1 837 28 69 91 364 13Romania 1 136 8 69 211 491 :Slovenia 530 3 20 36 33 0Slovakia 964 10 44 23 114 1F<strong>in</strong>land 2 293 55 102 89 213 1Sweden 3 130 41 752 119 134 265 4United K<strong>in</strong>gdom 13 647 121 339 882 739 330Croatia 673 : : 55 156 1FYR of Macedonia 42 : : 23 21 1Iceland 113 2 4 : : 4Norway 1 686 : 83 : : 330(1) EU-27, euro area, Greece and Sweden, 2006; Iceland, 2005; the former Yugoslav Republic of Macedonia, 1996.(2) EU-27, euro area, exclud<strong>in</strong>g Luxembourg and Malta; EU-27, euro area, Greece, Slovenia and Sweden, 2006; Iceland, 2005.(3) EU-27, euro area, exclud<strong>in</strong>g Ireland and Luxembourg; EU-27, euro area, Greece, Italy, Slovenia and Sweden, 2006; Iceland, 2005;Norway, 1996.(4) The former Yugoslav Republic of Macedonia, 1999.(5) Croatia, 2006.Source: <strong>Eurostat</strong> (tag00037, tag00038, tag00040, tag00044, tag00042 and tag00045)EUROPE IN FIGURES — <strong>Eurostat</strong> <strong>yearbook</strong> <strong>2009</strong>353
9 Agriculture, forestry and fisheries9.4 Agriculture and theenvironmentIntroductionAround 40 % of the EU’s land area isfarmed. This fact alone highlights the importanceof farm<strong>in</strong>g for the EU’s naturalenvironment. The l<strong>in</strong>ks between the two,however, are complex. On the one hand,farm<strong>in</strong>g has contributed over the centuriesto creat<strong>in</strong>g and ma<strong>in</strong>ta<strong>in</strong><strong>in</strong>g a varietyof valuable semi-natural habitats andagricultural landscapes. While many ofthese are ma<strong>in</strong>ta<strong>in</strong>ed by different farm<strong>in</strong>gpractices and a wide range of wild speciesrely on this for their survival, agriculturecan also have an adverse impact on naturalresources. Pollution of soil, water andair, fragmentation of habitats, and a lossof wildlife can result from agriculturalpractices and land use. This complex relationshiphas necessitated the <strong>in</strong>tegrationof environmental concerns and safeguards<strong>in</strong>to the Common AgriculturalPolicy (CAP), <strong>with</strong> particular attentionpaid to reduc<strong>in</strong>g the risks of environmentaldegradation through cross-compliancecriteria (as a condition for benefit<strong>in</strong>gfrom direct payments, farmers mustcomply <strong>with</strong> certa<strong>in</strong> requirements, somerelated to environmental protection),<strong>in</strong>centives and targeted environmentalmeasures, while encourag<strong>in</strong>g farmers tocont<strong>in</strong>ue to play a positive role to enhancethe susta<strong>in</strong>ability of agro-ecosystems.The importance attached to assess<strong>in</strong>g the<strong>in</strong>teraction between agriculture and theenvironment is underl<strong>in</strong>ed by the factthat the Commission adopted a list of 28agri-environmental <strong>in</strong>dicators (1) <strong>in</strong> 2006.Def<strong>in</strong>itions and data availabilityOrganic farm<strong>in</strong>g can be def<strong>in</strong>ed as amethod of production which places thehighest emphasis on environmentalprotection and animal welfare considerations.In the EU, farm<strong>in</strong>g is only consideredto be organic if it complies <strong>with</strong>Council Regulation (EEC) No 2092/91.Organic farm<strong>in</strong>g <strong>in</strong>volves holistic productionmanagement systems for cropsand livestock, emphasis<strong>in</strong>g the use ofmanagement practices <strong>in</strong> preference tothe use of off-farm <strong>in</strong>puts. This is accomplishedby us<strong>in</strong>g, where possible, cultural,biological and mechanical methods <strong>in</strong>preference to synthetic chemical unitssuch as fertilisers, pesticides (fungicides,herbicides and <strong>in</strong>secticides), additivesand medic<strong>in</strong>al productsThe irrigable area is that which isequipped for irrigation – the actualamount of land irrigated varies depend<strong>in</strong>g,for example, on meteorological conditionsor the choice of crop. Over-exploitationof water can lead to the dry<strong>in</strong>g-outof natural areas, and to salt-water <strong>in</strong>trusion<strong>in</strong> coastal aquifers.The livestock density <strong>in</strong>dex measures thestock of animals per hectare. It is the ratioof the livestock units (converted fromthe number of animals us<strong>in</strong>g standardcoefficients) per hectare of utilised agriculturalarea. A livestock unit (LSU) isa reference unit which facilitates the aggregationof livestock from various speciesand ages. Eurofarm LSU coefficientsare established by convention (orig<strong>in</strong>ally,(1) COM(2006) 508 f<strong>in</strong>al.354 EUROPE IN FIGURES — <strong>Eurostat</strong> <strong>yearbook</strong> <strong>2009</strong>
Agriculture, forestry and fisheries 9they were related to the animals’ feed requirements,the reference be<strong>in</strong>g a dairycow <strong>with</strong> an annual yield of 3 000 kg ofmilk, <strong>with</strong>out additional concentratedfeed<strong>in</strong>gstuffs). In the <strong>in</strong>terpretation ofthe livestock density <strong>in</strong>dex, the limits ofthis theoretical unit are to be taken <strong>in</strong>toaccount. The livestock species aggregated<strong>in</strong> the LSU total, for the purpose of the<strong>in</strong>dicator <strong>in</strong> this publication are: equidae,cattle, sheep, goats, pigs, poultry andrabbits.Ma<strong>in</strong> f<strong>in</strong>d<strong>in</strong>gsThere is <strong>in</strong>creas<strong>in</strong>g consumer awarenessand <strong>in</strong>terest <strong>in</strong> food production and distribution,for example, concern<strong>in</strong>g whereand how food is produced, and how itmoves from the farm to the fork. As anexample of a susta<strong>in</strong>able farm<strong>in</strong>g system,many agricultural hold<strong>in</strong>gs have convertedto certified organic productionmethods. Just over 4.3 % of the utilisedagricultural area <strong>in</strong> the EU-27 was classifiedas organic agricultural production<strong>in</strong> 2005, rang<strong>in</strong>g from 11.0 % <strong>in</strong> Austriaand 8.4 % <strong>in</strong> Italy to below 1 % <strong>in</strong> Ireland,Poland and Malta.The proportion of agricultural area thatis irrigable is, unsurpris<strong>in</strong>gly, particularlyhigh <strong>in</strong> the southern Member States,notably Greece, Italy, Cyprus and Malta,where irrigation is essential for manytypes of agriculture. Supplementary irrigationis also used to improve productionelsewhere, and large irrigable areas arealso found <strong>in</strong> the Netherlands.Plant and animal protection productsare important <strong>in</strong> agriculture to preservecrops and ma<strong>in</strong>ta<strong>in</strong> healthy livestock, buttheir <strong>in</strong>tensive use can have negative environmentalimpacts, and this dependsto some extent on whether or not suchproducts are used properly. Total sales ofpesticides vary greatly across the MemberStates, from particularly high levels<strong>in</strong> Malta and to a lesser extent <strong>in</strong> Italyand Belgium (above 6 kg per hectare ofutilised agricultural area) to relativelylow levels <strong>in</strong> Sweden and Estonia (0.5 kgper hectare or less). To some degree, thesedifferences reflect the climatic conditions,the types of farm<strong>in</strong>g that are practised,and vary<strong>in</strong>g price of pesticides.EUROPE IN FIGURES — <strong>Eurostat</strong> <strong>yearbook</strong> <strong>2009</strong>355
9 Agriculture, forestry and fisheriesFigure 9.10: Area occupied by organic farm<strong>in</strong>g, 2005 (1)(% of UAA)12840EU-27AustriaItalyCzech RepublicEstoniaGreeceLatviaSwedenF<strong>in</strong>landPortugalDenmarkSloveniaSlovakiaGermanyUnited K<strong>in</strong>gdomSpa<strong>in</strong>HungaryNetherlandsLuxembourgLithuaniaFranceBelgiumCyprusIrelandPolandMaltaNorway(1) EU-27, Luxembourg and Poland, estimates; Bulgaria and Romania, not available.Source: <strong>Eurostat</strong> (food_<strong>in</strong>_porg1)Figure 9.11: Sales of pesticides (1)(kg of active <strong>in</strong>gredient per hectare of utilised agricultural area)12 2210 2086420EU-15 (2)MaltaItalyBelgiumNetherlandsPortugalGreeceFranceSloveniaHungaryGermanySpa<strong>in</strong>United K<strong>in</strong>gdomAustriaDenmarkPolandF<strong>in</strong>landIrelandLatviaSwedenEstoniaNorway(1) F<strong>in</strong>land, Sweden, the United K<strong>in</strong>gdom and Norway, 2006; Germany, Austria, Portugal and Slovenia, 2005; Estonia, 2004; Ireland andMalta, 2003; Belgium, Denmark, Italy and Hungary, 2002; EU-15, Greece and Spa<strong>in</strong>, 2001; rema<strong>in</strong><strong>in</strong>g Member States, not available; forsome Member States the UAA of a different reference year has been used as the denom<strong>in</strong>ator.(2) Exclud<strong>in</strong>g Luxembourg.Source: <strong>Eurostat</strong> (tag00084 and ef_lu_ovcropesu)356 EUROPE IN FIGURES — <strong>Eurostat</strong> <strong>yearbook</strong> <strong>2009</strong>
Agriculture, forestry and fisheries 9Table 9.9: Environmental and agricultural <strong>in</strong>dicators, 2005Utilisedagriculturalarea (UAA)(1 000 hectares)Organic croparea (fullyconverted)(% UAA)Total organicarea(% UAA)(1)Irrigablearea(% UAA)Livestockdensity <strong>in</strong>dex(livestock unitsper km2)EU-27 156 039 : : : 0.8Euro area 103 722 : 4.2 : :Belgium 1 386 1.4 1.7 1.6 2.8Bulgaria 2 729 : : 4.1 0.5Czech Republic 3 558 6.4 7.2 1.3 0.6Denmark 2 708 4.9 5.0 16.6 1.7Germany 17 035 : 4.7 : 1.1Estonia 829 4.4 7.2 : 0.4Ireland 4 219 0.6 0.8 0.0 1.5Greece 3 984 5.2 7.2 40.0 0.6Spa<strong>in</strong> 24 855 1.9 3.2 15.1 0.6France 27 591 : 2.0 9.8 0.8Italy 12 708 5.8 8.4 31.3 0.8Cyprus 152 0.2 1.1 30.3 1.6Latvia 1 702 1.2 7.0 0.0 0.3Lithuania 2 792 0.5 2.3 0.2 0.5Luxembourg 129 : : 0.0 1.2Hungary 4 267 2.0 3.0 3.6 0.6Malta 10 0.0 0.1 29.5 4.5Netherlands 1 958 2.4 2.5 20.8 3.3Austria 3 266 : 11.0 3.7 0.8Poland 14 755 : : 0.8 0.7Portugal 3 680 3.0 6.3 16.8 0.6Romania 13 907 : : 5.8 0.5Slovenia 485 3.3 4.8 0.9 1.1Slovakia 1 879 1.4 4.8 9.6 0.4F<strong>in</strong>land 2 264 6.0 6.5 3.1 0.5Sweden 3 192 6.3 7.0 5.2 0.6United K<strong>in</strong>gdom 15 957 3.3 3.8 1.3 0.9Norway 1 035 3.5 4.2 11.3 1.2Switzerland 1 062 : : 0.0 1.7(1) Euro area, exclud<strong>in</strong>g Luxembourg; data for total organic area, fully converted area and area under conversion.Source: <strong>Eurostat</strong> (ef_lu_ovcropesu, food_<strong>in</strong>_porg1, tag00095 and tsdpc450)EUROPE IN FIGURES — <strong>Eurostat</strong> <strong>yearbook</strong> <strong>2009</strong>357
9 Agriculture, forestry and fisheries9.5 ForestryIntroductionIn 2006 the Commission underp<strong>in</strong>nedits support for enhanc<strong>in</strong>g susta<strong>in</strong>able forestmanagement and the multifunctionalrole of forests by adopt<strong>in</strong>g an EU forestaction plan. The action plan provides aframework for forest-related actions andwill serve as an <strong>in</strong>strument of coord<strong>in</strong>ationbetween Community actions andthe forest policies of the Member States,<strong>with</strong> 18 key actions proposed by theCommission to be implemented jo<strong>in</strong>tly<strong>with</strong> the Member States dur<strong>in</strong>g the period2007-2011. The Action Plan focuseson four ma<strong>in</strong> objectives:• improv<strong>in</strong>g long-termcompetitiveness;• improv<strong>in</strong>g and protect<strong>in</strong>g theenvironment;• contribut<strong>in</strong>g to the quality of life;• foster<strong>in</strong>g coord<strong>in</strong>ation andcommunication.Def<strong>in</strong>itions and data availabilityAn Intersecretariat Work<strong>in</strong>g Group(IWG) br<strong>in</strong>gs together <strong>Eurostat</strong>, the UnitedNations Economic Commission for<strong>Europe</strong> (UNECE), the Food and AgricultureOrganisation of the United Nations(FAO) and the International TropicalTimber Organisation (ITTO) <strong>in</strong> collect<strong>in</strong>gforest sector statistics; other Directorates-General of the <strong>Europe</strong>an Commission arealso represented. With<strong>in</strong> this context, theprimary tool for statistical cooperation isthe jo<strong>in</strong>t <strong>Eurostat</strong>/UNECE/FAO/ITTOforest sector questionnaire (JFSQ), whichis used by all organisations; each agencycollects data from the countries for whichit is responsible. <strong>Eurostat</strong> is responsiblefor data from the EU Member States andEFTA countries.Forest is def<strong>in</strong>ed as land <strong>with</strong> tree crowncover (or equivalent stock<strong>in</strong>g level) of morethan 10 % and area of more than 0.5 ha.The trees should be able to reach a m<strong>in</strong>imumheight of 5 m at maturity <strong>in</strong> situ.Roundwood production is a synonymfor removals; it comprises all quantitiesof wood removed from the forest andother wooded land or other fell<strong>in</strong>g sitedur<strong>in</strong>g a given time period; it is reported<strong>in</strong> cubic metres underbark (i.e. exclud<strong>in</strong>gbark). Sawnwood production is woodthat has been produced either by saw<strong>in</strong>glengthways or by a profile-chipp<strong>in</strong>g processand that exceeds 6 mm <strong>in</strong> thickness;it <strong>in</strong>cludes planks, beams, joists, boards,rafters, scantl<strong>in</strong>gs, laths, boxboards andlumber, etc., <strong>in</strong> the follow<strong>in</strong>g forms: unplaned,planed, end-jo<strong>in</strong>ted, etc; it is reported<strong>in</strong> cubic metres solid volume (m3).Paper and paperboard is the sum of:graphic papers; newspr<strong>in</strong>t; sanitary andhousehold papers; packag<strong>in</strong>g materialsand other paper and paperboard; itexcludes manufactured paper productssuch as boxes, cartons, books and magaz<strong>in</strong>es,etc.The degree of defoliation is the extentof visually assessed defoliation of trees isbased on a method developed by the InternationalCooperative Programme of theExecutive Committee for the Conventionon Long-range Transboundary Air Pollution<strong>in</strong> <strong>Europe</strong>. Damage is classed on ascale from 0 to 4. No defoliation (class 0)– covers up to and <strong>in</strong>clud<strong>in</strong>g 10 % needle/leaf loss. Slight (warn<strong>in</strong>g stage) defoliation(class 1) – covers more than 10 % and upto 25 % needle/leaf loss. Moderate defoliation(class 2) – covers more than 25 % andup to 60 % needle/leaf loss. Severe defoliation(class 3) – covers more than 60 % andup to 100 % needle/leaf loss. Dead (class 4)– covers 100 % defoliation.358 EUROPE IN FIGURES — <strong>Eurostat</strong> <strong>yearbook</strong> <strong>2009</strong>
Agriculture, forestry and fisheries 9Ma<strong>in</strong> f<strong>in</strong>d<strong>in</strong>gsThe EU-27 had a total area of forests andother wooded land of 176.7 million hectares<strong>in</strong> 2005, equivalent to approximately42 % of its land area. The largest forestand wooded land areas were <strong>in</strong> Sweden,Spa<strong>in</strong> and F<strong>in</strong>land, and <strong>in</strong> all three ofthese Member States, as well as <strong>in</strong> Estonia,Greece and Slovenia, forest and woodedland areas made up more than half of thetotal land area, <strong>with</strong> Latvia and Austriarecord<strong>in</strong>g shares just below 50 %.After strong growth <strong>in</strong> the volume of EU-27roundwood production <strong>in</strong> 2005, it dropped<strong>in</strong> 2006 to 425 million cubic metres. Sweden,Germany, France and F<strong>in</strong>land eachrecorded volumes <strong>in</strong> excess of 50 millioncubic metres <strong>in</strong> all of the years from 2005 to2007, and were clearly the largest producers.In terms of roundwood production percapita, F<strong>in</strong>land and Sweden were the mostspecialised Member States, followed byLatvia, Estonia and Austria.Roundwood production can be divided<strong>in</strong>to coniferous and non-coniferous species,<strong>with</strong> the former generally referred toas softwood, and the latter as broadleavedor hardwood. Almost 80 % of roundwoodproduction <strong>in</strong> the EU-27 <strong>in</strong> 2006was from coniferous species. There hasalso been growth <strong>in</strong> the volume of EU-27sawnwood production <strong>in</strong> recent years,reach<strong>in</strong>g 112 million cubic metres by2006, almost 10 % more than <strong>in</strong> 2003.The production of paper and paperboard<strong>in</strong> the EU-27 reached 102 million tonnes<strong>in</strong> 2006, 4.3 % higher than the previousyear, cont<strong>in</strong>u<strong>in</strong>g an upward trend <strong>in</strong> outputthat started <strong>in</strong> 2002. Relative to itssize (<strong>in</strong> population terms), F<strong>in</strong>land hadby far the highest output of paper andpaperboard <strong>in</strong> 2007, some 2.7 tonnes percapita, more than double the level <strong>in</strong> Sweden,and more than four times the levelof the third most specialised producer,Austria.Between one fifth and one quarter of forestand woodland trees suffered frommoderate or worse defoliation <strong>in</strong> the EU<strong>in</strong> 2006. More than one third of treessuffered from such defoliation <strong>in</strong> Franceand Bulgaria, <strong>with</strong> this proportion above40 % <strong>in</strong> Luxembourg and just over 50 %<strong>in</strong> the Czech Republic.EUROPE IN FIGURES — <strong>Eurostat</strong> <strong>yearbook</strong> <strong>2009</strong>359
9 Agriculture, forestry and fisheriesTable 9.10: Wood production(1 000 m³)Roundwood productionSawnwood production2003 2004 2005 2006 2007 2003 2004 2005 2006 2007EU-27 387 181 393 668 454 120 425 448 : 102 074 105 864 108 072 111 962 :Euro area 202 327 207 858 237 029 242 152 : 61 286 63 647 64 683 67 497 :Belgium 4 765 4 850 4 950 4 230 4 100 1 215 1 235 1 285 1 520 1 555Bulgaria 4 833 5 986 5 862 5 992 599 332 569 569 569 569Czech Republic 15 140 15 601 15 510 17 678 18 508 3 805 3 940 4 003 5 080 5 454Denmark 1 627 1 516 2 962 2 358 : 248 196 196 196 :Germany 51 182 54 504 56 946 62 290 76 728 17 596 19 538 21 931 24 420 25 170Estonia 10 500 6 800 5 500 5 400 5 900 1 954 2 029 2 063 1 923 1 800Ireland 2 683 2 562 2 648 2 672 2 710 1 005 939 1 015 1 094 985Greece 1 673 1 694 1 523 1 523 : 191 191 191 191 :Spa<strong>in</strong> 16 105 16 290 15 531 15 716 14 528 3 630 3 730 3 660 3 806 3 332France 32 828 33 647 63 171 61 790 62 759 9 539 9 774 9 715 9 992 10 190Italy 8 219 8 697 8 691 8 618 8 125 1 590 1 580 1 590 1 748 1 700Cyprus 12 10 10 7 20 6 5 4 4 9Latvia 12 916 12 754 12 843 12 845 12 173 3 951 3 988 4 227 4 320 3 459Lithuania 6 275 6 120 6 045 5 870 6 195 1 400 1 450 1 445 1 466 1 380Luxembourg 257 277 249 268 : 133 133 133 133 :Hungary 5 785 5 660 5 940 5 913 5 640 299 205 215 186 235Malta 0 0 0 0 0 0 0 0 0 0Netherlands 1 044 1 026 1 110 1 107 1 022 269 273 279 265 271Austria 17 055 16 483 16 471 19 135 21 317 10 473 11 133 11 074 10 507 11 262Poland 30 836 32 733 31 945 32 384 35 653 3 360 3 743 3 360 3 607 4 100Portugal 9 673 10 869 10 746 10 805 : 1 383 1 060 1 010 1 010 :Romania 15 440 15 809 14 501 13 970 15 341 4 246 4 588 4 321 3 476 4 050Slovenia 2 591 2 551 2 733 3 179 2 882 511 512 527 580 580Slovakia 6 355 7 240 9 302 7 869 8 131 1 651 1 837 2 621 2 440 2 781F<strong>in</strong>land 54 240 54 398 52 250 50 812 56 870 13 745 13 544 12 269 12 227 12 477Sweden 67 100 67 300 98 200 64 600 77 200 16 800 16 900 17 600 18 300 18 600United K<strong>in</strong>gdom 8 046 8 291 8 482 8 417 8 962 2 742 2 772 2 770 2 902 3 142Croatia 3 847 3 841 4 018 4 452 : 585 582 624 669 :Turkey 15 810 16 503 16 185 16 813 : 5 615 6 215 6 445 7 079 :Iceland 0 0 0 0 0 0 0 0 0 0Norway 8 298 8 782 9 667 8 594 10 514 2 186 2 230 2 326 2 389 2 339Switzerland 5 120 5 132 5 285 5 702 : 1 345 1 505 1 591 1 668 :Canada 179 642 208 406 211 501 205 893 : 56 892 60 952 60 187 58 709 :Russia 174 000 178 400 185 000 190 600 : 20 155 21 380 22 033 22 500 :United States 448 513 461 739 467 347 472 618 : 86 159 93 067 97 020 93 016 :Source: <strong>Eurostat</strong> (tag00072 and tag00073), UNECE360 EUROPE IN FIGURES — <strong>Eurostat</strong> <strong>yearbook</strong> <strong>2009</strong>
Agriculture, forestry and fisheries 9Table 9.11: Wood production (1)Productionper capita(m3)RoundwoodConiferous production(million m3under bark)Non-coniferousproduction(million m3under bark)Sawnwoodproductionper capita(m3)2002 2007 2002 2007 2002 2007 2002 2007EU-27 0.8 0.9 248.8 263.1 73.6 74.1 0.2 0.2Euro area 0.6 0.8 125.6 138.6 39.8 42.0 0.2 0.2Belgium 0.4 0.4 3.0 3.2 1.0 1.0 0.1 0.1Bulgaria 0.6 0.8 1.3 1.9 1.4 1.3 0.0 0.1Czech Republic 1.4 1.8 12.4 15.9 1.2 0.9 0.4 0.5Denmark 0.3 0.4 0.6 1.1 0.2 0.1 0.0 0.0Germany 0.5 0.9 30.0 59.2 7.8 8.9 0.2 0.3Estonia 7.7 4.4 5.9 3.2 2.7 1.5 1.3 1.3Ireland 0.7 0.6 2.6 2.7 0.0 0.0 0.2 0.2Greece 0.1 0.1 0.3 0.3 0.2 0.2 0.0 0.0Spa<strong>in</strong> 0.4 0.3 8.6 6.6 5.3 5.9 0.1 0.1France 0.6 1.0 21.8 19.8 10.9 9.6 0.2 0.2Italy 0.1 0.1 1.0 1.4 1.6 1.6 0.0 0.0Cyprus 0.0 0.0 0.0 0.0 0.0 0.0 0.0 0.0Latvia 5.7 5.3 7.9 7.1 4.4 4.0 1.7 1.5Lithuania 1.8 1.8 2.8 2.8 2.1 2.1 0.4 0.4Luxembourg 0.6 0.6 0.1 0.1 0.1 0.1 0.3 0.3Hungary 0.6 0.6 0.6 0.6 2.9 2.1 0.0 0.0Malta 0.0 0.0 0.0 0.0 0.0 0.0 0.0 0.0Netherlands 0.1 0.1 0.5 0.5 0.2 0.2 0.0 0.0Austria 1.8 2.6 10.9 15.6 0.9 1.0 1.3 1.4Poland 0.7 0.9 18.7 25.2 6.3 7.0 0.1 0.1Portugal 0.8 1.0 3.1 3.5 5.1 6.7 0.1 0.1Romania 0.7 0.7 6.0 5.9 6.1 5.7 0.2 0.2Slovenia 1.1 1.4 1.3 1.7 0.7 0.4 0.3 0.3Slovakia 1.1 1.5 2.8 4.8 2.8 2.9 0.2 0.5F<strong>in</strong>land 10.3 10.8 42.5 44.9 6.1 6.8 2.6 2.4Sweden 7.5 8.5 57.2 66.5 3.5 4.8 1.8 2.0United K<strong>in</strong>gdom 0.1 0.1 7.1 8.4 0.4 0.1 0.0 0.1Croatia 0.8 1.0 0.5 0.7 2.4 2.8 0.1 0.2Turkey 0.2 0.2 6.3 7.0 4.9 5.3 0.1 0.1Iceland 0.0 0.0 0.0 0.0 0.0 0.0 0.0 0.0Norway 1.9 2.2 7.4 8.1 0.1 0.1 0.5 0.5Switzerland 0.6 0.8 3.1 3.7 0.5 0.5 0.2 0.2Canada 6.3 6.3 161.5 160.4 33.7 42.7 1.9 1.8Russia 1.1 1.3 81.2 107.8 37.4 36.8 0.1 0.2United States 1.6 1.6 275.4 303.6 129.6 124.2 0.3 0.3(1) EU-27, euro area, Denmark, Greece, Luxembourg, Portugal, Croatia, Turkey, Switzerland, Canada, Russia and the United States, 2006<strong>in</strong>stead of 2007.Source: <strong>Eurostat</strong> (tag00072, for_rdw51, tag00073 and tps00001); UNECEEUROPE IN FIGURES — <strong>Eurostat</strong> <strong>yearbook</strong> <strong>2009</strong>361
9 Agriculture, forestry and fisheriesTable 9.12: Total paper and paperboard production(1 000 tonnes)1997 1998 1999 2000 2001 2002 2003 2004 2005 2006 2007EU-27 80 286 82 151 84 782 89 698 88 028 90 545 92 646 97 289 97 584 101 788 :Euro area : : 63 333 67 276 65 739 68 053 69 562 73 129 73 304 77 139 :Belgium (1) 1 618 1 831 1 666 1 727 1 662 1 704 1 919 1 957 1 897 1 897 :Bulgaria 153 153 126 136 171 171 171 326 326 326 330Czech Republic 750 768 770 804 864 870 920 934 969 1 042 1 023Denmark 390 393 397 263 389 384 388 402 423 423 :Germany 15 911 16 311 16 742 18 182 17 879 18 526 19 310 20 391 21 679 22 656 23 172Estonia 38 43 48 54 70 75 64 66 64 73 68Ireland 42 42 42 43 43 44 45 45 45 45 45Greece 604 622 352 496 495 493 493 510 510 510 :Spa<strong>in</strong> 3 668 3 545 4 436 4 765 5 131 5 365 5 437 5 526 5 697 6 893 6 714France 8 867 9 161 9 603 10 006 9 625 9 809 9 939 10 255 10 332 10 006 9 871Italy 7 929 8 254 8 568 9 129 8 926 9 317 9 491 9 667 9 999 10 008 10 112Cyprus 0 0 0 0 0 0 0 0 0 0 0Latvia 21 18 19 16 24 33 38 38 39 57 60Lithuania 42 37 37 53 68 78 92 99 113 119 124Luxembourg (2) : : 0 0 0 0 0 0 0 0 :Hungary 410 482 473 506 495 517 546 579 571 553 552Malta 0 0 0 0 0 0 0 0 0 0 0Netherlands 3 130 3 180 3 256 3 333 3 174 3 346 3 339 3 459 3 471 3 367 3 219Austria 3 884 4 009 4 141 4 385 4 250 4 419 4 565 4 852 4 950 5 213 5 199Poland 1 660 1 718 1 839 1 934 2 086 2 342 2 461 2 635 2 732 2 857 2 947Portugal 1 114 1 136 1 163 1 290 1 419 1 537 1 530 1 664 1 570 1 644 :Romania 298 301 289 340 395 370 443 454 371 432 558Slovenia 430 491 417 411 633 704 436 767 763 760 765Slovakia 674 597 803 925 988 710 674 798 858 888 915F<strong>in</strong>land 12 519 12 703 12 947 13 509 12 502 12 789 13 058 14 036 12 391 14 140 14 334Sweden 9 654 9 879 10 071 10 786 10 534 10 724 11 061 11 589 11 775 12 066 11 902United K<strong>in</strong>gdom 6 481 6 477 6 576 6 605 6 204 6 218 6 226 6 240 6 039 5 813 5 463Croatia 395 403 417 406 451 467 463 464 592 564 :Turkey 1 282 1 357 1 349 1 567 1 513 1 643 1 643 1 643 1 643 1 643 :Iceland 0 0 : : : : : : 0 0 0Norway 2 162 2 260 2 241 2 300 2 220 2 114 2 186 2 294 2 223 2 109 2 010Switzerland 1 462 1 592 1 755 1 616 1 750 1 805 1 818 1 777 1 751 1 685 :Canada 18 730 18 875 20 280 20 921 19 834 20 073 19 964 20 462 19 498 18 176 :Russian Federation 2 960 3 595 4 535 5 310 5 625 5 978 6 377 6 830 7 126 7 451 :United States 86 916 86 469 88 670 86 252 81 249 81 879 80 712 82 084 83 697 84 317 :(1) 1997-98, <strong>in</strong>clud<strong>in</strong>g Luxembourg.(2) 1997-98, <strong>in</strong>cluded <strong>with</strong><strong>in</strong> Belgium.Source: <strong>Eurostat</strong> (tag00074), UNECE362 EUROPE IN FIGURES — <strong>Eurostat</strong> <strong>yearbook</strong> <strong>2009</strong>
Agriculture, forestry and fisheries 9Figure 9.12: Paper and paperboard production per capita, 2007 (1)(tonnes)3.02.52.01.51.00.50.0EU-27Euro areaF<strong>in</strong>landSwedenAustriaSloveniaGermanyNetherlandsBelgiumItalySlovakiaFrancePortugalSpa<strong>in</strong>Czech RepublicUnited K<strong>in</strong>gdomDenmarkPolandHungaryEstoniaGreeceBulgariaLithuaniaLatviaRomaniaIrelandCyprusLuxembourgMaltaCanadaNorwayUnited StatesSwitzerlandCroatiaRussiaTurkeyIceland(1) EU-27, euro area, Denmark, Greece, Luxembourg, Portugal, Croatia, Turkey, Switzerland, Canada, Russia and the United States, 2006;<strong>in</strong>cludes estimates and provisional data.Source: <strong>Eurostat</strong> (tag00074 and tps00001), UNECEFigure 9.13: Forest trees damaged by defoliation, 2006 (1)(%)6040200EU-27Czech RepublicLuxembourgBulgariaFranceSlovakiaPortugalItalyUnited K<strong>in</strong>gdomSloveniaGermanyBelgiumSpa<strong>in</strong>RomaniaGreece (2)PolandCyprusNetherlandsSwedenLatviaHungaryAustriaLithuaniaF<strong>in</strong>landIrelandDenmarkEstoniaSwitzerlandNorway(1) Malta, not available.(2) 2005.Source: <strong>Eurostat</strong> (tsdnr530)EUROPE IN FIGURES — <strong>Eurostat</strong> <strong>yearbook</strong> <strong>2009</strong>363
9 Agriculture, forestry and fisheries9.6 FisheriesIntroductionThe first common <strong>Europe</strong>an policymeasures <strong>in</strong> the fish<strong>in</strong>g sector date from1970. They set rules for access to fish<strong>in</strong>ggrounds, markets and structures. Allthese measures became more significantwhen, <strong>in</strong> 1976, Member States followedan <strong>in</strong>ternational movement and agreedto extend their rights to mar<strong>in</strong>e resourcesfrom 12 to 200 miles from their coasts.After years of difficult negotiations, thecommon fisheries policy (CFP), the EU’s<strong>in</strong>strument for the management of fisheriesand aquaculture, was born <strong>in</strong> 1983.The EU has a common fisheries policy <strong>in</strong>order to manage fisheries for the benefitof both fish<strong>in</strong>g communities and consumers,and for the protection of resources.Common measures are agreed <strong>in</strong> fourma<strong>in</strong> areas:• conservation – to protect fish resourcesby regulat<strong>in</strong>g the amount of fishtaken from the sea, by allow<strong>in</strong>g youngfish to reproduce, and by ensur<strong>in</strong>gthat measures are respected;• structures – to help the fish<strong>in</strong>g andaquaculture sectors adapt their equipmentand organisations to the constra<strong>in</strong>tsimposed by scarce resourcesand the market;• markets – to ma<strong>in</strong>ta<strong>in</strong> a common organisationof the market <strong>in</strong> fish productsand to match supply and demandfor the benefit of both producers andconsumers;• relations <strong>with</strong> the outside world – toset-up fisheries agreements and to negotiateat an <strong>in</strong>ternational level <strong>with</strong><strong>in</strong>regional and <strong>in</strong>ternational fisheriesorganisations for common conservationmeasures <strong>in</strong> deep-sea fisheries.The CFP sets maximum quantities of fishthat can be safely caught every year: thetotal allowable catch (TAC). Each country’sshare is called a national quota.The 2002 reform of the CFP identified theneed to limit fish<strong>in</strong>g efforts, the level ofcatches, and to enforce certa<strong>in</strong> technicalmeasures. The <strong>Europe</strong>an Fisheries Fund(EFF) has a budget of around EUR 3.8billion and covers the period 2007-13.It aims to support the objectives of the(CFP) by:• support<strong>in</strong>g susta<strong>in</strong>able exploitationof fisheries resources and a stable balancebetween these resources and thecapacity of Community fish<strong>in</strong>g fleet;• strengthen<strong>in</strong>g the competitivenessand the viability of operators <strong>in</strong> thesector;• promot<strong>in</strong>g environmentally-friendlyfish<strong>in</strong>g and production methods;• provid<strong>in</strong>g adequate support to peopleemployed <strong>in</strong> the sector;• foster<strong>in</strong>g the susta<strong>in</strong>able developmentof fisheries areas.364 EUROPE IN FIGURES — <strong>Eurostat</strong> <strong>yearbook</strong> <strong>2009</strong>
Agriculture, forestry and fisheries 9Def<strong>in</strong>itions and data availabilityFishery statistics are derived from officialnational sources either directly by<strong>Eurostat</strong> for the members of the <strong>Europe</strong>anEconomic Area (EEA) or <strong>in</strong>directlythrough other <strong>in</strong>ternational organisationsfor other countries. The data are collectedus<strong>in</strong>g <strong>in</strong>ternationally agreed concepts anddef<strong>in</strong>itions developed by the Coord<strong>in</strong>at<strong>in</strong>gWork<strong>in</strong>g Party on Fishery Statistics,compris<strong>in</strong>g <strong>Eurostat</strong> and several other<strong>in</strong>ternational organisations <strong>with</strong> responsibilities<strong>in</strong> fishery statistics. The flag ofthe fish<strong>in</strong>g vessel is used as the primary<strong>in</strong>dication of the nationality of the catch,though this concept may be varied <strong>in</strong> certa<strong>in</strong>circumstances.In general, the data refer to the fish<strong>in</strong>gfleet size on 31 December of the referenceyear. The data are derived from thenational registers of fish<strong>in</strong>g vessels whichare ma<strong>in</strong>ta<strong>in</strong>ed pursuant to Council Regulation(EC) No 26/2004 which conta<strong>in</strong>s<strong>in</strong>formation on the vessel characteristicsto be recorded on the registers - the adm<strong>in</strong>istrativefile of fish<strong>in</strong>g vessels ma<strong>in</strong>ta<strong>in</strong>edby the <strong>Europe</strong>an Commission’sDirectorate-General for Maritime Affairsand Fisheries. There has been a transition<strong>in</strong> measur<strong>in</strong>g the tonnage of the fish<strong>in</strong>gfleet from gross registered tonnage(GRT) to that of gross tonnage (GT). Thischange, which has taken place at differentspeeds <strong>with</strong><strong>in</strong> the national adm<strong>in</strong>istrations,gives rise to the possibility of noncomparabilityof data over time and ofnon-comparability between countries.Catches of fishery products (fish, molluscs,crustaceans and other aquatic animals,residues and aquatic plants) <strong>in</strong>cludesitems taken for all purposes (commercial,<strong>in</strong>dustrial, recreational and subsistence)by all types and classes of fish<strong>in</strong>g units(fishermen, vessels, gear, etc.) operat<strong>in</strong>gboth <strong>in</strong> <strong>in</strong>land, fresh and brackish waterareas, and <strong>in</strong> <strong>in</strong>shore, offshore and highseasfish<strong>in</strong>g areas. The catch is normallyexpressed <strong>in</strong> live weight and derived bythe application of conversion factors tothe landed or product weight. As such,catch statistics exclude quantities whichare caught and taken from the water (thatis, before process<strong>in</strong>g) but which, for a varietyof reasons, are not landed. The productionfrom aquaculture (see below) isexcluded.Geographical fish<strong>in</strong>g areas are def<strong>in</strong>edfor a number of specific areas of water,<strong>in</strong>clud<strong>in</strong>g: the north-east Atlantic, whichis roughly the area to the east of 42°Wlongitude and north of 36°N latitude, <strong>in</strong>clud<strong>in</strong>gthe waters of the Baltic Sea; thenorth-west Atlantic, which is the regionthat is roughly the area to the west of42°W longitude and north of 35°N latitude;the eastern central Atlantic, whichis the region to the east of 40°W longitudebetween latitudes 36°N and 6°S; theMediterranean, which is also known asFAO Major Fish<strong>in</strong>g Area 37, comprisesthe Mediterranean Sea and the adjacentBlack Sea.EUROPE IN FIGURES — <strong>Eurostat</strong> <strong>yearbook</strong> <strong>2009</strong>365
9 Agriculture, forestry and fisheriesAquaculture is the farm<strong>in</strong>g of aquaticorganisms <strong>in</strong>clud<strong>in</strong>g fish, molluscs, crustaceansand aquatic plants. Farm<strong>in</strong>g impliessome form of <strong>in</strong>tervention <strong>in</strong> therear<strong>in</strong>g process to enhance production,such as regular stock<strong>in</strong>g, feed<strong>in</strong>g andprotection from predators. Farm<strong>in</strong>g alsoimplies <strong>in</strong>dividual or corporate ownershipof, or rights result<strong>in</strong>g from contractualarrangements to, the stock be<strong>in</strong>gcultivated.Ma<strong>in</strong> f<strong>in</strong>d<strong>in</strong>gsIn terms of power, Italy had the largestfish<strong>in</strong>g fleet among the EU-27 MemberStates, but only slightly larger thanFrance and Spa<strong>in</strong>. In terms of gross tonnage,Spa<strong>in</strong> had by far the largest fleet,more than double the size of the fleets <strong>in</strong>the United K<strong>in</strong>gdom, France and Italy.Collectively Denmark, Spa<strong>in</strong>, the UnitedK<strong>in</strong>gdom, France and the Netherlandsaccounted for three fifths of the EU-27’scatch <strong>in</strong> 2006. This comb<strong>in</strong>ed share hasfallen recently, as it was around two thirds<strong>in</strong> 2000, and the fall is ma<strong>in</strong>ly because ofa reduction <strong>in</strong> the share of the Danishand Spanish catches. S<strong>in</strong>ce 1997, the totalEU-27 catch has fallen every year except<strong>in</strong> 2001, <strong>with</strong> the catch <strong>in</strong> 2006 nearly30 % lower than <strong>in</strong> 1997. Three quartersof the catches made by the EU-27 <strong>in</strong> 2006were <strong>in</strong> the North-East Atlantic, <strong>with</strong> theMediterranean the second largest fish<strong>in</strong>garea.The level of aquaculture production <strong>in</strong>the EU rema<strong>in</strong>ed relatively stable between1.2 million tonnes and 1.4 milliontonnes dur<strong>in</strong>g the period 1996 to 2005.France, Spa<strong>in</strong>, Italy, the United K<strong>in</strong>gdomand Greece together accounted for nearlythree quarters of the EU-27’s aquacultureproduction <strong>in</strong> 2005. Between 1996and 2006 Greece recorded a particularlylarge <strong>in</strong>crease <strong>in</strong> aquaculture production,nearly trebl<strong>in</strong>g, while the opposite trendwas observed <strong>in</strong> Germany and the Netherlands,<strong>with</strong> output more than halv<strong>in</strong>g.366 EUROPE IN FIGURES — <strong>Eurostat</strong> <strong>yearbook</strong> <strong>2009</strong>
Agriculture, forestry and fisheries 9Figure 9.14: Fish<strong>in</strong>g fleet, 2007 (1)1 5001 0005006004002000BelgiumBulgariaDenmarkGermanyEstoniaIrelandGreeceSpa<strong>in</strong>FranceItalyCyprusLatviaLithuaniaMaltaNetherlandsPolandPortugalRomaniaSloveniaF<strong>in</strong>landSwedenUnited K<strong>in</strong>gdomIcelandNorway0Total power (left-hand scale, 1 000 kW)Total tonnage (right-hand scale, 1 000 GT)(1) In 2007, EU-27 total power was 7 011 719 kW and total tonnage was 1 920 654 GT; the Czech Republic, Luxembourg, Hungary, Austriaand Slovakia are landlocked countries <strong>with</strong>out a mar<strong>in</strong>e fish<strong>in</strong>g fleet.Source: <strong>Eurostat</strong> (tsdnr420 and tag00083), Directorate-General for Maritime Affairs and FisheriesFigure 9.15: Catches by fish<strong>in</strong>g region, EU-27, 2006(%, based on tonnes)North-westAtlantic1.0%Otherregions5.6%Mediterranean10.6%Eastern centralAtlantic7.6%North-eastAtlantic75.2%Source: <strong>Eurostat</strong> (tag00078, tag00080, tag00081, tag00079 and tag00076)EUROPE IN FIGURES — <strong>Eurostat</strong> <strong>yearbook</strong> <strong>2009</strong>367
9 Agriculture, forestry and fisheriesTable 9.13: Total catches <strong>in</strong> all fish<strong>in</strong>g regions(1 000 tonnes live weight)1996 1997 1998 1999 2000 2001 2002 2003 2004 2005 2006EU-27 7 427 7 525 7 285 6 880 6 794 6 933 6 339 5 901 5 874 5 631 5 312Euro area 3 795 3 795 3 824 3 707 3 598 3 734 3 287 3 379 3 264 3 223 3 028Belgium 31 31 31 30 30 30 29 27 27 25 23Bulgaria 9 11 19 11 7 7 15 12 8 5 8Czech Republic 4 3 4 4 5 5 5 5 5 4 5Denmark 1 681 1 827 1 557 1 405 1 534 1 511 1 442 1 031 1 090 911 868Germany 237 259 267 239 205 211 224 261 262 286 279Estonia 109 124 119 112 113 105 101 79 88 100 87Ireland 333 293 325 284 276 356 282 266 280 262 211Greece 151 157 110 121 99 94 96 93 93 92 97Spa<strong>in</strong> 1 174 1 204 1 243 1 170 1 070 1 107 865 866 770 768 711France 641 638 599 664 703 681 704 709 671 595 583Italy 366 344 306 283 302 310 270 296 279 298 312Cyprus 13 25 19 40 67 81 2 2 2 2 2Latvia 143 106 102 125 136 128 114 115 125 151 140Lithuania 89 44 67 73 79 151 150 157 162 140 153Luxembourg 0 0 0 0 0 0 0 0 0 0 0Hungary 8 7 7 8 7 7 7 7 7 8 8Malta 9 1 1 1 1 1 1 1 1 1 1Netherlands 411 452 537 515 496 518 464 526 522 549 433Austria 0 0 0 0 0 0 0 0 0 0 0Poland 343 348 242 236 218 225 223 180 192 156 123Portugal 263 224 228 213 191 193 202 209 221 212 229Romania 18 8 9 8 7 8 7 10 5 6 7Slovenia 2 2 2 2 2 2 2 1 1 1 1Slovakia 1 1 1 1 1 2 2 2 2 2 2F<strong>in</strong>land 164 165 156 145 156 150 146 122 135 132 146Sweden 371 357 411 351 339 312 295 287 270 256 269United K<strong>in</strong>gdom 868 892 923 841 748 740 690 637 655 669 616Croatia 18 17 22 19 21 18 21 20 30 35 :FYR of Macedonia 0 0 0 0 0 0 0 0 0 0 :Turkey 528 459 487 574 503 528 567 508 550 426 :Iceland 2 074 2 225 1 700 1 754 2 000 2 001 2 145 2 002 1 750 1 661 1 345Liechtenste<strong>in</strong> 0 0 0 0 0 0 0 0 0 0 :Norway 2 650 2 863 2 861 2 628 2 700 2 687 2 740 2 549 2 525 2 393 2 245Switzerland 2 2 2 2 2 2 2 2 2 1 :Canada 923 999 1 037 1 059 1 039 1 093 1 099 1 082 : : :Japan 6 086 6 067 5 419 5 305 5 105 4 825 4 489 4 784 4 427 4 178 :United States 4 995 4 972 4 751 4 822 4 807 5 020 5 006 4 989 5 144 4 846 :Source: <strong>Eurostat</strong> (tag00076), FAO368 EUROPE IN FIGURES — <strong>Eurostat</strong> <strong>yearbook</strong> <strong>2009</strong>
Agriculture, forestry and fisheries 9Table 9.14: Total aquaculture production(1 000 tonnes live weight)1996 1997 1998 1999 2000 2001 2002 2003 2004 2005 2006EU-27 1 230 1 254 1 378 1 432 1 402 1 389 1 277 1 347 1 332 1 272 :Euro area 996 1 002 1 119 1 143 1 116 1 084 981 1 038 994 968 :Belgium 1 1 1 2 2 2 2 1 1 1 :Bulgaria 5 5 4 8 4 3 2 4 2 3 3Czech Republic 18 18 17 19 19 20 19 20 19 20 20Denmark 42 40 42 43 44 42 32 38 43 39 28Germany 83 65 73 80 66 53 50 74 57 45 38Estonia 0 0 0 0 0 0 0 0 0 1 1Ireland 35 37 42 44 51 61 63 63 58 60 53Greece 40 49 60 84 95 98 88 101 97 106 113Spa<strong>in</strong> 232 239 315 321 312 313 259 273 299 222 295France 286 287 268 265 267 252 252 240 261 258 :Italy 189 196 209 210 217 218 184 192 118 181 174Cyprus 1 1 1 1 2 2 2 2 2 2 4Latvia 0 0 0 0 0 0 0 1 1 1 1Lithuania 2 2 2 2 2 2 2 2 3 2 2Luxembourg 0 0 0 0 0 0 0 0 0 0 0Hungary 8 9 10 12 13 13 12 12 13 14 15Malta 2 2 2 2 2 1 1 1 1 1 7Netherlands 100 98 120 109 75 57 54 67 76 68 41Austria 3 3 3 3 3 2 2 2 2 2 3Poland 28 29 30 34 36 35 33 35 35 37 36Portugal 5 7 8 6 8 8 8 8 7 6 7Romania 14 11 10 9 10 11 9 9 8 7 9Slovenia 1 1 1 1 1 1 1 1 2 2 1Slovakia 1 1 1 1 1 1 1 1 1 1 1F<strong>in</strong>land 18 16 16 15 15 16 15 13 13 14 13Sweden 8 7 5 6 5 7 6 6 6 6 8United K<strong>in</strong>gdom 110 130 137 155 152 171 179 182 207 173 172Croatia 3 4 6 6 7 10 8 8 13 14 :FYR of Macedonia 1 1 1 2 2 1 1 1 1 1 :Turkey 33 45 57 63 79 67 61 80 94 119 :Iceland 4 4 4 4 4 4 4 6 9 8 :Norway 322 368 411 476 491 511 551 584 637 657 709Switzerland 1 1 1 1 1 1 1 1 1 1 :Canada 72 82 91 113 128 153 171 151 145 154 :Japan 1 349 1 340 1 290 1 315 1 292 1 311 1 385 1 302 1 261 1 254 :United States 393 438 445 479 456 479 497 544 607 472 :Source: <strong>Eurostat</strong> (tag00075), FAOEUROPE IN FIGURES — <strong>Eurostat</strong> <strong>yearbook</strong> <strong>2009</strong>369
External tradeThe EU has a common trade policy whereby the <strong>Europe</strong>an Commission negotiatestrade agreements and represents the EU’s <strong>in</strong>terests on behalf of its 27 Member States.The <strong>Europe</strong>an Commission consults Member States through an advisory committeewhich discusses the full range of trade policy issues affect<strong>in</strong>g the Community <strong>in</strong>clud<strong>in</strong>gmultilateral, bilateral and unilateral <strong>in</strong>struments.Multilateral trade issues are dealt <strong>with</strong> under the auspices of the World Trade Organisation(WTO). Its membership covers 153 countries (as of July 2008), <strong>with</strong> severalcandidate members <strong>in</strong> the process of jo<strong>in</strong><strong>in</strong>g. The WTO sets the global rules for trade,provides a forum for trade negotiations, and for settl<strong>in</strong>g disputes between members.The <strong>Europe</strong>an Commission negotiates <strong>with</strong> its WTO partners on behalf of the EUMember States, and has participated <strong>in</strong> the latest round of WTO multilateral trade negotiations,known as the Doha Development Agenda (DDA). However, hav<strong>in</strong>g misseddeadl<strong>in</strong>es to conclude the talks <strong>in</strong> 2005 and aga<strong>in</strong> <strong>in</strong> 2006, the Doha round of talksbroke down aga<strong>in</strong> at a WTO meet<strong>in</strong>g <strong>in</strong> July 2008 (1) and at the time of writ<strong>in</strong>g the futureof these multilateral trade negotiations rema<strong>in</strong>s uncerta<strong>in</strong>.(1) http://ec.europa.eu/trade and http://www.wto.org.EUROPE IN FIGURES — <strong>Eurostat</strong> <strong>yearbook</strong> <strong>2009</strong>371
10 External trade10.1 Share <strong>in</strong> world tradeIntroductionExternal trade statistics are used extensivelyby public body decision makers atan <strong>in</strong>ternational, EU and national level,as well as by the private sector. In thecase of Community authorities, externaltrade statistics help <strong>in</strong> the preparationof multilateral and bilateral trade negotiations,<strong>in</strong> def<strong>in</strong><strong>in</strong>g and implement<strong>in</strong>ganti-dump<strong>in</strong>g policies, for the purposesof macroeconomic and monetary policiesand <strong>in</strong> evaluat<strong>in</strong>g the progress of theS<strong>in</strong>gle Market, or the <strong>in</strong>tegration of <strong>Europe</strong>aneconomies. In the private sector,bus<strong>in</strong>esses can use external trade datato carry out market research and def<strong>in</strong>etheir commercial strategy.Def<strong>in</strong>itions and data availabilityWith<strong>in</strong> the EU, there are two ma<strong>in</strong>sources for statistics on external trade.External trade statistics (ETS) provide<strong>in</strong>formation on trade <strong>in</strong> goods, collectedpredom<strong>in</strong>antly on the basis of customsand Intrastat (2) declarations. ETS provide<strong>in</strong>formation on the value and volumes(quantity) of external trade <strong>in</strong> goods <strong>with</strong>great detail concern<strong>in</strong>g the type of commodity.The second source is the balanceof payments statistics (BoP) that registerall the transactions of an economy <strong>with</strong>the rest of the world. The current accountof the BoP provides <strong>in</strong>formation not onlyon external trade <strong>in</strong> goods (generally thelargest category), but also on externaltransactions <strong>in</strong> services, <strong>in</strong>come (fromemployment and <strong>in</strong>vestment) and currenttransfers. For all these transactions, theBoP registers the value of exports (credits)and imports (debits), the difference ofwhich is usually referred to as the balance(surplus or deficit).Trade <strong>in</strong>tegration of goods and servicesis measured as the average value of debitsand credits (summed together and dividedby two) expressed relative to GDP. This<strong>in</strong>dicator is calculated for both goods andservices, based on BoP data; higher values<strong>in</strong>dicate higher <strong>in</strong>tegration <strong>with</strong><strong>in</strong> the<strong>in</strong>ternational economy. It is normal thatsmaller countries will display a higher recourseto external trade, as they are morelikely to import a range of goods andservices that are not produced <strong>with</strong><strong>in</strong> thedomestic market.Ma<strong>in</strong> f<strong>in</strong>d<strong>in</strong>gsThe economy of the EU-27 was more <strong>in</strong>tegrated<strong>with</strong> the <strong>in</strong>ternational economy<strong>in</strong> 2007 (<strong>in</strong> terms of the credits and debitsrelative to GDP) than at any time <strong>in</strong> theprevious five years. The average value ofEU-27 trade flows of goods correspondedto 10.7 % of GDP <strong>in</strong> 2006, a much higherratio than the relative low of 8.8 % <strong>in</strong>2003 (for the EU-25), reflect<strong>in</strong>g a broadupturn <strong>in</strong> economic activity. Althoughthe volume of external trade <strong>in</strong> servicesis less than that for goods, the trade <strong>in</strong>tegrationof services also rose, reach<strong>in</strong>g theequivalent of 3.7 % of GDP <strong>in</strong> 2007.The EU-27 had a trade deficit <strong>with</strong> therest of the world <strong>in</strong> goods that equatedto -1.2 % of GDP <strong>in</strong> 2007, <strong>in</strong> contrast to(2) Paper or electronic declarations of <strong>in</strong>tra-EU trade addressed by the traders to the competent national adm<strong>in</strong>istration.372 EUROPE IN FIGURES — <strong>Eurostat</strong> <strong>yearbook</strong> <strong>2009</strong>
External trade 10a surplus <strong>in</strong> services that correspondedto 0.7 % of GDP. There were stark contrastsamong the Member States, reflect<strong>in</strong>gamong other factors, the relative sizeof the country and differences <strong>in</strong> respectiveeconomic structures. Trade deficits<strong>in</strong> goods were equivalent to one fifth ormore of GDP <strong>in</strong> Cyprus, Bulgaria andLatvia. In contrast, the trade surpluses<strong>in</strong> goods recorded <strong>in</strong> Ireland, Germanyand the Netherlands were equivalent to12.3 %, 8.4 % and 6.8 % of GDP respectively<strong>in</strong> 2007, the highest relative levelsamong the Member States. Relative toGDP, there were large trade surpluses <strong>in</strong>services recorded <strong>in</strong> Luxembourg, Cyprusand Malta <strong>in</strong> 2007.Figure 10.1: Trade <strong>in</strong>tegration, EU-27 (1)(% of GDP)1210864202002 2003 2004 2005 2006 2007GoodsServices(1) 2002 and 2003, EU-25.Source: <strong>Eurostat</strong> (tsier120)EUROPE IN FIGURES — <strong>Eurostat</strong> <strong>yearbook</strong> <strong>2009</strong>373
10 External tradeTable 10.1: Share of goods and services <strong>in</strong> GDP, 2007 (1)(% of GDP)GoodsServicesExports Imports Balance Exports Imports BalanceEU-27 10.1 11.3 -1.2 4.1 3.4 0.7Euro area (2) 17.0 16.3 -1.4 5.5 5.0 0.5Belgium 71.2 71.0 0.2 17.1 15.6 1.5Bulgaria 46.7 72.0 -25.6 15.9 12.1 3.8Czech Republic 69.9 66.7 3.1 9.6 8.1 1.6Denmark 32.4 32.7 -0.4 19.8 17.4 2.4Germany 40.7 32.4 8.4 6.5 7.8 -1.3Estonia 53.0 70.1 -17.0 21.0 14.4 6.5Ireland 45.4 33.1 12.3 34.9 37.0 -2.2Greece 7.1 21.0 -13.8 13.9 6.0 7.9Spa<strong>in</strong> 17.8 26.4 -8.5 9.0 6.9 2.1France 21.1 23.2 -2.0 5.3 4.8 0.5Italy 23.9 23.7 0.1 5.4 5.8 -0.4Cyprus 7.0 36.5 -29.4 40.9 17.3 23.7Latvia 30.1 54.7 -24.6 13.5 10.0 3.5Lithuania 44.6 59.2 -14.6 10.7 8.6 2.1Luxembourg 37.4 46.8 -9.4 126.5 72.8 53.7Hungary 68.0 66.5 1.4 12.1 11.0 1.1Malta 42.5 60.9 -16.6 42.5 27.7 14.8Netherlands 58.9 52.1 6.8 11.5 11.3 0.3Austria 45.4 44.9 0.5 15.0 10.5 4.5Poland 34.1 37.8 -3.7 6.8 5.8 0.9Portugal 23.1 33.7 -10.7 10.0 6.2 3.8Romania 24.2 38.8 -14.6 6.3 6.1 0.2Slovenia 59.0 63.8 -5.1 12.2 9.2 3.0Slovakia 77.0 78.4 -1.5 9.3 8.8 0.7F<strong>in</strong>land 36.5 31.7 4.8 8.4 8.5 -0.1Sweden 37.4 33.3 4.1 13.7 10.5 3.1United K<strong>in</strong>gdom 16.0 22.3 -6.3 10.0 7.2 2.8Turkey 17.2 24.4 -7.2 4.4 2.2 2.1Norway 36.0 19.8 16.2 10.5 10.1 0.4Japan 14.1 12.2 1.9 2.7 3.1 -0.4United States 7.8 14.1 -6.3 3.2 2.6 0.6(1) Japan and the United States, 2006; Greece, 2005.(2) EA-13 <strong>in</strong>stead of EA-15.Source: <strong>Eurostat</strong> (tec00039, tec00040 and tec00001)374 EUROPE IN FIGURES — <strong>Eurostat</strong> <strong>yearbook</strong> <strong>2009</strong>
External trade 1010.2 External trade <strong>in</strong> servicesIntroductionServices cover a heterogeneous range ofproducts and activities that are difficultto encapsulate <strong>with</strong><strong>in</strong> a simple def<strong>in</strong>ition.Services are also often difficult to separatefrom goods <strong>with</strong> which they may beassociated or bundled <strong>in</strong> vary<strong>in</strong>g degrees,and trade <strong>in</strong> goods may <strong>in</strong>dist<strong>in</strong>guishably<strong>in</strong>clude service charges such as <strong>in</strong>surance,ma<strong>in</strong>tenance contracts, transportcharges, or royalty/licence payments.Services differ from goods <strong>in</strong> a number ofways, most commonly <strong>in</strong> the immediacyof the relationship between supplier andconsumer. Many services are non-transportable,<strong>in</strong> other words, they require thephysical proximity of service providerand consumer – for example, the provisionof a hotel service requires that thehotel is where the customer wishes to stay,a clean<strong>in</strong>g service for a bus<strong>in</strong>ess must beprovided at the site of the bus<strong>in</strong>ess, and ahaircut requires both hairstylist and clientto be present. This proximity requirementimplies that many services transactions<strong>in</strong>volve factor mobility. Thus, animportant feature of services is that theyare provided via various modes of supply.Follow<strong>in</strong>g the General Agreement onTrade <strong>in</strong> Services (GATS), the four-parttypology of external services transactionsthat constitutes the generally acceptedframework for services analysisencompasses:• cross border supply (mode 1) of a servicefrom one jurisdiction to another;• consumption abroad (mode 2) requiresthe presence of consumers <strong>in</strong>the supplier’s country of residence;• commercial presence (mode 3), <strong>in</strong>which a service supplier establishes aforeign based corporation, jo<strong>in</strong>t venture,partnership, or other establishment<strong>in</strong> the consumer’s country ofresidence to supply services to persons<strong>in</strong> the host country; and,• presence of natural persons (mode 4),which <strong>in</strong>volves an <strong>in</strong>dividual, function<strong>in</strong>galone or as an employee of aservice provider, temporarily travell<strong>in</strong>gabroad to deliver a service <strong>in</strong> theconsumer’s country of residence.Services tend not to be homogenous ormass produced, many be<strong>in</strong>g tailored accord<strong>in</strong>gto the client’s needs and tastes.For external trade <strong>in</strong> such non-transportableservices to take place, either theconsumer must go to the service provideror the service provider must go to theconsumer.Def<strong>in</strong>itions and data availabilityThe ma<strong>in</strong> methodological references forthe production of statistics on externaltrade <strong>in</strong> services are the InternationalMonetary Fund’s fifth balance of paymentsmanual (BPM5) and the UnitedNations’ manual on statistics of <strong>in</strong>ternationaltrade <strong>in</strong> services. The breakdownof <strong>Eurostat</strong> statistics on trade <strong>in</strong> services<strong>in</strong>cludes three ma<strong>in</strong> sub-items – transportation,travel, and other services.Transportation• covers services providedby all modes of transportation– sea, air, and other, which <strong>in</strong>cludesspace, rail, road, <strong>in</strong>land waterway andpipel<strong>in</strong>e. The different types of servicesoffered <strong>in</strong>clude the transport ofEUROPE IN FIGURES — <strong>Eurostat</strong> <strong>yearbook</strong> <strong>2009</strong>375
10 External tradepassengers, the transport of freight,and other support<strong>in</strong>g and auxiliaryservices (such as storage andwarehous<strong>in</strong>g).• The debit side of travel consists ofgoods and services which are acquiredby residents who stay abroadfor less than one year. The credit side<strong>in</strong>cludes purchases of the same typemade by foreign travellers on the nationalterritory. The travel item conta<strong>in</strong>stwo ma<strong>in</strong> categories, namelybus<strong>in</strong>ess travel and personal travel(leisure, study, health-related purposes,etc.). Note that <strong>in</strong>ternationaltransportation costs of the traveller toa dest<strong>in</strong>ation are recorded under thehead<strong>in</strong>g transportation, but all movements<strong>with</strong><strong>in</strong> the country, <strong>in</strong>clud<strong>in</strong>gcruises, are entered under travel.• Other services comprise those externaltransactions not covered undertransportation or travel (such as communicationservices, constructionservices, <strong>in</strong>surance services, f<strong>in</strong>ancialservices, computer and <strong>in</strong>formationservices, royalties and licence fees,other bus<strong>in</strong>ess services, personal, culturaland recreational services, andgovernment services).In the balance of payments (BoP) statistics,the EU current account is geographicallyallocated accord<strong>in</strong>g to the residenceof the trad<strong>in</strong>g partner. <strong>Eurostat</strong> providesdetailed <strong>in</strong>formation on the geographicalbreakdown of the external trade <strong>in</strong> servicesof the EU, dist<strong>in</strong>guish<strong>in</strong>g between:• <strong>in</strong>tra-EU transactions, correspond<strong>in</strong>gto the sum of the transactionsdeclared by EU Member States <strong>with</strong>other EU Member States, and;• extra-EU transactions, correspond<strong>in</strong>gto the transactions declared by EUMember States <strong>with</strong> countries outsidethe EU. Extra-EU transactions arefurther broken down <strong>in</strong>to detailedpartner zones, for example, for <strong>in</strong>dividualcountries (such as the UnitedStates or Japan), for economic zones(such as the OE<strong>CD</strong>, ACP or NAFTAcountries), and for geographical zonesor cont<strong>in</strong>ents (such as Africa, Asia orNorth America);• world transactions are equal to thesum of <strong>in</strong>tra-EU transactions andextra-EU transactions.F<strong>in</strong>ally, it is worth not<strong>in</strong>g that the classificationof external trade <strong>in</strong> services follow<strong>in</strong>gBPM5 is not consistent <strong>with</strong> thefour-type GATS classification of trade <strong>in</strong>services. BoP statistics presented <strong>in</strong> thischapter generally refer to services tradedexternally, ma<strong>in</strong>ly by the first and secondmode, and, to a limited extent, to tradevia the movement of natural persons (partof computer and <strong>in</strong>formation services, ofother bus<strong>in</strong>ess services, and of personal,cultural and recreational services) andvia commercial presence (part of constructionservices). Therefore, given thelimited modal coverage of BoP statistics,additional sources of <strong>in</strong>formation needto be consulted <strong>with</strong> respect to the othermodes of supply <strong>in</strong> order to give a morecomplete picture of trade <strong>in</strong> services (3) .(3) See the Manual on Statistics of International Trade <strong>in</strong> Services, developed jo<strong>in</strong>tly by the IMF, the OE<strong>CD</strong>, <strong>Eurostat</strong>, WTO, UNand UNCTAD for more details on additional sources.376 EUROPE IN FIGURES — <strong>Eurostat</strong> <strong>yearbook</strong> <strong>2009</strong>
External trade 10With<strong>in</strong> the BoP the terms credits anddebits are used which, to the extent thatthey concern the trad<strong>in</strong>g of goods andservices, can roughly be considered to beequivalent to exports and imports.Ma<strong>in</strong> f<strong>in</strong>d<strong>in</strong>gsThe importance of services <strong>with</strong><strong>in</strong> EUeconomies cont<strong>in</strong>ues to grow and <strong>in</strong> 2007services contributed 71.7 % of the grossvalue added <strong>with</strong><strong>in</strong> the EU-27. However,this importance is scarcely reflected <strong>in</strong>terms of external trade. Indeed, the shareof services <strong>in</strong> total trade (goods and services)has rema<strong>in</strong>ed fairly stable at around25 % to 27 % s<strong>in</strong>ce 2001.The EU-27 reported a surplus <strong>in</strong> servicetransactions of EUR 88 400 million <strong>with</strong>the rest of the world <strong>in</strong> 2007, reflect<strong>in</strong>gcredits of EUR 501 400 million and debitsof EUR 413 000 million. This representedstrong growth when compared <strong>with</strong> thesurplus of EUR 69 500 million that wasrecorded for 2006, itself a big <strong>in</strong>creaseover 2005.The United K<strong>in</strong>gdom recorded a netcredit (extra and <strong>in</strong>tra-EU comb<strong>in</strong>ed)of EUR 56 100 million <strong>in</strong> service transactions<strong>in</strong> 2007, the highest net creditamong the Member States and considerablymore than the next highest that wasrecorded by Spa<strong>in</strong> (EUR 22 100 million).In contrast, Germany recorded a net deficit<strong>in</strong> service transactions of EUR 30 400million <strong>in</strong> 2007, the largest deficit by faramong the Member States.North America represented the EU-27’spr<strong>in</strong>cipal external trad<strong>in</strong>g partner <strong>in</strong>service transactions, account<strong>in</strong>g for32.8 % of the EU-27’s debits and 35.0 % ofits credits (when <strong>in</strong>tra-EU trade is not <strong>in</strong>cluded).It is important to underl<strong>in</strong>e thatmost (59 %) of EU-27 trade <strong>in</strong> serviceswas between EU Member States (<strong>in</strong>tra-EU transactions).More than two thirds of the EU-27’s credits(68.4 %) and debits (73.5 %) <strong>in</strong> the externaltrade of services were accounted forby transportation, travel and the categoryof other bus<strong>in</strong>ess services <strong>in</strong> 2007. Thesurplus of EUR 40 100 million for otherbus<strong>in</strong>ess services was the highest amongservices for the EU-27 <strong>in</strong> 2007, closely followedby the surplus of EUR 33 100 millionfor f<strong>in</strong>ancial services. In contrast,there were large deficits of EUR 10 600million for royalties and license fees andEUR 17 400 million for travel.EUROPE IN FIGURES — <strong>Eurostat</strong> <strong>yearbook</strong> <strong>2009</strong>377
10 External tradeTable 10.2: External trade <strong>in</strong> services (1)(EUR 1 000 million)Credits Debits Net2006 20072006-07growth rate(%) 2006 20072006-07growth rate(%) 2006 2007EU-27 450.0 501.4 11.4 380.4 413.0 8.6 69.5 88.4Euro area (2) 433.7 491.1 13.2 395.9 443.9 12.1 37.8 47.3Belgium 47.4 56.5 19.2 42.3 51.6 22.0 5.1 4.9Bulgaria 4.2 4.6 9.5 3.3 3.5 6.1 0.9 1.1Czech Republic 10.9 12.3 12.8 9.4 10.3 9.6 1.5 2.0Denmark 41.7 45.0 7.9 36.4 39.5 8.5 5.3 5.4Germany 149.6 158.2 5.7 178.6 188.6 5.6 -29.0 -30.4Estonia 2.8 3.2 14.3 2.0 2.2 10.0 0.8 1.0Ireland 55.1 64.8 17.6 62.5 68.7 9.9 -7.4 -4.0Greece : : : : : : : :Spa<strong>in</strong> 84.7 94.1 11.1 62.4 72.0 15.4 22.3 22.1France 94.2 100.3 6.5 86.0 91.4 6.3 8.3 8.9Italy 78.4 83.3 6.2 79.9 89.5 12.0 -1.5 -6.2Cyprus 5.8 6.4 10.3 2.4 2.7 12.5 3.4 3.7Latvia 2.1 2.7 28.6 1.6 2.0 25.0 0.5 0.7Lithuania 2.9 3.0 3.4 2.0 2.4 20.0 0.9 0.6Luxembourg 40.5 45.7 12.8 24.0 26.3 9.6 16.5 19.4Hungary 10.5 12.2 16.2 9.3 11.1 19.4 1.3 1.1Malta 2.1 2.3 9.5 1.3 1.5 15.4 0.8 0.8Netherlands 65.5 65.4 -0.2 63.3 63.8 0.8 2.2 1.7Austria 36.8 40.7 10.6 26.6 28.4 6.8 10.2 12.3Poland 16.3 20.9 28.2 15.8 18.0 13.9 0.6 2.9Portugal 14.2 16.3 14.8 9.4 10.1 7.4 4.8 6.2Romania 5.6 7.6 35.7 5.6 7.4 32.1 0.0 0.2Slovenia 3.5 4.1 17.1 2.6 3.1 19.2 0.9 1.0Slovakia 4.3 5.1 18.6 3.8 4.8 26.3 0.5 0.4F<strong>in</strong>land 13.9 15.1 8.6 14.8 15.2 2.7 -0.9 -0.1Sweden 39.6 45.4 14.6 31.6 35.0 10.8 7.9 10.4United K<strong>in</strong>gdom 186.6 202.3 8.4 141.0 146.2 3.7 45.5 56.1Turkey 20.0 20.9 4.5 9.1 10.7 17.6 10.9 10.2Norway 26.2 29.8 13.7 25.1 28.7 14.3 1.2 1.1Japan 93.5 : : 107.9 : : -14.4 :United States 333.4 : : 272.9 : : 60.5 :(1) Transactions are registered vis-à-vis the rest of the world; EU-27 partner is extra EU-27, euro area partner is extra euro area, MemberStates partner is the rest of the world.(2) EA-13 <strong>in</strong>stead of EA-15.Source: <strong>Eurostat</strong> (tec00040)378 EUROPE IN FIGURES — <strong>Eurostat</strong> <strong>yearbook</strong> <strong>2009</strong>
External trade 10Table 10.3: Contribution to extra EU-27 trade <strong>in</strong> services, 2006CreditsDebitsNet(EUR 1 000million)Share of EU-27credits (%)(EUR 1 000million)Share of EU-27debits (%)(EUR 1 000million)EU-27 441.6 100.0 373.1 100.0 68.5Euro area 425.6 96.4 390.5 104.7 35.1Belgium 11.9 2.7 10.7 2.9 1.2Bulgaria 1.3 0.3 0.9 0.2 0.5Czech Republic 3.2 0.7 3.0 0.8 0.2Denmark 21.4 4.8 17.0 4.6 4.4Germany 63.9 14.5 71.3 19.1 -7.3Estonia 0.8 0.2 0.5 0.1 0.3Ireland 24.6 5.6 32.5 8.7 -7.8Greece 13.3 3.0 6.0 1.6 7.3Spa<strong>in</strong> 21.5 4.9 21.1 5.6 0.4France 44.8 10.1 42.1 11.3 2.6Italy 30.0 6.8 30.1 8.1 -0.1Cyprus 1.7 0.4 0.8 0.2 0.9Latvia 1.0 0.2 0.7 0.2 0.4Lithuania 1.3 0.3 0.8 0.2 0.5Luxembourg 10.4 2.4 5.9 1.6 4.5Hungary 3.3 0.7 3.0 0.8 0.2Malta 0.5 0.1 0.4 0.1 0.1Netherlands 32.9 7.4 29.1 7.8 3.7Austria 8.9 2.0 7.2 1.9 1.7Poland 4.1 0.9 3.8 1.0 0.4Portugal 3.1 0.7 2.5 0.7 0.6Romania 1.6 0.4 1.4 0.4 0.1Slovenia 0.9 0.2 1.0 0.3 -0.1Slovakia 1.1 0.2 0.6 0.2 0.4F<strong>in</strong>land 7.1 1.6 4.7 1.3 2.4Sweden 19.2 4.4 10.6 2.8 8.6United K<strong>in</strong>gdom 107.7 24.4 64.9 17.4 42.8Source: <strong>Eurostat</strong> (bop_its_det)EUROPE IN FIGURES — <strong>Eurostat</strong> <strong>yearbook</strong> <strong>2009</strong>379
10 External tradeTable 10.4: Contribution to <strong>in</strong>tra EU-27 trade <strong>in</strong> services, 2006CreditsDebitsNet(EUR 1 000million)Share of EU-27credits (%)(EUR 1 000million)Share of EU-27debits (%)(EUR 1 000million)EU-27 599.9 100.0 566.6 100.0 33.4Belgium 35.5 5.9 31.5 5.6 3.9Bulgaria 2.8 0.5 2.3 0.4 0.5Czech Republic 7.4 1.2 6.4 1.1 1.0Denmark 20.5 3.4 19.7 3.5 0.8Germany 75.1 12.5 103.7 18.3 -28.5Estonia 2.0 0.3 1.5 0.3 0.5Ireland 30.4 5.1 30.0 5.3 0.4Greece 15.1 2.5 7.1 1.2 8.0Spa<strong>in</strong> 63.0 10.5 41.3 7.3 21.7France 49.5 8.2 43.8 7.7 5.7Italy 48.4 8.1 49.8 8.8 -1.4Cyprus 4.1 0.7 1.6 0.3 2.5Latvia 1.1 0.2 0.9 0.2 0.2Lithuania 1.5 0.3 1.2 0.2 0.4Luxembourg 30.2 5.0 18.1 3.2 12.0Hungary 7.3 1.2 6.3 1.1 1.1Malta 1.5 0.3 0.9 0.2 0.6Netherlands 42.2 7.0 43.3 7.6 -1.2Austria 28.1 4.7 18.7 3.3 9.4Poland 12.2 2.0 10.8 1.9 1.4Portugal 11.0 1.8 6.8 1.2 4.3Romania 3.9 0.7 4.1 0.7 -0.1Slovenia 2.5 0.4 1.6 0.3 0.9Slovakia 3.2 0.5 3.2 0.6 0.1F<strong>in</strong>land 5.7 1.0 7.7 1.4 -2.0Sweden 20.1 3.4 18.4 3.2 1.7United K<strong>in</strong>gdom 75.0 12.5 75.1 13.2 0.0Source: <strong>Eurostat</strong> (bop_its_det)380 EUROPE IN FIGURES — <strong>Eurostat</strong> <strong>yearbook</strong> <strong>2009</strong>
External trade 10Figure 10.2: Trade <strong>in</strong> services, EU-27, 2006(% share of extra EU-27 transactions)403020100<strong>Europe</strong>ancountries notEU nor EFTANorth AfricaCentral andSouth AfricaNorthAmericaCentralAmericaSouthAmericaNear andMiddle EastOther AsiancountriesOceania(<strong>in</strong>clud<strong>in</strong>gAustralia) andsouthernpolar regionsCreditsDebitsSource: <strong>Eurostat</strong> (tec00082 and bop_its_det)Table 10.5: EU-27 credits for services(%)2003 2004 2005 2006 2007All countries of the world 100.0 100.0 100.0 100.0 100.0Extra-EU 42.6 41.4 41.8 42.4 43.2<strong>Europe</strong>an Free Trade Association 7.1 6.9 6.8 6.8 :Switzerland 5.5 5.3 5.1 5.1 5.2<strong>Europe</strong>an countries not EU nor EFTA 5.2 2.5 3.0 3.2 :Central and Eastern <strong>Europe</strong> 2.9 0.4 0.4 0.4 :Community of Independent States 1.4 1.6 1.8 2.0 :Russian Federation 1.0 1.1 1.3 1.4 1.6Africa 2.6 2.5 2.5 2.5 :America 17.3 16.8 16.7 16.9 :Canada 0.9 0.9 0.9 1.0 1.0United States 14.0 13.3 12.8 12.9 12.0Brazil 0.4 0.4 0.5 0.5 0.6Asia 8.7 9.3 9.7 9.7 :Ch<strong>in</strong>a (excl. Hong Kong) 0.9 1.0 1.3 1.2 1.5Hong Kong 0.8 0.8 0.9 0.7 0.7India 0.4 0.4 0.6 0.7 0.8Japan 2.1 2.1 2.0 1.8 1.7Oceania (<strong>in</strong>clud<strong>in</strong>g Australia) and southern polar regions 0.9 1.1 1.1 1.1 :2003 2004 2005 2006 2007OE<strong>CD</strong> countries 82.8 83.0 81.9 81.2 :North American Free Trade Association member countries 15.3 14.7 14.1 14.3 :Petroleum Export<strong>in</strong>g Countries (OPEC) 2.3 2.2 2.3 2.6 :African, Caribbean and Pacific countries, signatories of thePartnership Agreement (Cotonou agreement)1.9 1.9 1.9 2.0 :Association of South-East Asian Nations 1.6 1.6 1.6 1.7 :Southern Common Market 0.5 0.6 0.7 0.8 :Source: <strong>Eurostat</strong> (tec00080)EUROPE IN FIGURES — <strong>Eurostat</strong> <strong>yearbook</strong> <strong>2009</strong>381
10 External tradeTable 10.6: EU-27 debits for services(%)2003 2004 2005 2006 2007All countries of the world 100.0 100.0 100.0 100.0 100.0Extra-EU 39.8 39.6 39.6 39.7 40.0<strong>Europe</strong>an Free Trade Association 5.6 5.5 5.6 5.3 :Switzerland 4.3 4.2 4.3 4.0 4.0<strong>Europe</strong>an countries not EU nor EFTA 7.0 3.4 3.6 3.7 :Central and Eastern <strong>Europe</strong> 3.9 0.7 0.7 0.7 :Community of Independent States 1.2 1.5 1.7 1.9 :Russian Federation 0.8 0.9 1.0 1.1 1.1Africa 2.9 3.1 3.1 3.1 :America 17.7 17.4 17.3 17.0 :Canada 0.9 0.9 0.9 0.9 0.9United States 13.7 13.5 13.4 13.0 12.4Brazil 0.5 0.4 0.5 0.5 0.5Asia 7.1 7.8 7.9 8.4 :Ch<strong>in</strong>a (excl. Hong Kong) 0.6 0.9 1.1 1.2 1.3Hong Kong 0.6 0.6 0.6 0.7 0.8India 0.4 0.5 0.5 0.6 0.6Japan 1.3 1.4 1.4 1.4 1.3Oceania (<strong>in</strong>clud<strong>in</strong>g Australia) and southern polar regions 0.8 0.8 0.9 0.9 :2003 2004 2005 2006 2007OE<strong>CD</strong> countries 83.1 82.6 82.4 81.4 :North American Free Trade Association member countries 15.0 14.7 14.6 14.1 :Petroleum Export<strong>in</strong>g Countries (OPEC) 1.5 1.5 1.5 1.6 :African, Caribbean and Pacific countries, signatories of thePartnership Agreement (Cotonou agreement)2.1 2.1 2.2 2.0 :Association of South-East Asian Nations 1.6 1.6 1.6 1.7 :Southern Common Market 0.7 0.6 0.6 0.7 :Source: <strong>Eurostat</strong> (tec00081)382 EUROPE IN FIGURES — <strong>Eurostat</strong> <strong>yearbook</strong> <strong>2009</strong>
External trade 10Table 10.7: Development of trade <strong>in</strong> services, by selected partner, EU-27(EUR 1 000 million)2005 2006 2007Credits Debits Net Credits Debits Net Credits Debits NetTotal 402.9 350.0 52.9 441.6 373.1 68.5 501.4 413.0 88.4United States 123.2 118.2 4.9 134.7 122.1 12.6 139.0 127.9 11.2EFTA 65.4 49.0 16.4 70.4 49.4 21.1 : : :Japan 19.6 12.3 7.3 18.9 12.9 6.0 19.4 13.4 6.0Russia 12.3 9.1 3.2 14.2 10.8 3.4 18.2 11.5 6.6Ch<strong>in</strong>a 12.3 9.6 2.7 12.8 11.3 1.4 17.7 13.1 4.6Canada 9.0 7.6 1.3 10.2 8.2 2.0 11.2 9.5 1.8India 5.4 4.8 0.6 7.0 5.5 1.4 9.0 6.6 2.4Hong Kong 8.3 5.6 2.6 6.9 6.7 0.2 8.4 7.8 0.6Brazil 4.6 4.0 0.6 5.2 4.6 0.5 6.6 4.8 1.8Other countries 142.8 129.6 13.2 161.3 141.5 19.8 : : :Source: <strong>Eurostat</strong> (bop_its_det)Figure 10.3: Trade by ma<strong>in</strong> service categories, EU-27, 2007 (1)(EUR 1 000 million)150100500Otherbus<strong>in</strong>essservicesTransport Travel F<strong>in</strong>ancialservicesRoyaltiesandlicensefeesComputerand<strong>in</strong>formationservicesConstructionservicesInsuranceservicesCommunicationsservicesGovt.services,n.i.e.Personal,culturalandrecreationalservicesCreditsDebits(1) Provisional.Source: <strong>Eurostat</strong> (tec00063, tec00058, tec00062, tec00069, tec00071, tec00070, tec00067, tec00068, tec00066, tec00065 and tec00064)EUROPE IN FIGURES — <strong>Eurostat</strong> <strong>yearbook</strong> <strong>2009</strong>383
10 External trade10.3 External trade <strong>in</strong> goodsIntroductionThe value of external trade <strong>in</strong> goods significantlyexceeds that of services. Thisreflects, among other th<strong>in</strong>gs, that <strong>in</strong> mostcases goods are by their nature commoditieswhich can be traded and transportedacross borders, whereas many services arenon-transportable items for which it isnot possible to separate the place of consumptionfrom the place of production.Def<strong>in</strong>itions and data availabilityIn broad terms, the aim of external tradestatistics on goods (ETS) is to record allflows of goods that add to or subtractfrom the stock of material resources ofa country by enter<strong>in</strong>g or leav<strong>in</strong>g its territory.The most important componentof external trade statistics is related totransactions <strong>in</strong>volv<strong>in</strong>g actual or <strong>in</strong>tendedtransfer of ownership aga<strong>in</strong>st compensation.Nevertheless, external trade statisticsalso cover movements of goods<strong>with</strong>out a transfer of ownership, such asoperations follow<strong>in</strong>g, or <strong>with</strong> a view to,process<strong>in</strong>g under contract (for example,process<strong>in</strong>g textiles).The nomenclature of countries and territoriesfor ETS of the Community andstatistics of trade between Member Statesis an essential element <strong>in</strong> compil<strong>in</strong>g statistics– this nomenclature is called thegeonomenclature. In particular, it makesit possible to identify those <strong>in</strong>volved <strong>in</strong>trade, <strong>in</strong> other words, the report<strong>in</strong>g countryand the partner country. If necessarythe geonomenclature is subject to annualrevision <strong>in</strong> order to <strong>in</strong>corporate theadjustments needed for statistical purposesand to take <strong>in</strong>to account any geopoliticalchange that may have occurred.Exports are recorded at their ‘free onboard’ (fob) value and imports at their‘cost, <strong>in</strong>surance and freight’ (cif) value.Therefore, and contrary to balance ofpayments statistics (see the previoussubchapter), import values for externaltrade statistics <strong>in</strong>clude charges, such astransport and <strong>in</strong>surance, relat<strong>in</strong>g to thatpart of the journey which takes place outsidethe statistical territory of the import<strong>in</strong>gcountry. In contrast, export valuescorrespond to the value of goods at theplace and time where they leave the statisticalterritory of the export<strong>in</strong>g country.Information on external trade for the <strong>Europe</strong>anUnion and the euro area are calculatedas the sum of trade <strong>with</strong> countriesoutside these areas. In other words, eachof these geographical areas is consideredas a s<strong>in</strong>gle trad<strong>in</strong>g entity and trade flowsare measured <strong>in</strong>to and out of the area, butnot <strong>with</strong><strong>in</strong> it. On the other hand, externaltrade flows for <strong>in</strong>dividual MemberStates and other countries are generallypresented <strong>with</strong> the rest of the world asthe trad<strong>in</strong>g partner, <strong>in</strong>clud<strong>in</strong>g trade <strong>with</strong>other Member States (<strong>in</strong>tra-EU trade).For <strong>in</strong>tra-EU trade, the terms dispatchesand arrivals are used; these are equivalentto the terms exports and imports used forextra-EU trade flows.External trade statistics report export andimport values and volumes (quantities)for goods us<strong>in</strong>g a product classification.One of the most common classifications384 EUROPE IN FIGURES — <strong>Eurostat</strong> <strong>yearbook</strong> <strong>2009</strong>
External trade 10for study<strong>in</strong>g aggregate product statistics isthe Standard International Trade Classificationof the United Nations (SITC Rev.4); this classification allows a comparisonto be made on a worldwide basis. Thecommodity group<strong>in</strong>gs of SITC reflect: a)the materials used <strong>in</strong> production; b) theprocess<strong>in</strong>g stage; c) market practices anduses of the products; d) the importance ofthe commodities <strong>in</strong> terms of world trade,and; e) technological changes. Agrifoodproducts are food products obta<strong>in</strong>ed fromagriculture. They are classified accord<strong>in</strong>gto Sections 0 and 1 of the SITC. Trade <strong>in</strong>raw materials refers to Sections 2 and 4 ofthe SITC. Trade <strong>in</strong> fuel products refers toproducts classified accord<strong>in</strong>g to Section 3of the SITC. Trade <strong>in</strong> chemicals refers toproducts classified accord<strong>in</strong>g to Section5 of the SITC. Trade <strong>in</strong> mach<strong>in</strong>ery andtransport equipment refers to productsclassified accord<strong>in</strong>g to Section 7 of theSITC and trade <strong>in</strong> other manufacturedgoods to products classified accord<strong>in</strong>g toSections 6 and 8. The statistics presentedare based on the fourth revision of theclassification; an abbreviated list of theSITC is provided <strong>in</strong> an annex at the endof the publication. SITC Revision 4 wasaccepted by the United Nations StatisticalCommission at its 37th session <strong>in</strong> 2006and its implementation is underway.Ma<strong>in</strong> f<strong>in</strong>d<strong>in</strong>gsThe EU-27 accounts for a little less thanone fifth of the world’s imports and exportsof goods. The EU-27 exported goodsto non-member countries to the value ofEUR 1 240 000 million <strong>in</strong> 2007 and importedgoods from them to the value ofEUR 1 426 000 million. The EU-27 exportedEUR 392 000 million more goodsthan the United States <strong>in</strong> 2007, but importedEUR 46 000 million less. Notethat the EU-27 imports and exports lessgoods than does the EU-15, reflect<strong>in</strong>g thefact that part of the EU-15’s trade camefrom the countries that jo<strong>in</strong>ed the EU <strong>in</strong>2004 and 2007, and these transactions arenot <strong>in</strong>cluded <strong>in</strong> the external trade of theEU-27.S<strong>in</strong>ce 1999 (the period s<strong>in</strong>ce when tradedata for the EU-27 are available), theEU-27 has recorded consecutive annualtrade deficits for goods as a whole, althoughthe level of these deficits has fluctuatedstrongly. The EU-27 trade deficitsfor goods have tended to reduce stronglydur<strong>in</strong>g periods of stagnant or fall<strong>in</strong>g economicactivity, whilst grow<strong>in</strong>g dur<strong>in</strong>g periodsof economic expansion. The EU-27’strade deficit for goods <strong>in</strong> 2007 was EUR186 000 million, a slight reduction compared<strong>with</strong> 2006, but higher than anyother year for which data are available.The trade <strong>in</strong> goods between MemberStates (the EU’s <strong>in</strong>ternal market) wasby far the most important market forgoods produced <strong>with</strong><strong>in</strong> the EU-27; <strong>in</strong>tra-EUdispatches of goods were worthEUR 2 646 000 million <strong>in</strong> 2007, morethan double the value of exports to nonmembercountries. Indeed, <strong>in</strong> each of theMember States the majority of the trade<strong>in</strong> goods <strong>in</strong> 2007 was <strong>with</strong> other MemberStates (<strong>in</strong>tra-EU trade) as opposed to <strong>with</strong>non-member countries (extra-EU trade).The proportion of the total trade <strong>in</strong> goodsaccounted for by these two flows variedEUROPE IN FIGURES — <strong>Eurostat</strong> <strong>yearbook</strong> <strong>2009</strong>385
10 External tradeconsiderably among the Member States,reflect<strong>in</strong>g to some degree historical tiesand geographical location. The highestlevels of trade <strong>in</strong>tegration <strong>with</strong><strong>in</strong> the EUwere recorded for the Czech Republic,Slovakia and Luxembourg; each of thesecountries reported that <strong>in</strong>tra-EU trade <strong>in</strong>goods accounted for about 80 % or moreof their total trade <strong>in</strong> goods. In contrast,about 60 % or less of the external trade <strong>in</strong>goods of the United K<strong>in</strong>gdom, Italy, Bulgaria,Greece and F<strong>in</strong>land were accountedfor by <strong>in</strong>tra-EU trade.In a reverse of the situation for trade <strong>in</strong>services, <strong>in</strong> 2007 Germany recorded thehighest trade surplus (extra and <strong>in</strong>tra-EU comb<strong>in</strong>ed) for goods, valued at EUR195 000 million, <strong>with</strong> the United K<strong>in</strong>gdomrecord<strong>in</strong>g the largest trade deficit<strong>in</strong> goods of EUR 135 000 million. Italy,Hungary and Slovakia recorded a narrow<strong>in</strong>gof their trade deficits for goodsbetween 2006 and 2007, while Austriamoved from a deficit to a surplus.The United States was by far most theimportant market for EU-27 exports ofgoods <strong>in</strong> 2007, account<strong>in</strong>g for 21.1 % ofall exports to non-member countries, amuch higher proportion than that forSwitzerland (7.5 %), which was the nextmost important market. However, as <strong>in</strong>2006, Ch<strong>in</strong>a was the pr<strong>in</strong>cipal sourceof imports of goods <strong>in</strong> 2007, its share ofextra-EU-27 imports reach<strong>in</strong>g 16.2 % <strong>in</strong>2007 compared <strong>with</strong> 12.7 % for the UnitedStates and 10.1 % for Russia.Mach<strong>in</strong>ery and transport equipment wasthe largest category of exports of goodsfrom the EU-27 to non-member countries<strong>in</strong> 2007 <strong>with</strong> a share of 43.8 %, andthis category also accounted for the largestshare of imports (29.1 %). Compared<strong>with</strong> five years earlier, the most notablechange <strong>in</strong> the structure of EU-27 extra-EU exports and imports was the <strong>in</strong>creasedshares accounted for by m<strong>in</strong>eralfuels, lubricants and related materials <strong>in</strong>both trade flows. It should be noted thatthese shares are calculated on the basisof the value of transactions, and as suchcomparisons over time reflect changes <strong>in</strong>quantity and price levels. Alongside thischange, the other ma<strong>in</strong> difference was thereduced share of mach<strong>in</strong>ery and transportequipment, particularly concern<strong>in</strong>gimports.386 EUROPE IN FIGURES — <strong>Eurostat</strong> <strong>yearbook</strong> <strong>2009</strong>
External trade 10Table 10.8: Ma<strong>in</strong> players for external trade(EUR 1 000 million)Exports Imports Trade balance1997 2002 2007 1997 2002 2007 1997 2002 2007EU-27 (1) : 892 1 240 : 937 1 426 : -45 -186EU-15 (2) 721 997 1 414 673 989 1 516 49 8 -102Norway 42 64 99 31 37 58 11 27 41Switzerland 67 93 126 67 89 118 0 4 8Canada 191 267 306 174 235 277 17 32 29Ch<strong>in</strong>a (exclud<strong>in</strong>g Hong Kong) 161 344 889 126 312 698 36 32 191Japan 371 441 521 299 357 454 72 84 67United States 606 733 848 792 1 271 1 472 -186 -538 -624(1) External trade flows <strong>with</strong> extra EU-27.(2) External trade flows <strong>with</strong> extra EU-15.Source: <strong>Eurostat</strong> (ext_lt_<strong>in</strong>tertrd)Figure 10.4: Ma<strong>in</strong> players for external trade, 2007(EUR 1 000 million)1 6001 2008004000EU-27 (1) EU-15 (2) United States Ch<strong>in</strong>a(exclud<strong>in</strong>gHong Kong)ExportsJapan Canada Switzerland NorwayImports(1) External trade flows <strong>with</strong> extra EU-27.(2) External trade flows <strong>with</strong> extra EU-15.Source: <strong>Eurostat</strong> (ext_lt_<strong>in</strong>tertrd)EUROPE IN FIGURES — <strong>Eurostat</strong> <strong>yearbook</strong> <strong>2009</strong>387
10 External tradeFigure 10.5: Shares <strong>in</strong> the world marketfor exports, 2006(% share of world exports)EU-27 (1)17.3%Figure 10.6: Shares <strong>in</strong> the world marketfor imports, 2006(% share of world imports)EU-27 (1)19.1%Rest of the world46.6%United States12.3%Rest of the world40.0%United States21.6%Canada4.6%Japan7.7%Ch<strong>in</strong>a (exclud<strong>in</strong>g HongKong)11.5%CanadaJapan3.9%6.5%Ch<strong>in</strong>a (exclud<strong>in</strong>g HongKong)8.9%(1) External trade flows <strong>with</strong> extra EU-27.Source: <strong>Eurostat</strong> (tet00018)(1) External trade flows <strong>with</strong> extra EU-27.Source: <strong>Eurostat</strong> (tet00018)Figure 10.7: Development of external trade, EU-27 (1)(EUR 1 000 million)1 5001001 0000500-10001999 2000 2001 2002 2003 2004 2005 2006 2007-200Balance (right-hand scale)Exports (left-hand scale)Imports (left-hand scale)(1) External trade flows <strong>with</strong> extra EU-27.Source: <strong>Eurostat</strong> (ext_lt_<strong>in</strong>tertrd)388 EUROPE IN FIGURES — <strong>Eurostat</strong> <strong>yearbook</strong> <strong>2009</strong>
External trade 10Table 10.9: External trade(EUR 1 000 million)2006-07growth rate2006-07growth rate(%) 2006 20072006 2007 (%) 2006 2007EU-27 (1) 1 159.3 1 239.9 7.0 1 351.7 1 426.0 5.5 -192.5 -186.1Euro area (2) 1 383.6 1 500.0 8.4 1 392.2 1 471.8 5.7 -8.6 28.2Belgium 292.2 315.3 7.9 280.3 301.7 7.6 11.9 13.6Bulgaria 11.8 13.5 14.6 15.4 21.9 41.9 -3.7 -8.4Czech Republic 75.6 89.3 18.2 74.2 86.0 15.9 1.4 3.3Denmark 73.7 75.5 2.4 68.1 72.9 7.0 5.6 2.6Germany 882.5 967.8 9.7 722.1 772.4 7.0 160.4 195.4Estonia 7.7 8.0 3.9 10.7 11.3 5.8 -3.0 -3.3Ireland 86.6 88.5 2.2 58.2 60.5 3.9 28.4 28.0Greece 16.5 17.2 4.1 50.7 55.6 9.8 -34.1 -38.4Spa<strong>in</strong> 170.2 175.9 3.3 261.8 271.9 3.8 -91.6 -96.0France 394.9 403.8 2.2 431.6 448.9 4.0 -36.7 -45.1Italy 332.0 358.6 8.0 352.5 368.1 4.4 -20.5 -9.5Cyprus 1.1 1.0 -3.8 5.5 6.3 13.9 -4.5 -5.3Latvia 4.9 6.1 23.7 9.2 11.2 21.7 -4.3 -5.1Lithuania 11.3 12.5 11.1 15.4 17.8 15.4 -4.2 -5.3Luxembourg 18.2 16.4 -10.3 21.2 20.0 -5.4 -2.9 -3.7Hungary 59.9 69.6 16.1 62.3 69.7 11.9 -2.4 -0.1Malta 2.1 2.1 0.5 3.2 3.2 0.3 -1.0 -1.1Netherlands 369.3 401.9 8.8 332.0 359.4 8.3 37.3 42.5Austria 108.9 119.4 9.6 109.3 119.0 8.9 -0.4 0.4Poland 88.2 102.3 15.9 101.1 120.9 19.5 -12.9 -18.7Portugal 34.5 37.5 8.8 53.1 57.0 7.4 -18.6 -19.5Romania 25.9 29.4 13.7 40.8 51.0 25.1 -14.9 -21.6Slovenia 18.5 22.0 18.7 19.2 23.0 19.8 -0.7 -1.1Slovakia 33.3 42.5 27.4 35.7 43.9 23.1 -2.4 -1.5F<strong>in</strong>land 61.5 65.7 6.8 55.3 59.6 7.9 6.2 6.1Sweden 117.7 123.4 4.8 101.6 110.4 8.7 16.1 13.0United K<strong>in</strong>gdom 357.3 320.3 -10.4 479.0 454.8 -5.0 -121.7 -134.6Iceland 2.8 3.5 26.1 4.8 4.9 1.9 -2.0 -1.4Norway 96.9 99.3 2.5 51.1 58.5 14.5 45.8 40.8Switzerland 117.5 125.5 6.8 112.7 117.6 4.4 4.9 7.9Canada 309.0 306.4 -0.8 278.7 277.4 -0.5 30.4 29.1Ch<strong>in</strong>a 771.7 888.6 15.1 630.3 697.5 10.7 141.4 191.0Japan 515.1 521.2 1.2 461.2 454.0 -1.6 53.9 67.2United States 825.9 848.3 2.7 1 528.4 1 471.8 -3.7 -702.4 -623.6(1) External trade flows <strong>with</strong> extra EU-27.(2) EA-13 <strong>in</strong>stead of EA-15; external trade flows <strong>with</strong> extra EA-13.Source: <strong>Eurostat</strong> (tet00002)Exports Imports BalanceEUROPE IN FIGURES — <strong>Eurostat</strong> <strong>yearbook</strong> <strong>2009</strong>389
10 External tradeTable 10.10: Contribution to extra EU-27 external trade, 2007ImportsExportsTrade balance(EUR 1 000million)Share of EU-27imports (%)(EUR 1 000million)Share of EU-27exports (%)(EUR 1 000million)EU-27 1 426.0 100.0 1 239.9 100.0 -186.1Euro area 1 052.5 73.8 958.5 77.3 -93.9Belgium 87.7 6.2 74.7 6.0 -13.1Bulgaria 9.1 0.6 5.3 0.4 -3.8Czech Republic 16.9 1.2 13.2 1.1 -3.7Denmark 19.4 1.4 22.5 1.8 3.1Germany 267.7 18.8 340.3 27.4 72.6Estonia 2.4 0.2 2.4 0.2 -0.1Ireland 18.3 1.3 32.4 2.6 14.1Greece 23.5 1.6 6.0 0.5 -17.4Spa<strong>in</strong> 105.3 7.4 52.9 4.3 -52.5France 138.0 9.7 141.1 11.4 3.1Italy 158.4 11.1 143.2 11.6 -15.2Cyprus 2.0 0.1 0.3 0.0 -1.7Latvia 2.5 0.2 1.7 0.1 -0.9Lithuania 5.6 0.4 4.4 0.4 -1.2Luxembourg 5.3 0.4 1.9 0.2 -3.4Hungary 21.3 1.5 14.7 1.2 -6.6Malta 0.9 0.1 1.1 0.1 0.2Netherlands 179.3 12.6 88.1 7.1 -91.2Austria 24.6 1.7 32.7 2.6 8.1Poland 32.3 2.3 21.6 1.7 -10.7Portugal 14.0 1.0 8.7 0.7 -5.3Romania 14.7 1.0 8.3 0.7 -6.5Slovenia 6.1 0.4 6.7 0.5 0.7Slovakia 11.3 0.8 5.6 0.5 -5.7F<strong>in</strong>land 21.4 1.5 28.4 2.3 6.9Sweden 32.2 2.3 47.8 3.9 15.5United K<strong>in</strong>gdom 205.7 14.4 134.0 10.8 -71.7Source: <strong>Eurostat</strong> (ext_lt_<strong>in</strong>tratrd)390 EUROPE IN FIGURES — <strong>Eurostat</strong> <strong>yearbook</strong> <strong>2009</strong>
External trade 10Table 10.11: Contribution to <strong>in</strong>tra EU-27 external trade, 2007ArrivalsDispatchesTrade balance(EUR 1 000million)Share of EU-27arrivals (%)(EUR 1 000million)Share of EU-27dispatches (%)(EUR 1 000million)EU-27 2 572.5 100.0 2 645.5 100.0 -Euro area 1 874.2 72.9 2 034.6 76.9 160.5Belgium 214.0 8.3 240.7 9.1 26.7Bulgaria 12.8 0.5 8.2 0.3 -4.6Czech Republic 69.1 2.7 76.2 2.9 7.1Denmark 53.5 2.1 53.0 2.0 -0.5Germany 504.7 19.6 627.5 23.7 122.8Estonia 8.9 0.3 5.6 0.2 -3.3Ireland 42.2 1.6 56.1 2.1 13.9Greece 32.2 1.3 11.2 0.4 -21.0Spa<strong>in</strong> 166.5 6.5 123.0 4.6 -43.5France 310.9 12.1 262.7 9.9 -48.2Italy 209.7 8.1 215.4 8.1 5.8Cyprus 4.3 0.2 0.7 0.0 -3.6Latvia 8.7 0.3 4.4 0.2 -4.3Lithuania 12.2 0.5 8.1 0.3 -4.1Luxembourg 14.7 0.6 14.5 0.5 -0.2Hungary 48.5 1.9 55.0 2.1 6.5Malta 2.3 0.1 1.1 0.0 -1.3Netherlands 180.2 7.0 313.8 11.9 133.6Austria 94.4 3.7 86.7 3.3 -7.7Poland 88.6 3.4 80.7 3.0 -8.0Portugal 43.0 1.7 28.8 1.1 -14.2Romania 36.3 1.4 21.1 0.8 -15.1Slovenia 17.0 0.7 15.2 0.6 -1.8Slovakia 32.6 1.3 36.8 1.4 4.2F<strong>in</strong>land 38.2 1.5 37.3 1.4 -0.9Sweden 78.2 3.0 75.6 2.9 -2.6United K<strong>in</strong>gdom 249.2 9.7 186.3 7.0 -62.9Source: <strong>Eurostat</strong> (ext_lt_<strong>in</strong>tratrd)EUROPE IN FIGURES — <strong>Eurostat</strong> <strong>yearbook</strong> <strong>2009</strong>391
10 External tradeFigure 10.8: Intra and extra EU-27 external trade, 2007(% share of total trade)100%75%50%25%0%EU-27Euro areaUnited K<strong>in</strong>gdomItalyBulgariaGreeceF<strong>in</strong>landMaltaSpa<strong>in</strong>NetherlandsGermanySwedenIrelandLithuaniaFranceCyprusRomaniaSloveniaIntra EU-27Extra EU-27DenmarkBelgiumHungaryEstoniaLatviaPolandAustriaPortugalLuxembourgSlovakiaCzech RepublicSource: <strong>Eurostat</strong> (ext_lt_<strong>in</strong>tratrd)Figure 10.9: Ma<strong>in</strong> trad<strong>in</strong>g partnersfor exports, EU-27, 2007(% share of extra EU-27 exports)United States21.1%Figure 10.10: Ma<strong>in</strong> trad<strong>in</strong>g partnersfor imports, EU-27, 2007(% share of extra EU-27 imports)Ch<strong>in</strong>a (exclud<strong>in</strong>g HongKong)16.2%Rest of the world47.2%Switzerland7.5%Rest of the world41.4%United States12.7%Norway3.5%Japan3.5%Turkey4.2%Russian Federation7.2%Ch<strong>in</strong>a (exclud<strong>in</strong>g HongKong)5.8%Turkey3.3%Switzerland5.4%Japan5.5%Norway5.4%Russian Federation10.1%Source: <strong>Eurostat</strong> (ext_lt_ma<strong>in</strong>eu)Source: <strong>Eurostat</strong> (ext_lt_ma<strong>in</strong>eu)392 EUROPE IN FIGURES — <strong>Eurostat</strong> <strong>yearbook</strong> <strong>2009</strong>
External trade 10Figure 10.11: Ma<strong>in</strong> exports, EU-27(% share of extra EU-27 exports)50403020100Mach<strong>in</strong>ery and Other manufacturedtransport equipment productsChemicals andrelated products,n.e.s.M<strong>in</strong>eral fuels,lubricants andrelated materialsFood, dr<strong>in</strong>ks andtobaccoRaw materials2002 2007Source: <strong>Eurostat</strong> (ext_lt_<strong>in</strong>tertrd)Figure 10.12: Ma<strong>in</strong> imports, EU-27(% share of extra EU-27 imports)50403020100Mach<strong>in</strong>ery and Other manufacturedtransport equipment productsM<strong>in</strong>eral fuels,lubricants andrelated materialsChemicals andrelated products,n.e.s.Food, dr<strong>in</strong>ks andtobaccoRaw materials2002 2007Source: <strong>Eurostat</strong> (ext_lt_<strong>in</strong>tertrd)EUROPE IN FIGURES — <strong>Eurostat</strong> <strong>yearbook</strong> <strong>2009</strong>393
TransportTransport plays a crucial role <strong>in</strong> an economy, transferr<strong>in</strong>g goods between the place ofproduction and consumption, as well as transport<strong>in</strong>g passengers for work or pleasure.However, key problems of congestion, quality of services (such as punctuality andconnectivity), affordability and environmental impact put economic development atrisk. Measures to address these concerns, among others, whilst ma<strong>in</strong>ta<strong>in</strong><strong>in</strong>g the EU’scompetitiveness, are at the heart of the EU transport policy White paper titled ‘<strong>Europe</strong>antransport policy for 2010: time to decide’ (1) , which was adopted <strong>in</strong> 2001. Thispolicy document rema<strong>in</strong>s the bedrock of the current EU susta<strong>in</strong>able transport policyand was supplemented <strong>in</strong> June 2006 by a mid-term review communication (2) ‘Keep<strong>Europe</strong> mov<strong>in</strong>g – susta<strong>in</strong>able mobility for our cont<strong>in</strong>ent’. Some of the key conclusionsof this communication were that each transport mode must be optimised to help ensurecompetitiveness and prosperity; all modes must become more environmentallyfriendly, safe and energy efficient; each mode should be used efficiently on its own and<strong>in</strong> comb<strong>in</strong>ation to achieve an optimal and susta<strong>in</strong>able utilisation of resources. Thecommunication proposed a wide range of implement<strong>in</strong>g measures that were largelydriven by evolv<strong>in</strong>g issues:• environmental commitments – such as those under the Kyoto Protocol, as well asair quality, noise pollution, and land use;• a greater focus on technology – this <strong>in</strong>cluded the encouragement of further researchand development <strong>in</strong>to areas such as <strong>in</strong>telligent transport systems (such asGalileo, SESAR, ERTMS) <strong>in</strong>volv<strong>in</strong>g communication, navigation and automation,eng<strong>in</strong>e technology that could improve fuel efficiency, and the promotion of alternativefuels. Other activities cited <strong>in</strong>cluded the modernisation of air traffic systems,improvements <strong>in</strong> safety and security, urban mobility and the decongestionof transport corridors, as well as the efficient use of different modes on their ownand <strong>in</strong> comb<strong>in</strong>ation;(1) COM(2001) 370 f<strong>in</strong>al; http://ec.europa.eu/transport/white_paper/<strong>in</strong>dex_en.htm.(2) COM(2006) 314 f<strong>in</strong>al; http://ec.europa.eu/transport/transport_policy_review/<strong>in</strong>dex_en.htm.EUROPE IN FIGURES — <strong>Eurostat</strong> <strong>yearbook</strong> <strong>2009</strong>395
11 Transport11.1 Modal breakdown• consolidation <strong>with</strong><strong>in</strong> the transportsector – especially <strong>in</strong> aviation andmaritime transport, but also <strong>with</strong> thecreation of large logistics enterprises<strong>with</strong> worldwide operations;• enlargement – allow<strong>in</strong>g the possibilityto expand trans-<strong>Europe</strong>an networksto corridors that are particularlysuitable for rail and waterbornetransport;• changes <strong>in</strong> the <strong>in</strong>ternational context– such as the threat of terrorism, orglobalisation that has affected tradeflows and <strong>in</strong>creased demand for <strong>in</strong>ternationaltransport services.The <strong>Europe</strong>an Commission has alreadystarted the launch of a range of actionplans on key transport policy issues, suchas a Green paper on urban transport, aroad charg<strong>in</strong>g Directive (3) , and a LogisticsAction plan (4) .<strong>Eurostat</strong>’s transport statistics describethe most important features of transport,not only <strong>in</strong> terms of the quantitiesof freight and numbers of passengers thatare moved each year, or the number ofvehicles and <strong>in</strong>frastructure that are used,but also the contribution of transportservices to the economy as a whole. Datacollection is supported by several legalacts oblig<strong>in</strong>g the Member States to reportstatistical data, as well as voluntary agreementsto supply additional data.IntroductionThe demand for <strong>in</strong>creased mobility from<strong>in</strong>dividuals and <strong>in</strong>creased flexibility andtimel<strong>in</strong>ess of delivery from enterpriseshas led to road transport becom<strong>in</strong>g thedom<strong>in</strong>ant mode of transport <strong>in</strong> the EU.The growth <strong>in</strong> road transport has had asignificant impact on road congestion,road safety, pollution and land use.One of the ma<strong>in</strong> challenges identifiedby the 2001 White paper was to addressthis imbalance <strong>in</strong> the development of thedifferent modes of transport. Specific actionslook<strong>in</strong>g to boost rail and maritimeconnections were foreseen and then established(the Marco Polo programmes).The Commission’s Intermodal FreightTransport policy was established to supportthe efficient ‘door to door’ movementof goods, us<strong>in</strong>g two or more modesof transport, <strong>in</strong> an <strong>in</strong>tegrated transportcha<strong>in</strong>. This policy recognises that eachmode of transport has its own advantageseither <strong>in</strong> terms of potential capacity, levelsof safety, flexibility, energy consumption,or environmental impact and, as such <strong>in</strong>termodaltransport allows each mode toplay its role <strong>in</strong> build<strong>in</strong>g transport cha<strong>in</strong>swhich overall are more efficient, cost effectiveand susta<strong>in</strong>able.The White paper also proposed the developmentof ‘Motorways of the Sea’ as a realcompetitive alternative to land transportand a legal framework for fund<strong>in</strong>g thiswork was secured <strong>in</strong> 2004.(3) Directive 2006/38/EC; http://ec.europa.eu/transport/road/policy/road_charg<strong>in</strong>g/charg<strong>in</strong>g_tolls_en.htm.(4) COM(2007) 606; http://ec.europa.eu/transport/logistics/freight_logistics_action_plan/<strong>in</strong>dex_en.htm.396 EUROPE IN FIGURES — <strong>Eurostat</strong> <strong>yearbook</strong> <strong>2009</strong>
Transport 11Def<strong>in</strong>itions and data availabilityDef<strong>in</strong>itions of terms used <strong>with</strong><strong>in</strong> transportstatistics are available <strong>in</strong> the ‘Glossaryfor Transport statistics – Third Edition’.Key def<strong>in</strong>itions <strong>in</strong>clude:• a passenger-kilometre is the unit ofmeasure represent<strong>in</strong>g the transportof one passenger by a given mode oftransport over one kilometre;• a tonne-kilometre is the unit ofmeasure represent<strong>in</strong>g the transport ofone tonne of goods by a given modeof transport over one kilometre;• rail and <strong>in</strong>land waterways movementsare recorded <strong>in</strong> each report<strong>in</strong>gcountry on national territory (‘territorialitypr<strong>in</strong>ciple’), regardless of thenationality of the vehicle or vessel;road statistics are based on all movements,<strong>in</strong> the registration country orabroad, of the vehicles registered <strong>in</strong>the report<strong>in</strong>g country (‘nationalitypr<strong>in</strong>ciple’);• <strong>in</strong>land passenger transport correspondsto road (buses and passengercars) and rail (<strong>in</strong>clud<strong>in</strong>g <strong>in</strong>ter-cityand urban rail transport), thus exclud<strong>in</strong>gair and water transport;• <strong>in</strong>land freight transport correspondsto road, rail, <strong>in</strong>land waterways andpipel<strong>in</strong>e transport, thus exclud<strong>in</strong>g airand sea transport.The modal split (of transport) <strong>in</strong>dicatesthe share of each mode of transport basedon passenger-kilometres (p-km) for passengertransport and tonne-kilometres(t-km) for goods (freight) transport, basedon movements on national territory, regardlessof the nationality of the vehicle.It should be noted that the data collectionmethodology is not harmonised at theEU level. As statistics on road and other<strong>in</strong>land modes are based on different pr<strong>in</strong>ciples,the <strong>figures</strong> of the smallest report<strong>in</strong>gcountries (for example, Luxembourgand Slovenia) may be mislead<strong>in</strong>g. Dataon the relative shares of <strong>in</strong>land freighttransport are annual and generally availablefor every year s<strong>in</strong>ce the early 1990s.Modes of transport <strong>in</strong>clude tra<strong>in</strong>, sea,<strong>in</strong>land waterways and air (for goods andpassengers), as well as passenger cars,powered two-wheelers, buses, coaches,trams and metros for passengers andpipel<strong>in</strong>es for goods. In practice, an analysisof the modal split may exclude certa<strong>in</strong>modes, for example, it may be limited to<strong>in</strong>land transport and therefore excludesea transport.Passenger cars are road motor vehicles,other than motor cycles, <strong>in</strong>tended for thecarriage of passengers and designed toseat no more than n<strong>in</strong>e persons (<strong>in</strong>clud<strong>in</strong>gthe driver). The term passenger cartherefore covers microcars (which needno permit to be driven), taxis, and hiredpassenger cars, provided that they havefewer than 10 seats; this category mayalso <strong>in</strong>clude pick-ups.Railways are l<strong>in</strong>es of communicationmade up by rail exclusively for the use ofrailway vehicles.EUROPE IN FIGURES — <strong>Eurostat</strong> <strong>yearbook</strong> <strong>2009</strong>397
11 TransportInland waterways (navigable) are stretchesof water, not part of the sea, over whichvessels of a carry<strong>in</strong>g capacity of not lessthan 50 tonnes can navigate when normallyloaded. This term covers bothnavigable rivers and lakes and navigablecanals. The length of rivers and canalsis measured <strong>in</strong> mid channel. The lengthof lakes and lagoons is measured alongthe shortest navigable route between themost distant po<strong>in</strong>ts to and from whichtransport operations are performed. Awaterway form<strong>in</strong>g a common frontier betweentwo countries is reported by both.Ma<strong>in</strong> f<strong>in</strong>d<strong>in</strong>gsA little over three quarters (76.7 %) of<strong>in</strong>land freight transport (exclud<strong>in</strong>g pipel<strong>in</strong>es)<strong>in</strong> the EU-27 was accounted for byroad transport <strong>in</strong> 2006. Less than onefifth (17.7 %) of <strong>in</strong>land freight transportwas by rail, <strong>with</strong> the rest (5.6 %) accountedfor by <strong>in</strong>land waterways. The dom<strong>in</strong>anceof freight transport by road wasreflected <strong>in</strong> the data for the majority ofMember States, the exceptions be<strong>in</strong>g Estoniaand Latvia where more than threefifths of <strong>in</strong>land freight was transported byrail <strong>in</strong> 2006. Inland waterways transportaccounted for one tenth of <strong>in</strong>land freighttransport <strong>in</strong> Romania, Germany and Belgium,while <strong>in</strong> the Netherlands its sharewas closer to one third.The ma<strong>in</strong> measure of the volume of passengertransport is the number of passenger-kilometrestravelled <strong>with</strong><strong>in</strong> the nationalterritory, which can be analysed bymode of transport. Some caution must beapplied <strong>in</strong> mak<strong>in</strong>g comparisons becauseof the coverage of national data. Nonetheless,car transport accounted for a sizablemajority of <strong>in</strong>land passenger transport(exclud<strong>in</strong>g motorbikes and other poweredtwo-wheelers) among all the MemberStates for which data are available (5) .The reliance on the car for <strong>in</strong>land passengertransport was particularly strong<strong>in</strong> Lithuania, the Netherlands and theUnited K<strong>in</strong>gdom, where it accounted forupwards of 87 % of all <strong>in</strong>land passengerkilometres.In Bulgaria around 30 % of<strong>in</strong>land passenger-kilometres were by bus,<strong>with</strong> shares over 20 % also recorded <strong>in</strong>Hungary, Estonia, Greece and Slovakia.Hungary, Romania and Austria reportedthe highest modal shares for railways(<strong>in</strong>clud<strong>in</strong>g also trams and undergroundrailways/metros), all over 10 %.It should be noted that the above analysisrefers only to <strong>in</strong>land transport: significantproportions of <strong>in</strong>ternational freightand passenger travel are accounted for bymaritime and air transport, and <strong>in</strong> somecountries national (domestic) maritimeand air transport may also be important.(5) Cyprus and Malta, not available.398 EUROPE IN FIGURES — <strong>Eurostat</strong> <strong>yearbook</strong> <strong>2009</strong>
Transport 11Table 11.1: Modal split of <strong>in</strong>land passenger and freight transport, 2006(% of total<strong>in</strong>land passenger-km) (1)(% of total <strong>in</strong>land freighttransport <strong>in</strong> tonne-km) (2)PassengercarsBusesRailways, tramsand metros Railways RoadsInlandwaterwaysEU-27 83.4 9.5 7.1 17.7 76.7 5.6Belgium 79.9 13.1 7.0 14.0 71.2 14.7Bulgaria 64.3 30.4 5.3 27.1 69.0 3.9Czech Republic 75.6 16.9 7.5 23.8 76.1 0.1Denmark 79.8 11.2 9.1 8.2 91.8 -Germany 85.7 6.5 7.8 21.4 65.9 12.8Estonia 76.0 22.0 2.0 65.3 34.7 0.0Ireland 76.1 18.8 5.1 1.2 98.8 -Greece 76.3 21.9 1.8 1.9 98.1 -Spa<strong>in</strong> 82.6 12.0 5.4 4.6 95.4 -France 85.3 5.3 9.4 15.7 80.9 3.4Italy 81.9 12.1 5.9 9.9 90.1 0.0Cyprus : : 0.0 - 100.0 -Latvia 76.2 18.2 5.6 61.0 39.0 0.0Lithuania 90.5 8.5 1.0 41.6 58.4 0.0Luxembourg 85.3 10.8 3.9 4.6 91.5 4.0Hungary 63.2 23.8 13.0 23.9 71.6 4.5Malta : : 0.0 - 100.0 -Netherlands 87.5 3.8 8.7 4.1 63.6 32.3Austria 79.4 10.3 10.3 33.8 63.2 3.0Poland 82.5 10.6 6.9 29.4 70.4 0.2Portugal 82.8 12.8 4.5 5.1 94.9 -Romania 74.0 15.6 10.5 19.4 70.5 10.0Slovenia 85.6 11.4 3.0 21.8 78.2 -Slovakia 72.7 21.2 6.1 30.9 68.8 0.3F<strong>in</strong>land 84.9 10.3 4.8 27.1 72.7 0.2Sweden 84.1 7.5 8.4 35.5 64.5 -United K<strong>in</strong>gdom 87.4 6.5 6.1 11.8 88.1 0.1Croatia 83.7 11.8 4.5 24.3 74.8 0.9FYR of Macedonia : : : 8.4 91.6 -Turkey 53.2 43.9 2.9 5.1 94.9 -Iceland 87.2 12.8 0.0 - 100.0 -Norway 88.0 7.3 4.8 14.7 85.3 -(1) Exclud<strong>in</strong>g powered two-wheelers; Bulgaria, Latvia and Romania, 2005; Turkey, 2004.(2) Exclud<strong>in</strong>g pipel<strong>in</strong>es; Iceland, 2005.Source: <strong>Eurostat</strong> (tsdtr210 and tsdtr220)EUROPE IN FIGURES — <strong>Eurostat</strong> <strong>yearbook</strong> <strong>2009</strong>399
11 Transport11.2 Passenger transportIntroductionEU transport policies have been designedboth for households and the bus<strong>in</strong>esscommunity, regardless of location,whether urban or rural. The recent midtermreview of the 2001 White papershed a spotlight on urban travel, reflect<strong>in</strong>gthe fact that ‘eighty per cent of <strong>Europe</strong>anslive <strong>in</strong> an urban environment’.The review po<strong>in</strong>ts to pick<strong>in</strong>g up on thebest-practice <strong>in</strong>itiatives used by a numberof cities regard<strong>in</strong>g ‘transport <strong>in</strong>frastructure,norm-sett<strong>in</strong>g, congestion and trafficmanagement, public transport services,<strong>in</strong>frastructure charg<strong>in</strong>g, urban plann<strong>in</strong>g,safety, security and cooperation <strong>with</strong>the surround<strong>in</strong>g region’. The Commissionpublished a Green paper (6) on a newculture for urban mobility <strong>in</strong> September2007 that looks to stimulate the adoptionof these best practices.Intra-urban transport is only one elementof passenger transport policy. Enlargementof the EU has opened up furtheropportunities for <strong>in</strong>ter-urban passengertravel by rail, road or airplane, which hasbeen and cont<strong>in</strong>ues to be strengthenedby improvements to the <strong>in</strong>frastructure(such as extensions of the high-speedrail l<strong>in</strong>ks or rais<strong>in</strong>g of airport capacity),by more competition and greater co-ord<strong>in</strong>ation(such as the ‘s<strong>in</strong>gle sky’ policy).The strengthen<strong>in</strong>g of passenger rightshas also made passengers more secureto enjoy the freedom to travel and workthroughout the EU. The recent mid-termreview underl<strong>in</strong>ed the po<strong>in</strong>t that rail andsea passengers should benefit from similarrights, and this was achieved for railpassengers <strong>with</strong> the adoption of the thirdrailway package <strong>in</strong> October 2007 (7) .Def<strong>in</strong>itions and data availabilityThe volume of <strong>in</strong>land passenger transportis def<strong>in</strong>ed as the ratio betweenpassenger-km (<strong>in</strong>land modes) and GDP(gross domestic product, cha<strong>in</strong>-l<strong>in</strong>kedvalues, at 2000 exchange rates), and <strong>with</strong><strong>in</strong>this subchapter is <strong>in</strong>dexed on 2000.It is based on transport movements bypassenger cars, buses and coaches, andtra<strong>in</strong>s on national territory, regardless ofthe nationality of the vehicle.Rail transport statistics are reported onthe basis of the ‘territoriality pr<strong>in</strong>ciple’.This means that each report<strong>in</strong>g countryreports the load<strong>in</strong>g / embarkation, unload<strong>in</strong>g/ disembarkation and move mentsof goods and passengers that take place <strong>in</strong>their national territory. For this reason,<strong>in</strong>dicators that use tonne-kilometres andpassenger-kilometre as units are generallyconsidered as the best measure forcomparisons between transport modesand countries, because the use of tonnesor passengers entails a high risk of doublecount<strong>in</strong>g, particularly <strong>in</strong> <strong>in</strong>ternationaltransport. A rail passenger is any person,exclud<strong>in</strong>g members of the tra<strong>in</strong> crew, whomakes a journey by rail. A rail passengerkilometreis a unit of measure represent<strong>in</strong>gthe transport of one rail passenger byrail over a distance of one kilometre. Railpassenger data are not available for Maltaand Cyprus as they do not have railways.Annual passenger transport statistics(<strong>in</strong>ternational and national breakdown)cover railway undertak<strong>in</strong>gs subject todetailed report<strong>in</strong>g only, while total annualpassenger statistics may <strong>in</strong>clude theundertak<strong>in</strong>gs under simplified report<strong>in</strong>gas well. Some countries apply detailed report<strong>in</strong>gto all railway undertak<strong>in</strong>gs and(6) COM(2007) 551 f<strong>in</strong>al; http://ec.europa.eu/transport/clean/green_paper_urban_transport/<strong>in</strong>dex_en.htm.(7) http://ec.europa.eu/transport/rail/packages/2007_en.htm.400 EUROPE IN FIGURES — <strong>Eurostat</strong> <strong>yearbook</strong> <strong>2009</strong>
Transport 11<strong>in</strong> the case of these countries the totalpassenger transport is equal to the sumof <strong>in</strong>ternational and national passengertransport.Maritime transport data are available formost of the period from 2001 onwards,although some Member States have provideddata for the period s<strong>in</strong>ce 1997. Maritimetransport data are not transmittedto <strong>Eurostat</strong> by the Czech Republic, Luxembourg,Hungary, Austria and Slovakiaas they have no maritime traffic. A merchantship is a ship designed for the carriageof goods, transport of passengers orspecially fitted out for a specific commercialduty. A sea passenger is any personthat makes a sea journey on a merchantship. Service staff assigned to merchantships are not regarded as passengers.Non-fare pay<strong>in</strong>g crew members travell<strong>in</strong>gbut not assigned and <strong>in</strong>fants <strong>in</strong> armsare excluded.Air transport statistics concern nationaland <strong>in</strong>ternational transport. Passengertransport is measured by the number ofpassengers on board, passengers carriedand passenger commercial air flights, <strong>in</strong>all cases separat<strong>in</strong>g arrivals and departures.Statistics on <strong>in</strong>dividual routes provide<strong>in</strong>formation on seats available, aga<strong>in</strong>separat<strong>in</strong>g arrivals from departures. Thedata are presented <strong>with</strong> monthly, quarterlyand annual frequencies. Annualdata are available for the EU-27 MemberStates for most of the period from 2003onwards. Air passengers carried relate toall passengers on a particular flight (<strong>with</strong>one flight number) counted once only andnot repeatedly on each <strong>in</strong>dividual stage ofthat flight. This <strong>in</strong>cludes all revenue andnon-revenue passengers whose journeybeg<strong>in</strong>s or term<strong>in</strong>ates at the report<strong>in</strong>g airportand transfer passengers jo<strong>in</strong><strong>in</strong>g orleav<strong>in</strong>g the flight at the report<strong>in</strong>g airport;but excludes direct transit passengers.Fatalities caused by road accidents <strong>in</strong>cludedrivers and passengers of motorisedvehicles and pedal cycles as well as pedestrians,killed <strong>with</strong><strong>in</strong> 30 days from the dayof the accident. For Member States notus<strong>in</strong>g this def<strong>in</strong>ition, corrective factorswere applied.Ma<strong>in</strong> f<strong>in</strong>d<strong>in</strong>gsIn the vast majority of Member States,GDP grew faster between 1996 and 2006than the volume of <strong>in</strong>land passengertransport. The most notable exceptionwas Lithuania which, relative to GDP,recorded considerable growth <strong>in</strong> <strong>in</strong>landpassenger transport volumes <strong>in</strong> 2004 and2005, and to a lesser extent <strong>in</strong> 2006. Slovakiaand Hungary both recorded GDPgrow<strong>in</strong>g considerably faster than thevolume of <strong>in</strong>land passenger transport between1996 and 2006.The average distance travelled on railways(national and <strong>in</strong>ternational travel) per <strong>in</strong>habitant,was higher <strong>in</strong> France, Denmark,Sweden and Austria than elsewhere <strong>in</strong>the EU-27 <strong>in</strong> 2006, averag<strong>in</strong>g 1 000 kilometresor more per year per person <strong>in</strong>each of these Member States. In terms of<strong>in</strong>ternational travel, the average distancetravelled on railways per <strong>in</strong>habitant washighest <strong>in</strong> Luxembourg and Austria,reflect<strong>in</strong>g, for example, the number of<strong>in</strong>ternational borders, the importanceof <strong>in</strong>ternational commuters <strong>with</strong><strong>in</strong> theworkforce, the relative proximity of capitalsor other cities to <strong>in</strong>ternational borders,the access to high-speed networkrail l<strong>in</strong>ks, or their position on major <strong>in</strong>ternationaltransport corridors.EUROPE IN FIGURES — <strong>Eurostat</strong> <strong>yearbook</strong> <strong>2009</strong>401
11 TransportAlmost 800 million passengers were carriedby air <strong>in</strong> 2007 <strong>in</strong> the EU-27. The largestnumber of passengers carried was reportedby the United K<strong>in</strong>gdom, over 217million, equivalent to 3.6 passengers carriedper <strong>in</strong>habitant. Relative to the size ofthe population the largest numbers of airpassengers carried were reported by theislands of Cyprus and Malta, closely followedby Ireland.In 2007, London’s Heathrow airport rema<strong>in</strong>edthe busiest <strong>in</strong> terms of passengernumbers (about 68 million), followed byParis’ Charles de Gaulle airport, Frankfurtand Madrid’s Barajas airport – all<strong>with</strong> over 50 million passengers. Madrid’sBarajas airport stands out from otherlead<strong>in</strong>g airports <strong>in</strong> that national (domestic)flights accounted for a large proportionof the passengers carried, some 44 %<strong>in</strong> comparison to around 10 % for theothers. Relatively large proportions ofpassengers were also on national flightsto and from Barcelona, Roma’s Fiumic<strong>in</strong>oairport, and Paris’ Orly airport.Ports <strong>in</strong> the EU-27 handled 398 million (8)maritime passengers <strong>in</strong> 2006: a shorttime-series for the EU-25 shows thatpassenger numbers <strong>in</strong>creased by 2.8 %<strong>in</strong> 2006 compared <strong>with</strong> the year before,partially recoup<strong>in</strong>g the 4.9 % fall <strong>in</strong> 2005.Greek and Italian ports handled morepassengers than the ports <strong>in</strong> any otherMember State, followed by Danish andSwedish ports. Relative to the size of population,the largest numbers of maritimepassengers were recorded <strong>in</strong> Denmarkand Greece, both over 8 passengers per<strong>in</strong>habitant, followed by Estonia, Sweden,F<strong>in</strong>land and Italy.Road fatalities <strong>in</strong> the EU-27 fell sharplybetween 1996 and 2006, from 59 357deaths to 42 955 deaths, a fall of over25 %. In 2006 the road fatality rate, expressedas the number of deaths per million<strong>in</strong>habitants averaged 87 <strong>in</strong> the EU-27.There were nevertheless stark differencesbetween countries, <strong>with</strong> the highest rates<strong>in</strong> the Baltic Member States, all exceed<strong>in</strong>g150 deaths per million <strong>in</strong>habitants,and Greece marg<strong>in</strong>ally below this level.In contrast, Sweden and the Netherlandsrecorded fewer than 50 deaths <strong>in</strong> road accidentsper million <strong>in</strong>habitants, <strong>with</strong> onlyMalta record<strong>in</strong>g a lower rate (27).Around 2 600 people were victims (seriously<strong>in</strong>jured or killed) of railway accidents<strong>in</strong> the EU-27 <strong>in</strong> 2007, <strong>with</strong> slightlymore persons killed than seriously <strong>in</strong>jured.There was an <strong>in</strong>crease of around2 % <strong>in</strong> the number of victims between2006 and 2007, follow<strong>in</strong>g on from fallsof 23 % the previous year, and 6 % theyear before that; it should be noted thatthe number of victims <strong>in</strong> any particularyear can be greatly <strong>in</strong>fluenced by a smallnumber of major <strong>in</strong>cidents. Of the totalnumber of victims seriously <strong>in</strong>jured orkilled <strong>in</strong> railway accidents <strong>in</strong> the EU-27<strong>in</strong> 2007, less than one fifth (18 %) were eithertra<strong>in</strong> passengers or railway employees,and when restricted to victims thatwere killed, just 7 % were passengers orrailway employees. Approximately twothirds (64 %) of the lives lost <strong>in</strong> rail accidentswere from <strong>in</strong>cidents <strong>in</strong>volv<strong>in</strong>groll<strong>in</strong>g stock <strong>in</strong> motion, <strong>with</strong> just overa quarter (28 %) from <strong>in</strong>cidents at levelcross<strong>in</strong>gs.The highest numbers of rail fatalities<strong>with</strong><strong>in</strong> the EU-27 <strong>in</strong> 2007 occurred<strong>in</strong> Poland (350) and Germany (200).(8) The total number of maritime passengers <strong>in</strong>cludes passengers who have been double-counted, once when embark<strong>in</strong>gand then when disembark<strong>in</strong>g. The double count<strong>in</strong>g arises when both ports of embarkation and disembarkation reportdata to <strong>Eurostat</strong>. This is quite common for the maritime transport of passengers, which is a short distance activity,compared <strong>with</strong> the seaborne transport of goods. Indeed, there is no significant difference between the number ofpassengers embark<strong>in</strong>g and disembark<strong>in</strong>g at an aggregated level, as most transport corresponds to ma<strong>in</strong> national and<strong>in</strong>tra-EEA ferry connections.402 EUROPE IN FIGURES — <strong>Eurostat</strong> <strong>yearbook</strong> <strong>2009</strong>
Transport 11Table 11.2: Volume of <strong>in</strong>land passenger transport (1)(<strong>in</strong>dex of <strong>in</strong>land passenger transport volume relative to GDP (2000=100))1996 1997 1998 1999 2000 2001 2002 2003 2004 2005 2006EU-27 : : : : 100.0 : 99.8 : : 96.5 94.9Belgium 104.8 102.6 104.3 102.6 100.0 101.3 101.9 102.5 101.6 98.0 96.8Bulgaria : : : : 100.0 98.2 99.8 92.6 86.9 84.9 :Czech Republic 97.9 98.2 100.0 100.6 100.0 98.6 96.9 95.5 90.5 87.4 82.2Denmark 108.1 106.7 105.5 104.2 100.0 98.0 97.7 98.0 98.2 96.8 95.3Germany 107.2 105.4 104.6 104.7 100.0 100.9 101.4 101.1 101.4 99.7 98.2Estonia : : : : : : : : : : :Ireland 117.7 113.9 110.7 105.0 100.0 98.5 96.1 95.4 94.3 92.6 93.4Greece 89.5 91.3 92.8 95.6 100.0 100.7 102.0 100.2 99.9 100.8 100.8Spa<strong>in</strong> 102.4 101.5 101.6 102.3 100.0 98.4 97.2 95.8 96.0 94.5 91.1France 105.1 104.4 103.8 103.3 100.0 101.6 101.6 101.0 98.8 96.2 94.2Italy 95.4 95.0 96.4 95.5 100.0 97.4 96.4 96.4 96.1 92.8 91.7Cyprus : : : : : : : : : : :Latvia : : : : 100.0 : 99.8 : : 133.0 :Lithuania : : : : 100.0 : 93.3 98.8 120.2 145.4 151.3Luxembourg 114.1 110.0 105.3 97.5 100.0 101.3 99.8 98.1 95.1 93.7 91.3Hungary 116.6 111.1 106.1 103.6 100.0 96.3 93.2 89.5 85.1 79.9 77.0Malta : : : : : : : : : : :Netherlands 110.5 109.4 106.0 103.8 100.0 98.5 99.8 99.5 100.5 97.6 94.7Austria 109.8 106.6 104.1 102.3 100.0 100.0 99.6 100.0 98.5 96.9 95.4Poland 104.5 103.0 103.8 100.3 100.0 101.5 103.1 101.3 99.6 102.2 104.5Portugal 95.7 97.7 97.9 99.5 100.0 99.8 102.1 105.4 107.3 110.7 112.0Romania : : : : 100.0 95.6 91.6 93.0 88.3 89.1 87.1Slovenia 110.3 111.2 105.1 105.4 100.0 98.5 96.8 94.8 92.4 89.9 86.7Slovakia 102.9 95.0 89.9 93.1 100.0 96.4 94.1 88.3 81.9 79.3 74.4F<strong>in</strong>land 112.4 108.7 105.3 103.6 100.0 99.1 99.5 99.5 97.7 96.4 92.7Sweden 109.6 107.4 104.4 102.8 100.0 99.6 99.6 99.5 95.8 93.1 89.7United K<strong>in</strong>gdom 98.1 108.4 105.8 104.0 100.0 99.7 100.8 97.7 95.7 93.7 91.7Croatia : : : : 100.0 101.2 99.7 96.9 95.4 93.3 96.8FYR of Macedonia : : : : 100.0 100.0 103.6 107.8 : 104.8 :Turkey 102.5 : : 108.1 100.0 100.6 : 93.5 89.9 : :Iceland 89.2 90.2 89.9 89.8 100.0 103.7 106.5 107.0 102.5 101.9 102.7Norway 109.5 103.8 102.9 102.1 100.0 99.8 100.2 101.1 98.4 97.2 95.5(1) Break <strong>in</strong> series: Hungary and the United K<strong>in</strong>gdom, 1996; Italy, 2000, the Netherlands, 2003.Source: <strong>Eurostat</strong> (tsien070)EUROPE IN FIGURES — <strong>Eurostat</strong> <strong>yearbook</strong> <strong>2009</strong>403
11 TransportTable 11.3: Rail passenger transportRail passenger transport(million passenger-km)Rail passenger transport(passenger-kmper <strong>in</strong>habitant)Rail accidents(number ofpersons)SeriouslyNational International National International Killed<strong>in</strong>jured2005 2006 2005 2006 2005 2006 2005 2006 2006 2007 2006 2007EU-27 : 361 305 : 21 149 : 733 : 43 1 324 1 374 1 236 1 193Euro area 244 626 254 062 16 652 16 962 782 807 53 54 626 652 607 555Belgium 7 771 8 190 740 774 744 779 71 74 20 37 28 48Bulgaria : 2 366 : 45 : 307 : 6 68 27 55 33Czech Republic 6 285 6 564 381 358 615 640 37 35 52 25 89 101Denmark 5 433 5 531 322 359 1 004 1 019 60 66 14 10 10 12Germany 71 643 75 263 3 300 3 472 868 913 40 42 186 200 196 199Estonia 224 231 25 26 166 172 19 19 16 14 21 19Ireland 1 654 1 872 127 0 403 445 31 0 0 6 0 1Greece 1 804 1 748 50 63 163 157 5 6 39 18 51 38Spa<strong>in</strong> 19 075 20 260 734 714 443 463 17 16 65 75 47 34France 69 066 72 359 7 821 7 476 1 103 1 149 125 119 88 80 52 46Italy 43 889 43 712 2 255 2 726 751 744 39 46 83 71 85 49Cyprus - - - - - - - - - - - -Latvia 800 893 89 93 347 389 39 41 30 28 33 17Lithuania 259 246 21 22 76 72 6 6 49 34 23 11Luxembourg 203 219 64 79 440 467 139 168 2 0 15 0Hungary 9 340 9 190 374 334 925 912 37 33 65 59 98 92Malta - - - - - - - - - - - -Netherlands 14 752 15 445 231 251 905 946 14 15 16 20 15 10Austria 6 948 7 051 1 147 1 211 847 853 140 147 43 52 61 63Poland 17 331 17 675 552 565 454 463 14 15 277 350 225 271Portugal 3 753 3 821 57 55 356 362 5 5 53 58 33 34Romania 7 816 7 902 144 164 361 366 7 8 12 36 2 0Slovenia 666 675 50 48 333 337 25 24 9 17 11 30Slovakia 2 039 2 043 143 170 379 379 27 32 63 57 32 36F<strong>in</strong>land 3 402 3 447 76 93 650 656 15 18 22 18 13 3Sweden 8 339 9 037 571 580 925 999 63 64 19 25 16 15United K<strong>in</strong>gdom 42 981 45 565 1 434 1 472 716 754 24 24 33 57 25 31Croatia 1 161 1 257 66 65 261 283 15 15 36 27 45 25Turkey 4 977 5 201 59 76 70 72 1 1 111 108 96 204Liechtenste<strong>in</strong> : : : : : : : : 0 0 0 0Norway 2 671 2 779 39 41 580 599 8 9 1 2 4 3Source: <strong>Eurostat</strong> (rail_pa_typepkm, tps00001 and rail_ac_catvict)404 EUROPE IN FIGURES — <strong>Eurostat</strong> <strong>yearbook</strong> <strong>2009</strong>
Transport 11Figure 11.1: Rail passenger transport, 2006 (1)(passenger-km per <strong>in</strong>habitant)1 2003008002004001000EU-27Euro areaBelgiumBulgariaCzech RepublicDenmarkGermanyEstoniaIrelandGreeceSpa<strong>in</strong>FranceItalyLatviaLithuaniaLuxembourgHungaryNetherlandsAustriaPolandPortugalRomaniaSloveniaSlovakiaF<strong>in</strong>landSwedenNational, left-hand axisInternational, right-hand axisUnited K<strong>in</strong>gdomCroatiaTurkeyNorway0(1) Cyprus, Malta and Liechtenste<strong>in</strong>, not applicable.Source: <strong>Eurostat</strong> (rail_pa_typepkm and tps00001)Figure 11.2: Top 15 airports, passengers carried (embarked and disembarked), EU-27, 2007(million passengers)London Heathrow (UK)Paris Charles-de-Gaulle (FR)Frankfurt (DE)Madrid Barajas (ES)Amsterdam Schiphol (NL)London Gatwick (UK)München F.J. Strauss (DE)Barcelona (ES)Roma Fiumic<strong>in</strong>o (IT)Paris Orly (FR)London Stansted (UK)Milano Malpensa (IT)Dubl<strong>in</strong> (IE)Palma de Mallorca (ES)Manchester (UK)Source: <strong>Eurostat</strong> (avia_paoa)0 25 50 75InternationalNationalEUROPE IN FIGURES — <strong>Eurostat</strong> <strong>yearbook</strong> <strong>2009</strong>405
11 TransportTable 11.4: Air and sea passenger transport (1)Air passengers, 2007 (2) Maritime passengers, 2006(passengers per(passengers per(1 000)<strong>in</strong>habitant) (1 000)<strong>in</strong>habitant)EU-27 (2) 792 636 1.6 397 550 0.8Belgium 20 805 2.0 891 0.1Bulgaria 6 071 0.8 15 0.0Czech Republic 13 098 1.3 - -Denmark 24 042 4.4 48 145 8.9Germany 163 844 2.0 29 256 0.4Estonia 1 723 1.3 6 691 5.0Ireland 29 840 6.9 3 207 0.8Greece 34 786 3.1 90 402 8.1Spa<strong>in</strong> 163 523 3.7 22 167 0.5France 120 034 1.9 26 402 0.4Italy 106 294 1.8 85 984 1.5Cyprus 7 004 9.0 182 0.2Latvia 3 156 1.4 217 0.1Lithuania 2 196 0.6 190 0.1Luxembourg 1 634 3.4 - -Hungary 8 580 0.9 - -Malta 2 971 7.3 218 0.5Netherlands 50 501 3.1 2 127 0.1Austria 22 926 2.8 - -Poland 17 120 0.4 1 737 0.0Portugal 24 324 2.3 686 0.1Romania 6 909 0.3 : :Slovenia 1 504 0.7 30 0.0Slovakia 2 232 0.4 - -F<strong>in</strong>land 14 465 2.7 16 739 3.2Sweden 26 967 3.0 32 334 3.6United K<strong>in</strong>gdom 217 288 3.6 29 930 0.5Croatia : : 23 061 5.2Iceland 2 278 7.6 433 1.4Norway 26 386 5.6 6 280 1.4Switzerland 34 538 4.6 - -(1) For air: aggregates exclude the double-count<strong>in</strong>g impact of passengers fly<strong>in</strong>g between countries belong<strong>in</strong>g to the same aggregate.For maritime: <strong>figures</strong> refer to the number of passengers ‘handled <strong>in</strong> ports’ (i.e. the sum of passengers embarked and then disembarked<strong>in</strong> ports); if both the port of embarkation and disembarkation report data to <strong>Eurostat</strong>, then these passengers are counted twice.(2) Total passengers carried (arrivals and departures for national and <strong>in</strong>ternational); Iceland, 2006.Source: <strong>Eurostat</strong> (ttr00012 and mar_pa_aa)406 EUROPE IN FIGURES — <strong>Eurostat</strong> <strong>yearbook</strong> <strong>2009</strong>
Transport 11Figure 11.3: People killed <strong>in</strong> road accidents, 2006(persons killed per million <strong>in</strong>habitants)3002001000EU-27LithuaniaLatviaEstoniaGreecePolandBulgariaSloveniaHungaryRomaniaCyprusSlovakiaCzech RepublicBelgiumItalySpa<strong>in</strong>PortugalAustriaIrelandLuxembourgFranceF<strong>in</strong>landGermanyDenmarkUnited K<strong>in</strong>gdomSwedenNetherlandsMaltaSource: <strong>Eurostat</strong> (tsdtr420), <strong>Europe</strong>an Commission CARE database (Community Database on Road Accidents)Table 11.5: Rail accidents by type of victim and accident, EU-27, 2007 (1)(number of persons)TotalPassengersRailwayemployeesOthersSeriouslySeriouslySeriouslySeriouslyKilled <strong>in</strong>jured Killed <strong>in</strong>jured Killed <strong>in</strong>jured Killed <strong>in</strong>juredTotal 1 374 1 193 65 262 38 99 1 271 832Collisions (exclud<strong>in</strong>g81 115 2 20 5 29 74 66level-cross<strong>in</strong>g accidents)Derailments 5 18 2 14 3 4 0 0Accidents <strong>in</strong>volv<strong>in</strong>g level-cross<strong>in</strong>gs 381 403 6 32 2 12 373 359Accidents to persons caused 882 532 45 105 27 37 810 390by roll<strong>in</strong>g stock <strong>in</strong> motionFire <strong>in</strong> roll<strong>in</strong>g stock 0 0 0 0 0 0 0 0Others 25 117 10 91 1 12 14 14(1) Slightly <strong>in</strong>jured persons are not <strong>in</strong>cluded <strong>in</strong> rail accident statistics; Cyprus and Malta, not applicable.Source: <strong>Eurostat</strong> (rail_ac_catvict)EUROPE IN FIGURES — <strong>Eurostat</strong> <strong>yearbook</strong> <strong>2009</strong>407
11 Transport11.3 Freight transportIntroductionThe ability to move goods safely, quicklyand cost-efficiently to market is importantfor <strong>in</strong>ternational trade, nationaldistributive trades, and economic development.Stra<strong>in</strong>s on <strong>in</strong>frastructure,demonstrated by congestion and delays,as well as the constra<strong>in</strong>ts of disparatestandards, technical barriers, poor <strong>in</strong>teroperabilityand governance all impact oneconomic development.The EU has already taken a numberof steps to improve freight transportthroughout the EU, but the mid-term reviewof the 2001 White paper specifiedfurther actions. The package of measuresbe<strong>in</strong>g proposed by the <strong>Europe</strong>an Commissionconcern:• a freight transport logistics actionplan: this covers, among other ideas,e-freight and <strong>in</strong>telligent transportsystems, the promotion of <strong>in</strong>teroperabilityacross modes, s<strong>in</strong>gle transportdocuments and the removal of regulatoryobstacles;• a rail network giv<strong>in</strong>g priority tofreight (9) : ideas be<strong>in</strong>g proposed <strong>in</strong>cludethe creation of freight corridorstructures to measure service quality,improvement of the <strong>in</strong>frastructure ofexist<strong>in</strong>g freight corridors, the <strong>in</strong>troductionof harmonised rules for theallocation of tra<strong>in</strong> paths, the developmentof priority rules <strong>in</strong> the case oftraffic disturbance, and the improvementof term<strong>in</strong>al and marshall<strong>in</strong>gyard capacities;• a ports policy: ideas be<strong>in</strong>g proposed<strong>in</strong>clude several that might be groupedunder ‘modernisation’, such as thesimplification of procedures for shortseashipp<strong>in</strong>g, an e-maritime approachto adm<strong>in</strong>istration, and improvedport equipment, as well as the expansionof capacity whilst respect<strong>in</strong>g theenvironment;• a maritime and short-sea shipp<strong>in</strong>gpolicy (10) : challenges faced <strong>in</strong>clude reduc<strong>in</strong>gbureaucracy, improv<strong>in</strong>g promotionand market<strong>in</strong>g, ensur<strong>in</strong>g theavailability of suitable vessels, provid<strong>in</strong>gadequate tra<strong>in</strong><strong>in</strong>g, the availabilityof good quality h<strong>in</strong>terland connections,and establish<strong>in</strong>g <strong>in</strong>tegrated <strong>in</strong>formationsystems.Def<strong>in</strong>itions and data availabilityWeight transported by rail and <strong>in</strong>landwaterways is the gross-gross weight ofgoods. This <strong>in</strong>cludes the total weight ofthe goods, all packag<strong>in</strong>g, and tare-weightof the conta<strong>in</strong>er, swap-body and palletsconta<strong>in</strong><strong>in</strong>g goods. In the case of rail, italso <strong>in</strong>cludes road goods vehicles carriedby rail. The tare-weight is the weight of atransport unit before any cargo is loaded;when the tare-weight is excluded, theweight is the gross weight. The weightmeasured for sea and road freight transportis the gross weight.(9) COM(2007) 608.(10) Commission Staff Work<strong>in</strong>g Document SEC(2007) 1367.408 EUROPE IN FIGURES — <strong>Eurostat</strong> <strong>yearbook</strong> <strong>2009</strong>
Transport 11Goods loaded are those goods placed ona road vehicle/railway vehicle/merchantship and dispatched by road/rail/sea. Unlike<strong>in</strong> road and <strong>in</strong>land waterway transport,transhipments from one railwayvehicle directly to another and change oftractive vehicle are not regarded as unload<strong>in</strong>g/load<strong>in</strong>g;however, if the goodsare unloaded from one railway vehicleto another railway vehicle, this is consideredas a break of the journey. Goods unloadedare those goods taken off a roadvehicle/railway vehicle/merchant ship.Road freight transport statistics are reportedby Member States for vehiclesregistered <strong>in</strong> their country. On the basisof <strong>in</strong>formation on the report<strong>in</strong>g country,country of load<strong>in</strong>g and country of unload<strong>in</strong>gof a journey, five types of operationsare derived:• national transport;• <strong>in</strong>ternational transport – goods loaded<strong>in</strong> the report<strong>in</strong>g country;• <strong>in</strong>ternational transport – goods unloaded<strong>in</strong> the report<strong>in</strong>g country;• <strong>in</strong>ternational transport – cross-trade(transport between two countries by avehicle registered <strong>in</strong> a third country);• <strong>in</strong>ternational transport – cabotage(transport <strong>in</strong>side one country by a vehicleregistered <strong>in</strong> another country).Rail freight data are provided to <strong>Eurostat</strong><strong>in</strong> l<strong>in</strong>e <strong>with</strong> Regulation 91/2003; this Regulationhas been implemented from 2004.Whereas the quarterly data concern railwayenterprises under detailed report<strong>in</strong>g(usually large ones (11) ), annual data coverall enterprises. Rail freight data are notavailable for Malta and Cyprus as they donot have railways. Switzerland will providerailway statistics start<strong>in</strong>g from 2008as a reference year, while Iceland has norailways.Maritime transport data are available formost of the period from 2001 onwards,although some Member States have provideddata for the period s<strong>in</strong>ce 1997. Maritimetransport data are not transmittedto <strong>Eurostat</strong> by the Czech Republic, Luxembourg,Hungary, Austria and Slovakiaas they have no maritime ports.Air freight and mail transport statisticsare broken down by freight and mail onboard (arrivals, departures and total),freight and mail loaded and unloadedand all-freight and mail commercial airflights (arrivals, departures and total).The data are presented <strong>with</strong> monthly,quarterly and annual frequencies. Annualdata are available for most of theEU-27 Member States for the period from2003, <strong>with</strong> a majority also provid<strong>in</strong>g datafor 2001 and 2002, while some MemberStates have provided data back to 1993.The volume of <strong>in</strong>land freight transportis def<strong>in</strong>ed as the ratio between tonnekm(<strong>in</strong>land modes) and GDP (gross domesticproduct, cha<strong>in</strong>-l<strong>in</strong>ked values, at2000 exchange rates), and <strong>with</strong><strong>in</strong> thissubchapter is <strong>in</strong>dexed on 2000. Rail and<strong>in</strong>land waterways transport are basedon movements on national territory, regardlessof the nationality of the vehicleor vessel. Road transport is based on allmovements of vehicles registered <strong>in</strong> thereport<strong>in</strong>g country.(11) Countries may cover all railway undertak<strong>in</strong>gs operat<strong>in</strong>g on their national territory <strong>with</strong> detailed report<strong>in</strong>g only(irrespective of the undertak<strong>in</strong>g’s transport performance). In this case, quarterly data are comparable <strong>with</strong> annual ones.EUROPE IN FIGURES — <strong>Eurostat</strong> <strong>yearbook</strong> <strong>2009</strong>409
11 TransportMa<strong>in</strong> f<strong>in</strong>d<strong>in</strong>gsThe volume of <strong>in</strong>land freight transport<strong>in</strong> the EU-27 has changed roughly <strong>in</strong> l<strong>in</strong>e<strong>with</strong> the change <strong>in</strong> GDP s<strong>in</strong>ce 1996. Relativeto growth <strong>in</strong> GDP, Portugal recordedthe most dramatic growth <strong>in</strong> the volumeof <strong>in</strong>land freight transport dur<strong>in</strong>g thisperiod, followed by Spa<strong>in</strong>, Bulgaria, Estoniaand Ireland, while Romania recordedeven stronger growth dur<strong>in</strong>g the periodfrom 1999 to 2006. In contrast, thechange <strong>in</strong> GDP exceeded the change <strong>in</strong>the volume of <strong>in</strong>land freight transport bythe greatest extent <strong>in</strong> Slovakia, followedby Cyprus and Denmark.Estonia and Latvia were the only MemberStates where a greater volume of freightwas transported by rail than by road,while Belgium and the Netherlands werethe only Member States where a greatervolume of freight was transported by<strong>in</strong>land waterways than by rail. Relativeto the size of the population, the greatestvolume of road freight transport wasreported by Luxembourg, over 18 000tonne-km per <strong>in</strong>habitant, more than threetimes the next highest volume which wasrecorded by Slovenia. In both cases, themajority of road freight was performedoutside the borders of these countries butby vehicles registered <strong>in</strong> them.Less than 5 % of air freight and mailtransport is national, totall<strong>in</strong>g 579 470tonnes <strong>in</strong> 2007 <strong>in</strong> the EU-27, <strong>with</strong> Franceaccount<strong>in</strong>g for the largest share. In total,<strong>in</strong>clud<strong>in</strong>g national and <strong>in</strong>ternationaltransport, 3.4 million tonnes of air freightwas carried through German airports <strong>in</strong>2007. Some of the smaller Member Statesare relatively specialised <strong>in</strong> air freight,notably all of the Benelux Member States,particularly Luxembourg.In 2006, 3 834 million tonnes of goodswere handled <strong>in</strong> EU-27 maritime ports(3.2 % higher than <strong>in</strong> 2005). With 584million tonnes, the United K<strong>in</strong>gdom hadthe highest share (15 %) of goods handled<strong>in</strong> EU-27 ports, followed by Italy (14 %).Among the smaller Member States, theweight of goods handled <strong>in</strong> maritimeports was particularly high <strong>in</strong> Estonia,the Netherlands, Latvia, F<strong>in</strong>land, Belgiumand Sweden.410 EUROPE IN FIGURES — <strong>Eurostat</strong> <strong>yearbook</strong> <strong>2009</strong>
Transport 11Table 11.6: Volume of <strong>in</strong>land freight transport (1)(<strong>in</strong>dex of <strong>in</strong>land freight transport volume relative to GDP, 2000=100)1996 1997 1998 1999 2000 2001 2002 2003 2004 2005 2006EU-27 99.7 101.3 101.0 100.0 100.0 99.1 100.1 99.4 105.4 105.5 107.5Belgium 93.8 94.2 89.0 80.3 100.0 102.2 101.2 97.0 91.2 84.9 82.3Bulgaria 81.3 82.0 63.6 49.9 100.0 104.8 105.0 109.9 119.7 128.0 118.3Czech Republic 99.2 117.3 100.9 101.5 100.0 99.6 103.9 105.2 98.6 88.5 94.0Denmark 99.0 97.7 95.6 100.1 100.0 91.9 92.7 94.5 93.9 91.0 80.2Germany 93.6 95.4 97.0 100.4 100.0 99.9 98.9 100.0 104.7 106.2 110.1Estonia 60.2 65.4 76.4 91.3 100.0 89.4 92.5 84.7 89.3 85.7 74.7Ireland 78.4 76.8 82.0 91.9 100.0 94.8 101.9 106.5 111.5 109.2 100.1Greece : : : : : : : : : : :Spa<strong>in</strong> 84.2 87.5 93.6 95.5 100.0 104.0 95.0 116.1 128.1 130.1 129.6France 99.6 100.3 100.3 103.2 100.0 97.1 95.0 92.5 92.8 87.4 87.8Italy 102.9 101.1 105.1 99.4 100.0 98.8 100.4 91.6 101.7 108.3 110.8Cyprus 106.9 106.3 104.8 101.6 100.0 99.3 101.2 105.3 80.7 96.6 77.6Latvia 101.2 110.7 104.3 96.7 100.0 99.9 101.9 111.0 107.2 105.0 91.6Lithuania 88.1 91.0 85.3 97.2 100.0 90.0 107.6 109.2 106.2 116.7 118.5Luxembourg 67.3 77.5 80.9 91.6 100.0 109.2 109.4 111.0 106.3 91.6 87.2Hungary 99.9 100.0 110.7 102.2 100.0 94.0 89.5 87.3 93.8 104.8 118.0Malta : : : : : : : : : : :Netherlands 101.6 103.7 106.7 106.9 100.0 97.4 95.5 96.2 105.6 99.3 96.0Austria 90.4 91.9 93.4 98.1 100.0 104.7 105.7 105.2 104.3 98.1 101.9Poland 119.5 118.3 112.0 103.0 100.0 97.6 98.4 98.4 108.2 108.9 115.2Portugal 101.8 105.5 101.6 101.2 100.0 108.4 107.0 99.7 143.5 148.6 153.8Romania : : : 95.0 100.0 106.3 119.5 127.0 145.0 174.1 171.3Slovenia 106.8 106.1 106.2 102.1 100.0 101.0 95.5 98.9 114.5 129.1 132.4Slovakia 120.6 114.9 116.3 112.9 100.0 92.4 86.9 88.1 88.0 93.6 86.7F<strong>in</strong>land 97.8 97.0 98.6 98.4 100.0 93.4 94.8 91.7 91.5 87.1 81.5Sweden 108.8 110.4 102.9 98.0 100.0 95.4 96.9 96.7 94.4 95.3 94.5United K<strong>in</strong>gdom 112.4 111.9 110.2 104.2 100.0 97.1 95.2 94.2 92.7 91.5 91.4FYR of Macedonia : : : : 100.0 93.4 111.7 146.0 138.9 141.4 198.4Turkey 96.6 92.8 96.7 99.2 100.0 98.4 92.2 89.1 84.2 82.2 81.7Iceland 101.4 102.4 102.1 103.8 100.0 105.5 108.3 108.8 109.7 113.2 119.2Norway 96.0 101.8 102.6 101.5 100.0 97.8 96.6 101.4 103.1 105.7 109.6(1) Break <strong>in</strong> series: Sweden, 1995; Estonia, 1997; Bulgaria, Hungary and Slovakia, 2000; Bulgaria, 2001; EU-27, Spa<strong>in</strong>, Portugal andRomania, 2004.Source: <strong>Eurostat</strong> (tsien060)EUROPE IN FIGURES — <strong>Eurostat</strong> <strong>yearbook</strong> <strong>2009</strong>411
11 TransportTable 11.7: Inland freight transport, 2007(million t-km)Road (1) Rail (2)Inlandwaterways(3) Road (1) Rail (2)(t-km per <strong>in</strong>habitant)Inlandwaterways(3)National airfreight andmail transport(tonnes) (4)EU-27 1 852 614 450 769 137 711 3 721 910 279 579 470Belgium 43 017 8 235 8 908 4 064 778 848 658Bulgaria 13 765 5 241 1 011 1 792 682 132 23Czech Republic 50 376 16 304 36 4 897 1 585 4 3 142Denmark 21 254 1 779 - 3 902 327 - 1 496Germany 330 016 114 615 64 685 4 009 1 392 786 116 384Estonia 5 548 8 430 : 4 133 6 280 : 0Ireland 17 454 129 - 4 047 30 - 13 111Greece 34 002 835 - 3 044 75 - 13 487Spa<strong>in</strong> 241 788 11 064 - 5 437 249 - 110 576France 211 445 41 190 9 208 3 336 654 145 157 559Italy 191 900 25 285 : 3 605 428 : 72 761Cyprus 1 165 - - 1 496 - - 685Latvia 10 753 18 313 : 4 714 8 027 : 0Lithuania 18 134 14 373 : 5 357 4 246 : 0Luxembourg 8 807 427 345 18 495 897 724 157Hungary 30 479 10 048 2 212 3 028 998 220 1Malta : - - : - - 0Netherlands 83 193 7 216 42 310 5 086 441 2 590 1Austria 39 187 21 371 2 597 4 722 2 575 313 838Poland 128 315 54 253 277 3 366 1 423 7 7 471Portugal 44 835 2 586 - 4 230 244 - 20 867Romania 57 288 15 757 8 195 2 657 731 380 501Slovenia 12 112 3 603 : 6 025 1 792 : 12Slovakia 22 212 9 647 1 004 4 118 1 789 186 0F<strong>in</strong>land 29 715 10 434 : 5 631 1 977 : 4 531Sweden 39 918 23 250 - 4 380 2 551 - :United K<strong>in</strong>gdom 165 936 26 384 : 2 831 434 : 127 970Croatia : 3 574 : : 805 : :Turkey : 9 755 - : 140 - :Iceland : - - : - - 4Liechtenste<strong>in</strong> 339 18 : 9 639 512 : :Norway 19 387 3 456 - 4 142 738 - 18 068Switzerland : : : : : : 5026(1) All data refer to 2006; road transport is based on movements all over the world of vehicles registered <strong>in</strong> the report<strong>in</strong>g country; EU-25<strong>in</strong>stead of EU-27.(2) France, 2006.(3) EU-27, Belgium and the Netherlands, 2006.(4) Italy and Malta, 2006; Iceland, 2005; Denmark does not <strong>in</strong>clude data for Copenhagen/Kastrup airport; France underestimated asfreight transport at Paris Charles-de-Gaulle and Paris Orly is <strong>in</strong>complete.Source: <strong>Eurostat</strong> (road_go_ta_tott, rail_go_typeall, ttr00007, tps00001 and avia_gooc) and Directorate-General for Energy and Transport412 EUROPE IN FIGURES — <strong>Eurostat</strong> <strong>yearbook</strong> <strong>2009</strong>
Transport 11Figure 11.4: Air freight transport, 2007 (1)(1 000 tonnes)4 0003 2002 4001 6008000GermanyUnited K<strong>in</strong>gdomNetherlandsFrance (2)BelgiumItalyLuxembourgSpa<strong>in</strong>AustriaSwedenF<strong>in</strong>landIrelandPortugalGreeceHungaryCzech RepublicPolandCyprusEstoniaRomaniaBulgariaMaltaLithuaniaSloveniaDenmark (3)LatviaSlovakiaSwitzerlandIcelandNorway(1) Italy and Iceland, 2006; Sweden, 2004.(2) Underestimated: freight transport at Paris Charles-de-Gaulle and Paris Orly is <strong>in</strong>complete.(3) Exclud<strong>in</strong>g freight transport at Copenhagen/Kastrup airport.Source: <strong>Eurostat</strong> (ttr00011) and Directorate-General for Energy and TransportFigure 11.5: Gross weight of seaborne goods handled <strong>in</strong> ports, 2006 (1)(million tonnes)6005004003002001000United K<strong>in</strong>gdomItalyNetherlandsSpa<strong>in</strong>FranceGermanyBelgiumSwedenGreeceF<strong>in</strong>landDenmarkPortugalLatviaIrelandPolandEstoniaRomaniaBulgariaLithuaniaSloveniaCyprusMaltaNorwayCroatiaIceland(1) The Czech Republic, Luxembourg, Hungary, Austria and Slovakia, not applicable.Source: <strong>Eurostat</strong> (mar_go_aa)EUROPE IN FIGURES — <strong>Eurostat</strong> <strong>yearbook</strong> <strong>2009</strong>413
EnvironmentThe sixth environment action programme (sixth EAP) (1) , adopted <strong>in</strong> 2002, is the EU’sten-year (2002-2012) policy programme for the environment. It identifies four keypriorities:• tackl<strong>in</strong>g climate change: to achieve the EU’s target of reduc<strong>in</strong>g greenhouse gasemissions by 8 % by 2008-2012;• nature and biodiversity: to avert the loss of species and their habitats <strong>in</strong> <strong>Europe</strong> bycompletion of the Natura 2000 network and by develop<strong>in</strong>g new sectoral biodiversityaction plans, and to pay greater attention to protect<strong>in</strong>g landscapes, the mar<strong>in</strong>eenvironment and soils, and to establish measures to prevent <strong>in</strong>dustrial and m<strong>in</strong><strong>in</strong>gaccidents;• environment and health: to completely overhaul the EU’s risk-management systemfor chemicals, to develop a strategy for reduc<strong>in</strong>g risks from pesticides, protectionof water quality <strong>in</strong> the EU, noise abatement and a thematic strategy for air quality;• susta<strong>in</strong>able use of natural resources and the management of waste: to <strong>in</strong>crease resourceefficiency and decouple resource use from economic growth, to <strong>in</strong>creaserecycl<strong>in</strong>g and waste prevention <strong>with</strong> the aid of an <strong>in</strong>tegrated product policy andmeasures target<strong>in</strong>g specific waste streams such as hazardous waste, sludges andbiodegradable waste.In order to implement the sixth EAP, the <strong>Europe</strong>an Commission adopted seven thematicstrategies; these are air pollution (adopted <strong>in</strong> September 2005), mar<strong>in</strong>e environment(October 2005), the prevention and recycl<strong>in</strong>g of waste (December 2005), thesusta<strong>in</strong>able use of natural resources (December 2005), urban environment (January2006), soil (September 2006) and the susta<strong>in</strong>able use of pesticides (July 2006).(1) Decision No 1600/2002/EC of the <strong>Europe</strong>an Parliament and of the Council of 22 July 2002 lay<strong>in</strong>g down theSixth Community Environment Action Programme; http://europa.eu/eur-lex/pri/en/oj/dat/2002/l_242/l_24220020910en00010015.pdf.EUROPE IN FIGURES — <strong>Eurostat</strong> <strong>yearbook</strong> <strong>2009</strong>415
12 Environment12.1 Climate changeEach strategy follows an <strong>in</strong>-depth reviewof exist<strong>in</strong>g policy and wide-rang<strong>in</strong>gstakeholder consultation. The aim is tocreate positive synergies between theseven strategies, as well as to <strong>in</strong>tegratethem <strong>with</strong> exist<strong>in</strong>g sectoral policies, therevised Lisbon strategy and the susta<strong>in</strong>abledevelopment strategy.A 2007 mid-term review of the sixthEAP (2) was held and results adopted bythe <strong>Europe</strong>an Commission <strong>in</strong> April 2007:this confirmed the programme as theframework for Community action <strong>in</strong> thefield of the environment up to 2012. TheEU also set a target for more radical globalemission cuts <strong>in</strong> the order of 20 % by2020.<strong>Eurostat</strong>, <strong>in</strong> close partnership <strong>with</strong> the<strong>Europe</strong>an Environment Agency (EEA),provides statistics, <strong>in</strong>dicators and meta<strong>in</strong>formationon environmental pressuresand the state of the environment to supportthe implementation and monitor<strong>in</strong>gof the sixth EAP.IntroductionThe fourth assessment report from theInternational Panel on Climate Change(IPCCC) confirmed that climate changeexists and is projected to cont<strong>in</strong>ue; theemission of greenhouse gases from humanactivities, such as the burn<strong>in</strong>g ofcoal, oil and gas, is caus<strong>in</strong>g an overallwarm<strong>in</strong>g of the earth’s atmosphere, andclimate change is the most likely result<strong>with</strong> potentially major economic and socialconsequences (3) .Data on greenhouse gas emissions areofficially reported under the United NationsFramework Convention on ClimateChange – UNFCCC (4) – and the KyotoProtocol. The so-called Kyoto basket <strong>in</strong>cludessix greenhouse gases (GHG): carbondioxide (CO 2), methane (CH 4), nitrousoxide (N 2O), hydrofluorocarbons(HFCs), perfluorocarbons (PFCs) andsulphur hexafluoride (SF 6).Under the Kyoto Protocol, the <strong>Europe</strong>anCommunity has agreed to an 8 % reduction<strong>in</strong> its greenhouse gas emissions by2008-2012, compared <strong>with</strong> a base yearwhich <strong>in</strong> general terms is 1990. The reductionsfor each of the EU-15 MemberStates have been agreed under the socalledEU burden shar<strong>in</strong>g agreement,which allows some countries to <strong>in</strong>creaseemissions, provided these are offset by reductions<strong>in</strong> other Member States. The tenMember States that jo<strong>in</strong>ed the EU <strong>in</strong> 2004,as well as Bulgaria and Romania, havechosen other reduction targets and otherbase years as allowed under the protocol.Emissions of the six greenhouse gases(2) Commission Communication on the mid-term review of the Sixth Community Environment Action Programme,http://eur-lex.europa.eu/LexUriServ/LexUriServ.do?uri=CELEX:52007SC0547:EN:HTML.(3) ‘W<strong>in</strong>n<strong>in</strong>g the battle aga<strong>in</strong>st global climate change’, COM(2005) 35; http://ec.europa.eu/environment/climat/pdf/comm_en_050209.pdf.(4) http://unfccc.<strong>in</strong>t.416 EUROPE IN FIGURES — <strong>Eurostat</strong> <strong>yearbook</strong> <strong>2009</strong>
Environment 12covered by the protocol are weighted bytheir global warm<strong>in</strong>g potentials (GWPs)and aggregated to give total emissions <strong>in</strong>CO 2equivalents.In February 2006, the <strong>Europe</strong>an Commissionadopted the fourth national communication(5) from the <strong>Europe</strong>an Communityunder the UNFCCC, <strong>in</strong> which itdescribes the wide range of policies onclimate change, provides projections forgreenhouse gas emissions, and outl<strong>in</strong>esthe effect of <strong>Europe</strong>an Community policiesand measures on such gases. In August2006, the <strong>Europe</strong>an Commissionadopted a communication implement<strong>in</strong>ga Community strategy to reduce CO 2emissions from cars (6) .In January 2007, the <strong>Europe</strong>an Commissionset out proposals and options for anambitious global agreement <strong>in</strong> its Communication‘Limit<strong>in</strong>g Global ClimateChange to 2 degrees Celsius: The wayahead for 2020 and beyond’, propos<strong>in</strong>g anumber of EU targets for 2020:• greenhouse gas emissions shouldbe cut by 20 % compared <strong>with</strong> 1990levels;• renewable energy sources (such ashydro, solar and w<strong>in</strong>d energy) shouldprovide 20 % of all energy used;• biofuels should account for 10 % of alltransport fuels; and• total energy consumption should becut by 20 % through <strong>in</strong>creased energyefficiency.At their spr<strong>in</strong>g <strong>Europe</strong>an Council <strong>in</strong>March 2007, EU Heads of State and Governmentpledged that the EU would reduceits emissions <strong>in</strong> the order of 30 %below 1990 levels by 2020 provided thatother developed countries agreed to makesimilar efforts. EU leaders endorsed thepackage of climate and energy measuresput forward by the Commission as thebasis for achiev<strong>in</strong>g this goal.In January 2008, the Commission proposeda major package (7) of climate andenergy-related legislative proposals toimplement these commitments and targets,which (at the time of writ<strong>in</strong>g) arebe<strong>in</strong>g discussed by the <strong>Europe</strong>an Parliamentand the Council.Def<strong>in</strong>itions and data availabilityThe <strong>Europe</strong>an Environment Agency, assistedby its <strong>Europe</strong>an Topic Centre onAir and Climate Change, compiles theannual <strong>Europe</strong>an Community greenhousegas <strong>in</strong>ventory report for submissionto the UNFCCC Secretariat.Emissions data for the six greenhousegases (GHG): CO 2, CH 4, N 2O, HFC,PFC and SF 6are weighted by their globalwarm<strong>in</strong>g potentials (GWPs) andaggregated to give total emissions <strong>in</strong>CO 2-equivalents. To obta<strong>in</strong> emissions<strong>in</strong> CO 2-equivalents us<strong>in</strong>g their globalwarm<strong>in</strong>g potential, the follow<strong>in</strong>g weight<strong>in</strong>gfactors are used: carbon dioxide=1,methane=21, nitrous oxide=310 andsulphur hexafluoride=23 900. Hydrofluorocarbonsand perfluoro carbonscomprise a large number of different gasesthat have different GWPs.Land use changes and forestry are excludedfrom the calculations of GHGemissions. The base quantity is def<strong>in</strong>edby the GHG emissions <strong>in</strong> the base year,which is 1990 for the non-fluor<strong>in</strong>atedgases (CO 2, CH 4and N 2O) and 1995 for(5) COM(2006) 40; http://unfccc.<strong>in</strong>t/resource/docs/natc/eunce4.pdf.(6) COM(2006) 463; http://eur-lex.europa.eu/LexUriServ/site/en/com/2006/com2006_0463en01.pdf.(7) COM(2008) 30 f<strong>in</strong>al on ‘20 20 by 2020 – <strong>Europe</strong>’s climate change opportunity’; http://eur-lex.europa.eu/LexUriServ/LexUriServ.do?uri=CELEX:52008DC0030:EN:NOT.EUROPE IN FIGURES — <strong>Eurostat</strong> <strong>yearbook</strong> <strong>2009</strong>417
12 Environmentthe fluor<strong>in</strong>ated gases (HFC, PFC andSF 6), <strong>with</strong> exceptions for some countries.Greenhouse gas emission reduction targetsfor 2008-2012 are those agreed upon<strong>in</strong> Council Decision 2002/358/EC (for theMember States) or <strong>in</strong> the Kyoto Protocol(all other countries).Ma<strong>in</strong> f<strong>in</strong>d<strong>in</strong>gsTotal greenhouse gas (GHG) emissionsacross the EU-27 decl<strong>in</strong>ed by 7.7 % between1990 and 2006, although mostof this decl<strong>in</strong>e took place <strong>in</strong> the periodbefore 1998. Indeed, the EU-27’s GHGemission levels for 2006 rema<strong>in</strong>ed 1.5 %higher than the relative low recorded <strong>in</strong>2000.Developments among Member Statesvaried considerably: of the twelve MemberStates where GHG emission levels <strong>in</strong>2006 were higher than <strong>in</strong> 1990, by far thestrongest rises (45 % to 70 % higher) wererecorded for Cyprus, Spa<strong>in</strong> and Malta.In comparison to the Kyoto targets setfor the 2008-2012 period (note that targetswere not set for Cyprus and Malta),GHG emission levels <strong>in</strong> 2006 were relativelyhigh <strong>in</strong> Spa<strong>in</strong>, Luxembourg, Austriaand Denmark –where emissions alsorema<strong>in</strong>ed above 1990 levels.In contrast, GHG emissions <strong>in</strong> 2006 werelower than 1990 levels <strong>in</strong> 15 of the MemberStates, <strong>with</strong> some of the largest reductionsbe<strong>in</strong>g recorded among the threeBaltic Member States, where emissionsfell by more than 50 % to be well <strong>with</strong><strong>in</strong>their respective Kyoto targets.Greenhouse gas emissions rose by theequivalent of 77.6 million tonnes of CO 2between 2000 and 2006 <strong>in</strong> the EU-27. Inabsolute terms, the largest rises <strong>in</strong> GHGemissions <strong>in</strong> this period came from Spa<strong>in</strong>(48 million tonnes), Romania (18 milliontonnes) and Italy (16 million tonnes). Incontrast, there were notable falls recorded<strong>in</strong> the United K<strong>in</strong>gdom (18 milliontonnes), Germany (15 million tonnes),France (14 million tonnes, which wasalmost entirely <strong>in</strong> 2006) and Belgium (9million tonnes).A majority (60.4 %) of the EU-27’s GHGemissions <strong>in</strong> 2006 came from energy(exclud<strong>in</strong>g transport). Compared <strong>with</strong>the situation <strong>in</strong> 1990, however, a muchgreater proportion (19.3 % compared<strong>with</strong> 14.0 %) of GHGs came from transport.The relative shares of GHG emissionsfrom other sectors decreased; <strong>in</strong> thecase of energy this was <strong>in</strong> part expla<strong>in</strong>edby a reduction <strong>in</strong> the use of coal, and <strong>in</strong>the case of agriculture by a lower use offertilisers and pesticides.The latest projections suggest that <strong>in</strong> orderfor the EU to reach its <strong>in</strong>tended targetsfor 2020, it will have to put emissionson a much steeper reduction path after2012.418 EUROPE IN FIGURES — <strong>Eurostat</strong> <strong>yearbook</strong> <strong>2009</strong>
Environment 12Figure 12.1: Total greenhouse gas emissions (1)(base year=100; for EU-27, Cyprus and Malta, 1990=100)200150100500EU-27 (2)Euro area (3)Cyprus (2)Spa<strong>in</strong>Malta (2)PortugalIrelandGreeceAustriaF<strong>in</strong>landItalyDenmarkLuxembourgSloveniaNetherlandsFranceBelgiumSwedenUnited K<strong>in</strong>gdomGermanyCzech RepublicPolandHungarySlovakiaRomaniaBulgariaLithuaniaLatviaEstoniaTurkey (2)IcelandUnited States (2)NorwayJapanSwitzerlandCroatia2006Target 2008-2012(1) Generally <strong>in</strong>dex based on 1990=100.(2) No target under the Kyoto Protocol.(3) EA-12 <strong>in</strong>stead of EA-15; no target under the Kyoto Protocol.Source: <strong>Eurostat</strong> (tsien010), <strong>Europe</strong>an Environment Agency, <strong>Europe</strong>an Topic Center on Air and Climate ChangeFigure 12.2: Greenhouse gas emissions, EU-27 (1)(1990=100)1009590851996 1997 1998 1999 2000 2001 2002 2003 2004 2005 2006(1) Weighted emissions of greenhouse gases represented 5 320 million tonnes of CO 2equivalent <strong>in</strong> 1996 and 5 143 million tonnes <strong>in</strong> 2006.Source: <strong>Eurostat</strong> (tsien010 and ten00072), <strong>Europe</strong>an Environment Agency, <strong>Europe</strong>an Topic Center on Air and Climate ChangeEUROPE IN FIGURES — <strong>Eurostat</strong> <strong>yearbook</strong> <strong>2009</strong>419
12 EnvironmentTable 12.1: Greenhouse gas emissionsTotal greenhouse gas emissions(1990=100) (1)Weighted emissions of greenhouse gases(million tonnes of CO 2 equivalent)Target 2008Share <strong>in</strong>1996 2001 2006 2012 1996 2001 2006 EU-27 (%)EU-27 95.5 91.9 92.3 : 5 319.5 5 121.2 5 142.8 -Euro area 99.3 100.3 100.6 : 3 325.5 3 356.4 3 367.3 65.5Belgium 106.0 99.6 94.0 92.5 154.5 145.2 137.0 2.7Bulgaria 65.0 52.0 53.8 92.0 86.2 69.0 71.3 1.4Czech Republic 82.2 76.7 76.3 92.0 159.6 149.0 148.2 2.9Denmark 129.1 100.2 101.7 79.0 89.5 69.4 70.5 1.4Germany 90.4 84.1 81.5 79.0 1 114.7 1 036.3 1 004.8 19.5Estonia 50.8 42.9 44.3 92.0 21.7 18.3 18.9 0.4Ireland 110.4 127.2 125.5 113.0 61.4 70.7 69.8 1.4Greece 106.5 121.1 124.4 125.0 113.9 129.6 133.1 2.6Spa<strong>in</strong> 107.4 133.0 149.5 115.0 311.3 385.5 433.3 8.4France 101.3 98.9 96.0 100.0 571.3 557.6 541.3 10.5Italy 101.3 108.0 109.9 93.5 523.4 558.0 567.9 11.0Cyprus 125.3 142.1 170.1 : 7.4 8.4 10.0 0.2Latvia 48.5 41.1 44.9 92.0 12.6 10.7 11.6 0.2Lithuania 47.1 41.2 47.0 92.0 23.3 20.3 23.2 0.5Luxembourg 79.2 79.6 101.2 72.0 10.4 10.5 13.3 0.3Hungary 70.6 68.8 68.1 94.0 81.5 79.4 78.6 1.5Malta 119.7 129.3 145.0 : 2.6 2.8 3.2 0.1Netherlands 108.9 101.1 97.4 94.0 232.0 215.3 207.5 4.0Austria 105.9 107.9 115.2 87.0 83.7 85.3 91.1 1.8Poland 79.6 68.4 71.1 94.0 448.4 385.5 400.5 7.8Portugal 112.8 138.7 138.3 127.0 67.8 83.4 83.2 1.6Romania 68.3 51.7 56.3 92.0 190.0 143.7 156.7 3.0Slovenia 95.0 97.4 101.2 92.0 19.4 19.8 20.6 0.4Slovakia 71.1 69.7 67.9 92.0 51.2 50.2 48.9 1.0F<strong>in</strong>land 108.8 105.6 113.1 100.0 77.3 75.0 80.3 1.6Sweden 107.2 95.6 91.1 104.0 77.3 69.0 65.8 1.3United K<strong>in</strong>gdom 93.7 86.7 84.0 87.5 727.2 673.3 652.3 12.7Croatia 72.4 84.2 94.8 95.0 23.5 27.4 30.8 -Turkey 142.4 154.1 195.1 : 0.2 0.3 0.3 -Iceland 96.3 109.1 124.2 110.0 3.3 3.7 4.2 -Liechtenste<strong>in</strong> 86.8 86.8 : 92.0 0.0 0.0 0.0 -Norway 106.2 110.1 107.7 101.0 52.8 54.7 53.5 -Switzerland 98.1 99.6 100.8 92.0 51.8 52.6 53.2 -Japan 106.8 104.0 105.3 94.0 1 358.2 1 322.7 1 340.8 -United States 109.3 112.5 114.4 : 6 706.6 6 901.4 7 107.3 -(1) Generally <strong>in</strong>dex based on 1990=100; EU-27, Cyprus, Malta, Turkey and the United States, no target under the Kyoto Protocol.Source: <strong>Eurostat</strong> (tsien010 and ten00072), <strong>Europe</strong>an Environment Agency, <strong>Europe</strong>an Topic Center on Air and Climate Change420 EUROPE IN FIGURES — <strong>Eurostat</strong> <strong>yearbook</strong> <strong>2009</strong>
Environment 12Figure 12.3: Greenhouse gas emissions by sector, EU-27, 2006 (1)(%, based on data <strong>in</strong> million tonnes CO 2equivalent)1990Industrialprocesses8.6%Agriculture10.6%Waste3.9%Solvents /other0.2%Transport14.0%Energy use exclud<strong>in</strong>gtransport62.8%Agriculture9.2%Industrialprocesses8.1%2006Waste2.9%Solvents /other0.1%Transport19.3%Energy use exclud<strong>in</strong>gtransport60.4%(1) Total emissions were 5 143 million tonnes of CO 2equivalent for the EU-27; <strong>figures</strong> do not sum to 100 % due to round<strong>in</strong>g.Source: <strong>Eurostat</strong> (env_air_emis), <strong>Europe</strong>an Environment AgencyEUROPE IN FIGURES — <strong>Eurostat</strong> <strong>yearbook</strong> <strong>2009</strong>421
12 Environment12.2 Air pollutionIntroductionData on air pollution is officially reportedunder the Convention on Long-rangeTransboundary Air Pollution – CLRTAP– to the EMEP project; EMEP stands forCo-operative Programme for Monitor<strong>in</strong>gand Evaluation of the Long-rangeTransmission of Air pollutants <strong>in</strong> <strong>Europe</strong>.The air pollutants that are reportedare ammonia (NH 3), sulphur oxides(SO 2and SO 3as SOx), nitrogen oxides(NO and NO 2as NOx), non-methanevolatile organic compounds (NMVOC),carbon monoxide (CO), and particulatematter (PM10, particles def<strong>in</strong>ed as hav<strong>in</strong>gaerodynamic diameter of 10 μm orless). Where PM10 data are not reportedby countries to EMEP/CLRTAP, emissionestimates can be obta<strong>in</strong>ed from theRegional Air Pollution Information andSimulation (RAINS) model.Air pollution caused by human activities,the rise of <strong>in</strong>dustrial and energyproduction, the burn<strong>in</strong>g of fossil fuelsand <strong>in</strong>creased transport can lead to serioushealth problems. Air pollution damagesthe health of hundreds of thousandsof <strong>Europe</strong>ans every year. A 2004 WHOevaluation found that air pollution contributedto 100 000 premature deaths and725 000 work<strong>in</strong>g days lost annually <strong>in</strong><strong>Europe</strong>.S<strong>in</strong>ce the early 1970s, the EU has beenwork<strong>in</strong>g to improve air quality by controll<strong>in</strong>gemissions of harmful substances<strong>in</strong>to the atmosphere, improv<strong>in</strong>g fuelquality, and by <strong>in</strong>tegrat<strong>in</strong>g environmentalprotection requirements <strong>in</strong>to thetransport and energy sectors. In 2008, anew Directive (8) of the <strong>Europe</strong>an Parliamentand of the Council regard<strong>in</strong>g ambientair quality and cleaner air for <strong>Europe</strong>was adopted and came <strong>in</strong> to force. Therewas also a 2008 Directive (9) of the Councilconcern<strong>in</strong>g <strong>in</strong>tegrated pollution preventionand control of stationary sourceemissions.Although ozone (O 3) is present <strong>in</strong> smallconcentrations throughout the atmosphere,most ozone (about 90 %) exists <strong>in</strong>the stratosphere, a layer between 10 and50 km above the surface of the earth. Thisozone layer performs the essential taskof filter<strong>in</strong>g out most of the sun’s biologicallyharmful ultraviolet (UV-B) radiation.At ground level, ozone is harmful.It is formed by atmospheric pollutantsand is often associated <strong>with</strong> human activities,such as the burn<strong>in</strong>g of fossil fuelsand biomass, traffic emissions, or theuse of aerosols, while natural events, suchas volcanic eruptions, can also have animpact. Areas <strong>with</strong> heavy traffic are particularlysusceptible to the formation ofground level ozone; this problem is exacerbatedby particular climatic conditions.Ground level ozone is a secondarypollutant caused by nitrogen oxide andvolatile organic compounds react<strong>in</strong>g <strong>in</strong>sunlight; it harms human health, natureand biological diversity, crops and materials.People liv<strong>in</strong>g <strong>in</strong> urban areas aretherefore most at risk from ground levelozone. Higher concentrations of groundlevel ozone can have harmful effects onthe respiratory tract, can cause breath<strong>in</strong>gdifficulties, damage lungs and can triggerasthma attacks.(8) Directive 2008/50/EC of the <strong>Europe</strong>an Parliament and of the Council of 21 May 2008; http://eur-lex.europa.eu/LexUriServ/LexUriServ.do?uri=CELEX:32008L0050:EN:NOT.(9) Directive 2008/1/EC of the Council of 15 January 2008; http://eur-lex.europa.eu/LexUriServ/LexUriServ.do?uri=CELEX:32008L0001:EN:NOT.422 EUROPE IN FIGURES — <strong>Eurostat</strong> <strong>yearbook</strong> <strong>2009</strong>
Environment 12Indeed, human health is also at risk fromhigh concentrations of particles, particularlythose smaller than 10 μm, whichpenetrate deeply <strong>in</strong>to the lungs, <strong>in</strong>creas<strong>in</strong>gthe death rate <strong>in</strong> members of thepopulation suffer<strong>in</strong>g from heart and lungdiseases. Particles smaller than 2.5 μmare mostly soot, especially wood smokeand diesel-eng<strong>in</strong>e exhaust. These can persist<strong>in</strong> the air for long periods and can betransported over long distances. Coarserparticles (soil and m<strong>in</strong>eral ash) orig<strong>in</strong>atema<strong>in</strong>ly from mechanical processes suchas m<strong>in</strong><strong>in</strong>g, quarry<strong>in</strong>g and other <strong>in</strong>dustrialprocesses, as well as wear and tear oftyres and brakes <strong>in</strong> road traffic.Def<strong>in</strong>itions and data availabilityThe <strong>Europe</strong>an Environment Agency(EEA) and its <strong>Europe</strong>an Topic Centre onAir and Climate Change compile dataon emissions of air pollutants and on airquality for the Member States and thecandidate countries. A near to real-timeozone <strong>in</strong>formation system is available onthe EEA website (10) .Emissions of key air pollutants are available<strong>in</strong> EPER, a web-based register, whichenables the public to view data from large<strong>in</strong>dustrial po<strong>in</strong>t sources <strong>in</strong> the EU (11) .Urban population exposure to air pollutionshows the population weighted annualmean concentration of particulatematter and yearly sum of maximum daily8-hour mean ozone concentrations abovea threshold (70 microgram ozone perm3) at urban background stations <strong>in</strong> agglomerationsand the . F<strong>in</strong>e particulates(PM10), i.e. particulates whose diameteris less than 10 micrometers, can be carrieddeep <strong>in</strong>to the lungs where they cancause <strong>in</strong>flammation and a worsen<strong>in</strong>g ofthe condition of people <strong>with</strong> heart andlung diseases. In 1996, the EnvironmentCouncil adopted Framework Directive96/62/EC on ambient air quality assessmentand management. The first DaughterDirective (1999/30/EC) relat<strong>in</strong>g tolimit values for PM10 and other pollutants<strong>in</strong> ambient air fixed an annual limitvalue of 40 microgram of PM10 per m3.Annual report<strong>in</strong>g must follow CommissionDecision 2004/224/EC of 20 February2004 lay<strong>in</strong>g down arrangements forthe submission of <strong>in</strong>formation underCouncil Directive 96/62/EC <strong>in</strong> relation tolimit values for certa<strong>in</strong> pollutants <strong>in</strong> ambientair. Ozone is a strong photochemicaloxidant, which causes serious healthproblems and damage to the ecosystem,agricultural crops and materials. Humanexposure to elevated ozone concentrationscan give rise to <strong>in</strong>flammatory responsesand decreases <strong>in</strong> lung function.In 1996, the Environment Council adoptedFramework Directive 96/62/EC onambient air quality assessment and management.The third Daughter Directive(2002/3/EC) relat<strong>in</strong>g to ozone was adoptedon 12 February 2002 <strong>with</strong> a long-termobjective of 120 microgram ozone per m3as a maximum daily 8-hour mean <strong>with</strong><strong>in</strong>a calendar year. The annual report<strong>in</strong>gmust follow the Commission Decision2004/224/CE of 20 February 2004 lay<strong>in</strong>gdown arrangements for the submissionof <strong>in</strong>formation under Council Directive96/62/EC <strong>in</strong> relation to limit values forcerta<strong>in</strong> pollutants <strong>in</strong> ambient air.(10) Ozone today – <strong>Europe</strong>an status; http://www.eea.europa.eu/maps/ozone/welcome.(11) http://ec.europa.eu/environment/ippc/eper/<strong>in</strong>dex.htm.EUROPE IN FIGURES — <strong>Eurostat</strong> <strong>yearbook</strong> <strong>2009</strong>423
12 EnvironmentWeighted emissions of acidify<strong>in</strong>g substancestracks trends <strong>in</strong> anthropogenicatmospheric emissions of acidify<strong>in</strong>g substances(sulphur dioxide, nitrogen oxidesand ammonia) by source sector. Acidify<strong>in</strong>gsubstance emissions are comb<strong>in</strong>ed <strong>in</strong>terms of their acidify<strong>in</strong>g effects, and expressed<strong>in</strong> acid equivalents.Ma<strong>in</strong> f<strong>in</strong>d<strong>in</strong>gsAlthough the data is <strong>in</strong>complete <strong>in</strong> termsof country coverage, the highest concentrationof particulate matter amongpeople liv<strong>in</strong>g <strong>in</strong> urban areas was found<strong>in</strong> Bulgaria and Romania <strong>in</strong> 2006, at upwardsof 75 % more than the EU-27 averagelevel. Exposure to air pollution byozone was highest for the urban populationsof Italy and Greece, where the meanozone concentrations registered <strong>in</strong> 2006were about 75 % higher than the EU-27average. These measures of air pollutionwere relatively low <strong>in</strong> F<strong>in</strong>land, Swedenand the United K<strong>in</strong>gdom <strong>in</strong> 2006.Carbon dioxide is by far the most commontype of air pollutant, <strong>with</strong> more4 258 million tonnes released across theEU-27 <strong>in</strong> 2006, up slightly on the level<strong>in</strong> 1996. The developments among theMember States were largely as describedfor GHGs as a whole, as presented <strong>in</strong>Subchapter 12.1, <strong>with</strong> a rise of almost50 % <strong>in</strong> carbon dioxide levels <strong>in</strong> Spa<strong>in</strong>and 40 % <strong>in</strong> Cyprus be<strong>in</strong>g by far thesteepest. In contrast, there were relativelylarge reductions <strong>in</strong> the amounts of otherair pollutants released <strong>in</strong> the EU-27; theamounts of carbon monoxide releaseddecl<strong>in</strong>ed by over a third (37.6 %) <strong>in</strong> theten years through until 2005, of nitrousoxides and methane by a little over a fifth(down 22.7 % and 21.7 % respectively)and of sulphur oxides by about 8 %. Asidefrom carbon dioxide, there were decl<strong>in</strong>es<strong>in</strong> the emissions of air pollutants <strong>in</strong> almostall of the Member States, particularlysharp decl<strong>in</strong>es be<strong>in</strong>g recorded <strong>in</strong> theUnited K<strong>in</strong>gdom (up to twice the averagerate across the EU-27). Among the exceptions,there were higher emission levels ofcarbon monoxide <strong>in</strong> F<strong>in</strong>land and Latvia,and notably higher emissions of methane<strong>in</strong> Spa<strong>in</strong>, sulphur oxides <strong>in</strong> Denmark andnitrogen oxides <strong>in</strong> Austria and Spa<strong>in</strong>.When related to the size of each MemberStates’ population, carbon dioxide emissionswere between 25 % and 45 % higherthan the EU-27 average <strong>in</strong> F<strong>in</strong>land, theCzech Republic, Estonia, Belgium andIreland. The particularly high figure forLuxembourg is at least <strong>in</strong> part expla<strong>in</strong>edby the high proportion of the country’sworkforce that live over the border<strong>in</strong> neighbour<strong>in</strong>g Belgium, Germany orFrance. In contrast, carbon dioxide emissionswere less than one half of the EU-27figure per head of population <strong>in</strong> Lithuaniaand Latvia.Emissions of acidify<strong>in</strong>g substances contributeto acid deposition, lead<strong>in</strong>g amongother th<strong>in</strong>gs to potential changes <strong>in</strong> soiland water quality and damage to forests,crops and other vegetation, and to adverseeffects on aquatic ecosystems <strong>in</strong> riversand lakes. About one quarter (25.7 %)of the emissions of acidify<strong>in</strong>g substancesacross the EU-27 <strong>in</strong> 2006 came from agriculture,<strong>with</strong> another quarter (24.7 %)com<strong>in</strong>g from energy <strong>in</strong>dustries (particularlythe coal-based energy <strong>in</strong>dustry).424 EUROPE IN FIGURES — <strong>Eurostat</strong> <strong>yearbook</strong> <strong>2009</strong>
Environment 12Table 12.2: Air pollutantsEmissions ofcarbon dioxide(million tonnes)Emissions ofcarbon monoxide(million tonnes)Emissions ofnitrogen oxides(million tonnesof NO 2equivalent)1996 2006 1995 2005 1996 2006 1995 2005 1995 2005EU-27 4 241.7 4 257.6 51.08 31.89 25.49 19.96 17.16 15.82 14.60 11.29Belgium 128.0 119.1 1.11 0.88 0.46 0.34 0.26 0.24 0.37 0.29Bulgaria 65.0 55.1 0.85 0.74 0.73 0.54 1.48 1.42 0.27 0.23Czech Republic 138.4 127.9 1.00 0.51 0.64 0.57 1.09 0.94 0.37 0.28Denmark 74.0 57.6 0.71 0.61 0.29 0.26 0.14 0.17 0.26 0.19Germany 943.3 880.3 6.53 4.03 3.73 2.18 1.73 1.45 2.17 1.44Estonia 18.7 16.0 0.21 0.16 0.10 0.10 0.12 0.12 0.04 0.03Ireland 37.1 47.3 0.32 0.23 0.67 0.63 0.16 0.15 0.12 0.12Greece 89.3 109.7 1.32 0.64 0.44 0.40 0.54 0.52 0.32 0.32Spa<strong>in</strong> 243.0 359.6 3.22 2.38 1.55 1.79 1.81 1.58 1.33 1.53France 402.4 404.3 9.57 5.68 3.26 2.67 0.97 0.94 1.65 1.21Italy 439.3 488.0 7.17 4.21 2.10 1.82 1.32 1.21 1.81 1.17Cyprus 5.9 8.2 0.10 0.04 0.04 0.04 0.04 0.05 0.02 0.02Latvia 9.2 8.3 0.32 0.34 0.09 0.08 0.05 0.05 0.04 0.04Lithuania 15.9 14.5 0.29 0.19 0.17 0.16 0.09 0.09 0.07 0.06Luxembourg 9.4 12.1 0.11 0.04 0.02 0.02 0.01 0.01 0.02 0.01Hungary 63.4 60.4 0.76 0.59 0.40 0.37 0.70 0.67 0.19 0.20Malta 2.3 2.6 : : 0.01 0.02 0.03 0.03 0.01 0.01Netherlands 177.7 172.2 0.86 0.60 1.10 0.78 0.13 0.12 0.47 0.34Austria 67.4 77.3 1.01 0.72 0.40 0.33 0.05 0.04 0.19 0.23Poland 374.9 330.5 4.55 3.33 2.05 1.77 2.38 2.37 1.12 0.81Portugal 50.3 64.5 0.85 0.65 0.54 0.56 0.33 0.27 0.27 0.28Romania 135.4 111.0 2.09 1.41 1.62 1.38 0.89 0.86 0.32 0.31Slovenia 15.7 16.9 0.09 0.08 0.10 0.10 0.13 0.11 0.07 0.06Slovakia 42.4 40.0 0.42 0.30 0.22 0.22 0.25 0.23 0.18 0.10F<strong>in</strong>land 64.0 68.1 0.44 0.52 0.29 0.22 0.10 0.11 0.26 0.18Sweden 61.6 51.5 0.90 0.60 0.32 0.26 0.07 0.07 0.28 0.20United K<strong>in</strong>gdom 568.0 554.8 6.30 2.42 4.17 2.33 2.32 1.97 2.38 1.63Croatia (1) 16.9 23.0 0.34 0.31 0.12 0.15 0.08 0.06 0.06 0.07FYR of Macedonia : : 0.02 0.10 : : 0.02 0.02 0.01 0.03Turkey (1) 190.7 256.9 3.99 3.78 2.14 2.35 1.01 1.16 0.80 0.95Iceland (1) 2.4 2.9 0.00 0.00 0.02 0.02 0.00 0.00 0.00 0.00Liechtenste<strong>in</strong> (1) 0.2 0.2 0.00 0.00 0.00 0.00 0.00 0.00 0.00 0.00Norway (1) 40.8 43.2 0.73 0.45 0.24 0.22 0.03 0.03 0.21 0.20Switzerland (1) 44.1 46.0 0.49 0.33 0.19 0.17 0.03 0.03 0.12 0.09(1) 2005 <strong>in</strong>stead of 2006 for emissions of carbon dioxide and methane.Source: <strong>Eurostat</strong> (ten00073, ten00070, ten00074, ten00067 and ten00068)Emissions ofmethane(million tonnes)Emissions ofsulphur oxides(million tonnes ofSO 2 equivalent)EUROPE IN FIGURES — <strong>Eurostat</strong> <strong>yearbook</strong> <strong>2009</strong>425
12 EnvironmentFigure 12.4: Urban population exposure to air pollution - population weighted, 2006 (1)60402012 0008 0004 0000EU-27BelgiumBulgariaCzech RepublicDenmarkGermanyEstoniaIreland (2)GreeceSpa<strong>in</strong>FranceItalyLatvia (3)LithuaniaHungaryNetherlandsAustriaPolandPortugalRomaniaSloveniaSlovakiaF<strong>in</strong>landSwedenUnited K<strong>in</strong>gdomIceland (4)Particulate matter (annual mean concentration of particulate matter -micrograms per cubic metre day) (left-hand scale)Ozone (yearly sum of maximum daily 8-hour mean ozone concentrationsabove a threshold) (right-hand scale)Norway (2)0(1) Cyprus, Luxembourg and Malta, not available.(2) Ozone, not available.(3) Particulate matter, not available.(4) Ozone, 2005.Source: <strong>Eurostat</strong> (tsien110), <strong>Europe</strong>an Environment Agency, <strong>Europe</strong>an Topic Center on Air and Climate ChangeFigure 12.5: Emissions of carbon dioxide, 2006(kg per capita)30 00025 00020 00015 00010 0005 0000EU-27LuxembourgF<strong>in</strong>landCzech RepublicEstoniaBelgiumIrelandGermanyCyprusDenmarkNetherlandsGreeceAustriaUnited K<strong>in</strong>gdomPolandSloveniaItalySpa<strong>in</strong>SlovakiaBulgariaMaltaFrancePortugalHungarySwedenRomaniaLithuaniaLatviaIcelandNorwayLiechtenste<strong>in</strong>SwitzerlandCroatia (1)Turkey(1) Estimate.Source: <strong>Eurostat</strong> (ten00073 and tps00001)Figure 12.6: Weighted emissions of acidify<strong>in</strong>g substances, by sector, EU-27, 2005 (1)(%, based on acid equivalents)Other (energy)4.4%Manufactur<strong>in</strong>g<strong>in</strong>dustries andconstruction8.8%Transport16.7%Waste1.0%Other(non-energy)0.1%Agriculture25.7%Industrialprocesses18.7%Energy<strong>in</strong>dustries24.7%(1) Total emissions were 745 210 tonnes of acid equivalent; <strong>figures</strong> do not sum to 100 % due to round<strong>in</strong>g.Source: <strong>Eurostat</strong> (tsdpc260), <strong>Europe</strong>an Environment Agency, Topic Centre on Air and Climate426 EUROPE IN FIGURES — <strong>Eurostat</strong> <strong>yearbook</strong> <strong>2009</strong>
Environment 1212.3 WaterIntroductionWater is essential for life, as well as an<strong>in</strong>dispensable resource for the economy,while play<strong>in</strong>g a fundamental role <strong>in</strong> theclimate regulation cycle. The managementand the protection of water resources,of fresh and salt water ecosystems,and of the water we dr<strong>in</strong>k and bathe <strong>in</strong>are therefore major concerns all aroundthe world.A study conducted for the <strong>Europe</strong>anCommission estimates that water useefficiency could be improved by nearly40 % through technological improvementsalone and that changes <strong>in</strong> humanbehaviour or production patterns could<strong>in</strong>crease such sav<strong>in</strong>gs further. In a scenario<strong>with</strong>out changes <strong>in</strong> practices it isestimated that water consumption by thepublic, <strong>in</strong>dustry and agriculture would<strong>in</strong>crease by 16 % by 2030. Conversely, theuse of water sav<strong>in</strong>g technologies and irrigationmanagement <strong>in</strong> the <strong>in</strong>dustrial andagricultural sectors could reduce excessesby as much as 43 %, while water efficiencymeasures could decrease water wastageby up to a third.In a Communication on water scarcityand droughts (12) adopted <strong>in</strong> July 2007,the <strong>Europe</strong>an Commission identified an<strong>in</strong>itial set of policy options to be taken at<strong>Europe</strong>an, national and regional levels toaddress water scarcity <strong>with</strong><strong>in</strong> the EU. Thisset of proposed policies aims to move theEU towards a water-efficient and watersav<strong>in</strong>geconomy. Indeed, both the qualityand availability of water are majorconcerns <strong>in</strong> many regions. While waterresources are limited, water quality is affectedby human activities such as <strong>in</strong>dustrialproduction, household discharges, orarable farm<strong>in</strong>g (the latest report (13) on theprotection of waters aga<strong>in</strong>st pollution bynitrates from agricultural sources be<strong>in</strong>gissued <strong>in</strong> March 2007). The pollution ofrivers, lakes and groundwater rema<strong>in</strong>s ofworldwide concern. Increas<strong>in</strong>gly variableweather patterns and catastrophic floods(such as the those along the Danube andElbe <strong>in</strong> 2002) prompted a review of floodrisk management, which culm<strong>in</strong>ated <strong>in</strong>a <strong>Europe</strong>an Commission Directive (14) ofNovember 2007 that aims to reduce andmanage the risks that floods pose to humanhealth, the environment, culturalheritage and economic activity.The majority of the EU’s population isconnected to public water supplies, <strong>with</strong>the proportion ris<strong>in</strong>g close to 100 % <strong>in</strong>most Member States. Look<strong>in</strong>g at the ‘otherend of the pipe’, namely the treatmentof wastewater, a number of countries reportedthat less than half of their populationwas connected to urban wastewatertreatment.(12) COM(2007) 414 f<strong>in</strong>al; http://eur-lex.europa.eu/LexUriServ/site/en/com/2007/com2007_0414en01.pdf.(13) COM(2007) 120 f<strong>in</strong>al; http://eur-lex.europa.eu/LexUriServ/LexUriServ.do?uri=CELEX:52007DC0120:EN:NOT.(14) Directive 2007/60/EC of 26 November 2007: http://eur-lex.europa.eu/LexUriServ/LexUriServ.do?uri=OJ:L:2007:288:0027:0034:EN:PDF.EUROPE IN FIGURES — <strong>Eurostat</strong> <strong>yearbook</strong> <strong>2009</strong>427
12 EnvironmentDef<strong>in</strong>itions and data availabilityWater statistics are collected through the<strong>in</strong>land waters section of a jo<strong>in</strong>t OE<strong>CD</strong>/<strong>Eurostat</strong>questionnaire which is cont<strong>in</strong>uouslyadapted to the EU policy framework. Itcurrently reports on the follow<strong>in</strong>g:• freshwater resources <strong>in</strong> groundwaterand surface waters – these can be replenishedby precipitation and by external<strong>in</strong>flows (water flow<strong>in</strong>g <strong>in</strong> fromother territories);• water abstraction – a major pressureon resources, although a large partof the water abstracted for domestic,<strong>in</strong>dustrial (<strong>in</strong>clud<strong>in</strong>g energy production),or agricultural use is returnedto the environment and its water bodies,but often as wastewater <strong>with</strong> impairedquality;• water use, analysed by supply categoryand by <strong>in</strong>dustrial activities;• treatment capacities of wastewatertreatment plants and the share of thepopulation connected to them – thisgives an overview of the developmentstatus of the <strong>in</strong>frastructure, <strong>in</strong> termsof quantity and quality, that is availablefor the protection of the environmentfrom pollution by wastewater;• sewage sludge production and disposal– an <strong>in</strong>evitable product ofwastewater treatment processes; itsimpact on the environment dependson the methods chosen for its process<strong>in</strong>gand disposal;• generation and discharge of wastewater– pollutants present <strong>in</strong> wastewaterhave different source profiles,and similarly the efficiency of treatmentof any pollutant varies accord<strong>in</strong>gto the method applied.Statistics on water resources are usuallycalculated on the basis of long-term annualaverages of at least 20 years, to takeaccount of the fluctuations <strong>in</strong> ra<strong>in</strong>fall andevaporation/transpiration from one yearto the next. Precipitation is def<strong>in</strong>ed asthe total volume of atmospheric wet precipitation(ma<strong>in</strong>ly ra<strong>in</strong>, snow and hail)and is usually measured by meteorologicalor hydrological <strong>in</strong>stitutes. Evapotranspirationis the volume of water that istransported from the ground (<strong>in</strong>clud<strong>in</strong>g<strong>in</strong>land water surfaces – streams, rivers,freshwater lakes and glaciers) <strong>in</strong>to theatmosphere by evaporation or by transpirationof plants. Internal flow is def<strong>in</strong>edas the total volume of river run-off andgroundwater generated, <strong>in</strong> natural conditions,exclusively by precipitation <strong>in</strong>toa territory. The <strong>in</strong>ternal flow is equal toprecipitation less evapotranspirationand can be calculated or measured. Ifthe river run-off and groundwater generationare measured separately, transfersbetween surface and groundwater shouldbe netted out to avoid double count<strong>in</strong>g.External <strong>in</strong>flow is the volume of <strong>in</strong>flowderived from rivers and groundwaterthat orig<strong>in</strong>ate <strong>in</strong> a neighbour<strong>in</strong>g territory.Freshwater resources refer to the volume428 EUROPE IN FIGURES — <strong>Eurostat</strong> <strong>yearbook</strong> <strong>2009</strong>
Environment 12of water result<strong>in</strong>g from <strong>in</strong>ternal flow andexternal <strong>in</strong>flow. Outflow is the volume ofwater that flows from rivers and groundwater<strong>in</strong>to the sea and <strong>in</strong>to neighbour<strong>in</strong>gterritories. Total additional freshwaterresources available are calculated as thesum of <strong>in</strong>ternal and external flows.Fresh surface water is def<strong>in</strong>ed as waterwhich flows over, or rests on the surfaceof a land mass, natural watercourse –such as rivers, streams, brooks and lakes– as well as artificial watercourse – suchas irrigation, <strong>in</strong>dustrial and navigationcanals, dra<strong>in</strong>age systems and artificialreservoirs. Fresh groundwater is def<strong>in</strong>edas freshwater which is be<strong>in</strong>g held <strong>in</strong>, andcan usually be recovered from, or via, anunderground formation. All permanentand temporary deposits of water, bothartificially charged and naturally, <strong>in</strong> thesubsoil, of sufficient quality for at leastseasonal use. Total freshwater resourcesis the total volume of water that is additionallyavailable due to <strong>in</strong>ternal flow andexternal <strong>in</strong>flow.Water abstraction covers groundwaterabstraction and surface water abstraction.Groundwater abstraction is abstractionof freshwater from undergrounddeposits. These can be permanent ortemporary, both artificially charged ornaturally. Groundwater <strong>in</strong>cludes spr<strong>in</strong>gs,both concentrated and diffused, whichmay also be subaqueous. Surface waterabstraction is water abstracted fromnatural or artificial surface watercourseshold<strong>in</strong>g freshwater, such as lakes, rivers,streams, canals etc.Public water is that supplied by economicunits engaged <strong>in</strong> the collection, purificationand distribution of water (<strong>in</strong>clud<strong>in</strong>gdesalt<strong>in</strong>g of sea water to produce water asthe pr<strong>in</strong>cipal product of <strong>in</strong>terest, and exclud<strong>in</strong>gsystem operation for agriculturalpurposes and treatment of wastewatersolely <strong>in</strong> order to prevent pollution); correspondsto NACE Rev. 1.1 Division 41.Wastewater is def<strong>in</strong>ed as water whichis of no further immediate value to thepurpose for which it was used or <strong>in</strong> thepursuit of which it was produced becauseof its quality, quantity or time of occurrence.However, wastewater from oneuser can be a potential supply to anotheruser elsewhere. Domestic wastewater isdef<strong>in</strong>ed as wastewater from residentialsettlements and services which orig<strong>in</strong>atespredom<strong>in</strong>antly from the human metabolismand from household activities. Urbanwastewater is domestic wastewater orthe mixture of domestic wastewater <strong>with</strong><strong>in</strong>dustrial wastewater and/or run-offra<strong>in</strong> water. Urban wastewater treatmentis all treatment of wastewater <strong>in</strong> urbanwastewater treatment plants (UWWTPs).UWWTPs are usually operated by publicauthorities or by private enterpriseswork<strong>in</strong>g by order of public authorities.This <strong>in</strong>cludes wastewater delivered totreatment plants by trucks. This approachused <strong>in</strong> <strong>in</strong>ternational water statistics isdifferent to the concept applied <strong>in</strong> the EUUrban Wastewater Treatment Directive(91/271/EC) where only a system of conduits(sewage pipes) is taken <strong>in</strong>to accountfor connection to the treatment plant. TheEUROPE IN FIGURES — <strong>Eurostat</strong> <strong>yearbook</strong> <strong>2009</strong>429
12 Environmentpopulation connected to urban wastewatertreatment relates to the proportionof persons who are connected to any k<strong>in</strong>dof sewage treatment that is carried out<strong>in</strong> municipal treatment plants by publicauthorities or private enterprises on behalfof local authorities. Thereby, urbanwastewater is treated by a process generally<strong>in</strong>volv<strong>in</strong>g biological treatment <strong>with</strong>a secondary settlement or other process,result<strong>in</strong>g <strong>in</strong> a biochemical oxygendemand (BOD) removal of at least 70 %and a chemical oxygen demand (COD)removal of at least 75 %.Ma<strong>in</strong> f<strong>in</strong>d<strong>in</strong>gsGiven the natural resources available, geographicalcharacteristics and freshwatermanagement, there are wide differencesamong the countries <strong>in</strong> terms of freshwaterresources. On the basis of longtermannual averages of at least 20 yearsamong the Member States, an overallpicture shows that F<strong>in</strong>land and Swedenrecorded the highest volume of freshwaterresources per capita <strong>in</strong> 2006, while theCzech Republic and Cyprus recorded thelowest averages.There are considerable differences betweenMember States <strong>in</strong> the amount ofwater that is abstracted from the groundor from surface areas (like lakes and rivers),<strong>in</strong> part reflect<strong>in</strong>g the resources availableon the one hand but also, on theother, abstraction practices for public watersupply, <strong>in</strong>dustrial purposes, agriculturalpurposes, land dra<strong>in</strong>age and landseal<strong>in</strong>g. Where time-series are available,the amount of groundwater extractedby Member States <strong>in</strong> 2005 was generallylower than <strong>in</strong> 1995; <strong>in</strong> Bulgaria, Lithuania,Latvia, and the Czech Republic andRomania, extraction was about one halfits level of 1995. The three ma<strong>in</strong> exceptionswere Spa<strong>in</strong>, Slovenia and F<strong>in</strong>land,where extraction levels were between10 % and 15 % higher.Developments <strong>in</strong> surface water abstractionlevels were even more contrast<strong>in</strong>g. InSlovenia, surface water abstraction levels<strong>in</strong> 2005 were about three quarters lessthan <strong>in</strong> 1995, <strong>with</strong> strong decl<strong>in</strong>es alsorecorded <strong>in</strong> Romania, Lithuania, Latvia,Slovakia, the Czech Republic and Belgium.In contrast, surface water abstractionlevels <strong>in</strong> Spa<strong>in</strong> <strong>in</strong>creased by about15 % to 32 000 million m 3 <strong>in</strong> 2004, thehighest level among those Member Statesfor which <strong>in</strong>formation is available.The population connected to urbanwastewater treatment relates to the proportionof persons who are connected toany k<strong>in</strong>d of sewage treatment (on behalfof local authorities). Although the dataset is <strong>in</strong>complete, only <strong>in</strong> seven of the 19Member States <strong>with</strong> available data did theproportion of households connected tothe urban wastewater treatment near orexceed 80 % <strong>in</strong> 2005, <strong>with</strong> the proportionalmost reach<strong>in</strong>g 100 % <strong>in</strong> the Netherlands.At the other end of the spectrum,household connection rates were lessthan 40 % <strong>in</strong> six of the Member States,<strong>with</strong> a relatively low proportion <strong>in</strong> Malta,where the connection rate was around13 % (but new treatment plants are underconstruction).430 EUROPE IN FIGURES — <strong>Eurostat</strong> <strong>yearbook</strong> <strong>2009</strong>
Environment 12Table 12.3: Groundwater and surface water abstractionGroundwater abstraction (million m3) Surface water abstraction (million m3)1995 2000 2005 1995 2000 2005Belgium (1) 685 640 640 7 500 6 833 5 936Bulgaria 907 574 447 5 419 5 558 5 570Czech Republic 719 555 385 2 024 1 363 1 564Denmark (2) 887 709 659 : 17 21Germany 7 623 : : 35 751 : :Estonia (2) 350 255 310 1 430 1 216 :Ireland : : 364 : : 435Greece 3 119 : : 4 614 : :Spa<strong>in</strong> (2) 5 408 4 979 6 196 27 880 32 091 31 963France : 6 259 : : 26 456 :Italy : : : : : :Cyprus : 137 141 : 45 81Latvia 195 119 102 222 165 136Lithuania 304 166 157 4 278 3 412 2 208Luxembourg 29 : : 28 : :Hungary (2) 969 740 708 : 18 138 19 991Malta 20 19 14 0 0 0Netherlands : : 1 025 : : 9 301Austria 1 164 : : 2 285 : :Poland 2 846 : : 10 078 : :Portugal : : 400 : : 687Romania 1 280 1 107 724 9 020 6 860 4 577Slovenia 164 136 184 222 168 53Slovakia (3) 578 448 374 808 723 621F<strong>in</strong>land 257 285 285 2 278 : :Sweden (2) 661 635 628 2 064 2 053 2 048United K<strong>in</strong>gdom : : : : : :FYR of Macedonia 33 14 : 2 829 2 258 :Turkey 8 450 10 350 11 622 25 032 33 300 :Iceland 158 158 160 7 5 5Norway : : : : : :Switzerland 892 886 811 1 679 1 678 1 696(1) 2003 <strong>in</strong>stead of 2005.(2) 2004 <strong>in</strong>stead of 2005.(3) 2003 <strong>in</strong>stead of 2005 for surface water abstraction.Source: <strong>Eurostat</strong> (ten00004 and ten00005)EUROPE IN FIGURES — <strong>Eurostat</strong> <strong>yearbook</strong> <strong>2009</strong>431
12 EnvironmentFigure 12.7: Freshwater resources per capita - long-term average (1)(1 000 m³ per <strong>in</strong>habitant)2520151050F<strong>in</strong>landSwedenSloveniaLatviaEstoniaSlovakiaHungaryIrelandAustriaLithuaniaPortugalGreeceNetherlandsLuxembourgDenmarkItalyFranceUnited K<strong>in</strong>gdomSpa<strong>in</strong>GermanyBulgariaRomaniaBelgiumPolandCzech RepublicCyprusIceland (2)Norway (3)SwitzerlandFYR of MacedoniaTurkey(1) The m<strong>in</strong>imum period taken <strong>in</strong>to account for the calculation of long term annual averages is 20 years; population data are as of1 January 2006; Luxembourg, estimate; Malta, not available.(2) Y-axis is cut, 566.9.(3) Y-axis is cut, 84.2.Source: <strong>Eurostat</strong> (ten00001 and tps00001)Figure 12.8: Population connected to urban wastewater treatment, 2005 (1)(%)1007550250NetherlandsGermanySpa<strong>in</strong>AustriaLuxembourgSwedenIrelandCzech RepublicEstoniaLatviaPolandLithuaniaHungaryBulgariaPortugalCyprusSloveniaRomaniaMaltaSwitzerlandNorwayTurkeyIceland(1) Germany, Estonia, Hungary, Austria and Turkey, 2004; Luxembourg and Portugal, 2003; Belgium, Denmark, Greece, France, Italy,Slovakia, F<strong>in</strong>land and the United K<strong>in</strong>gdom, not available.Source: <strong>Eurostat</strong> (tsdnr320)432 EUROPE IN FIGURES — <strong>Eurostat</strong> <strong>yearbook</strong> <strong>2009</strong>
Environment 1212.4 WasteIntroductionWaste refers to materials for which thegenerator has no further use for theirown purpose of production, transformationor consumption; these materials arediscarded. In some circumstances theremay be statutory requirements on a producerto dispose of waste <strong>in</strong> a certa<strong>in</strong>manner, for example, when waste materialsare hazardous.The EU’s susta<strong>in</strong>able development strategyand the sixth environment actionprogramme, which identifies waste preventionand management as one of fourtop priorities, underl<strong>in</strong>e the relationshipbetween the efficiency of resourcesand waste generation and management.The objective is to decouple the use ofresources and generation of waste fromeconomic growth, while susta<strong>in</strong>able consumptionshould not exceed environmentalcapacity.The EU’s approach to waste managementis based on three pr<strong>in</strong>ciples: waste prevention,recycl<strong>in</strong>g and reuse, and improv<strong>in</strong>gf<strong>in</strong>al disposal and monitor<strong>in</strong>g. Waste preventioncan be achieved through cleanertechnologies, eco-design, or more ecoefficientproduction and consumptionpatterns. Waste prevention and recycl<strong>in</strong>g,focused on materials technology, canalso reduce the environmental impact ofresources that are used through limit<strong>in</strong>graw materials extraction and transformationdur<strong>in</strong>g production processes. Wherepossible, waste that cannot be recycled orreused should be safely <strong>in</strong>c<strong>in</strong>erated, <strong>with</strong>landfill only used as a last resort. Boththese methods need close monitor<strong>in</strong>g becauseof their potential for caus<strong>in</strong>g severeenvironmental damage.The <strong>Europe</strong>an Commission has def<strong>in</strong>edseveral specific waste streams for priorityattention, the aim be<strong>in</strong>g to reducetheir overall environmental impact; this<strong>in</strong>cludes packag<strong>in</strong>g waste, end-of-life vehicles,batteries, electrical and electronicwaste. Member States are required to <strong>in</strong>troducelegislation on waste collection,reuse, recycl<strong>in</strong>g and disposal of thesewaste streams. In 2006 the new WasteFramework Directive (15) and the WasteShipment Regulation (16) were adopted bythe <strong>Europe</strong>an Parliament and the Council,<strong>with</strong> the aim to strengthen, simplifyand clarify the control procedures applicableto waste management.Def<strong>in</strong>itions and data availabilityIn order to be able to monitor the implementationof waste policy, <strong>in</strong> particularcompliance <strong>with</strong> the pr<strong>in</strong>ciples of recoveryand safe disposal, reliable statisticson the production and management ofwaste from bus<strong>in</strong>esses and private householdsare needed. In 2002, Regulation No2150/2002/EC on waste statistics (17) wasadopted, creat<strong>in</strong>g a framework for harmonisedCommunity statistics on waste.Start<strong>in</strong>g <strong>with</strong> the reference year 2004,the Regulation requires the EU MemberStates to provide data on the generation,recovery and disposal of waste everytwo years. Thus, the Regulation on waste(15) Directive 2006/12/EC of the <strong>Europe</strong>an Parliament and of the Council of 5 April 2006); http://eur-lex.europa.eu/LexUriServ/site/en/oj/2006/l_114/l_11420060427en00090021.pdf.(16) Regulation (EC) No 1013/2006 of the <strong>Europe</strong>an Parliament and of the Council of 14 June 2006; http://eur-lex.europa.eu/LexUriServ/site/en/oj/2006/l_190/l_19020060712en00010098.pdf.(17) Regulation (EC) No 2150/2002 of the <strong>Europe</strong>an Parliament and of the Council of 25 November 2002; http://eur-lex.europa.eu/LexUriServ/LexUriServ.do?uri=OJ:L:2002:332:0001:0036:EN:PDF.EUROPE IN FIGURES — <strong>Eurostat</strong> <strong>yearbook</strong> <strong>2009</strong>433
12 Environmentstatistics replaces the <strong>Eurostat</strong>/OE<strong>CD</strong>Jo<strong>in</strong>t Questionnaire as the ma<strong>in</strong> source of<strong>Europe</strong>an waste data. Whereas report<strong>in</strong>gby the Jo<strong>in</strong>t Questionnaire was voluntary,the provisions of the Regulation are b<strong>in</strong>d<strong>in</strong>gby law. The second delivery of databased on the Regulation on waste statisticswas <strong>in</strong> June 2008; and hence, data arenow available for the reference years 2004and 2006.The concept of ‘municipal waste’, a centralwaste category of the Jo<strong>in</strong>t Questionnaireis replaced <strong>in</strong> the new Regulation bythe category ‘waste generated by households’.The concept of municipal wastehas always been disputed as its contentis directly l<strong>in</strong>ked to different nationalor regional waste management systems.However, data on municipal waste generationand treatment are still collectedannually from the countries, as it is partof the series of structural <strong>in</strong>dicators onthe environment.Municipal waste consists of waste collectedby or on behalf of municipal authoritiesand disposed of through the wastemanagement system. The <strong>in</strong>formationpresented on municipal waste <strong>in</strong>cludeswaste generated by various branchesof economic activity and households(which accounts for the bulk of this wastestream). The quantity of waste generatedis expressed <strong>in</strong> kg per person per year.Data for waste recovery and recycl<strong>in</strong>g isnot collected from countries but calculatedas the difference between municipalwaste generation and municipal waste <strong>in</strong>c<strong>in</strong>eratedand landfilled.Treatment of municipal waste can beclassified <strong>in</strong>to three pr<strong>in</strong>cipal categories:• landfill, which is def<strong>in</strong>ed as the deposit<strong>in</strong>gof waste <strong>in</strong>to or onto land,<strong>in</strong>clud<strong>in</strong>g specially eng<strong>in</strong>eered landfill,and temporary storage of overone year on permanent sites;.the def<strong>in</strong>itioncovers both landfill <strong>in</strong> <strong>in</strong>ternalsites (i.e. where a generator of waste iscarry<strong>in</strong>g out its own waste disposal atthe place of generation) and <strong>in</strong> externalsites;• <strong>in</strong>c<strong>in</strong>eration, which refers to thethermal treatment of waste <strong>in</strong> specificallydesigned <strong>in</strong>c<strong>in</strong>eration plants asdef<strong>in</strong>ed <strong>in</strong> Article 3(4) or co-<strong>in</strong>c<strong>in</strong>erationplants as def<strong>in</strong>ed <strong>in</strong> Article 3(5)of the Directive on the <strong>in</strong>c<strong>in</strong>eration ofwaste (Directive 2000/76/EC of 4 December2000), and;• recovery, which refers to any wastemanagement operation that diverts awaste material from the waste streamand which results <strong>in</strong> a certa<strong>in</strong> product<strong>with</strong> a potential economic or ecologicalbenefit.The disposal of waste can have a seriousenvironmental impact: for example, landfilltakes up land space, and may causeair, water and soil pollution. Inc<strong>in</strong>erationcan also result <strong>in</strong> emissions of dangerousair pollutants, unless properly regulated.434 EUROPE IN FIGURES — <strong>Eurostat</strong> <strong>yearbook</strong> <strong>2009</strong>
Environment 12Ma<strong>in</strong> f<strong>in</strong>d<strong>in</strong>gsOn average across the EU-27, each <strong>in</strong>dividualgenerated the equivalent of 517 kgof municipal waste <strong>in</strong> 2006, some 6.6 %more than <strong>in</strong> 1996, although slightly lowerthan <strong>in</strong> 2001. Dur<strong>in</strong>g this period, theway <strong>in</strong> which waste was treated changedsignificantly. About 60 % of municipalwaste was put <strong>in</strong>to landfill <strong>in</strong> 1996, <strong>with</strong>a further 14 % be<strong>in</strong>g <strong>in</strong>c<strong>in</strong>erated, the restbe<strong>in</strong>g treated <strong>in</strong> other ways, such as recycl<strong>in</strong>gand compost<strong>in</strong>g. By 2006, the proportionof municipal waste that was put<strong>in</strong>to landfill had decl<strong>in</strong>ed to 41 %, recycl<strong>in</strong>gand compost<strong>in</strong>g becom<strong>in</strong>g a muchmore significant form of treatment <strong>in</strong>many countries.Municipal waste per <strong>in</strong>habitant <strong>in</strong> 2006was between 33 % and 50 % higher thanthe EU-27 average <strong>in</strong> Ireland, Cyprus,Denmark and Luxembourg, <strong>in</strong> each caseris<strong>in</strong>g relatively progressively from levelsrecorded <strong>in</strong> 1996. In contrast, averagewaste levels were between 40 % and 50 %lower than the EU-27 average <strong>in</strong> Polandand the Czech Republic. In the ten yearsthrough to 2006, average municipal wasteper <strong>in</strong>habitant decl<strong>in</strong>ed by 170 kg <strong>in</strong> Bulgaria,the highest decl<strong>in</strong>e of any MemberState, followed closely by Slovenia (158kg), Germany (76 kg) and Poland (42 kg).In Germany, the amount of municipalwaste go<strong>in</strong>g <strong>in</strong>to landfill shrank from225 kg per head <strong>in</strong> 1996 to only 4 kg <strong>in</strong>2006. There were also significant reductionsto below 60 kg per head <strong>in</strong> Belgium,the Netherlands, Austria and Sweden. Incontrast, the amount of municipal wastego<strong>in</strong>g <strong>in</strong>to landfill rose sharply <strong>in</strong> Malta,Romania, Slovakia, Greece and Cyprus.Those countries that reduced the use oflandfill tended to have relatively high levelsof waste <strong>in</strong>c<strong>in</strong>eration <strong>in</strong> 2006. Newly<strong>in</strong>stalled waste <strong>in</strong>c<strong>in</strong>erators are equipped<strong>with</strong> systems for energy recovery. Energystatistics show that a large proportion ofenergy recovery from waste took place <strong>in</strong>France, Germany, Sweden and Spa<strong>in</strong> <strong>in</strong>2006.Under the Waste Statistics Regulation,Member States reported that <strong>in</strong> 2006 <strong>in</strong>the EU-27 about 2 950 million tonnes ofwaste were generated by economic activitiesand by households, of which some 88million tonnes <strong>in</strong>volved hazardous waste.It has to be noted that a large share ofthe total was generated by construction(<strong>in</strong>clud<strong>in</strong>g demolition) activities and bym<strong>in</strong><strong>in</strong>g and quarry<strong>in</strong>g <strong>in</strong>dustries, whilemanufactur<strong>in</strong>g <strong>in</strong>dustries produced themajority of the hazardous waste.About 70 million tonnes of metallic wastewere recovered across the EU-27 <strong>in</strong> 2006,<strong>with</strong> a further 37 million tonnes of paperand cardboard and 12 million tonnes ofglass. A majority of these products wererecovered <strong>in</strong> Germany, Spa<strong>in</strong>, France,Italy and the United K<strong>in</strong>gdom, althougha significant amount of metal recoverytook place <strong>in</strong> Poland (11.4 % of the EU-27total) and of paper and cardboard <strong>in</strong> theNetherlands (7.1 % of the EU-27 total).EUROPE IN FIGURES — <strong>Eurostat</strong> <strong>yearbook</strong> <strong>2009</strong>435
12 EnvironmentFigure 12.9: Municipal waste, EU-27(kg per <strong>in</strong>habitant)60050040030020010001996 1997 1998 1999 2000 2001 2002 2003 2004 2005 2006Municipal waste other treatment (e.g. recycl<strong>in</strong>g, compost<strong>in</strong>g)Municipal waste <strong>in</strong>c<strong>in</strong>eratedMunicipal waste landfilledSource: <strong>Eurostat</strong> (tsien120 and tsien130)436 EUROPE IN FIGURES — <strong>Eurostat</strong> <strong>yearbook</strong> <strong>2009</strong>
Environment 12Table 12.4: Municipal waste(kg per capita)Municipal wastegenerated (1)Municipal wastelandfilled (2)Municipal waste<strong>in</strong>c<strong>in</strong>erated (3)1996 2001 2006 1996 2001 2006 1996 2001 2006EU-27 485 522 517 290 279 213 66 82 98Euro area 525 570 557 265 247 173 86 106 125Belgium 451 467 475 189 54 24 152 160 155Bulgaria 616 491 446 477 392 356 0 0 0Czech Republic 310 273 296 310 214 234 0 35 29Denmark 619 658 737 82 47 37 308 374 405Germany 642 633 566 225 160 4 106 135 179Estonia 396 372 466 396 295 278 0 1 1Ireland 524 705 804 419 540 471 0 0 0Greece 337 417 443 322 380 386 0 0 0Spa<strong>in</strong> 536 658 583 298 364 289 25 37 41France 486 528 553 225 215 192 170 175 183Italy 457 516 548 380 346 284 27 45 65Cyprus 642 703 745 593 634 652 0 0 0Latvia 263 302 411 247 285 292 0 4 2Lithuania 400 377 390 400 335 356 0 0 0Luxembourg 589 650 702 163 131 131 306 275 266Hungary 468 451 468 367 375 376 32 35 39Malta 344 542 652 317 494 562 0 0 0Netherlands 563 615 625 115 50 12 171 199 213Austria 517 578 617 186 192 59 54 65 181Poland 301 290 259 295 278 236 0 0 1Portugal 399 472 435 231 355 274 0 104 95Romania 333 345 385 235 272 326 0 0 0Slovenia 590 479 432 465 358 362 0 0 3Slovakia 275 239 301 172 209 234 28 25 36F<strong>in</strong>land 410 466 488 275 284 286 0 41 42Sweden 385 442 497 126 99 25 147 169 233United K<strong>in</strong>gdom 512 592 588 440 474 353 36 43 55Turkey 471 457 434 345 360 364 0 0 0Iceland 437 469 534 328 353 370 82 53 47Norway 632 635 793 425 274 245 81 99 132Switzerland 602 659 715 69 40 1 282 315 355(1) Breaks <strong>in</strong> series for Estonia (2001), Latvia (2006), Lithuania (1999), Hungary (2000), Malta (1999), Portugal (2002), Slovenia (2002),Slovakia (2002), Turkey (2004) and Switzerland (2004).(2) Breaks <strong>in</strong> series for Estonia (2001), Latvia (2006), Lithuania (1999), Hungary (2000), Malta (1999), Portugal (2002) and Turkey (2004).(3) Break <strong>in</strong> series for Italy (2002).Source: <strong>Eurostat</strong> (tsien120 and tsien130)EUROPE IN FIGURES — <strong>Eurostat</strong> <strong>yearbook</strong> <strong>2009</strong>437
12 EnvironmentTable 12.5: Generation of waste, total aris<strong>in</strong>g and by selected economic activities(1 000 tonnes)Total wastefrom economicactivities andManufactur<strong>in</strong>gM<strong>in</strong><strong>in</strong>g andquarry<strong>in</strong>gConstructionand demolitionOther economicactivitieshouseholds<strong>in</strong>dustryactivitiesactivities (services)2004 2006 2004 2006 2004 2006 2004 2006 2004 2006EU-27 2 918 220 2 946 667 384 676 363 743 862 155 740 743 : : 146 754 155 807Belgium 52 809 59 352 18 177 15 308 384 159 11 037 13 090 8 689 7 039Bulgaria 252 058 242 489 5 611 4 316 222 231 225 338 2 999 1 023 9 181 1 473Czech Republic 29 276 24 746 8 618 5 932 708 472 8 131 8 380 933 1 025Denmark 12 814 12 821 1 555 1 179 0 0 4 274 5 802 1 515 1 486Germany 364 022 363 786 30 163 31 705 55 880 47 222 191 563 196 536 16 343 15 107Estonia 20 861 18 933 6 288 3 981 5 306 5 961 489 717 1 720 1 601Ireland 24 513 30 005 5 356 4 067 4 046 4 793 11 287 16 599 1 184 1 327Greece 34 953 51 325 4 554 5 285 1 902 14 888 3 324 6 829 1 518 1 518Spa<strong>in</strong> 160 668 160 947 28 377 22 427 21 780 26 015 46 320 47 323 14 194 15 376France 429 153 445 865 21 434 22 973 166 1 040 : : 24 158 24 158Italy 139 806 155 025 39 472 39 997 761 1 005 49 151 52 316 3 860 5 534Cyprus 2 332 1 870 557 413 119 60 488 307 403 403Latvia 1 257 1 859 349 570 0 0 8 19 99 239Lithuania 7 010 7 665 2 632 2 948 4 6 357 349 158 586Luxembourg 8 322 9 586 725 604 46 56 6 985 6 775 179 243Hungary 24 661 22 287 5 071 5 528 1 640 27 1 736 3 045 1 965 2 445Malta 2 482 2 861 10 50 0 0 2 206 2 493 160 173Netherlands 88 099 93 808 16 086 15 562 296 213 49 612 56 610 5 276 5 349Austria 53 021 54 287 15 073 11 470 622 1 043 27 935 31 322 2 856 3 458Poland 251 243 266 741 61 514 61 131 38 311 38 671 1 993 14 141 1 965 3 512Portugal 29 272 34 077 10 123 14 699 4 761 3 563 2 626 3 607 4 202 10 352Romania 371 503 331 863 11 156 9 184 326 553 199 138 54 34 3 096 3 841Slovenia 5 771 6 036 1 960 2 385 129 377 908 995 426 429Slovakia 10 668 14 502 3 878 5 527 211 332 1 404 916 761 4 859F<strong>in</strong>land 74 361 72 205 23 266 17 976 23 819 21 501 20 843 23 146 1 276 1 668Sweden 109 741 115 583 27 614 30 363 58 600 62 084 10 272 8 943 1 517 1 517United K<strong>in</strong>gdom 357 544 346 144 35 056 28 161 93 883 86 779 99 234 109 546 39 120 41 088Croatia 7 209 : 3 695 : 347 : 646 : 116 :Turkey 58 820 46 092 16 325 : : : : : 62 :Iceland 501 : 61 : 1 : 19 : 6 :Norway 7 454 9 051 2 956 3 519 116 136 1 101 1 248 865 1 472Source: <strong>Eurostat</strong> (env_wasgen)438 EUROPE IN FIGURES — <strong>Eurostat</strong> <strong>yearbook</strong> <strong>2009</strong>
Environment 12Table 12.6: Waste treatment (non-hazardous), recovery, 2006(1 000 tonnes)MetallicwasteGlasswastePaper andcardboardwasteRubberwastePlasticwasteWoodwasteTextilewasteEU-27 (1) 69 935 11 816 37 789 1 508 : : 1 651Belgium 2 711 282 630 8 130 440 10Bulgaria 1 148 47 125 2 24 0 3Czech Republic 1 307 50 201 13 89 120 18Denmark 942 131 788 54 54 863 :Germany 7 648 2 024 5 922 192 1 119 2 502 68Estonia 4 7 6 6 10 398 0Ireland 31 14 26 9 25 180 7Greece 644 54 425 31 42 63 9Spa<strong>in</strong> 5 083 1 412 3 346 352 1 450 573 79France 10 136 2 174 6 050 230 435 3 727 388Italy (1) 6 981 1 429 3 335 49 959 4 248 244Cyprus 18 4 45 1 26 5 0Latvia 9 1 18 1 8 0 0Lithuania 15 26 141 11 36 34 1Luxembourg : : 0 0 : : 0Hungary 760 21 344 10 49 174 1Malta 0 1 3 1 0 1 0Netherlands 1 910 483 2 688 73 265 1 317 92Austria 1 160 249 1 425 30 164 2 282 34Poland 8 004 136 212 785 446 419 1 294Portugal (1) 558 237 345 43 98 1 109 56Romania 2 319 80 335 9 198 109 4Slovenia 750 : 373 : 22 : :Slovakia 509 11 108 11 29 421 3F<strong>in</strong>land 1 266 149 734 24 5 4 122 0Sweden 1 866 : 1 846 35 : 10 916 0United K<strong>in</strong>gdom 10 538 1 198 4 174 25 426 2 747 117Croatia (1) 16 13 4 1 3 35 0Turkey 9 7 23 2 13 0 1Iceland (1) 0 6 8 4 2 23 1Norway 880 91 670 39 36 348 13(1) 2004.Source: <strong>Eurostat</strong> (env_wastrt)EUROPE IN FIGURES — <strong>Eurostat</strong> <strong>yearbook</strong> <strong>2009</strong>439
12 Environment12.5 Environment and economyIntroductionResources are the backbone of every economy.In us<strong>in</strong>g resources and transform<strong>in</strong>gthem, capital stocks are built up whichadd to the wealth of present and futuregenerations. However, the dimensionsof our current resource use are such thatthe chances of future generations – andthe develop<strong>in</strong>g countries – to have accessto their fair share of scarce resources areendangered. Moreover, the consequencesof our resource use <strong>in</strong> terms of impactson the environment may <strong>in</strong>duce seriousdamages that go beyond the carry<strong>in</strong>g capacityof the environment. These effectsrisk be<strong>in</strong>g aggravated once the develop<strong>in</strong>gworld has taken up growth and resourceuse similar to the levels currently experienced<strong>in</strong> (post-)<strong>in</strong>dustrialised countries.A key component of the EU’s environmentand health action programme <strong>with</strong><strong>in</strong>the sixth EAP is the need for a completeoverhaul of EU policy on chemicalsmanagement. A <strong>Europe</strong>an Regulation (18)on the Registration, Evaluation, Authorisationand restriction of Chemicals(REACH) came <strong>in</strong>to force <strong>in</strong> June 2007.The major objective of REACH is to ensurea high level of protection for humanhealth and the environment, <strong>in</strong>clud<strong>in</strong>gpromotion of alternative methods for theassessment of hazards of substances aswell as the free circulation of substanceson the <strong>in</strong>ternal market while enhanc<strong>in</strong>gcompetitiveness and <strong>in</strong>novation <strong>in</strong> theEU chemical <strong>in</strong>dustry. Through differenttypes of measures, REACH is expectedto lead to a decrease <strong>in</strong> risks to humanhealth and the environment.The EU’s eco-management and auditscheme (EMAS) is a management toolfor enterprises and other organisations toevaluate, report and improve their environmentalperformance. Enterprises havebeen able to participate <strong>in</strong> the schemes<strong>in</strong>ce 1995 (19) . It was orig<strong>in</strong>ally restrictedto enterprises <strong>with</strong><strong>in</strong> the <strong>in</strong>dustrialeconomy, however, s<strong>in</strong>ce 2001 EMAS hasbeen open to all economic sectors <strong>in</strong>clud<strong>in</strong>gpublic and private services. In addition,EMAS was strengthened by the <strong>in</strong>tegrationof the ISO 14001 <strong>in</strong>ternationalstandard, which is primarily concerned<strong>with</strong> environmental management andaims to help organisations establish orimprove an environmental managementsystem, to m<strong>in</strong>imise harmful effects onthe environment caused by its activities,and cont<strong>in</strong>ually improve their environmentalperformance (20) . Organisationsparticipat<strong>in</strong>g <strong>in</strong> EMAS are committedto evaluate and improve their own environmentalperformance, comply <strong>with</strong> relevantenvironmental legislation, preventpollution, and provide relevant <strong>in</strong>formationto the public (via verified environmentalaudits). In July 2008 the <strong>Europe</strong>anCommission proposed to revise EMAS to<strong>in</strong>crease the participation of companiesand reduce the adm<strong>in</strong>istrative burdenand costs, particularly for small and medium-sizedenterprises (21) .(18) http://ec.europa.eu/environment/chemicals/<strong>in</strong>dex.htm.(19) Council Regulation (EEC) No 1836/93 of 29 June 1993; http://eur-lex.europa.eu/LexUriServ/LexUriServ.do?uri=CELEX:31993R1836:EN:HTML.(20) Commission Regulation (EC) No 196/2006 of 3 February 2006 amend<strong>in</strong>g Annex I to Regulation (EC) No 761/2001 of the<strong>Europe</strong>an Parliament and of the Council to take account of the <strong>Europe</strong>an Standard EN ISO 14001:2004, and repeal<strong>in</strong>gDecision 97/265/EC; http://eur-lex.europa.eu/LexUriServ/site/en/oj/2006/l_032/l_03220060204en00040012.pdf.(21) http://ec.europa.eu/environment/emas/pdf/com_2008_402_draft.pdf.440 EUROPE IN FIGURES — <strong>Eurostat</strong> <strong>yearbook</strong> <strong>2009</strong>
Environment 12Def<strong>in</strong>itions and data availabilityResource productivity measures the efficiency<strong>with</strong> which the economy uses energyand materials (the natural resource<strong>in</strong>puts needed to achieve a given economicoutput). If the def<strong>in</strong>ition of naturalresources <strong>in</strong>cludes pollution s<strong>in</strong>ks – thecapacity of the atmosphere, the land areaand the world’s oceans and rivers to absorbwaste and pollution – resource productivityalso measures the economy’sability to produce goods and services relativeto its environmental impacts. Thiswider measure is particularly useful topolicy-makers, because there are press<strong>in</strong>gconcerns regard<strong>in</strong>g the way <strong>in</strong> whichpollution s<strong>in</strong>ks are be<strong>in</strong>g used up as a resource.Resource productivity is def<strong>in</strong>edas GDP divided by domestic materialconsumption (DMC). DMC is related tothe consumption activities of residentsof a national economy (DMC = domesticextraction (DE) plus imports m<strong>in</strong>usexports). The three ma<strong>in</strong> DMC materialcategories (biomass, fossil fuels andm<strong>in</strong>erals) can be further disaggregated<strong>in</strong>to different material categories. It is importantto note that the term consumptionas used <strong>in</strong> DMC denotes apparentconsumption and not f<strong>in</strong>al consumption.DMC does not <strong>in</strong>clude upstream hiddenflows related to imports and exports ofraw materials and products.<strong>Eurostat</strong> has developed a production <strong>in</strong>dexof toxic chemicals. This <strong>in</strong>dicatorpresents the trend <strong>in</strong> aggregated productionvolumes of toxic chemicals, brokendown <strong>in</strong>to five toxicity classes. Theclasses are derived from the Risk Phrasesassigned to the <strong>in</strong>dividual substances <strong>in</strong>Annex 6 of the Dangerous Substance Directive(Council Directive 67/548/EECas last amended <strong>in</strong> 2001). The toxicityclasses, beg<strong>in</strong>n<strong>in</strong>g <strong>with</strong> the most dangerous,are: carc<strong>in</strong>ogenic, mutagenic andreprotoxic (CMR-chemicals); chronictoxic chemicals; very toxic chemicals;toxic chemicals and chemicals classifiedas harmful. Production volumes are extractedfrom Prodcom (statistics on theproduction of manufactured goods) andare aggregated to the five classes accord<strong>in</strong>gto their toxicity. EU-15 data coversthe years from 1995 to 2007, for 2004 to2007 data for EU-25 is available.The eco-management and audit scheme(EMAS) is an EU voluntary <strong>in</strong>strumentwhich acknowledges organisations thatimprove their environmental performanceon a cont<strong>in</strong>uous basis. The scheme<strong>in</strong>tegrates ISO 14001 (InternationalStandard for Environmental ManagementSystem) as its environmental managementsystem element. EMAS registeredorganisations are legally compliant,run an environment management systemand report on their environmental performancethrough the publication of an<strong>in</strong>dependently verified environmentalstatement. They are recognised by theEMAS logo, which guarantees the reliabilityof the <strong>in</strong>formation provided. To receiveEMAS registration an organisationmust comply <strong>with</strong> the follow<strong>in</strong>g steps:• conduct an environmental review;• establish an effective environmentalmanagement system;• carry out an environmental auditand;• provide a statement of its environmentalperformance.EUROPE IN FIGURES — <strong>Eurostat</strong> <strong>yearbook</strong> <strong>2009</strong>441
12 EnvironmentThe EU eco-label scheme, as laid down <strong>in</strong>a Regulation of the <strong>Europe</strong>an Commission(22) is now part of a wider approachon <strong>in</strong>tegrated product policy (IPP). TheCommunity eco-label is awarded toproducts and services <strong>with</strong> reduced environmentalimpacts. It is adm<strong>in</strong>istered bythe <strong>Europe</strong>an eco-labell<strong>in</strong>g board (EUEB)and receives the support of the <strong>Europe</strong>anCommission, all EU Member States andthe <strong>Europe</strong>an Economic Area. The ecolabell<strong>in</strong>gboard <strong>in</strong>cludes representativessuch as <strong>in</strong>dustry, environment protectiongroups and consumer organisations. Thescheme has been <strong>in</strong> operation s<strong>in</strong>ce 1993.Ma<strong>in</strong> f<strong>in</strong>d<strong>in</strong>gsThe efficient use of resources (many ofwhich come from outside the EU) cancontribute to relatively steady growth,whereas <strong>in</strong>efficiency and over-exploitationmay put long-term growth <strong>in</strong> jeopardy.Although the wealth of the EU-15,as measured by GDP, <strong>in</strong>creased on averageby 2.3 % per annum between 1995and 2004, the consumption activities ofthe EU-15’s residents (domestic materialconsumption) rema<strong>in</strong>ed stable over thesame period of time. As a result, resourceproductivity dur<strong>in</strong>g the same period roseby a little over one fifth (22.2 %) <strong>in</strong> theEU-15.The chemicals <strong>in</strong>dustry is one of the largest<strong>Europe</strong>an manufactur<strong>in</strong>g sectors andit has a pivotal role <strong>in</strong> provid<strong>in</strong>g <strong>in</strong>novativematerials and technological solutionswhich have a direct impact on <strong>Europe</strong>’s<strong>in</strong>dustrial competitiveness. Manufacturedchemicals can, however, have anenvironment impact on soil, water and airquality, and chemicals like hydrofluorocarbons(HFCs), perfluorocarbons (PFCs)and sulphur hexafluoride (SF6) were <strong>in</strong>cluded<strong>in</strong> the Kyoto Protocol becausethey are gases related to global warm<strong>in</strong>g.Between 1996 and 2006 the total productionof chemicals grew by 22 % (EU-15).The production of chemicals classified astoxic <strong>in</strong>creased by 16 % over this period,<strong>with</strong> 10 % growth for CMR chemicals, although<strong>in</strong> both cases fall<strong>in</strong>g back slightlyfrom relative highs <strong>in</strong> 2004.The EU Eco-Management and AuditScheme (EMAS) is a management toolfor companies and other organisations toevaluate, report and improve their environmentalperformance. By 2007, by farthe highest uptake was <strong>in</strong> Austria (justunder 60 sites per million <strong>in</strong>habitants),followed by Denmark and Belgium, <strong>with</strong>the only other countries to have a ratio <strong>in</strong>double <strong>figures</strong> be<strong>in</strong>g Spa<strong>in</strong>, Germany andItaly. Denmark and Austria were also atthe forefront of eco-label awards <strong>in</strong> 2007.In a majority of Member States, however,less than one eco-label per million <strong>in</strong>habitantswas awarded by 2007.(22) Regulation (EC) No 1980/2000 of the <strong>Europe</strong>an Parliament and of the Council of 17 July 2000: http://eur-lex.europa.eu/LexUriServ/site/en/oj/2000/l_237/l_23720000921en00010012.pdf.442 EUROPE IN FIGURES — <strong>Eurostat</strong> <strong>yearbook</strong> <strong>2009</strong>
Environment 12Figure 12.10: Resource productivity, EU-15(1995=100)160140120100801995 1996 1997 1998 1999 2000 2001 2002 2003 2004Gross domestic product (GDP)Resource productivityDomestic material consumption (DMC)Source: <strong>Eurostat</strong> (tec00001, tsien140 and tsdpc230)Figure 12.11: Production volume of toxic chemicals, EU-15 (1)(1997=100)13012011010090801997 1998 1999 2000 2001 2002 2003 2004 2005 2006 2007Harmful chemicals Very toxic chemicals All toxic <strong>in</strong>dustrial chemicalsToxic chemicals CMR - chemicals Chronic toxic chemicals(1) In 2007, the volume of toxic chemicals produced <strong>in</strong> the EU-15 was: 317 million tonnes (EU-25: 354 million tonnes; an EU-25 timeseries is only available from 2004 to 2007). The share of substances classified as toxic was 183 million tonnes (EU-25: 206 milliontonnes). Of the EU-25 production volume, start<strong>in</strong>g <strong>with</strong> the most toxic substances, 36 million tonnes were classified as ‘CMRchemicals’,8 million tonnes as ‘chronic toxic’ chemicals, 39 million tonnes as ‘very toxic’, 74 million tonnes as ‘toxic’ and 49 milliontonnes as ‘harmful’ chemicals <strong>in</strong> 2007.Source: <strong>Eurostat</strong> (tsdph320)EUROPE IN FIGURES — <strong>Eurostat</strong> <strong>yearbook</strong> <strong>2009</strong>443
12 EnvironmentFigure 12.12: Number of sites hav<strong>in</strong>g implemented an eco-management and audit scheme(EMAS), 2007 (1)(per million <strong>in</strong>habitants)6050403020100EU-27AustriaDenmarkBelgiumSpa<strong>in</strong>GermanyItalyF<strong>in</strong>landSwedenPortugalUnited K<strong>in</strong>gdomLatviaGreeceCzech RepublicMaltaHungaryEstoniaIrelandSlovakiaNetherlandsSloveniaFrancePolandRomaniaBulgariaCyprusLithuaniaLuxembourgNorway(1) EU-27, Ireland, Greece, Portugal and the United K<strong>in</strong>gdom, estimates.Source: <strong>Eurostat</strong> (tsdpc410 and tps00001), <strong>Europe</strong>an Commission (EMAS)Figure 12.13: Eco-label awards, 2007 (1)(per million <strong>in</strong>habitants)6543210EU-25DenmarkAustriaIrelandItalyMaltaSwedenGreeceFranceLatviaCyprusSloveniaF<strong>in</strong>landGermanyCzech RepublicPortugalSpa<strong>in</strong>BelgiumNetherlandsUnited K<strong>in</strong>gdomPolandHungaryEstoniaLithuaniaLuxembourgSlovakiaNorwayIceland(1) EU-25, Ireland, Greece, Portugal and the United K<strong>in</strong>gdom, estimates; Bulgaria and Romania, not available.Source: <strong>Eurostat</strong> (tsdpc420 and tps00001), Directorate-General Environment444 EUROPE IN FIGURES — <strong>Eurostat</strong> <strong>yearbook</strong> <strong>2009</strong>
Environment 1212.6 BiodiversityIntroductionA contraction of biological diversity, biodiversityreflects the number, variety andvariability of liv<strong>in</strong>g organisms, <strong>in</strong>clud<strong>in</strong>gmank<strong>in</strong>d. The global scale of the biodiversityissue has led to <strong>in</strong>ternational action<strong>with</strong><strong>in</strong> this doma<strong>in</strong>, <strong>with</strong> the frameworkfor action be<strong>in</strong>g the United Nations(UN) convention on biological diversity(CBD), which the EU ratified <strong>in</strong> 1993.In 1998, the EU adopted a biodiversitystrategy. Four biodiversity action planswere adopted under this strategy <strong>in</strong> 2001(conservation of natural resources, agriculture,fisheries, economic and developmentcooperation).At the United Nations world summit onsusta<strong>in</strong>able development <strong>in</strong> Johannesburg<strong>in</strong> 2002, governments committed themselvesto significantly reduc<strong>in</strong>g the rateof biodiversity loss by 2010. A numberof concrete measures and a programmeof fund<strong>in</strong>g to help achieve this goal werereached at a UN Conference <strong>in</strong> Bonn <strong>in</strong>May 2008.The EU has also set itself the objective ofhalt<strong>in</strong>g the loss of biodiversity on its ownterritory by 2010 (23) . Nature and biodiversityis one of four priorities of the EU’ssixth environment action programme(2002-12), together <strong>with</strong> climate change,resource and waste management, andhealth <strong>in</strong> relation to the environment.Def<strong>in</strong>itions and data availabilityEU policy on nature conservation is partof the EU’s biodiversity strategy. It is essentiallybased on the implementation oftwo Directives: Council Directive 92/43/EEC of 21 May 1992 (the habitats Directive)on the conservation of natural habitatsand of wild fauna and flora (24 ) andCouncil Directive 79/409/EEC of 2 April1979 (the birds Directive) on the conservationof wild birds, which <strong>in</strong>cludesthe sett<strong>in</strong>g-up of a coherent <strong>Europe</strong>anecological network of sites under the titleNatura 2000.Annual data are available on protectedareas under the habitats Directive andthese are presented as a percentage of totalcountry area. The <strong>in</strong>dicator on protectedareas is based on territories proposed bycountries to be designated for the protectionof natural and semi-natural habitats,wild fauna and flora accord<strong>in</strong>g to thehabitats Directive. The <strong>in</strong>dex of sufficiencymeasures the extent to which sites ofCommunity importance proposed by theMember States adequately cover the speciesand habitats listed <strong>in</strong> the annexes Iand II of the Habitats Directive.Birds are considered good proxies forbiodiversity and the <strong>in</strong>tegrity of ecosystemsas they tend to be at, or near, the topof the food cha<strong>in</strong>, have large ranges andcan migrate and thus reflect changes <strong>in</strong>(23) COM(2006) 216 f<strong>in</strong>al; http://ec.europa.eu/development/icenter/repository/com2006_0216en01_en.pdf.(24) Council Directive 79/409/EEC of 2 April 1979 (birds Directive) and Council Directive 92/43/EEC of 21 May 1992 (habitatDirective); http://eur-lex.europa.eu/LexUriServ/LexUriServ.do?uri=CELEX:31979L0409:EN:HTML.EUROPE IN FIGURES — <strong>Eurostat</strong> <strong>yearbook</strong> <strong>2009</strong>445
12 Environmentecosystems rather rapidly. By focus<strong>in</strong>g attentionon the population trends of relativelylarge groups of abundant <strong>Europe</strong>anspecies associated <strong>with</strong> different habitats,these <strong>in</strong>dicators are designed to capturethe overall, average changes <strong>in</strong> populationlevels of common birds to reflect thehealth and function<strong>in</strong>g of ecosystems.The population <strong>in</strong>dex of common birdsis an aggregated <strong>in</strong>dex (<strong>with</strong> base year1990 or the first year the Member Stateentered the scheme) of population trendestimates of a selected group of commonbird species. Indices are calculatedfor each species <strong>in</strong>dependently and arethen comb<strong>in</strong>ed to create a multi-speciesEU <strong>in</strong>dicator by averag<strong>in</strong>g the <strong>in</strong>dices<strong>with</strong> an equal weight us<strong>in</strong>g a geometricmean. Indices are averaged rather thanbird abundance <strong>in</strong> order to give each speciesan equal weight <strong>in</strong> the result<strong>in</strong>g <strong>in</strong>dicator.The EU <strong>in</strong>dex is based on trenddata from 18 Member States, derivedfrom annually operated national breed<strong>in</strong>gbird surveys obta<strong>in</strong>ed through thepan-<strong>Europe</strong>an common bird monitor<strong>in</strong>gscheme (PECBMS). Three different <strong>in</strong>dicesare presented, cover<strong>in</strong>g: farmland (36species), forest (29 species) and ‘all commonbirds’ (135 species). For the first twocategories, the bird species have a highdependence on the habitats <strong>in</strong> the nest<strong>in</strong>gseason and for feed<strong>in</strong>g dur<strong>in</strong>g mostof the year; the aggregate <strong>in</strong>dex regroupsfarmland and forest species together <strong>with</strong>other common species.Ma<strong>in</strong> f<strong>in</strong>d<strong>in</strong>gsProtected areas for biodiversity are basedon areas proposed by countries under theHabitats Directive and reflect the share ofthe total area of a country. About 13 % ofthe EU-25’s territory was considered asa protected area <strong>in</strong> 2007, but <strong>in</strong>dividualMember States can have a much highershare, for example, a little above 30 % <strong>in</strong>Slovenia.There was a negative trend <strong>in</strong> the past 25years for common bird species, <strong>in</strong> particularfor common farmland birds, whichhave become more threatened dur<strong>in</strong>g theperiod considered. Part of the relativelysteep decl<strong>in</strong>e <strong>in</strong> numbers of commonfarmland bird species may be expla<strong>in</strong>edby changes <strong>in</strong> land use and agriculturalpractices which affect birds’ capacityfor nest<strong>in</strong>g or feed<strong>in</strong>g. After a couple ofyears of limited upturn, the populationof farmland species fell relatively sharplyaga<strong>in</strong> <strong>in</strong> 2006. In contrast, the <strong>in</strong>dex forforest birds showed some improvementcompared <strong>with</strong> its relative low recorded<strong>in</strong> 2000, despite a contraction between2004 and 2005.446 EUROPE IN FIGURES — <strong>Eurostat</strong> <strong>yearbook</strong> <strong>2009</strong>
Environment 12Figure 12.14: Protected areas for biodiversity: habitats Directive, 2007 (1)1007550250EU-25BelgiumCzech RepublicDenmarkGermanyEstoniaIrelandGreeceSpa<strong>in</strong>FranceItalyCyprusLatviaLithuaniaLuxembourgHungaryMaltaNetherlandsAustriaPolandPortugalSloveniaSlovakiaF<strong>in</strong>landSwedenUnited K<strong>in</strong>gdomArea proposed under the habitats Directive (as a % of total area) Sufficiency of sites (%)(1) Bulgaria and Romania, not available.Source: EEA/<strong>Europe</strong>an Topic Centre on Biodiversity, <strong>Eurostat</strong> (env_bio1)Figure 12.15: Common bird <strong>in</strong>dices, EU (1)(aggregated <strong>in</strong>dex of population estimates of a selected group of breed<strong>in</strong>g bird species dependent onagricultural land for nest<strong>in</strong>g or feed<strong>in</strong>g, 1990=100)1101009080701990 1991 1992 1993 1994 1995 1996 1997 1998 1999 2000 2001 2002 2003 2004 2005 2006Common bird <strong>in</strong>dex - all common speciesCommon bird <strong>in</strong>dex - common forest speciesCommon bird <strong>in</strong>dex - common farmland species(1) Based on <strong>in</strong>formation for Belgium, Bulgaria, the Czech Republic, Denmark, Germany, Estonia, Ireland, Spa<strong>in</strong>, France, Italy,Latvia, Hungary, the Netherlands, Austria, Poland, Portugal, F<strong>in</strong>land, Sweden and the United K<strong>in</strong>gdom; ‘all common species’ covers<strong>in</strong>formation on 135 different bird species; ‘common farmland species’ covers 36 bird species; ‘common forest species’ covers 29 birdspecies.Source: EBCC/RSPB/BirdLife/Statistics Netherlands, <strong>Eurostat</strong> (env_bio2)EUROPE IN FIGURES — <strong>Eurostat</strong> <strong>yearbook</strong> <strong>2009</strong>447
EnergyA competitive, reliable and susta<strong>in</strong>able energy sector is essential for an economy, andthis has been put under the spotlight <strong>in</strong> recent years by a number of issues, <strong>in</strong>clud<strong>in</strong>gthe volatility <strong>in</strong> oil prices, <strong>in</strong>terruptions to energy supply from non-member countries,blackouts aggravated by <strong>in</strong>efficient connections between national electricity networks,the difficulties of market access for suppliers <strong>in</strong> relation to gas and electricity markets,and <strong>in</strong>creased attention to climate change. These issues have pushed energy towardsthe top of national and <strong>Europe</strong>an political agendas.The use of renewable energy sources is seen as a key element <strong>in</strong> energy policy, reduc<strong>in</strong>gthe dependence on fuel from non-member countries, reduc<strong>in</strong>g emissions from carbonsources, and decoupl<strong>in</strong>g energy costs from oil prices. The second key element is constra<strong>in</strong><strong>in</strong>gdemand, by promot<strong>in</strong>g energy efficiency both <strong>with</strong><strong>in</strong> the energy sector itselfand at end-use.In January 2007 the <strong>Europe</strong>an Commission adopted a communication (COM(2007) 1)propos<strong>in</strong>g an energy policy for <strong>Europe</strong> (1) , <strong>with</strong> the goal to combat climate change andboost the EU’s energy security and competitiveness. This set out the need for the EU todraw up a new energy path towards a more secure, susta<strong>in</strong>able and low-carbon economy,for the benefit of all users. Based on the <strong>Europe</strong>an Commission’s proposal, <strong>in</strong>March 2007 the Council endorsed the follow<strong>in</strong>g targets:• reduc<strong>in</strong>g greenhouse gas emissions by at least 20 % (compared <strong>with</strong> 1990 levels) by2020;• improv<strong>in</strong>g energy efficiency by 20 % by 2020;• rais<strong>in</strong>g the share of renewable energy to 20 % by 2020;• <strong>in</strong>creas<strong>in</strong>g the level of renewables (such as biofuels) <strong>in</strong> transport fuel to 10 % by2020.(1) http://ec.europa.eu/energy/energy_policy/<strong>in</strong>dex_en.htm.EUROPE IN FIGURES — <strong>Eurostat</strong> <strong>yearbook</strong> <strong>2009</strong>449
13 Energy13.1 Energy production andimportsIn a Communication <strong>in</strong> November 2007,the <strong>Europe</strong>an Commission put forwarda strategic energy technology plan (SETplan)‘Towards a low carbon future’ (2) .This aims to support decarbonised energytechnologies, such as off-shore w<strong>in</strong>d,solar technology, or second generation biomass,by accelerat<strong>in</strong>g their developmentand implementation. In January 2008 the<strong>Europe</strong>an Commission proposed a packageof measures (3) related to energy andthe climate, to supplement the exist<strong>in</strong>gmeasures for achiev<strong>in</strong>g the agreed targets.The <strong>Europe</strong>an Council, on 11 and 12 December2008 (4) , reached an agreement onthe energy/climate change package whichshould enable this package to be f<strong>in</strong>alised<strong>with</strong> the <strong>Europe</strong>an Parliament by the endof 2008. This decisive breakthrough willenable the EU to honour commitmentsentered <strong>in</strong>to dur<strong>in</strong>g 2007 and to ma<strong>in</strong>ta<strong>in</strong>its lead<strong>in</strong>g role <strong>in</strong> the search for an ambitiousand comprehensive global agreementat Copenhagen <strong>in</strong> <strong>2009</strong>.In order to meet the <strong>in</strong>creas<strong>in</strong>g requirementsof policy-makers for energy monitor<strong>in</strong>g,<strong>Eurostat</strong> has developed a coherentand harmonised system of energy statistics.Annual data collection covers the 27Member States of the EU, the candidatecountries of Croatia and Turkey, and the<strong>Europe</strong>an Free Trade Association countriesof Iceland, Norway and Switzerland;time-series run back to 1985 for somecountries, but are more generally availablefrom 1990. Although not presented<strong>in</strong> this <strong>yearbook</strong>, monthly data are alsoavailable.IntroductionEnergy commodities extracted or captureddirectly from natural resourcesare called primary energy sources. Allenergy commodities which are producedfrom primary sources <strong>in</strong> transformationplants are called derived products.Primary energy production covers thenational production of primary energysources. Whenever consumption exceedsprimary production the shortfallis accounted for by imports of primaryor derived products. The dependency ofthe EU on imports, particularly for oiland more recently for gas, has formed thebackdrop for policy concerns relat<strong>in</strong>g tothe security of supply.Def<strong>in</strong>itions and data availabilityAny k<strong>in</strong>d of extraction of energy productsfrom natural sources to a usable form iscalled primary production. Primaryproduction takes place when the naturalsources are exploited, for example, <strong>in</strong>coal m<strong>in</strong>es, crude oil fields, hydro powerplants or fabrication of biofuels. It is thesum of energy extraction, heat produced<strong>in</strong> reactors as a result of nuclear fission,and the use of renewable energy sources.Transformation of energy from one formto another, like electricity or heat generation<strong>in</strong> thermal power plants or cokeproduction <strong>in</strong> coke ovens is not primaryproduction.(2) http://ec.europa.eu/energy/res/setplan/<strong>in</strong>dex_en.htm.(3) http://ec.europa.eu/commission_barroso/president/focus/energy-package-2008/<strong>in</strong>dex_en.htm.(4) http://www.consilium.europa.eu/ueDocs/cms_Data/docs/pressData/en/ec/104692.pdf.450 EUROPE IN FIGURES — <strong>Eurostat</strong> <strong>yearbook</strong> <strong>2009</strong>
Energy 13The heat produced <strong>in</strong> a reactor as a resultof nuclear fission is regarded as primaryproduction of nuclear heat, or <strong>in</strong> otherwords nuclear energy. It is either the actualheat produced or calculated on thebasis of reported gross electricity generationand the thermal efficiency of the nuclearplant. Primary production of coaland lignite consists of quantities of fuelsextracted or produced, calculated afterany operation for removal of <strong>in</strong>ert matter.Primary production of biomass, hydropower,geothermal energy, w<strong>in</strong>d andsolar energy are <strong>in</strong>cluded <strong>in</strong> renewableenergies:• biomass (heat content of the producedbiofuels or biogas; heat produced aftercombustion dur<strong>in</strong>g <strong>in</strong>c<strong>in</strong>eration ofrenewable wastes);• hydropower covers potential and k<strong>in</strong>eticenergy of water converted <strong>in</strong>toelectricity <strong>in</strong> hydroelectric plants (theelectricity generated <strong>in</strong> pumped storageplants is not <strong>in</strong>cluded);• geothermal energy comprises energyavailable as heat emitted from <strong>with</strong><strong>in</strong>the earth’s crust, usually <strong>in</strong> the formof hot water or steam;• w<strong>in</strong>d energy covers the k<strong>in</strong>etic energyof w<strong>in</strong>d converted <strong>in</strong>to electricity <strong>in</strong>w<strong>in</strong>d turb<strong>in</strong>es;• solar energy covers the solar radiationexploited for solar heat (hot water)and electricity production.Net imports are simply calculated as thequantity of imports m<strong>in</strong>us the equivalentquantity of exports. Imports represent allentries <strong>in</strong>to the national territory exclud<strong>in</strong>gtransit quantities (notably via gas andoil pipel<strong>in</strong>es); electrical energy is an exceptionand its transit is always recordedunder foreign trade. Exports similarlycover all quantities exported from the nationalterritory.The energy dependency rate is def<strong>in</strong>ed asnet imports divided by gross consumption,expressed as a percentage; grossconsumption is equal to gross <strong>in</strong>landconsumption plus the energy (oil) suppliedto <strong>in</strong>ternational mar<strong>in</strong>e bunkers.Gross <strong>in</strong>land consumption covers consumptionby the energy branch itself, distributionand transformation losses, andf<strong>in</strong>al non-energy and energy consumption.A negative dependency rate <strong>in</strong>dicatesa net exporter of energy. A dependencyrate <strong>in</strong> excess of 100 % <strong>in</strong>dicatesthat energy products have been stocked.Gross <strong>in</strong>land consumption is calculatedas follows: primary production + recoveredproducts + net imports + variationsof stocks – bunkers. It corresponds to theaddition of consumption, distributionlosses, transformation losses and statisticaldifferences.Ma<strong>in</strong> f<strong>in</strong>d<strong>in</strong>gsProduction of primary energy <strong>in</strong> theEU-27 totalled 871 million tonnes of oilequivalent (toe) <strong>in</strong> 2006. Production wasdom<strong>in</strong>ated by the United K<strong>in</strong>gdom <strong>with</strong>a 21 % share of the EU-27 total, whileFrance and Germany were the only otherMember States to report production <strong>in</strong>excess of 100 million toe.Primary energy production <strong>in</strong> the EU-27<strong>in</strong> 2006 was concentrated among nuclearenergy, solid fuels (ma<strong>in</strong>ly coal) and naturalgas. However, the pace at which theprimary production of renewable energywas grow<strong>in</strong>g exceeded that of all the otherenergy types, <strong>with</strong> particularly stronggrowth s<strong>in</strong>ce 2002. The production ofcoal and lignite, crude oil, and naturalgas fell <strong>in</strong> recent years: crude oil outputpeaked <strong>in</strong> 1999, and natural gas twoyears later. As a result of these differentEUROPE IN FIGURES — <strong>Eurostat</strong> <strong>yearbook</strong> <strong>2009</strong>451
13 Energydevelopments, the production of primaryenergy from renewable sources <strong>in</strong> 2006exceeded that from oil for the first time<strong>in</strong> the available time-series.Among renewable energies, the most importantsource was biomass and waste,represent<strong>in</strong>g over 87 million toe of primaryproduction <strong>in</strong> the EU-27 <strong>in</strong> 2006.Hydropower was the only other significantcontributor to the renewable energymix (27 million toe). Although productionstill rema<strong>in</strong>s small, there has been aparticularly rapid expansion <strong>in</strong> the productionof w<strong>in</strong>d energy, reach<strong>in</strong>g 7 milliontoe <strong>in</strong> the EU-27 <strong>in</strong> 2006.The EU-27’s imports of primary energyexceeded exports by some 1 010 milliontoe <strong>in</strong> 2006. The largest net importers ofprimary energy were usually the largestMember States, <strong>with</strong> the exception ofthe United K<strong>in</strong>gdom and Poland (bothof whom have significant primary production,ma<strong>in</strong>ly oil, natural gas or coal).S<strong>in</strong>ce 2004 the only net exporter amongthe Member States has been Denmark.The sources of EU energy imports havechanged rapidly <strong>in</strong> recent years. In 2006the EU-27’s imports of crude oil fromRussia were more than double those fromNorway, whereas <strong>in</strong> 2000 Norway’s andRussia’s deliveries to the EU-27 had beenpractically the same. For natural gas thesame two countries were also the biggestsuppliers to the EU-27 market <strong>in</strong> 2006:although Russia’s contribution to EU importsof natural gas has decl<strong>in</strong>ed <strong>in</strong> recentyears <strong>in</strong> percentage terms, <strong>in</strong> 2006 it stillsupplied two fifths of the total.S<strong>in</strong>ce 2004 the EU-27’s net imports of energyhave been greater than its primaryproduction of energy, witnessed by its dependencyrate exceed<strong>in</strong>g 50 % (mean<strong>in</strong>gthat more than half of gross <strong>in</strong>land consumptionwas supplied by net importsrather than primary production). In 2005the dependency rate <strong>in</strong>creased to reach52.6 % and <strong>in</strong> 2006 it <strong>in</strong>creased furtherto 53.8 %. Energy dependency ratios werehighest for crude oil and petroleum products(83 %), although the dependency onnon-member countries for supplies ofsolid fuels and natural gas grew at a fasterpace <strong>in</strong> the last decade than the EU’s dependencyon oil (which was already at ahigh rate). As it was a net exporter, Denmarkwas the only Member State <strong>in</strong> 2006<strong>with</strong> a negative dependency rate. Amongthe other Member States the lowest dependencyrates were recorded by Polandand the United K<strong>in</strong>gdom, while Cyprus,Malta and Luxembourg were all almostentirely dependent on imports.452 EUROPE IN FIGURES — <strong>Eurostat</strong> <strong>yearbook</strong> <strong>2009</strong>
Energy 13Table 13.1: Total production of primary energy(million tonnes of oil equivalent)1996 1997 1998 1999 2000 2001 2002 2003 2004 2005 2006Share <strong>in</strong>EU-27,2006 (%)EU-27 971.4 962.5 940.5 942.8 933.0 933.0 933.2 927.2 923.1 891.4 871.2 100.0Euro area 459.4 448.6 435.0 436.5 434.9 440.1 442.9 446.1 458.6 448.9 451.7 51.8Belgium 11.3 12.6 12.0 13.3 13.1 12.7 12.9 13.1 13.2 13.5 13.4 1.5Bulgaria 10.6 9.8 10.2 9.0 9.8 10.3 10.5 10.1 10.2 10.6 10.9 1.3Czech Republic 32.2 32.3 30.5 27.7 29.6 30.2 30.4 34.1 32.8 32.4 33.1 3.8Denmark 17.7 20.2 20.3 23.7 27.7 27.1 28.5 28.4 31.0 31.3 29.5 3.4Germany 138.8 138.5 131.7 134.6 132.1 133.1 133.9 135.2 137.0 135.7 136.9 15.7Estonia 3.7 3.6 3.2 3.0 3.2 3.4 3.7 4.2 4.0 4.2 3.9 0.4Ireland 3.5 2.8 2.4 2.5 2.2 1.8 1.5 1.8 1.8 1.6 1.6 0.2Greece 10.1 9.9 10.0 9.4 9.9 9.9 10.5 9.9 10.3 10.3 10.1 1.2Spa<strong>in</strong> 32.0 30.7 32.0 30.3 31.2 32.9 31.6 32.8 32.4 30.1 31.2 3.6France 131.0 128.1 125.1 127.2 131.1 131.7 133.4 134.8 135.7 135.5 135.6 15.6Italy 30.1 30.3 30.1 29.0 26.8 25.7 26.3 27.3 28.1 27.7 27.1 3.1Cyprus 0.0 0.0 0.0 0.0 0.0 0.0 0.0 0.0 0.0 0.0 0.1 0.0Latvia 1.4 1.6 1.8 1.6 1.4 1.5 1.6 1.7 1.8 1.9 1.8 0.2Lithuania 4.3 3.9 4.4 3.5 3.2 4.1 4.8 5.1 5.0 3.7 3.2 0.4Luxembourg 0.0 0.0 0.1 0.0 0.1 0.1 0.1 0.1 0.1 0.1 0.1 0.0Hungary 13.1 12.8 11.9 11.5 11.2 10.8 11.1 10.7 10.2 10.4 10.3 1.2Malta - - - - - - - - - - - -Netherlands 74.0 65.7 62.9 59.4 57.2 60.9 60.4 58.4 67.7 61.9 60.8 7.0Austria 8.4 8.5 8.7 9.4 9.6 9.6 9.7 9.5 9.7 9.3 9.6 1.1Poland 97.8 99.1 86.8 82.8 78.4 79.4 79.1 78.7 78.0 77.7 76.8 8.8Portugal 3.8 3.8 3.7 3.4 3.8 3.9 3.6 4.3 3.9 3.6 4.3 0.5Romania 33.0 31.6 29.2 28.1 28.7 27.6 28.0 28.3 28.4 27.5 27.4 3.1Slovenia 3.0 3.0 3.0 2.9 3.1 3.1 3.4 3.2 3.4 3.5 3.4 0.4Slovakia 4.7 4.6 4.7 5.2 6.0 6.4 6.5 6.3 6.2 6.3 6.3 0.7F<strong>in</strong>land 13.4 14.8 13.1 15.2 14.7 14.7 15.6 15.5 15.4 16.2 17.8 2.0Sweden 31.5 32.0 33.0 32.7 30.0 33.3 31.2 30.4 33.8 34.2 32.3 3.7United K<strong>in</strong>gdom 261.9 262.3 269.5 277.6 269.1 258.7 254.9 243.2 223.2 202.5 183.9 21.1Croatia 4.2 4.1 4.0 3.6 3.6 3.7 3.7 3.7 3.9 3.8 4.1 -Turkey 27.2 28.0 29.1 27.5 26.8 25.2 24.6 23.9 24.2 23.6 26.5 -Iceland 1.6 1.7 1.8 2.2 2.3 2.5 2.5 2.5 2.5 2.6 3.3 -Norway 208.1 212.7 206.6 209.6 225.0 228.9 233.6 236.0 238.5 234.0 223.7 -Switzerland 10.0 10.5 10.6 11.2 11.1 11.7 11.2 11.4 11.4 10.5 11.8 -Source: <strong>Eurostat</strong> (ten00076)EUROPE IN FIGURES — <strong>Eurostat</strong> <strong>yearbook</strong> <strong>2009</strong>453
13 EnergyFigure 13.1: Production of primary energy, EU-27, 2006(% of total, based on tonnes of oil equivalent)Natural gas20.6%Crude oil13.4%Solid fuels21.9%Nuclear energy29.4%Renewable energy14.7%100%75%50%25%0%1Solar energyGeothermal energyW<strong>in</strong>dHydropowerBiomass and wasteSource: <strong>Eurostat</strong> (ten00080, ten00077, ten00079, ten00078, ten00081, ten00082 and ten00076)Figure 13.2: Development of the production of primary energy (by fuel type), EU-27(1995=100, based on tonnes of oil equivalent)15012510075501995 1996 1997 1998 1999 2000 2001 2002 2003 2004 2005 2006Renewable energyNuclear energyNatural gasTotal productionCrude oilSolid fuelsSource: <strong>Eurostat</strong> (ten00081, ten00080, ten00079, ten00076, ten00078 and ten00077)454 EUROPE IN FIGURES — <strong>Eurostat</strong> <strong>yearbook</strong> <strong>2009</strong>
Energy 13Table 13.2: Net imports of primary energy(million tonnes of oil equivalent)1996 1997 1998 1999 2000 2001 2002 2003 2004 2005 2006Share <strong>in</strong>EU-27,2006 (%)EU-27 774.0 784.7 813.9 790.8 826.3 857.5 858.2 904.5 941.0 986.2 1 010.1 100.0Euro area 698.8 716.4 752.2 752.7 783.2 792.6 800.5 822.7 834.5 854.4 855.2 84.7Belgium 49.4 49.3 52.1 49.2 50.8 51.3 49.3 53.2 53.9 53.8 53.5 5.3Bulgaria 13.2 10.8 10.1 8.9 8.7 9.0 8.9 9.3 9.2 9.5 9.5 0.9Czech Republic 10.6 10.6 10.6 9.8 9.4 10.7 11.4 11.4 11.7 12.9 12.9 1.3Denmark 5.5 3.9 1.3 -3.4 -7.3 -5.8 -8.6 -6.9 -9.9 -10.4 -8.1 -0.8Germany 208.8 209.4 214.0 203.7 205.7 216.7 209.3 213.0 215.5 215.3 215.5 21.3Estonia 2.0 1.9 2.0 1.9 1.6 1.7 1.5 1.5 1.7 1.5 1.9 0.2Ireland 8.4 9.5 10.7 11.7 12.3 13.7 13.7 13.6 13.9 13.7 14.2 1.4Greece 18.9 19.3 21.2 19.8 22.1 22.4 23.3 22.6 24.7 23.4 24.9 2.5Spa<strong>in</strong> 74.3 80.8 88.4 95.3 99.3 99.8 108.0 109.1 115.3 124.0 123.8 12.3France 125.0 122.8 132.4 132.8 134.2 136.8 137.5 138.9 141.5 144.3 141.7 14.0Italy 134.8 134.9 140.7 144.2 153.4 148.3 153.4 156.4 159.5 161.0 164.6 16.3Cyprus 2.2 2.1 2.2 2.4 2.5 2.5 2.6 2.7 2.4 2.8 3.0 0.3Latvia 3.5 2.7 2.6 2.2 2.2 2.5 2.5 2.8 3.2 3.0 3.2 0.3Lithuania 5.1 5.1 4.8 4.4 4.3 3.9 3.7 4.1 4.4 5.1 5.5 0.5Luxembourg 3.4 3.3 3.3 3.4 3.6 3.7 4.0 4.2 4.5 4.6 4.7 0.5Hungary 13.9 13.6 14.4 13.9 14.0 13.9 14.8 16.4 16.1 17.5 17.3 1.7Malta 0.9 1.0 0.9 1.0 0.8 0.7 0.9 0.9 0.9 1.0 0.9 0.1Netherlands 14.8 23.7 24.5 26.9 35.4 32.6 32.5 36.7 31.4 38.4 37.2 3.7Austria 20.1 19.4 20.5 19.2 19.1 20.0 21.2 23.1 23.5 24.7 24.9 2.5Poland 5.6 6.6 8.2 9.7 10.3 9.5 10.2 12.1 13.5 16.9 19.6 1.9Portugal 16.9 18.6 19.6 22.3 21.9 21.8 22.5 22.4 22.7 24.4 21.6 2.1Romania 15.0 14.8 11.9 8.0 8.1 9.5 9.1 10.2 11.9 10.8 11.9 1.2Slovenia 3.5 3.6 3.4 3.6 3.4 3.4 3.5 3.7 3.7 3.8 3.8 0.4Slovakia 13.3 13.2 12.5 11.7 11.6 12.2 12.6 12.7 13.2 12.5 12.0 1.2F<strong>in</strong>land 17.5 18.7 18.5 17.3 18.6 18.9 18.8 22.4 21.0 19.3 20.9 2.1Sweden 21.3 19.8 19.9 18.2 19.3 19.3 19.9 22.8 20.4 20.2 19.8 2.0United K<strong>in</strong>gdom -33.4 -34.8 -36.6 -47.2 -39.2 -21.6 -28.2 -14.6 11.1 32.3 49.3 4.9Croatia 3.2 3.7 4.0 4.4 4.2 4.2 5.0 5.0 5.1 5.3 4.9 -Turkey 41.0 42.9 43.6 43.5 51.1 46.2 51.1 56.8 58.7 62.1 69.3 -Iceland 0.9 0.9 0.9 1.0 1.0 0.9 1.0 0.9 1.1 1.1 1.1 -Norway -182.5 -187.4 -180.6 -182.0 -198.3 -203.3 -208.7 -207.1 -210.0 -200.6 -197.6 -Switzerland 14.9 14.8 15.3 14.0 14.0 15.2 15.0 14.7 15.1 16.2 16.1 -Source: <strong>Eurostat</strong> (ten00083)EUROPE IN FIGURES — <strong>Eurostat</strong> <strong>yearbook</strong> <strong>2009</strong>455
13 EnergyTable 13.3: Ma<strong>in</strong> orig<strong>in</strong> of primary energy imports, EU-27(% of extra EU-27 imports)Crude oil2000 2001 2002 2003 2004 2005 2006Russia 20.3 24.8 29.0 30.9 32.8 32.4 32.9Norway 21.0 19.6 19.3 19.2 18.9 16.8 15.5Libya 8.2 7.9 7.3 8.3 8.7 8.7 9.3Saudi Arabia 11.8 10.4 10.0 11.1 11.2 10.5 8.9Iran 6.4 5.7 4.9 6.3 6.2 6.1 6.3Kazakhstan 1.8 1.6 2.5 2.9 3.9 4.5 4.7Nigeria 4.1 4.7 3.5 4.2 2.6 3.2 3.5Iraq 5.7 3.7 3.0 1.5 2.2 2.1 2.9Algeria 3.9 3.5 3.4 3.4 3.8 3.9 2.9Azerbaijan 0.7 0.8 1.0 1.0 0.9 1.2 2.1Venezuela 1.3 1.6 1.7 0.9 0.8 1.2 1.9Others 15.0 15.5 14.4 10.2 8.1 9.4 9.2Natural gas2000 2001 2002 2003 2004 2005 2006Russia 49.6 48.8 46.1 46.1 44.5 41.8 40.4Norway 21.7 23.6 26.3 25.4 25.2 22.5 23.3Algeria 24.1 21.6 21.6 20.3 18.4 19.0 17.5Nigeria 1.9 2.4 2.2 3.2 3.7 3.7 4.6Libya 0.4 0.4 0.3 0.3 0.4 1.8 2.6Egypt 0.0 0.0 0.0 0.0 0.0 1.7 2.6Qatar 0.1 0.3 0.9 0.8 1.4 1.7 2.0Tr<strong>in</strong>idad and Tobago 0.4 0.3 0.2 0.0 0.0 0.3 1.3Uzbekistan 0.4 0.3 0.0 0.3 0.2 0.5 1.0Croatia 0.0 0.0 0.0 0.0 0.0 0.0 0.4Turkmenistan 0.0 0.0 0.0 0.1 0.1 0.7 0.3Others 1.5 2.0 2.0 3.3 5.6 5.7 3.7Source: <strong>Eurostat</strong> (nrg_123a and nrg_124a)456 EUROPE IN FIGURES — <strong>Eurostat</strong> <strong>yearbook</strong> <strong>2009</strong>
Energy 13Table 13.4: Energy dependency rate, EU-27(% of net imports <strong>in</strong> gross <strong>in</strong>land consumption and bunkers, based on tonnes of oil equivalent)1996 1997 1998 1999 2000 2001 2002 2003 2004 2005 2006All products 44.1 45.0 46.1 45.2 46.8 47.5 47.6 48.9 50.3 52.6 53.8Hard coal 31.8 34.8 36.3 38.4 42.7 47.2 47.3 49.0 53.8 55.8 58.5Crude oil and petroleum 75.6 75.9 77.2 73.1 76.0 77.4 76.1 78.4 79.9 82.4 83.6Natural gas 43.5 45.2 45.7 47.9 48.9 47.3 51.2 52.5 54.0 57.7 60.8Source: <strong>Eurostat</strong> (nrg_100a, nrg_101a, nrg_102a and nrg_103a)Figure 13.3: Energy dependency rate - all products, 2006 (1)(% of net imports <strong>in</strong> gross <strong>in</strong>land consumption and bunkers, based on tonnes of oil equivalent)2001000-100-200-300-400-500-600-700-800EU-27Euro areaCyprusMaltaLuxembourgIrelandItalyPortugalSpa<strong>in</strong>BelgiumAustriaGreeceLatviaLithuaniaSlovakiaHungaryGermanyF<strong>in</strong>landSloveniaFranceBulgariaNetherlandsSwedenEstoniaRomaniaCzech RepublicUnited K<strong>in</strong>gdomPolandDenmarkTurkeySwitzerlandCroatiaIcelandNorway(1) EU-27 and Slovenia, provisional.Source: <strong>Eurostat</strong> (tsdcc310)EUROPE IN FIGURES — <strong>Eurostat</strong> <strong>yearbook</strong> <strong>2009</strong>457
13 Energy13.2 Electricity generationIntroductionOne of the reasons for the <strong>in</strong>creased dependencyrate for natural gas is the shift<strong>in</strong> fuels used for electricity generation:among the ma<strong>in</strong> sources for generation,natural gas has <strong>in</strong>creased at the expenseof coal, lignite and oil, probably as a resultof lower emissions from gas. Over thesame period there has been an <strong>in</strong>crease <strong>in</strong>the use of renewables, particularly w<strong>in</strong>dturb<strong>in</strong>es, although their contribution rema<strong>in</strong>srelatively small.The use of nuclear power for electricitygeneration has received renewed attentionaga<strong>in</strong>st a background of <strong>in</strong>creas<strong>in</strong>gdependency on imported primary energy,ris<strong>in</strong>g oil and gas prices, and commitmentsto reduce greenhouse gas emissions,balanced aga<strong>in</strong>st long-stand<strong>in</strong>gconcerns about safety and waste from nuclearpower plants. Some Member Stateshave recently started construction orhave planned new nuclear reactors.Renewable energy sources can have animportant role to play <strong>in</strong> reduc<strong>in</strong>g CO 2emissions. A susta<strong>in</strong>able energy policyis, <strong>in</strong> part, reliant upon <strong>in</strong>creas<strong>in</strong>g theshare of renewable energy, which may atthe same time help improve the securityof energy supply by reduc<strong>in</strong>g the EU’sgrow<strong>in</strong>g dependence on imported energysources. The <strong>Europe</strong>an Parliamentand Council set <strong>in</strong>dicative targets <strong>in</strong> 2001for the promotion of electricity from renewableenergy sources, whereby 22 %of the EU-15’s gross electricity consumptionshould be electricity produced fromrenewables by 2010; the target for theEU-25 is 21 %.Def<strong>in</strong>itions and data availabilityGross electricity generation at the plantlevel is def<strong>in</strong>ed as the electricity measuredat the outlet of the ma<strong>in</strong> transformers, <strong>in</strong>other words, the consumption of electricity<strong>in</strong> plant auxiliaries and <strong>in</strong> transformersis <strong>in</strong>cluded.The <strong>in</strong>dicator of electricity from renewableenergy sources is the ratio betweenelectricity produced from renewable energysources and gross national electricityconsumption. It measures the contributionof electricity produced fromrenewable energy sources to the nationalelectricity consumption. Electricity producedfrom renewable energy sourcescomprises the electricity generation fromhydropower plants (exclud<strong>in</strong>g pump<strong>in</strong>g),w<strong>in</strong>d, solar, geothermal and electricityfrom biomass/wastes.The <strong>in</strong>dicator on the market share of thelargest electricity generator is based onnet electricity production, and as suchthe electricity used by generators for theirown consumption is not taken <strong>in</strong>to account.The net production of each generatordur<strong>in</strong>g the same year is considered<strong>in</strong> order to calculate the correspond<strong>in</strong>gmarket shares. Only the largest marketshare is reported under this <strong>in</strong>dicator.Ma<strong>in</strong> f<strong>in</strong>d<strong>in</strong>gsTotal gross electricity generation <strong>in</strong> theEU-27 was 3.4 million GWh <strong>in</strong> 2006, ofwhich close to 30 % came from nuclearpower plants. Natural gas and coal-firedpower stations each accounted for aroundone fifth of the total, and lignite-fired andoil-fired power stations 10 % and 4 % respectively.Among the renewable sources,458 EUROPE IN FIGURES — <strong>Eurostat</strong> <strong>yearbook</strong> <strong>2009</strong>
Energy 13the largest share was from hydropowerprovid<strong>in</strong>g 10 % of the total, followed bybiomass-fired power stations and w<strong>in</strong>dturb<strong>in</strong>es each generat<strong>in</strong>g between 2 %and 3 % of the total.Germany and France were the pr<strong>in</strong>cipalelectricity generators <strong>in</strong> the EU-27, <strong>with</strong>shares of 19 % and 17 % respectively,while the United K<strong>in</strong>gdom was the onlyother Member State to report a shareabove 10 %.The EU-27 has recorded average growthof 1.7 % per annum <strong>in</strong> its level of electricitygeneration between 1996 and 2006.Luxembourg recorded an exceptional<strong>in</strong>crease <strong>in</strong> electricity generation <strong>in</strong> 2002:this aside, the Member States <strong>with</strong> thelargest <strong>in</strong>crease <strong>in</strong> their respective levelsof generation <strong>in</strong> the ten years to 2006 wereCyprus, Spa<strong>in</strong> and Latvia. Lithuania andDenmark were the only Member States torecord a lower level of generation <strong>in</strong> 2006than <strong>in</strong> 1996.Electricity generated from all renewablesources comb<strong>in</strong>ed was equivalentto 14.5 % of gross national electricityconsumption <strong>in</strong> the EU-27 <strong>in</strong> 2006. Severalof the Member States had muchhigher ratios concern<strong>in</strong>g the relativeimportance of renewables, <strong>in</strong> particularAustria (56.6 %), Sweden (48.2 %) andLatvia (37.7 %) which all generated largeproportions of their electricity from hydropower,as well as (<strong>in</strong> some cases) frombiomass. In contrast, the relatively highshare of renewables <strong>in</strong> Denmark (25.9 %)was ma<strong>in</strong>ly due to w<strong>in</strong>d power and to alesser extent biomass.One measure that can be used to monitorthe success of liberalisation <strong>with</strong><strong>in</strong>electricity markets is the market share ofthe largest generator. The small island nationsof Cyprus and Malta cont<strong>in</strong>ued toreport a complete monopoly, <strong>with</strong> 100 %of their electricity be<strong>in</strong>g generated by thelargest generator, and three other MemberStates, namely Latvia, Greece and Estonia,also reported shares over 90 %. Tenof the 25 Member States for which dataare available reported that the largestgenerator provided less than 50 % of thetotal, <strong>with</strong> the share below 25 % <strong>in</strong> F<strong>in</strong>land,the United K<strong>in</strong>gdom and Poland.Figure 13.4: Electricity generation by fuel used <strong>in</strong> power stations, EU-27, 2006 (1)(% of total, based on GWh)Oil-firedpowerstations3.9%Biomass-firedpower stations2.7%Hydropowerplants10.2%W<strong>in</strong>dturb<strong>in</strong>es2.4%Otherpower stations2.5%Nuclearpower plants29.5%Lignite-firedpower stations10.3%(1) Figures do not sum to 100 % due to round<strong>in</strong>g.Source: <strong>Eurostat</strong> (nrg_105a)Coal-firedpower stations18.3%Naturalgas-firedpower stations20.1%EUROPE IN FIGURES — <strong>Eurostat</strong> <strong>yearbook</strong> <strong>2009</strong>459
13 EnergyTable 13.5: Total gross electricity generation(1 000 GWh)1996 1997 1998 1999 2000 2001 2002 2003 2004 2005 2006Share <strong>in</strong>EU-27,2006 (%)EU-27 2 830 2 841 2 910 2 940 3 021 3 108 3 117 3 216 3 288 3 309 3 358 100.0Euro area 1 887 1 906 1 951 1 990 2 061 2 110 2 127 2 203 2 266 2 276 2 322 69.1Belgium 76 79 83 85 84 80 82 85 85 87 86 2.5Bulgaria 43 43 42 38 41 44 43 43 42 44 46 1.4Czech Republic 64 65 65 65 73 75 76 83 84 83 84 2.5Denmark 54 44 41 39 36 38 39 46 40 36 46 1.4Germany 555 552 557 555 572 586 572 599 617 620 637 19.0Estonia 9 9 9 8 9 8 9 10 10 10 10 0.3Ireland 19 20 21 22 24 25 25 25 26 25 27 0.8Greece 43 44 46 50 54 54 55 58 59 60 61 1.8Spa<strong>in</strong> 174 190 195 209 225 238 246 263 280 294 303 9.0France 513 505 511 524 541 550 559 567 574 576 574 17.1Italy 244 251 260 266 277 279 284 294 303 304 314 9.4Cyprus 3 3 3 3 3 4 4 4 4 4 5 0.1Latvia 3 5 6 4 4 4 4 4 5 5 5 0.1Lithuania 17 15 18 14 11 15 18 19 19 15 12 0.4Luxembourg 1 1 1 1 1 1 4 4 4 4 4 0.1Hungary 35 35 37 38 35 36 36 34 34 36 36 1.1Malta 2 2 2 2 2 2 2 2 2 2 2 0.1Netherlands 85 87 91 87 90 94 96 97 101 100 98 2.9Austria 55 57 57 61 62 62 62 60 64 66 64 1.9Poland 143 143 143 142 145 146 144 152 154 157 162 4.8Portugal 35 34 39 43 44 47 46 47 45 47 49 1.5Romania 61 57 53 51 52 54 55 57 56 59 63 1.9Slovenia 13 13 14 13 14 14 15 14 15 15 15 0.5Slovakia 25 25 25 28 31 32 32 31 31 31 31 0.9F<strong>in</strong>land 69 69 70 69 70 74 75 84 86 71 82 2.5Sweden 141 149 158 155 146 162 147 135 152 158 143 4.3United K<strong>in</strong>gdom 347 345 362 368 377 385 387 398 394 398 398 11.9Croatia 11 10 11 12 11 12 12 13 13 12 12 -Turkey 95 103 111 116 125 123 129 141 151 162 176 -Iceland 5 6 6 7 8 8 8 9 9 9 10 -Norway 105 112 117 123 143 122 131 107 111 138 122 -Switzerland 57 63 63 70 68 72 67 67 66 60 64 -Source: <strong>Eurostat</strong> (ten00087)460 EUROPE IN FIGURES — <strong>Eurostat</strong> <strong>yearbook</strong> <strong>2009</strong>
Energy 13Figure 13.5: Proportion of electricity generated from renewable energy sources(% of gross electricity consumption)1007550250EU-27Euro areaAustriaSwedenLatviaRomaniaPortugalDenmarkSloveniaF<strong>in</strong>landSpa<strong>in</strong>SlovakiaItalyFranceGreeceGermanyBulgariaIrelandNetherlandsCzech RepublicUnited K<strong>in</strong>gdomBelgiumHungaryLithuaniaLuxembourgPolandEstoniaCyprusMaltaIcelandNorwayCroatiaTurkey2006 2010 (1)(1) Indicative targets for 2010 are not available for Croatia, Turkey, Iceland and Norway.Source: <strong>Eurostat</strong> (tsien050)Figure 13.6: Market share of the largest generator <strong>in</strong> the electricity market, 2006 (1)(% of total generation)1007550250CyprusMaltaLatviaGreeceEstoniaFranceBelgiumLuxembourg (2)Czech RepublicSlovakiaLithuaniaDenmarkPortugal (3)SloveniaIrelandSwedenHungaryItalyAustria (4)RomaniaSpa<strong>in</strong>Germany (2)F<strong>in</strong>land (3)United K<strong>in</strong>gdomPolandCroatiaTurkey (3)Norway (3)(1) Bulgaria and the Netherlands, not available.(2) 2004.(3) 2005.(4) 2001.Source: <strong>Eurostat</strong> (tsier060)EUROPE IN FIGURES — <strong>Eurostat</strong> <strong>yearbook</strong> <strong>2009</strong>461
13 Energy13.3 Consumption of energyIntroductionAs well as supply-side policies, a numberof EU <strong>in</strong>itiatives have been aimed at reduc<strong>in</strong>genergy demand, <strong>in</strong> an attempt todecouple it from the growth <strong>in</strong> economicactivity. Several <strong>in</strong>struments and implement<strong>in</strong>gmeasures exist <strong>in</strong> this field, <strong>in</strong>clud<strong>in</strong>gthe promotion of co-generation,the energy performance of build<strong>in</strong>gs(whether private or public build<strong>in</strong>gs), andenergy labell<strong>in</strong>g of domestic appliances.In October 2006 the <strong>Europe</strong>an Commissionadopted an action plan for energyefficiency (COM(2006) 545) (5) which wassupported by the Council <strong>in</strong> November2006. The plan proposes to cut energyconsumption by 20 % by 2020, and <strong>in</strong> sodo<strong>in</strong>g simultaneously address the issuesof import dependency, energy-relatedemissions, and energy costs.Provid<strong>in</strong>g transport for goods and passengers,whether for own-use or forhire and reward, consumes significantamounts of energy. There are many factorsthat impact on energy use and emissions<strong>in</strong> transport, for example, overalleconomic growth, the efficiency of <strong>in</strong>dividualtransport modes, the comb<strong>in</strong>ationof different transport modes, alternativefuels, and lifestyle choices.In 2001, the <strong>Europe</strong>an Commissionadopted a policy to promote biofuels fortransport, and a number of targets wereset. In March 2007 the Council supported<strong>in</strong>creas<strong>in</strong>g the level of renewables (suchas biofuels) <strong>in</strong> transport fuel to 10 % by2020.Def<strong>in</strong>itions and data availabilityGross <strong>in</strong>land consumption expresses thetotal energy needs of a country. It coversconsumption by the energy branch itself,distribution and transformation losses,and f<strong>in</strong>al energy consumption. The shareof renewables <strong>in</strong> gross <strong>in</strong>land energy consumptionis def<strong>in</strong>ed as the percentageshare of renewables <strong>in</strong> gross <strong>in</strong>land energyconsumption.F<strong>in</strong>al energy consumption <strong>in</strong>cludes theconsumption by all users except the energybranch itself (whether deliveries fortransformation and/or own use), and <strong>in</strong>cludes,for example, energy consumptionby agriculture, <strong>in</strong>dustry, services andhouseholds, as well as energy consumptionfor transport. It should be notedthat the fuel quantities transformed <strong>in</strong>the electrical power stations of <strong>in</strong>dustrialauto-producers and the quantities of coketransformed <strong>in</strong>to blast-furnace gas arenot part of overall <strong>in</strong>dustrial consumptionbut of the transformation sector.F<strong>in</strong>al energy consumption <strong>in</strong> transportcovers the consumption <strong>in</strong> all types oftransportation, i.e., rail, road, air transportand <strong>in</strong>land navigation. F<strong>in</strong>al energyconsumption <strong>in</strong> households, services,etc. covers quantities consumed by privatehouseholds, commerce, public adm<strong>in</strong>istration,services, agriculture andfisheries.(5) http://ec.europa.eu/energy/action_plan_energy_efficiency/<strong>in</strong>dex_en.htm.462 EUROPE IN FIGURES — <strong>Eurostat</strong> <strong>yearbook</strong> <strong>2009</strong>
Energy 13Energy <strong>in</strong>tensity is measured as the ratiobetween gross <strong>in</strong>land consumption of energyand gross domestic product (GDP)for a given calendar year. It measures theenergy consumption of an economy andits overall energy efficiency. The ratio isexpressed as kgoe (kilogram of oil equivalent)per EUR 1 000, and to facilitateanalysis over time the calculations arebased on GDP <strong>in</strong> constant prices (currentlyus<strong>in</strong>g 1995 prices). If an economybecomes more efficient <strong>in</strong> its use of energy,and its GDP rema<strong>in</strong>s constant, thenthe ratio for this <strong>in</strong>dicator should fall; thisenergy <strong>in</strong>tensity ratio is also consideredas an <strong>in</strong>dicator of energy efficiency. TheGDP <strong>figures</strong> are taken at constant pricesto avoid the impact of the <strong>in</strong>flation, baseyear 1995.Ma<strong>in</strong> f<strong>in</strong>d<strong>in</strong>gsGross <strong>in</strong>land consumption of energy<strong>with</strong><strong>in</strong> the EU-27 <strong>in</strong> 2006 was 1 825 milliontoe, almost unchanged compared<strong>with</strong> both 2004 and 2005, and as suchwas just over double the level of the productionof primary energy. The gross <strong>in</strong>landconsumption of each Member Statedepends on the structure of its energysystem and the availability of natural resources.This is true not only for conventionalfuels and nuclear power, but alsofor renewables. For example, althoughsmall <strong>in</strong> absolute levels, the use of solarpower is relatively high <strong>in</strong> the Mediterraneancountries such as Cyprus, while theuse of biomass is high <strong>in</strong> countries <strong>with</strong>large forest areas, for example, Latvia,F<strong>in</strong>land and Sweden. In the same ve<strong>in</strong>,hydropower is particularly important <strong>in</strong>mounta<strong>in</strong>ous countries <strong>with</strong> ample watersupplies, such as Austria or Sweden.F<strong>in</strong>al energy consumption <strong>in</strong> the EU-27was equivalent to just under two thirdsof gross <strong>in</strong>land consumption, at 1 176million toe <strong>in</strong> 2006. This level was onlyslightly higher than the previous twoyears, and over the ten years from 1996 to2006 f<strong>in</strong>al energy consumption <strong>in</strong>creasedon average by just 0.5 % per annum. Ananalysis by ma<strong>in</strong> type of energy shows ashift <strong>in</strong> the energy mix between 1996 and2006, most notably through a fall <strong>in</strong> theconsumption of solid fuels (-3.8 % perannum) and an <strong>in</strong>crease <strong>in</strong> the consumptionof renewables (2.8 % per annum) andelectricity (2.0 %).An analysis of the end-use of energyshows three dom<strong>in</strong>ant categories, namely<strong>in</strong>dustry, households and road transport,each <strong>with</strong> a share of just over one quarterof the total. Comb<strong>in</strong><strong>in</strong>g all forms oftransport, <strong>in</strong>clud<strong>in</strong>g road, air transportand others (such as <strong>in</strong>land waterways andrail), the transport share reached 31 %:road transport accounted for 82 % of thetotal energy consumption for transportpurposes, and air transport for 14 %. Between1996 and 2006 energy consumptionfor <strong>in</strong>land waterways and for railtransport fell, while consumption forroad transport <strong>in</strong>creased by an averageof 1.6 % per annum and for air transportit <strong>in</strong>creased, on average, by 3.8 %per annum. The rates of change for 2006compared <strong>with</strong> 2005 were broadly <strong>in</strong> l<strong>in</strong>e<strong>with</strong> these longer term trends, except forEUROPE IN FIGURES — <strong>Eurostat</strong> <strong>yearbook</strong> <strong>2009</strong>463
13 Energy<strong>in</strong>land water transport which recordedan <strong>in</strong>crease of 11.0 % <strong>in</strong> consumption <strong>in</strong>2006, follow<strong>in</strong>g on from a 4.4 % <strong>in</strong>crease<strong>in</strong> 2005 br<strong>in</strong>g<strong>in</strong>g consumption for <strong>in</strong>landwaterways to its highest level s<strong>in</strong>ce 1999.In 2007 a m<strong>in</strong>imum target was set thatrenewables (such as biofuels) should accountfor 10 % of transport petrol anddiesel by 2020. Data for 2006 show thatbiofuels made the biggest contributionto transport consumption of fuels <strong>in</strong>Germany (5.5 %), Slovakia (2.5 %) andSweden (2.2 %), and these were the onlyMember States (for which data are available)where the share of biofuels was abovethe EU-27 average of 1.5 %.The lowest level of energy <strong>in</strong>tensity recordedby the EU-27 Member States was<strong>in</strong> Denmark, while the most energy-<strong>in</strong>tensivecountries were Bulgaria and Romania.It should be noted that the economicstructure of an economy plays animportant role <strong>in</strong> determ<strong>in</strong><strong>in</strong>g energy <strong>in</strong>tensity,as post-<strong>in</strong>dustrial economies <strong>with</strong>large service sectors will, a priori, displaylow levels of energy <strong>in</strong>tensity compared<strong>with</strong> economies that have a considerableproportion of their economic activity<strong>with</strong><strong>in</strong> <strong>in</strong>dustrial activities.464 EUROPE IN FIGURES — <strong>Eurostat</strong> <strong>yearbook</strong> <strong>2009</strong>
Energy 13Table 13.6: Gross <strong>in</strong>land consumption of energy(million tonnes of oil equivalent)1996 1997 1998 1999 2000 2001 2002 2003 2004 2005 2006Share <strong>in</strong>EU-27,2006 (%)EU-27 1 719 1 704 1 722 1 710 1 723 1 762 1 758 1 803 1 824 1 826 1 825 100.0Euro area 1 134 1 135 1 158 1 163 1 178 1 207 1 208 1 238 1 257 1 257 1 253 68.6Belgium 58 59 60 61 61 60 58 61 61 61 60 3.3Bulgaria 23 20 20 18 19 19 19 20 19 20 21 1.1Czech Republic 43 43 41 38 41 42 42 46 46 45 46 2.5Denmark 23 21 21 20 20 20 20 21 20 20 21 1.1Germany 350 347 346 340 341 353 346 349 350 347 349 19.1Estonia 6 6 5 5 5 5 5 5 6 6 5 0.3Ireland 12 12 13 14 14 15 15 15 16 15 16 0.9Greece 25 26 27 27 28 29 30 30 31 31 32 1.7Spa<strong>in</strong> 101 107 113 118 124 127 131 135 141 145 144 7.9France 255 249 256 256 260 267 267 272 276 276 273 15.0Italy 162 164 169 172 173 174 174 183 185 187 186 10.2Cyprus 2 2 2 2 2 2 2 3 2 2 3 0.1Latvia 5 4 4 4 4 4 4 4 4 4 5 0.3Lithuania 9 9 9 8 7 8 9 9 9 9 8 0.5Luxembourg 3 3 3 3 4 4 4 4 5 5 5 0.3Hungary 26 26 26 25 25 25 26 27 27 28 28 1.5Malta 1 1 1 1 1 1 1 1 1 1 1 0.0Netherlands 77 76 76 76 77 79 80 82 84 82 81 4.4Austria 29 29 29 29 29 31 31 33 33 34 34 1.9Poland 104 103 96 94 91 91 90 92 92 94 98 5.4Portugal 20 22 23 25 25 25 26 26 26 27 25 1.4Romania 48 45 42 37 37 37 38 40 40 39 41 2.2Slovenia 6 7 6 6 6 7 7 7 7 7 7 0.4Slovakia 18 18 17 17 18 19 19 19 19 19 19 1.0F<strong>in</strong>land 31 33 33 33 33 33 35 37 37 35 38 2.1Sweden 52 50 51 50 48 51 51 50 53 52 51 2.8United K<strong>in</strong>gdom 229 223 231 229 232 233 227 231 233 233 230 12.6Croatia 7 8 8 8 8 8 8 9 9 9 9 -Turkey 68 71 73 71 78 72 75 79 82 85 95 -Iceland 2 3 3 3 3 3 3 3 3 4 4 -Norway 23 24 26 27 26 27 24 27 28 32 25 -Switzerland 25 26 26 26 26 27 26 27 27 27 28 -Source: <strong>Eurostat</strong> (ten00086)EUROPE IN FIGURES — <strong>Eurostat</strong> <strong>yearbook</strong> <strong>2009</strong>465
13 EnergyTable 13.7: F<strong>in</strong>al energy consumption(million tonnes of oil equivalent)1996 1997 1998 1999 2000 2001 2002 2003 2004 2005 2006Share <strong>in</strong>EU-27,2006 (%)EU-27 1 115 1 104 1 111 1 108 1 114 1 140 1 126 1 158 1 171 1 172 1 176 100.0Euro area 745 741 756 759 767 789 781 805 813 814 815 69.3Belgium 38 38 39 39 39 39 38 40 39 38 38 3.2Bulgaria 12 9 10 9 9 9 9 9 9 10 10 0.9Czech Republic 26 25 24 24 24 24 24 25 26 26 26 2.2Denmark 15 15 15 15 15 15 15 15 15 15 16 1.3Germany 231 225 224 219 218 224 219 222 220 218 223 19.0Estonia 3 3 3 2 2 3 3 3 3 3 3 0.2Ireland 8 9 9 10 11 11 11 11 12 12 13 1.1Greece 17 17 18 18 19 19 20 21 20 21 21 1.8Spa<strong>in</strong> 65 68 72 74 80 84 86 91 95 97 97 8.2France 150 148 153 152 152 158 154 157 160 159 158 13.4Italy 115 116 119 124 123 126 125 130 131 133 131 11.1Cyprus 1 1 2 2 2 2 2 2 2 2 2 0.2Latvia 4 4 4 3 3 4 4 4 4 4 4 0.4Lithuania 4 5 4 4 4 4 4 4 4 4 5 0.4Luxembourg 3 3 3 3 4 4 4 4 4 4 4 0.4Hungary 16 16 16 16 16 16 17 18 17 18 18 1.5Malta 0 1 0 0 0 0 0 0 0 1 0 0.0Netherlands 52 50 50 49 50 51 51 52 53 52 51 4.3Austria 23 22 23 23 23 25 25 26 26 27 27 2.3Poland 66 65 60 58 55 56 54 56 57 57 60 5.1Portugal 15 15 16 17 18 18 18 18 20 19 19 1.6Romania 30 29 26 22 22 23 23 24 25 25 25 2.1Slovenia 4 5 4 4 4 5 5 5 5 5 5 0.4Slovakia 11 11 10 10 10 11 11 11 11 11 11 0.9F<strong>in</strong>land 22 24 24 25 24 24 25 26 26 25 27 2.3Sweden 35 34 34 34 34 33 34 34 34 34 33 2.8United K<strong>in</strong>gdom 150 148 149 152 152 153 149 151 152 152 151 12.8Croatia 5 5 5 5 5 5 6 6 6 6 6 -Turkey 49 50 50 49 55 50 55 59 60 63 69 -Iceland 2 2 2 2 2 2 2 2 2 2 2 -Norway 18 18 18 19 18 19 18 18 18 18 18 -Switzerland 20 20 20 21 20 21 20 21 21 22 22 -Source: <strong>Eurostat</strong> (ten00095)466 EUROPE IN FIGURES — <strong>Eurostat</strong> <strong>yearbook</strong> <strong>2009</strong>
Energy 13Figure 13.7: Share of renewables <strong>in</strong> gross <strong>in</strong>land energy consumption, 2006 (1)(%)403020100EU-27Euro areaBelgiumBulgariaCzech RepublicDenmarkGermanyEstoniaIrelandGreeceSpa<strong>in</strong>FranceItalyCyprusLatviaLithuaniaLuxembourgHungaryNetherlandsAustriaPolandPortugalRomaniaSloveniaSlovakiaF<strong>in</strong>landSwedenUnited K<strong>in</strong>gdomSolarW<strong>in</strong>dGeothermalHydroBiomass(1) Malta, not available; EU-27, euro area and Slovenia, provisional.Source: <strong>Eurostat</strong> (tsdcc110)Figure 13.8: F<strong>in</strong>al energy consumption, EU-27 (1)(1996=100)14012010080601996 1997 1998 1999 2000 2001 2002 2003 2004 2005 2006RenewablesElectricityGasCrude oil and petroleum productsDerived heatSolid fuels(1) F<strong>in</strong>al energy consumption, 2006 (million toe): renewables 59.1; electricity 241.9; gas 278.7; crude oil and petroleum products 496.7;derived heat 41.3; solid fuels 55.5.Source: <strong>Eurostat</strong> (nrg_1071a, nrg_105a, nrg_103a, nrg_102a, nrg_106a and nrg_101a)EUROPE IN FIGURES — <strong>Eurostat</strong> <strong>yearbook</strong> <strong>2009</strong>467
13 EnergyFigure 13.9: Share of biofuels <strong>in</strong> total fuel consumption of transport, 2006 (1)(%)6543210EU-27 (2)GermanySlovakiaSwedenFranceAustriaLithuaniaPortugalPolandGreeceUnited K<strong>in</strong>gdomSpa<strong>in</strong> (2)ItalyCzech RepublicNetherlandsHungaryBulgariaLatviaSloveniaDenmarkLuxembourgIrelandF<strong>in</strong>landBelgiumTurkeySwitzerland(1) Estonia, Cyprus, Malta and Romania, not available.(2) Provisional.Source: <strong>Eurostat</strong> (nrg_1073a and nrg_100a)Figure 13.10: F<strong>in</strong>al energy consumption, EU-27, 2006 (1)(% of total, based on tonnes of oil equivalent)Other transport1.3%Agriculture2.4%Other1.2%Aviation4.4%Services11.4%Industry27.6%(1) Provisional.Source: <strong>Eurostat</strong> (tsdpc320 and tsdtr100)Road transport25.8%Households25.9%468 EUROPE IN FIGURES — <strong>Eurostat</strong> <strong>yearbook</strong> <strong>2009</strong>
Energy 13Figure 13.11: Energy consumption by transport mode, EU-27 (1)(1996=100)16014012010080601996 1997 1998 1999 2000 2001 2002 2003 2004 2005 2006AirRoadRailInland waterways(1) Provisional: 2002 for all modes; provisional: 2005 and 2006 for rail.Source: <strong>Eurostat</strong> (tsdtr100)Figure 13.12: Energy <strong>in</strong>tensity of the economy, 2006(kgoe per EUR 1 000 of GDP)1 7501 5001 2501 0007505002500EU-27Euro area (1)BulgariaRomaniaLithuaniaEstoniaCzech RepublicSlovakiaPolandLatviaHungarySloveniaF<strong>in</strong>landCyprusMaltaPortugalBelgiumSpa<strong>in</strong>GreeceUnited K<strong>in</strong>gdomNetherlandsSwedenItalyFranceLuxembourgGermanyAustriaIrelandDenmarkIcelandTurkeyCroatiaUnited StatesNorwayJapan(1) EA-13 <strong>in</strong>stead of EA-15.Source: <strong>Eurostat</strong> (tsien020)EUROPE IN FIGURES — <strong>Eurostat</strong> <strong>yearbook</strong> <strong>2009</strong>469
13 Energy13.4 Energy pricesIntroductionEver <strong>in</strong>creas<strong>in</strong>g energy demand, theglobal geopolitical situation and severeweather conditions have <strong>in</strong>duced rapid,large changes <strong>in</strong> energy prices. Crude oilprices <strong>in</strong>creased significantly from 2004to the middle of 2008, s<strong>in</strong>ce when theyhave dropped back sharply, although atthe time of writ<strong>in</strong>g rema<strong>in</strong> well abovetheir levels at the beg<strong>in</strong>n<strong>in</strong>g of 2004.Changes <strong>in</strong> oil prices have an impact onthe price of substitutes, notably naturalgas, and also feed <strong>in</strong>to the prices of productsfrom other sectors that are heavy usersof energy or of energy products as rawmaterials.The price and reliability of energy supplies,and of electricity <strong>in</strong> particular, is akey element of a country’s energy supply,and particularly important <strong>with</strong> respectto <strong>in</strong>ternational competitiveness, as electricityusually represents a high proportionof total energy costs to householdsand bus<strong>in</strong>esses. In contrast to the price offossil fuels, which are usually traded onglobal markets <strong>with</strong> relatively uniformprices, there is a particularly wide rangeof prices <strong>with</strong><strong>in</strong> the EU for electricity. Theprice of electricity is, to some degree, <strong>in</strong>fluencedby the price of primary fuels andmore recently also by the cost of carbondioxide (CO 2) emission certificates, and itis possible that result<strong>in</strong>g higher prices forelectricity will provide an <strong>in</strong>centive forgreater energy efficiency and lower levelsof carbon emissions.There have been moves <strong>with</strong><strong>in</strong> the EU toliberalise the electricity and gas markets<strong>in</strong>ce the second half of the 1990s. Directivesof the <strong>Europe</strong>an Parliament andthe Council adopted <strong>in</strong> 2003 establishedcommon rules for the <strong>in</strong>ternal markets<strong>in</strong> electricity and natural gas, and setdeadl<strong>in</strong>es for market open<strong>in</strong>g, allow<strong>in</strong>gcustomers to choose their supplier:1 July 2004 for all bus<strong>in</strong>ess customers and1 July 2007 for all consumers <strong>in</strong>clud<strong>in</strong>ghouseholds. Certa<strong>in</strong> countries anticipatedthe liberalisation process, while otherswere slower <strong>in</strong> adopt<strong>in</strong>g these measures.Significant barriers to entry rema<strong>in</strong> <strong>in</strong>many electricity and natural gas markets,as witnessed <strong>in</strong> many Member Stateswhich are still dom<strong>in</strong>ated by (near) monopolysuppliers. In September 2007, the<strong>Europe</strong>an Commission adopted a thirdpackage of legislative proposals (6) aimedat ensur<strong>in</strong>g a real and effective choice ofsupplier and benefits for customers; at thetime of writ<strong>in</strong>g the Council had unanimouslyreached a political agreement onthis package, which was due for a secondread<strong>in</strong>g by the <strong>Europe</strong>an Parliament.Def<strong>in</strong>itions and data availabilityEnergy prices are currently collected ata national level, whereas <strong>in</strong> the past theywere collected at a regional level or, <strong>in</strong>some cases, even for <strong>in</strong>dividual cities.Time-series for prices start <strong>in</strong> 1985, <strong>with</strong>data for the Member States that jo<strong>in</strong>edthe EU <strong>in</strong> 2004 and 2007 generally availablefrom 2004 onwards.(6) http://ec.europa.eu/energy/electricity/package_2007/<strong>in</strong>dex_en.htm.470 EUROPE IN FIGURES — <strong>Eurostat</strong> <strong>yearbook</strong> <strong>2009</strong>
Energy 13Statistics on electricity and natural gasprices are collected on a half-yearly basis– they are shown here as a snapshot as of1 January of each year. Electricity pricesfor households are normally shown <strong>in</strong>clud<strong>in</strong>gtaxes and value added tax (VAT),as these are generally the end price paidby the consumer at po<strong>in</strong>t of use. For thepurposes of comparison <strong>in</strong>dustrial gasand electricity prices are also shown here<strong>in</strong>clud<strong>in</strong>g all taxes, although <strong>in</strong> practiseenterprises can deduct VAT paid.Automotive fuel prices shown are atthe pump prices of premium unleadedgasol<strong>in</strong>e (petrol) 95 RON and automotivediesel oil. The prices are supplied tothe Directorate-General for Energy andTransport of the <strong>Europe</strong>an Commissionby the Member States as be<strong>in</strong>g the mostfrequently encountered on the first Mondayafter the 15th of each month. <strong>Eurostat</strong>also publishes price <strong>in</strong>formation onheat<strong>in</strong>g oil and residual fuel oil.Ma<strong>in</strong> f<strong>in</strong>d<strong>in</strong>gsElectricity and gas tariffs vary from onesupplier to another. They may be the resultof negotiated contracts, especially for large<strong>in</strong>dustrial consumers. For smaller consumersthey are generally set accord<strong>in</strong>g tothe amount of electricity or gas consumed,and a number of other characteristics thatvary from one country to another; mosttariffs also <strong>in</strong>clude some form of fixedcharge. Therefore, there is no s<strong>in</strong>gle pricefor electricity or gas <strong>in</strong> any EU MemberState. In order to compare prices over timeand between countries, two ‘standard consumers’are presented, one represent<strong>in</strong>gdomestic consumers and the other <strong>in</strong>dustrialconsumers. All electricity price dataare given <strong>in</strong> euro per 100 kWh and correspondto prices applicable on 1 Januaryof the reference year; a similar set of criteriaare used for gas prices, except the unitchanges to euro per GJ.Electricity and gas prices have <strong>in</strong>creasedstrongly <strong>in</strong> recent years, particularly gasprices. Between 2005 and 2007 prices <strong>in</strong>creasedfor households and <strong>in</strong>dustrial users<strong>in</strong> nearly all Member States for bothtypes of energy: Latvia recorded significantlylower electricity prices for households,F<strong>in</strong>land slightly lower electricityprices for <strong>in</strong>dustrial users, and Denmarkrecorded lower prices for <strong>in</strong>dustrial usersfor both types of energy. In percentageterms, price <strong>in</strong>creases for households wereparticularly high <strong>in</strong> Romania, the UnitedK<strong>in</strong>gdom and Ireland, while <strong>in</strong>dustrialusers faced the largest <strong>in</strong>creases <strong>in</strong> theUnited K<strong>in</strong>gdom, Romania and Slovakia.In 2007, the price of electricity for householdswas nearly four times higher <strong>in</strong> themost expensive Member State, Denmark,than <strong>in</strong> the cheapest Member States,namely Bulgaria and Latvia. The rangeof household prices for gas was evengreater, <strong>with</strong> the highest prices aga<strong>in</strong> <strong>in</strong>Denmark, more than five times the lowest,<strong>in</strong> Estonia; household gas prices werealso significantly higher <strong>in</strong> Sweden than<strong>in</strong> other Member States. A large part ofthe price differences between the MemberStates can be attributed to taxes, asthe range <strong>in</strong> prices exclud<strong>in</strong>g taxes is lessthan the range when <strong>in</strong>clud<strong>in</strong>g taxes.As <strong>with</strong> electricity and gas prices, petroland diesel prices have also risen <strong>in</strong> recentyears. The highest prices for unleaded petrol<strong>in</strong> the EU dur<strong>in</strong>g the first half of 2008were recorded <strong>in</strong> the Netherlands, Belgium,Portugal and the United K<strong>in</strong>gdom,while the United K<strong>in</strong>gdom had by somemarg<strong>in</strong> the most expensive pump price fordiesel. The lowest prices for petrol and dieselwere <strong>in</strong> Romania and Bulgaria, the BalticMember States, the islands of Cyprusand Malta, as well as <strong>in</strong> Slovenia, whileLuxembourg and Spa<strong>in</strong> also recorded particularlylow diesel prices.EUROPE IN FIGURES — <strong>Eurostat</strong> <strong>yearbook</strong> <strong>2009</strong>471
13 EnergyTable 13.8: Electricity and gas prices (<strong>in</strong>clud<strong>in</strong>g taxes), as of 1 January(EUR)Electricity prices (per 100 kWh)Gas prices (per GJ)Households (1) Industry (2)Households (3) Industry (4)2005 2006 2007 2005 2006 2007 2005 2006 2007 2005 2006 2007EU-15 13.82 14.40 15.81 8.94 9.98 10.97 11.81 13.51 15.66 7.84 10.34 11.29Euro area (5) 14.70 15.10 16.05 9.49 10.27 11.22 13.36 15.33 16.98 7.93 10.28 11.08Belgium 14.81 14.42 15.81 9.38 11.72 11.73 11.16 13.50 12.89 6.43 8.61 8.47Bulgaria 6.44 6.60 6.60 5.16 5.52 5.62 6.73 7.70 8.83 4.53 5.40 6.26Czech Republic 8.68 9.85 10.67 7.13 8.70 9.30 7.49 10.03 9.45 6.08 8.74 7.81Denmark 22.78 23.62 25.79 10.86 12.06 10.74 28.44 29.82 30.84 8.49 8.58 8.16Germany 17.85 18.32 19.49 10.47 11.53 12.72 13.56 15.98 18.45 10.29 13.44 15.79Estonia 6.78 7.31 7.50 5.57 6.02 6.30 4.63 4.63 5.89 3.25 3.36 4.36Ireland 14.36 14.90 16.62 10.56 11.48 12.77 9.98 12.51 16.73 : : :Greece 6.88 7.01 7.20 6.97 7.28 7.61 : : : : : :Spa<strong>in</strong> 10.97 11.47 12.25 8.36 8.79 9.87 11.90 13.63 14.23 5.43 8.40 8.21France 11.94 11.94 12.11 6.91 6.91 7.01 10.57 12.72 13.46 7.58 9.78 9.26Italy 19.70 21.08 23.29 12.02 13.29 15.26 15.34 16.50 18.34 7.30 8.41 9.88Cyprus 10.74 14.31 13.76 9.27 13.04 12.26 - - - - - -Latvia 8.28 8.29 6.88 4.82 4.82 5.23 4.54 5.34 7.50 4.11 4.77 6.24Lithuania 7.18 7.18 7.76 5.88 5.88 6.46 5.41 6.24 7.04 4.25 5.26 7.10Luxembourg 14.78 16.03 16.84 9.02 9.49 10.54 8.14 10.33 11.52 7.36 9.55 10.45Hungary 10.64 10.75 12.22 8.86 9.13 9.84 5.10 5.28 7.16 6.94 9.40 11.64Malta 7.64 9.49 9.87 7.41 7.46 9.42 - - - - - -Netherlands 19.55 20.87 21.80 10.70 11.38 12.25 15.17 16.92 18.42 8.90 11.15 11.59Austria 14.13 13.40 15.45 9.92 10.35 11.43 13.36 15.65 15.99 9.83 12.99 13.27Poland 10.64 11.90 12.16 6.78 7.27 7.23 7.55 9.46 10.69 6.47 8.25 9.20Portugal 13.81 14.10 15.00 7.49 8.58 9.03 12.34 14.52 13.88 6.33 8.01 8.15Romania 7.79 9.43 10.17 9.15 9.20 10.02 4.79 7.66 9.05 4.38 7.42 8.71Slovenia 10.33 10.49 10.64 7.33 7.81 8.90 10.33 12.99 13.86 7.07 9.55 9.75Slovakia 13.38 14.48 15.37 8.37 9.20 11.11 8.14 10.88 11.48 6.04 9.12 9.52F<strong>in</strong>land 10.57 10.78 11.60 6.99 6.86 6.89 : : : 8.43 9.51 9.87Sweden 13.97 14.35 17.14 4.68 5.93 6.31 22.18 25.95 26.58 9.20 12.26 12.21United K<strong>in</strong>gdom 8.77 10.20 13.16 6.96 9.66 11.44 7.26 8.24 11.76 7.17 10.82 12.75Norway 15.71 15.33 18.56 8.12 8.06 10.58 : : : : : :(1) Annual consumption: 3 500 kWh of which night 1 300.(2) Annual consumption: 2 000 MWh; maximum demand: 500 kW; annual load: 4 000 hours); special category for Luxembourg.(3) Annual consumption: 83.70 GJ.(4) Annual consumption: 41 860 GJ; load factor: 200 days, 1 600 hours); special category for Belgium.(5) EA-12 <strong>in</strong>stead of EA-15.Source: <strong>Eurostat</strong> (nrg_pc_price<strong>in</strong>d)472 EUROPE IN FIGURES — <strong>Eurostat</strong> <strong>yearbook</strong> <strong>2009</strong>
Energy 13Figure 13.13: Price of premium unleaded gasol<strong>in</strong>e and diesel oil, January 2008(EUR per litre, <strong>in</strong>clud<strong>in</strong>g taxes)1.501.251.000.750.500.250.00United K<strong>in</strong>gdomNetherlandsItalyPortugalGermanyFranceF<strong>in</strong>landDenmarkBelgiumSwedenCzech RepublicIrelandSlovakiaAustriaHungaryPolandGreeceLuxembourgSpa<strong>in</strong>EstoniaSloveniaMaltaLatviaLithuaniaCyprusBulgariaRomaniaDiesel oilUnleaded gasol<strong>in</strong>e 95 RONSource: <strong>Eurostat</strong> (ten00103 and ten00102) and Directorate-General for Energy and TransportEUROPE IN FIGURES — <strong>Eurostat</strong> <strong>yearbook</strong> <strong>2009</strong>473
Science and technologyResearch and development (R & D) is often considered as a driv<strong>in</strong>g force beh<strong>in</strong>d economicgrowth, job creation, <strong>in</strong>novation, and the subsequent <strong>in</strong>creas<strong>in</strong>g quality ofproducts. The seventh framework programme for research and technological development(FP7) is the EU’s ma<strong>in</strong> <strong>in</strong>strument for fund<strong>in</strong>g research <strong>in</strong> <strong>Europe</strong> (1) ; it runsfrom 2007-2013 and has a total budget of EUR 53 200 million. This money is generally<strong>in</strong>tended to f<strong>in</strong>ance grants to research actors all over <strong>Europe</strong>, usually through co-f<strong>in</strong>anc<strong>in</strong>gresearch, technological development and demonstration projects. Grants aredeterm<strong>in</strong>ed on the basis of calls for proposals and a peer review process. The ma<strong>in</strong>aims of FP7 are to <strong>in</strong>crease <strong>Europe</strong>’s growth, competitiveness and employment. Thisis done through a number of <strong>in</strong>itiatives and exist<strong>in</strong>g programmes <strong>in</strong>clud<strong>in</strong>g, the competitivenessand <strong>in</strong>novation framework programme (2) , educational and tra<strong>in</strong><strong>in</strong>g programmes,as well as regional development through structural and cohesion funds. FP7is made up of four broad programmes (cooperation, ideas, people and capacities) and afifth specific programme on nuclear research. The ten thematic areas that are coveredby FP7 cooperation <strong>in</strong>clude: health, food, agriculture and biotechnology, <strong>in</strong>formationand communication technologies, nanosciences, nanotechnologies, materials and newproduction technologies, energy, environment, transport, socio-economic sciencesand humanities, space and security.In 2000, the EU decided to create the <strong>Europe</strong>an Research Area (ERA): a unified areaall across <strong>Europe</strong>, which should:• enable researchers to move and <strong>in</strong>teract seamlessly, benefit from world-class <strong>in</strong>frastructuresand work <strong>with</strong> excellent networks of research <strong>in</strong>stitutions;• share, teach, value and use knowledge effectively for social, bus<strong>in</strong>ess and policypurposes;• optimise and open <strong>Europe</strong>an, national and regional research programmes <strong>in</strong> orderto support the best research throughout <strong>Europe</strong> and coord<strong>in</strong>ate these programmesto address major challenges together;• develop strong l<strong>in</strong>ks <strong>with</strong> partners around the world so that <strong>Europe</strong> benefits fromthe worldwide progress of knowledge, contributes to global development and takesa lead<strong>in</strong>g role <strong>in</strong> <strong>in</strong>ternational <strong>in</strong>itiatives to solve global issues.(1) http://cordis.europa.eu/fp7/home_en.html.(2) http://cordis.europa.eu/<strong>in</strong>novation/en/policy/cip.htm.EUROPE IN FIGURES — <strong>Eurostat</strong> <strong>yearbook</strong> <strong>2009</strong>475
14 Science and technology14.1 PersonnelA debate was conducted dur<strong>in</strong>g 2007 onwhat should be done to create a moreunified and attractive research area tomeet the needs of bus<strong>in</strong>ess, the scientificcommunity and citizens. The <strong>Europe</strong>anCommission published a Green paperon the ERA review<strong>in</strong>g progress made. In2008 a new set of <strong>in</strong>itiatives to develop theERA were launched, <strong>in</strong>clud<strong>in</strong>g enhancedpolitical governance of ERA, called the‘Ljubljana Process’, as well as specific <strong>in</strong>itiativesfor five different areas (researchers’careers and mobility, research <strong>in</strong>frastructures,knowledge shar<strong>in</strong>g, researchprogrammes and <strong>in</strong>ternational scienceand technology cooperation).Information technology develops on adaily basis, and it may be argued that asociety’s wealth and growth are, at leastto some degree, based on its ability tohandle <strong>in</strong>formation efficiently. Informationtechnology is not only a technicalphenomenon, it is a means of transform<strong>in</strong>gthe way <strong>in</strong> which people communicate,do bus<strong>in</strong>ess, and live their everydaylives. It holds enormous potential andopportunities for <strong>Europe</strong>’s economy andsocieties. The i2010 <strong>in</strong>itiative (3) is the <strong>Europe</strong>anCommission’s strategic policyframework <strong>in</strong> this area, lay<strong>in</strong>g out broadpolicy guidel<strong>in</strong>es for the <strong>in</strong>formation societyand media <strong>in</strong> the years up to 2010. Itis designed to promote an open and competitivedigital economy, research <strong>in</strong>to<strong>in</strong>formation and communication technologies,as well as their application toimprove social <strong>in</strong>clusion, public servicesand the quality of life.IntroductionThe <strong>Europe</strong>an Commission has placedrenewed emphasis on the conversion of<strong>Europe</strong>’s scientific expertise <strong>in</strong>to marketableproducts and services, while alsofocus<strong>in</strong>g on improv<strong>in</strong>g the mobility of<strong>Europe</strong>an researchers, encourag<strong>in</strong>g networksbetween researchers from differentMember States, and promot<strong>in</strong>g R & D asan occupation for women.This latter po<strong>in</strong>t has been one particulararea of concern for policy-makers whoconsider that women’s <strong>in</strong>tellectual potential,and their contribution to societyare not be<strong>in</strong>g fully capitalised upon. Inparticular, their participation is low <strong>in</strong>certa<strong>in</strong> branches of the natural sciences,eng<strong>in</strong>eer<strong>in</strong>g and technology, which areconsidered key R & D areas. Furthermore,women are also under-represented<strong>in</strong> the bus<strong>in</strong>ess enterprise sector wherethe EU’s R & D is most highly concentrated,as well as <strong>in</strong> senior academic gradesand <strong>in</strong>fluential positions (4) .In May 2008, the <strong>Europe</strong>an Commissionadopted a communication to launch an<strong>in</strong>itiative for creat<strong>in</strong>g a ‘<strong>Europe</strong>an partnershipfor researchers for mobility andcareer development’ (5) . The goal of this<strong>in</strong>itiative was to improve the mobility ofresearchers and to enhance the diffusionof knowledge throughout <strong>Europe</strong>, by: balanc<strong>in</strong>gdemand and supply for researchersat a <strong>Europe</strong>an level; help<strong>in</strong>g createcentres of excellence, and; improv<strong>in</strong>g theskills of researchers <strong>in</strong> <strong>Europe</strong>.(3) http://ec.europa.eu/<strong>in</strong>formation_society/eeurope/i2010/<strong>in</strong>dex_en.htm.(4) http://ec.europa.eu/research/science-society/<strong>in</strong>dex.cfm?fuseaction=public.topic&id=27.(5) http://eur-lex.europa.eu/LexUriServ/LexUriServ.do?uri=COM:2008:0317:FIN:EN:HTML.476 EUROPE IN FIGURES — <strong>Eurostat</strong> <strong>yearbook</strong> <strong>2009</strong>
Science and technology 14Def<strong>in</strong>ition and data availabilityResearchers are professionals engaged <strong>in</strong>the conception or creation of new knowledge,products, processes, methods andsystems, and <strong>in</strong> the management of theprojects concerned.Data on R & D personnel provide <strong>in</strong>dicatorsfor useful <strong>in</strong>ternational comparisonsof human resources devoted to R & D activity.R & D personnel <strong>in</strong>clude all personsemployed directly on R & D, plus personssupply<strong>in</strong>g direct services to R&D, such asmanagers, adm<strong>in</strong>istrative staff and officestaff. For statistical purposes, <strong>in</strong>dicatorson R & D personnel who are ma<strong>in</strong>ly orpartly employed on R & D are compiledas head counts (HC) and as full-timeequivalents (FTEs), or person-years.<strong>Eurostat</strong> also compiles a number of series<strong>in</strong> relation to stocks of human resources<strong>in</strong> science and technology (HRST) <strong>with</strong>breakdowns available accord<strong>in</strong>g to gender,age, region, sector of activity, occupation,educational atta<strong>in</strong>ment and fieldsof education (although it should be notedthat not all comb<strong>in</strong>ations are possible).This <strong>in</strong>formation is derived from the LabourForce Survey (LFS). HRST <strong>in</strong>dicatorsare presented as absolute <strong>figures</strong> andas shares of the economically active population<strong>in</strong> the age group 25 to 64 yearsold. HRST are def<strong>in</strong>ed as persons hav<strong>in</strong>geither successfully completed tertiary education,or persons who are employed <strong>in</strong>an occupation where such an education isnormally required.Data on employment <strong>in</strong> high-and medium-hightechnology manufactur<strong>in</strong>g and<strong>in</strong> high-technology knowledge-<strong>in</strong>tensiveservice sectors and related derived <strong>in</strong>dicatorsare also built-up us<strong>in</strong>g data fromthe LFS; these data are available both atthe national and regional level. The def<strong>in</strong>itionof high- and medium-high technologymanufactur<strong>in</strong>g sectors is based onthe OE<strong>CD</strong> def<strong>in</strong>ition. High-technologymanufactur<strong>in</strong>g comprises manufactur<strong>in</strong>gof office mach<strong>in</strong>ery and computers,manufactur<strong>in</strong>g of radio, television andcommunication equipment and apparatus,and manufactur<strong>in</strong>g of medical precisionand optical <strong>in</strong>struments, watches andclocks. Medium-high-technology manufactur<strong>in</strong>g<strong>in</strong>cludes the manufacture ofchemicals and chemical products, manufactureof mach<strong>in</strong>ery and equipmentn.e.c., manufacture of electrical mach<strong>in</strong>eryand apparatus n.e.c., manufacture ofmotor vehicles, trailers and semi-trailers,and manufactur<strong>in</strong>g of transport equipment.The def<strong>in</strong>ition of high-technologyknowledge-<strong>in</strong>tensive services (KIS) isbased on a selection of relevant items ofNACE Rev. 1; it comprises water transport,air transport, post and telecommunications,f<strong>in</strong>ancial <strong>in</strong>termediation,<strong>in</strong>surance and pension fund<strong>in</strong>g (exceptcompulsory social security), activitiesauxiliary to f<strong>in</strong>ancial <strong>in</strong>termediation, realestate activities, rent<strong>in</strong>g of mach<strong>in</strong>eryand equipment <strong>with</strong>out operator and ofpersonal and household goods, computerand related activities, research and development,other bus<strong>in</strong>ess activities, education,health and social work, and recreational,cultural and sport<strong>in</strong>g activities.EUROPE IN FIGURES — <strong>Eurostat</strong> <strong>yearbook</strong> <strong>2009</strong>477
14 Science and technologyEducation statistics are based on the InternationalStandard Classification ofEducation (ISCED). The basic unit ofclassification <strong>in</strong> ISCED-97 is the educationalprogramme. The number of PhDgraduates is measured by graduates fromISCED level 6. Indicators on the numberof PhD students provide an idea of theextent to which countries will have researchersat the highest level of education<strong>in</strong> the future. The data on scienceand technology graduates relate to thenumber of new graduates <strong>in</strong> the referenceyear, not the total number (stock) available<strong>in</strong> the labour market that year. Theterm PhD is def<strong>in</strong>ed <strong>in</strong> terms of generaltertiary programmes which lead to theaward of an advanced research degree,e.g. a doctorate <strong>in</strong> economics. The programmesare therefore devoted to advancedstudy and orig<strong>in</strong>al research andare not based on course-work alone. Theyusually require 3-5 years of research andcourse work, generally after a master’sdegree.The <strong>in</strong>dicator of tertiary graduates <strong>in</strong>science and technology <strong>in</strong>cludes newgraduates from all public and private <strong>in</strong>stitutionscomplet<strong>in</strong>g graduate and postgraduate studies <strong>in</strong> science and technologyfields, and is calculated as a percentageof all graduates.Ma<strong>in</strong> f<strong>in</strong>d<strong>in</strong>gsThe number of researchers <strong>in</strong> the EU-27regularly <strong>in</strong>creased <strong>in</strong> recent years. Therewere approximately 1.3 million researchers<strong>in</strong> full-time equivalents <strong>in</strong> the EU-27<strong>in</strong> 2006, which marked an 18 % <strong>in</strong>creaseon the level from 2000. Accord<strong>in</strong>g to agender breakdown, men accounted forthe majority of researchers <strong>in</strong> all sectors,and represented slightly less than threequarters (72 %) of the total R & D workforce;there was almost no change <strong>in</strong> theproportion of male and female researchersdur<strong>in</strong>g the period 2000-2006.Turn<strong>in</strong>g to a breakdown of the number ofresearchers by <strong>in</strong>stitutional sector, therewere different patterns among the MemberStates. The bus<strong>in</strong>ess sector concentratedmore than 60 % of all researchers<strong>in</strong> Luxembourg, Sweden, Austria, Denmark,Germany and the Netherlands <strong>in</strong>2006. Bulgaria was the only country toreport a majority of its researchers <strong>in</strong> thegovernment sector (almost 60 %), whilethe Baltic Member States, Poland, Slovakia,Greece, Cyprus, Portugal (2005) andMalta, all reported that more than half ofall researchers were work<strong>in</strong>g <strong>in</strong> the highereducation sector.The gender split among PhD students <strong>in</strong>2006 was generally much more balanced:as a majority of PhD students were female<strong>in</strong> the Baltic Member States, Portugal,Italy, F<strong>in</strong>land, Spa<strong>in</strong> and Bulgaria,and women accounted for at least 40 % ofPhD students <strong>in</strong> all of the other MemberStates for which data are available, <strong>with</strong>the exception of the Czech Republic andMalta.478 EUROPE IN FIGURES — <strong>Eurostat</strong> <strong>yearbook</strong> <strong>2009</strong>
Science and technology 14F<strong>in</strong>land reported the highest proportionof R & D personnel (3.0 %) as a share ofthe total labour force, <strong>with</strong> more thantwice the EU-27 average, which stoodat 1.3 % <strong>in</strong> 2006; the rema<strong>in</strong><strong>in</strong>g Nordiccountries and Luxembourg (all 2005)also reported a relatively high propensityto employ R & D personnel.An average of 6.6 % of those <strong>in</strong> employment<strong>in</strong> the EU-27 worked <strong>in</strong> high- andmedium-high-technology manufactur<strong>in</strong>gsectors <strong>in</strong> 2006 (a reduction of 0.8percentage po<strong>in</strong>ts <strong>in</strong> relation to the sharesome five years before). Germany and theCzech Republic had the highest shares oftheir national workforces employed <strong>with</strong><strong>in</strong>high- and medium-high-technologymanufactur<strong>in</strong>g sectors, both <strong>in</strong>to doubledigits,and <strong>in</strong> Slovakia this share grew ata rapid pace to reach 9.6 %. Sweden, Denmark,Luxembourg, the United K<strong>in</strong>gdom,the Netherlands and F<strong>in</strong>land hadthe highest shares of total employment<strong>in</strong> knowledge-<strong>in</strong>tensive services (KIS)<strong>in</strong> 2006, <strong>with</strong> upwards of 40 % of theirrespective workforces employed <strong>in</strong> thisarea. Furthermore, the share of the totalworkforce employed <strong>in</strong> these activitiesrose <strong>in</strong> each of the countries, often quiteconsiderably, between 1996 and 2006.EUROPE IN FIGURES — <strong>Eurostat</strong> <strong>yearbook</strong> <strong>2009</strong>479
14 Science and technologyTable 14.1: Researchers, by <strong>in</strong>stitutional sector, 2006 (1)Total -all sectorsBus<strong>in</strong>essenterprise sectorGovernmentsectorHighereducation sector(1 000 FTE) (1 000 FTE) (% of total) (1 000 FTE) (% of total) (1 000 FTE) (% of total)EU-27 1 301.0 641.3 49.3 180.4 13.9 462.9 35.6Euro area 895.3 450.3 50.3 124.5 13.9 308.7 34.5Belgium 33.9 17.1 50.5 2.5 7.4 14.0 41.4Bulgaria 10.3 1.3 12.6 6.1 59.5 2.8 26.7Czech Republic 26.3 11.3 43.0 6.6 25.0 8.4 31.8Denmark 28.7 17.4 60.6 2.2 7.6 8.9 31.0Germany 282.1 171.1 60.6 40.0 14.2 71.0 25.2Estonia 3.5 0.9 24.9 0.5 14.6 2.0 58.1Ireland 12.2 7.0 57.5 0.5 4.1 4.7 38.4Greece 19.9 5.4 27.1 2.3 11.3 12.1 60.8Spa<strong>in</strong> 115.8 39.9 34.5 20.1 17.3 55.4 47.9France (2) 204.5 108.8 53.2 25.9 12.7 66.3 32.4Italy (3) 82.5 28.8 34.9 14.9 18.0 37.1 44.9Cyprus 0.8 0.2 23.2 0.1 15.2 0.4 57.0Latvia 4.0 0.8 19.3 0.6 14.9 2.6 65.8Lithuania 8.0 0.9 10.9 1.7 21.2 5.5 67.8Luxembourg 2.3 1.7 73.9 0.4 16.5 0.2 9.6Hungary 17.5 6.2 35.6 5.2 29.8 6.1 34.6Malta 0.5 0.2 46.3 0.0 3.6 0.2 50.1Netherlands 45.9 27.8 60.6 7.1 15.6 : :Austria 30.5 19.4 63.6 1.2 4.0 9.7 31.9Poland 59.6 9.3 15.7 12.4 20.9 37.7 63.2Portugal (2) 21.1 4.0 19.0 3.3 15.8 11.0 51.9Romania 20.5 7.7 37.6 5.6 27.2 7.1 34.8Slovenia 5.8 2.3 38.8 1.8 30.9 1.7 29.8Slovakia 11.8 1.9 16.1 2.5 21.2 7.4 62.6F<strong>in</strong>land 40.4 22.7 56.2 4.5 11.1 12.8 31.8Sweden 55.7 37.7 67.6 3.0 5.5 14.7 26.4United K<strong>in</strong>gdom (4) 180.5 93.8 52.0 8.9 5.0 : :Croatia 5.2 0.7 13.8 1.6 31.2 2.9 54.9Turkey 42.7 11.2 26.4 4.7 11.0 26.7 62.6Iceland (2) 2.2 1.0 47.0 0.5 23.2 0.6 27.1Norway (5) 21.7 11.7 53.8 3.4 15.9 7.5 34.7Switzerland (6) 25.4 12.6 49.8 0.4 1.7 12.3 48.6Japan (2) 704.9 481.5 68.3 34.0 4.8 180.5 25.6United States (7) 1 394.7 1 104.5 79.2 : : : :(1) Shares do not sum to 100 % due to estimates, differences <strong>in</strong> reference years, the exclusion of private non-profit sector data from thetable and the conversion of data to a count <strong>in</strong> terms of FTE.(2) 2005.(3) Total - all sectors and higher education sector, 2005.(4) Total - all sectors, 2005.(5) 2005, except for bus<strong>in</strong>ess enterprise sector, 2006.(6) Total - all sectors, bus<strong>in</strong>ess enterprise sector and higher education sector, 2004.(7) Total - all sectors and bus<strong>in</strong>ess enterprise sector, 2005.Source: <strong>Eurostat</strong> (tsc00004), OE<strong>CD</strong>480 EUROPE IN FIGURES — <strong>Eurostat</strong> <strong>yearbook</strong> <strong>2009</strong>
Science and technology 14Figure 14.1: Gender breakdown of researchers <strong>in</strong> all <strong>in</strong>stitutional sectors, 2006 (1)(% of total researchers)100%75%50%25%0%EU-27 (2)Euro area (2)Lithuania (3)Bulgaria (3)LatviaPortugal (3)RomaniaSlovakiaEstonia (4)Spa<strong>in</strong>PolandCyprus (3)SloveniaGreece (3)Italy (3)HungaryBelgium (3)Denmark (3)FemaleMaleSweden (3)Ireland (3)Czech RepublicMalta (4)Luxembourg (3)Austria (5)Germany (3)Croatia (5)Iceland (3)Turkey(1) France, the Netherlands, F<strong>in</strong>land and the United K<strong>in</strong>gdom, not available.(2) Estimates.(3) 2005.(4) Provisional.(5) 2004.Source: <strong>Eurostat</strong> (tsc00006)Figure 14.2: Proportion of research and development personnel by sector, 2006(% of the total labour force)43210EU-27 (1)Euro area (1)F<strong>in</strong>landSweden (2)Luxembourg (2)Denmark (2)Austria (3)Belgium (4)Germany (2)France (2)Ireland (5)Spa<strong>in</strong>Czech RepublicSloveniaGreece (2)Estonia (5)HungaryItaly (2)Lithuania (2)Netherlands (6)LatviaHigher education sectorGovernment sectorBus<strong>in</strong>ess enterprise sectorMalta (5)SlovakiaPolandPortugal (2)Cyprus (2)United K<strong>in</strong>gdom (7)Bulgaria (2)RomaniaIceland (2)Norway (8)Croatia (3)Turkey(1) Estimates.(2) 2005.(3) 2004.(4) Bus<strong>in</strong>ess enterprise sector, estimate; government sector and higher education sector, 2005.(5) Bus<strong>in</strong>ess enterprise sector, estimate.(6) Bus<strong>in</strong>ess enterprise sector and government sector, 2005; higher education sector, not available.(7) Bus<strong>in</strong>ess enterprise sector and government sector, estimate; higher education sector, not available.(8) Government sector and high education sector, 2005.Source: <strong>Eurostat</strong> (tsc00002)EUROPE IN FIGURES — <strong>Eurostat</strong> <strong>yearbook</strong> <strong>2009</strong>481
14 Science and technologyTable 14.2: PhD students (ISCED level 6), 2006(% of total PhD students)Totalnumberof PhDstudents(1 000) Male FemaleSocialsciences,bus<strong>in</strong>ess&lawTeachertra<strong>in</strong><strong>in</strong>g& educ.;humanities& artsScience,maths &comput<strong>in</strong>g;eng<strong>in</strong>eer<strong>in</strong>g,manuf. &constructionAgriculture& veter<strong>in</strong>aryHealth &welfare;servicesOthers(1)EU-27 516.5 52.4 47.6 22.9 21.6 36.9 2.8 13.9 1.9Belgium 7.5 59.0 41.0 19.6 13.3 46.2 7.1 13.9 0.0Bulgaria 5.2 49.7 50.3 21.2 22.5 39.7 3.8 12.8 0.0Czech Republic 22.6 62.1 37.9 16.3 15.3 46.4 4.5 15.8 1.7Denmark 4.8 54.2 45.8 12.8 14.5 39.3 8.2 25.2 0.0Germany : : : : : : : : :Estonia 2.0 46.5 53.5 21.2 21.0 42.3 5.6 9.8 0.0Ireland 5.1 52.1 47.9 14.7 21.0 49.2 2.0 8.4 4.6Greece (2) 22.5 55.6 44.4 17.5 22.6 55.9 1.7 2.2 0.0Spa<strong>in</strong> 77.1 49.0 51.0 23.9 21.8 22.8 2.0 18.5 10.9France 69.8 53.9 46.1 30.7 27.0 38.9 0.1 3.3 0.0Italy 38.3 48.3 51.7 19.7 15.0 42.4 6.3 15.6 0.9Cyprus 0.3 51.0 49.0 21.2 28.8 50.0 0.0 0.0 0.0Latvia 1.8 39.6 60.4 33.5 24.1 30.1 2.2 10.1 0.0Lithuania 2.9 43.4 56.6 31.6 13.8 40.8 3.7 10.1 0.0Luxembourg : : : : : : : : :Hungary 8.0 53.0 47.0 20.6 24.9 32.2 6.0 16.3 0.0Malta 0.1 64.1 35.9 20.3 37.5 28.1 0.0 14.1 0.0Netherlands (3) 7.4 58.6 41.4 : : : : : :Austria 16.8 54.3 45.7 37.9 24.4 29.6 3.3 4.7 0.0Poland 32.7 50.7 49.3 24.1 30.5 31.2 5.0 9.2 0.0Portugal 20.5 44.0 56.0 30.2 23.8 29.4 1.8 14.8 0.0Romania 21.7 51.7 48.3 17.5 15.3 31.6 7.8 27.7 :Slovenia 1.1 53.5 46.5 15.8 17.2 47.8 3.9 15.3 0.0Slovakia 10.7 57.1 42.9 19.8 18.4 39.4 3.4 18.9 :F<strong>in</strong>land 22.1 48.4 51.6 22.6 24.3 40.2 2.1 10.9 0.0Sweden 21.4 51.3 48.7 12.4 12.6 41.5 2.0 31.6 0.0United K<strong>in</strong>gdom 94.2 55.4 44.6 20.9 21.6 40.5 1.4 15.3 0.3Croatia 1.3 53.3 46.7 7.2 22.0 46.2 6.5 18.1 0.0Turkey 32.6 60.6 39.4 24.3 22.5 33.4 8.1 11.7 0.0Iceland 0.2 41.7 58.3 17.3 28.8 26.9 0.0 26.9 0.0Norway 5.0 53.6 46.4 17.4 12.7 41.1 4.4 24.4 0.0Switzerland 17.2 59.7 40.3 26.3 15.6 39.7 2.8 15.3 0.4Japan 75.0 70.3 29.7 13.2 13.6 33.0 5.8 32.4 2.0United States 388.7 48.2 51.8 26.9 24.4 30.3 0.8 17.7 0.0(1) Unknown or not specified.(2) 2005, except for total number of PhD students, 2006.(3) Total number of PhD students, 2005.Source: <strong>Eurostat</strong> (educ_enrl5)482 EUROPE IN FIGURES — <strong>Eurostat</strong> <strong>yearbook</strong> <strong>2009</strong>
Science and technology 14Table 14.3: Human resources <strong>in</strong> science and technology (1)People work<strong>in</strong>g <strong>in</strong> aS&T occupationPeople who have a third level educationand work <strong>in</strong> a S&T occupation(1 000) (% of total employment)(1 000) (% of total employment)2006 2003 2004 2005 2006 2006 2003 2004 2005 2006EU-27 58 856 27.3 28.0 28.4 29.0 34 455 15.4 16.1 16.6 17.0Belgium 1 303 29.6 29.9 31.1 31.2 919 21.0 21.4 21.6 22.0Bulgaria 635 22.0 21.2 22.0 20.6 488 15.6 15.4 16.2 15.9Czech Republic 1 467 29.0 29.3 31.0 31.3 537 10.1 10.4 11.1 11.5Denmark 983 36.9 37.3 38.9 40.2 676 24.6 25.4 26.5 27.6Germany 12 474 32.9 33.0 33.5 34.5 6 416 16.9 17.3 17.8 17.7Estonia 152 23.2 22.8 26.1 26.0 106 15.5 14.9 17.3 18.2Ireland 419 24.1 24.7 24.2 24.2 324 17.7 18.3 18.1 18.7Greece (2) 970 19.6 21.0 20.9 22.0 754 15.0 16.5 16.3 17.1Spa<strong>in</strong> 4 435 21.3 22.4 23.5 23.4 3 519 16.2 17.3 18.1 18.6France 7 299 29.4 29.3 29.9 29.9 4 567 17.6 17.5 18.3 18.7Italy (2) 6 785 27.0 29.1 28.6 30.4 2 633 10.2 11.2 11.1 11.8Cyprus 85 26.8 25.9 25.3 26.0 65 20.1 19.7 18.8 20.0Latvia (3) 250 21.8 21.4 23.6 25.6 142 10.5 12.2 13.9 14.5Lithuania 353 21.1 22.5 25.3 24.8 245 13.5 15.0 17.3 17.2Luxembourg (4) 74 32.8 38.4 38.2 38.7 45 14.1 23.0 25.7 23.9Hungary 987 24.8 25.5 24.5 25.4 569 13.4 14.4 14.0 14.6Malta 35 23.8 24.4 26.5 26.6 17 10.1 12.7 13.3 12.8Netherlands (3) 2 719 39.0 40.0 39.8 38.3 1 640 21.6 23.4 24.0 23.1Austria (2) 1 075 25.4 32.5 31.0 30.8 443 11.7 13.5 12.9 12.7Poland 3 577 22.2 22.4 22.9 24.3 2 194 11.7 12.6 13.5 14.9Portugal (2) 842 14.8 17.5 17.3 17.9 524 8.8 10.9 10.7 11.1Romania 1 652 17.7 18.0 18.3 19.3 935 8.7 9.6 9.9 10.9Slovenia (3) 286 29.2 29.7 31.2 32.0 162 15.2 15.7 16.8 18.2Slovakia 634 25.1 24.4 25.6 27.0 274 9.5 9.7 10.7 11.7F<strong>in</strong>land 789 31.9 32.8 33.5 34.4 550 22.7 23.3 23.4 24.0Sweden 1 641 39.1 39.3 39.6 40.0 1 005 22.5 22.9 23.9 24.5United K<strong>in</strong>gdom 6 935 26.2 26.9 27.3 28.0 4 704 17.7 18.4 18.7 19.0Turkey 2 422 : : : 12.5 1 488 : : : 7.7Iceland 50 34.4 34.1 37.7 36.4 22 22.0 21.6 23.9 16.1Norway 809 36.7 37.9 39.1 39.3 565 24.5 25.3 26.8 27.4Switzerland 1 396 37.9 38.4 38.7 39.7 763 19.5 20.1 20.9 21.7(1) Break <strong>in</strong> series, 2006, <strong>with</strong> the exception of Belgium and Luxembourg.(2) Break <strong>in</strong> series, 2004.(3) Break <strong>in</strong> series, 2003.(4) Break <strong>in</strong> series, 2003 and 2004.Source: <strong>Eurostat</strong> (hrst_st_nsec)EUROPE IN FIGURES — <strong>Eurostat</strong> <strong>yearbook</strong> <strong>2009</strong>483
14 Science and technologyTable 14.4: Science and technology graduates(tertiary graduates <strong>in</strong> science and technology per 1 000 persons aged 20-29 years)Total Male Female2000 2005 2000 2005 2000 2005EU-27 10.0 12.9 13.7 17.6 6.2 8.2Belgium 9.7 10.9 14.4 15.7 4.9 6.0Bulgaria 6.6 8.6 7.0 9.9 6.1 7.3Czech Republic 5.5 8.2 7.8 11.7 3.0 4.6Denmark 11.7 14.7 16.5 19.3 6.8 10.1Germany 8.2 9.7 12.6 14.5 3.6 4.8Estonia 7.8 12.1 10.0 13.5 5.7 10.7Ireland 24.2 24.5 29.8 33.8 18.5 15.0Greece : 10.1 : 11.5 : 8.7Spa<strong>in</strong> 9.9 11.8 13.3 16.2 6.4 7.2France 19.6 22.5 27.0 32.0 12.1 12.9Italy 5.7 9.7 7.2 12.2 4.3 7.2Cyprus 3.4 3.6 4.9 4.3 2.0 2.7Latvia 7.4 9.8 10.1 13.0 4.7 6.5Lithuania 13.5 18.9 17.2 24.2 9.7 13.5Luxembourg 1.8 : : : : :Hungary 4.5 5.1 6.8 7.0 2.1 3.1Malta 3.4 3.4 4.9 4.6 1.9 2.1Netherlands 5.8 8.6 9.5 13.6 2.1 3.5Austria 7.2 9.8 11.6 14.8 2.9 4.6Poland 6.6 11.1 8.3 13.9 4.8 8.3Portugal 6.3 12.0 7.3 14.3 5.4 9.7Romania 4.9 10.3 6.2 12.1 3.5 8.5Slovenia 8.9 9.8 13.3 14.1 4.2 5.3Slovakia 5.3 10.2 7.3 12.9 3.2 7.3F<strong>in</strong>land 16.0 17.7 22.7 24.3 8.9 10.8Sweden 11.6 14.4 15.5 18.7 7.6 9.9United K<strong>in</strong>gdom 18.5 18.4 25.2 25.3 11.9 11.4Croatia : 5.7 : 7.5 : 3.8FYR of Macedonia 3.7 4.0 4.2 4.1 3.1 3.8Turkey 4.4 5.7 5.9 8.0 2.8 3.3Iceland 8.4 10.1 10.3 12.5 6.5 7.6Liechtenste<strong>in</strong> : 12.7 : 18.1 : 7.3Norway 7.9 9.0 11.4 13.1 4.3 4.7Switzerland : 16.1 : 26.8 : 5.4Japan 12.6 13.7 21.5 23.0 3.3 4.1United States 9.7 10.6 13.0 14.2 6.2 6.8Source: <strong>Eurostat</strong> (tsiir050)484 EUROPE IN FIGURES — <strong>Eurostat</strong> <strong>yearbook</strong> <strong>2009</strong>
Science and technology 14Table 14.5: Proportion of persons work<strong>in</strong>g <strong>in</strong> high- and medium-high-technologymanufactur<strong>in</strong>g and knowledge-<strong>in</strong>tensive service sectors (1)(% of total employment)Employment <strong>in</strong> high- andmedium-high-technology manufactur<strong>in</strong>g1996 2001 2006 1996 2001 2006EU-27 : 7.4 6.6 : 30.9 32.8Belgium 7.7 6.9 6.3 34.6 37.8 38.8Bulgaria : 5.5 4.9 : 23.1 22.0Czech Republic : 9.2 10.4 : 24.1 25.1Denmark 7.1 7.0 6.0 40.1 42.7 43.5Germany 11.1 11.2 10.7 27.9 31.0 34.1Estonia : 4.9 3.8 : 28.0 28.6Ireland 7.1 7.3 5.7 30.2 32.0 34.9Greece 2.3 2.2 2.3 20.5 22.5 25.0Spa<strong>in</strong> 5.1 5.5 4.5 23.6 24.8 27.9France 7.0 7.2 5.9 33.6 35.0 36.9Italy 7.4 7.4 7.6 24.7 27.0 30.4Cyprus : 1.0 1.0 : 26.5 28.3Latvia : 1.7 1.7 : 24.8 25.5Lithuania : 3.1 2.5 : 26.9 25.6Luxembourg 1.7 1.2 1.3 33.4 35.8 43.5Hungary 7.6 8.7 8.5 25.3 26.3 28.4Malta : 8.0 6.6 : 27.8 31.0Netherlands 5.1 4.3 3.1 36.4 40.0 42.0Austria 6.6 6.5 7.0 26.5 29.3 30.4Poland : : 5.1 : : 24.7Portugal 4.2 3.6 3.3 22.0 19.7 23.1Romania : 5.1 5.5 : 11.3 14.6Slovenia 9.2 8.8 8.7 20.8 23.1 26.2Slovakia : 6.8 9.6 : 25.3 24.9F<strong>in</strong>land 7.2 7.4 6.8 37.4 39.1 41.1Sweden 8.4 7.7 6.3 44.2 46.1 47.7United K<strong>in</strong>gdom 7.9 7.1 5.5 37.3 40.5 43.0Croatia : : 4.7 : : 23.0Turkey : : 3.6 : : 12.8Iceland 1.5 1.7 1.7 38.4 40.9 42.5Norway 5.5 4.2 4.5 40.6 43.6 46.1Switzerland 7.8 8.1 7.3 34.1 39.0 41.3(1) Break <strong>in</strong> series, 2006, <strong>with</strong> the exception of Belgium and Luxembourg.Source: <strong>Eurostat</strong> (tsc00011 and tsc00012)Employment <strong>in</strong>knowledge-<strong>in</strong>tensive servicesEUROPE IN FIGURES — <strong>Eurostat</strong> <strong>yearbook</strong> <strong>2009</strong>485
14 Science and technology14.2 ExpenditureIntroductionResearch and development (R & D) liesat the heart of the EU’s strategy to becomethe most competitive and dynamicknowledge-based economy by 2010; oneof the orig<strong>in</strong>al goals set by the Lisbonstrategy was for the EU to <strong>in</strong>crease itsR & D expenditure to at least 3 % of GDPby 2010.One area that has received notable attention<strong>in</strong> recent years is the structuraldifference <strong>in</strong> R & D fund<strong>in</strong>g between<strong>Europe</strong> and its ma<strong>in</strong> competitors. Policymakers<strong>in</strong> <strong>Europe</strong> have tried to <strong>in</strong>creaseR & D bus<strong>in</strong>ess expenditure so that it ismore <strong>in</strong> l<strong>in</strong>e <strong>with</strong> the ratios observed <strong>in</strong>Japan or the United States. In October2008, the EU <strong>in</strong>dustrial R & D <strong>in</strong>vestmentscoreboard was released (6) . Thispresents <strong>in</strong>formation on the top 1 000companies <strong>in</strong> terms of R & D <strong>in</strong>vestorswhose registered offices are <strong>in</strong> the EU.The report shows that R & D <strong>in</strong>vestmentby the top 1 000 EU companies grew <strong>in</strong>2007 at a faster pace than for non-EUcompetitors from either the United Statesor Japan; note there was a marked reduction<strong>in</strong> <strong>in</strong>vestment activity <strong>in</strong> the UnitedStates. Nevertheless, the data presentedshow that R & D <strong>in</strong>vestment by EU companiesgrew for the fifth consecutive year.The regional distribution of companies <strong>in</strong>the top 50 R & D <strong>in</strong>vestors <strong>in</strong> 2007 wassplit: 20 <strong>in</strong> the United States, 18 <strong>in</strong> the EUand 9 <strong>in</strong> Japan. Nokia was the EU company<strong>with</strong> the highest level of R & D <strong>in</strong>vestment<strong>in</strong> 2007, while Volkswagen andDaimler were also among the top 10 <strong>in</strong>the world, as was Roche (Switzerland).In January 2006 the <strong>Europe</strong>an Commissionpresented to the <strong>Europe</strong>an Councilits 2006 annual report on the revised Lisbonstrategy, <strong>in</strong> the form of a communication– COM(2006) 30 – entitled ‘Timeto move up a gear – the new partnershipfor growth and jobs’ (7) . One of thefour areas for priority actions set out bythe <strong>Europe</strong>an Commission was to <strong>in</strong>vestmore <strong>in</strong> knowledge and <strong>in</strong>novation, andto <strong>in</strong>crease the proportion of nationalwealth devoted to research and developmentthrough to 2010. The communicationalso referred to planned spend<strong>in</strong>gtargets for R & D, stat<strong>in</strong>g that if thesewere met <strong>in</strong> the 18 countries that hadset targets as part of their national plansthen R & D expenditure was estimated torise to 2.6 % of GDP by 2010. The communicationalso stressed that while allMember States appreciate the importanceof the spread and effective use of <strong>in</strong>formationand communication technologiesand environmental technologies, the l<strong>in</strong>kbetween the identified challenges and themeasures proposed to address them <strong>in</strong>national plans was not always clear.Def<strong>in</strong>ition and data availabilityR & D is def<strong>in</strong>ed as compris<strong>in</strong>g creativework undertaken on a systematic basis to<strong>in</strong>crease the stock of knowledge (of man,culture and society) and the use of thisstock to devise new applications. R & Dis an activity where there are significanttransfers of resources between units, organisationsand sectors.(6) http://iri.jrc.ec.europa.eu/research/docs/2008/Scoreboard_2008.pdf.(7) http://eur-lex.europa.eu/LexUriServ/site/en/com/2006/com2006_0030en01.pdf.486 EUROPE IN FIGURES — <strong>Eurostat</strong> <strong>yearbook</strong> <strong>2009</strong>
Science and technology 14R & D expenditure is a basic measurethat covers <strong>in</strong>tramural expenditure, <strong>in</strong>other words, all expenditures for R & Dthat are performed <strong>with</strong><strong>in</strong> a statisticalunit or sector of the economy, whateverthe source of the funds. Expendituresmade outside the statistical unit or sectorbut <strong>in</strong> support of <strong>in</strong>tramural R & D (forexample, purchase of supplies for R & D)are <strong>in</strong>cluded; both current and capital expendituresare <strong>in</strong>cluded.Gross domestic expenditure on R & D(often referred to as GERD) is composedof four separate sectors of performance:bus<strong>in</strong>ess enterprises, government, highereducation, and private non-profit organisations.Expenditure data consider theresearch spend on the national territory,regardless of the source of funds; data areusually expressed <strong>in</strong> relation to GDP, otherwiseknown as R & D <strong>in</strong>tensity.Government budget appropriations oroutlays for research and development(GBAORD) are the amount governmentsallocate towards R & D activities and<strong>in</strong>clude all appropriations allocated toR & D <strong>in</strong> central (or federal) governmentbudgets. Prov<strong>in</strong>cial (or State) governmentis only <strong>in</strong>cluded if the contribution is significant,whereas local government fundsare excluded. Comparisons of GBAORDacross countries give an impression ofthe relative importance attached to statefundedR & D.Ma<strong>in</strong> f<strong>in</strong>d<strong>in</strong>gsGross domestic expenditure on R & D(GERD) for the EU-27 followed a generallypositive evolution <strong>in</strong> the five yearsup to 2002. However, <strong>in</strong> 2003 the shareof R & D expenditure <strong>in</strong> GDP decreasedand this pattern was repeated <strong>in</strong> 2004,although a small ga<strong>in</strong> was recorded <strong>in</strong>2005. The latest <strong>in</strong>formation availablefor 2006 showed that GERD was stable,account<strong>in</strong>g for 1.84 % share of GDP. Asnoted above, the EU-27’s R & D expendituretends to lag beh<strong>in</strong>d that of Japanand the United States. For comparison,Japanese GERD was 3.32 % of GDP <strong>in</strong>2005, and the correspond<strong>in</strong>g share <strong>in</strong> theUnited States for 2006 was 2.61 % (theJapanese share has followed an upwardtrend over the last decade for which dataare available, while the trend of GERD <strong>in</strong>the United States was similar to that observedfor the EU-27). As noted above,these differences are often expla<strong>in</strong>ed as aresult of the levels of expenditure <strong>with</strong><strong>in</strong>the bus<strong>in</strong>ess enterprise sector, where expenditure<strong>in</strong> the EU-27 was considerablylower (1.17 % of GDP) than <strong>in</strong> the UnitedStates (1.83 %) <strong>in</strong> 2006.Among the Member States, the highestR & D <strong>in</strong>tensity was recorded <strong>in</strong> Swedenand F<strong>in</strong>land, the only Member Stateswhere R & D <strong>in</strong>tensity exceeded the 3 %goal set by the Lisbon strategy. In contrast,there were ten Member States thatreported R & D expenditure account<strong>in</strong>gfor less than 1 % of their GDP <strong>in</strong> 2006.When focus<strong>in</strong>g on the breakdown ofgross domestic expenditure on R & D bysource of funds <strong>in</strong> 2005, slightly morethan half of the total (54.6 %) <strong>in</strong> theEU-27 came from the bus<strong>in</strong>ess enterprisesector, while just over one third (34.2 %)was derived from government, and a further8.9 % came from abroad; <strong>in</strong>dustryfundedR & D accounted for 76.1 % ofR & D expenditure <strong>in</strong> Japan and 64.9 %<strong>in</strong> the United States (2006).EUROPE IN FIGURES — <strong>Eurostat</strong> <strong>yearbook</strong> <strong>2009</strong>487
14 Science and technologyTable 14.6: Gross domestic expenditure on R & D (GERD)(% of GDP)1996 1997 1998 1999 2000 2001 2002 2003 2004 2005 2006EU-27 1.76 1.78 1.79 1.84 1.86 1.87 1.88 1.87 1.83 1.84 1.84Euro area : : : : 1.84 1.86 1.87 1.87 1.85 1.85 1.86Belgium 1.77 1.83 1.86 1.94 1.97 2.08 1.94 1.88 1.87 1.84 1.83Bulgaria (1, 2) 0.52 0.51 0.57 0.57 0.52 0.47 0.49 0.50 0.50 0.49 0.48Czech Republic 0.97 1.08 1.15 1.14 1.21 1.20 1.20 1.25 1.25 1.41 1.54Denmark 1.84 1.92 2.04 2.18 2.24 2.39 2.51 2.58 2.48 2.45 2.43Germany 2.19 2.24 2.27 2.40 2.45 2.46 2.49 2.52 2.49 2.48 2.53Estonia : : 0.57 0.69 0.61 0.71 0.72 0.77 0.86 0.93 1.14Ireland 1.30 1.27 1.24 1.18 1.12 1.10 1.10 1.17 1.24 1.26 1.32Greece : 0.45 : 0.60 : 0.58 : 0.57 0.55 0.58 0.57Spa<strong>in</strong> 0.81 0.80 0.87 0.86 0.91 0.91 0.99 1.05 1.06 1.12 1.20France (3, 4, 5) 2.27 2.19 2.14 2.16 2.15 2.20 2.23 2.17 2.15 2.12 2.09Italy (3) 0.99 1.03 1.05 1.02 1.05 1.09 1.13 1.11 1.10 1.09 :Cyprus : : 0.22 0.23 0.24 0.25 0.30 0.35 0.37 0.40 0.42Latvia 0.42 0.38 0.40 0.36 0.44 0.41 0.42 0.38 0.42 0.56 0.70Lithuania (1) 0.50 0.54 0.55 0.50 0.59 0.67 0.66 0.67 0.76 0.76 0.80Luxembourg : : : : 1.65 : : 1.66 1.63 1.57 1.47Hungary (5) 0.65 0.72 0.68 0.69 0.78 0.92 1.00 0.93 0.88 0.94 1.00Malta (5) : : : : : : 0.26 0.26 0.54 0.54 0.54Netherlands (1) 1.98 1.99 1.90 1.96 1.82 1.80 1.72 1.76 1.78 1.74 1.67Austria 1.59 1.69 1.77 1.88 1.91 2.04 2.12 2.23 2.22 2.43 2.49Poland 0.65 0.65 0.67 0.69 0.64 0.62 0.56 0.54 0.56 0.57 0.56Portugal 0.57 0.59 0.65 0.71 0.76 0.80 0.76 0.74 0.77 0.81 0.83Romania : : 0.49 0.40 0.37 0.39 0.38 0.39 0.39 0.41 0.45Slovenia 1.31 1.29 1.36 1.39 1.41 1.52 1.49 1.29 1.42 1.46 1.59Slovakia (3) 0.91 1.08 0.78 0.66 0.65 0.64 0.57 0.57 0.51 0.51 0.49F<strong>in</strong>land 2.52 2.70 2.86 3.16 3.34 3.30 3.36 3.43 3.45 3.48 3.45Sweden (6) : 3.47 3.55 3.57 : 4.18 : 3.86 3.62 3.80 3.73United K<strong>in</strong>gdom 1.86 1.80 1.79 1.86 1.85 1.82 1.82 1.78 1.71 1.76 1.78Croatia : : : : : : 1.04 1.05 1.13 1.00 0.87Turkey 0.45 0.49 0.37 0.47 0.48 0.54 0.53 0.48 0.52 0.59 0.58Iceland : 1.83 2.00 2.30 2.67 2.95 2.95 2.82 : 2.77 :Norway : 1.63 : 1.64 : 1.59 1.66 1.71 1.59 1.52 1.52Switzerland 2.65 : : : 2.53 : : : 2.90 : :Japan (1) 2.81 2.87 3.00 3.02 3.04 3.12 3.17 3.20 3.17 3.32 :United States 2.53 2.56 2.61 2.65 2.73 2.74 2.64 2.67 2.58 2.61 2.61(1) Break <strong>in</strong> series, 1996.(2) Break <strong>in</strong> series, 1999.(3) Break <strong>in</strong> series, 1997.(4) Break <strong>in</strong> series, 2000.(5) Break <strong>in</strong> series, 2004.(6) Break <strong>in</strong> series, 2005.Source: <strong>Eurostat</strong> (tsiir020), OE<strong>CD</strong>488 EUROPE IN FIGURES — <strong>Eurostat</strong> <strong>yearbook</strong> <strong>2009</strong>
Science and technology 14Table 14.7: Gross domestic expenditure on R & D by sector(% of GDP)Bus<strong>in</strong>ess enterprise sector Government sector Higher education sector2001 2006 2001 2006 2001 2006EU-27 1.21 1.17 0.25 0.25 0.40 0.40Euro area 1.19 1.18 0.27 0.27 0.39 0.39Belgium 1.51 1.24 0.13 0.16 0.41 0.41Bulgaria 0.10 0.12 0.31 0.31 0.06 0.05Czech Republic 0.72 1.02 0.29 0.27 0.19 0.25Denmark (1) 1.64 1.62 0.28 0.16 0.45 0.63Germany 1.72 1.77 0.34 0.35 0.40 0.41Estonia 0.24 0.51 0.10 0.15 0.36 0.46Ireland 0.77 0.89 0.09 0.09 0.24 0.34Greece 0.19 0.17 0.13 0.12 0.26 0.27Spa<strong>in</strong> (2) 0.48 0.67 0.15 0.20 0.28 0.33France (3, 4, 5) 1.39 1.32 0.36 0.36 0.42 0.38Italy (6) 0.53 0.54 0.20 0.19 0.35 :Cyprus 0.05 0.09 0.12 0.12 0.07 0.18Latvia 0.15 0.35 0.09 0.11 0.17 0.24Lithuania 0.20 0.22 0.27 0.18 0.21 0.40Luxembourg : 1.25 0.14 0.19 0.01 0.04Hungary (7) 0.37 0.48 0.24 0.25 0.24 0.24Malta (4) : 0.34 : 0.03 : 0.18Netherlands (8) 1.05 0.96 0.25 0.24 0.49 :Austria : 1.66 : 0.13 : 0.65Poland 0.22 0.18 0.19 0.21 0.20 0.17Portugal 0.26 0.35 0.17 : 0.29 :Romania 0.24 0.22 0.11 0.15 0.04 0.08Slovenia 0.88 0.96 0.37 0.39 0.25 0.24Slovakia 0.43 0.21 0.15 0.16 0.06 0.12F<strong>in</strong>land 2.35 2.46 0.34 0.32 0.60 0.65Sweden (9) 3.23 2.79 0.12 0.17 0.83 0.76United K<strong>in</strong>gdom (3, 10) 1.19 1.10 0.18 0.18 0.41 0.46Croatia : 0.32 : 0.23 : 0.32Turkey 0.18 0.21 0.04 0.07 0.32 0.30Iceland 1.74 : 0.59 : 0.55 :Norway 0.95 0.82 0.23 0.24 0.41 0.46Switzerland : : : 0.02 : :Japan 2.30 : 0.30 : 0.45 :United States 1.99 1.83 0.31 0.29 0.33 0.37(1) Break <strong>in</strong> series, government sector and higher education sector, 2002.(2) Break <strong>in</strong> series, bus<strong>in</strong>ess enterprise sector, 2002.(3) Break <strong>in</strong> series, bus<strong>in</strong>ess enterprise sector, 2001.(4) Break <strong>in</strong> series, bus<strong>in</strong>ess enterprise sector, 2004.(5) Break <strong>in</strong> series, higher education sector, 2004.(6) Break <strong>in</strong> series, higher education sector, 2005.(7) Break <strong>in</strong> series, government sector, 2004.(8) Break <strong>in</strong> series, government sector, 2003.(9) Break <strong>in</strong> series, bus<strong>in</strong>ess enterprise sector, government sector and higher education sector, 2005.(10) Break <strong>in</strong> series, government sector, 2001.Source: <strong>Eurostat</strong> (tsc00001), OE<strong>CD</strong>EUROPE IN FIGURES — <strong>Eurostat</strong> <strong>yearbook</strong> <strong>2009</strong>489
14 Science and technologyTable 14.8: Gross domestic expenditure on R & D by source of funds(% of total gross expenditure on R & D)Bus<strong>in</strong>ess enterprise Government Abroad2001 (1) 2006 (2) 2001 (1) 2006 (2) 2001 (1) 2006 (2)EU-27 55.9 54.6 33.9 34.2 8.0 8.9Euro area 57.2 56.7 35.7 35.0 5.8 6.8Belgium 63.4 59.7 22.0 24.7 12.1 12.4Bulgaria 27.1 27.8 66.2 63.9 5.7 7.6Czech Republic 52.5 56.9 43.6 39.0 2.2 3.1Denmark 61.4 59.5 28.2 27.6 7.8 10.1Germany 65.7 67.6 31.4 28.4 2.5 3.7Estonia 32.9 38.1 52.0 44.6 12.5 16.3Ireland 66.7 59.3 25.6 30.1 6.0 8.9Greece 33.0 31.1 46.6 46.8 18.4 19.0Spa<strong>in</strong> 47.2 47.1 39.9 42.5 7.7 5.9France (3) 54.2 52.2 36.9 38.4 7.2 7.5Italy : 39.7 : 50.7 : 8.0Cyprus 15.3 16.8 65.5 67.0 12.6 10.9Latvia 18.3 32.7 50.0 58.2 31.7 7.5Lithuania 37.1 26.2 56.3 53.6 6.6 14.3Luxembourg 90.7 79.7 7.7 16.6 1.6 3.6Hungary (4) 34.8 43.3 53.6 44.8 9.2 11.3Malta 18.6 52.1 59.8 34.4 21.6 13.5Netherlands 51.9 : 35.8 : 11.0 :Austria 41.8 45.6 38.3 36.0 19.7 16.4Poland 30.8 33.1 64.8 57.5 2.4 7.0Portugal 31.5 36.3 61.0 55.2 5.1 4.7Romania 47.6 30.4 43.0 64.1 8.2 4.1Slovenia 54.7 59.3 37.1 34.4 7.2 5.8Slovakia 56.1 35.0 41.3 55.6 1.9 9.1F<strong>in</strong>land (5) 70.8 66.6 25.5 25.1 2.5 7.1Sweden (6) 71.5 65.7 21.3 23.5 3.4 7.7United K<strong>in</strong>gdom 45.5 45.2 28.9 31.9 19.7 17.0Croatia 45.7 34.6 46.4 55.8 1.5 6.8Turkey 44.9 46.0 48.0 48.6 0.8 0.5Iceland 46.2 48.0 34.0 40.5 18.3 11.2Norway 51.6 46.4 39.8 44.0 7.1 8.0Switzerland 69.1 69.7 23.2 22.7 4.3 5.2Japan 73.0 76.1 18.6 16.8 0.4 0.3United States 66.6 64.9 27.5 29.3 : :(1) Malta and Croatia, 2002; Luxembourg and Switzerland, 2000.(2) EU-27, euro area, Belgium, Bulgaria, Denmark, Germany, Greece, France, Italy, Cyprus, Luxembourg, Portugal, Sweden, Iceland,Norway and Japan, 2005; Switzerland, 2004.(3) Break <strong>in</strong> series, 2004.(4) Break <strong>in</strong> series for government sector, 2004.(5) Break <strong>in</strong> series for abroad, 2005.(6) Break <strong>in</strong> series, 2005.Source: <strong>Eurostat</strong> (tsiir030), OE<strong>CD</strong>490 EUROPE IN FIGURES — <strong>Eurostat</strong> <strong>yearbook</strong> <strong>2009</strong>
Science and technology 1414.3 PatentsIntroductionIntellectual property rights and <strong>in</strong> particularpatents provide a l<strong>in</strong>k between <strong>in</strong>novation,<strong>in</strong>ventions and the marketplace.Apply<strong>in</strong>g for a patent makes an <strong>in</strong>ventionpublic, but at the same time gives it protection.A count of patents is one measurethat reflects a country’s <strong>in</strong>ventive activityand also shows its capacity to exploitknowledge and translate it <strong>in</strong>to potentialeconomic ga<strong>in</strong>s. In this context, <strong>in</strong>dicatorsbased on patent statistics are widelyused to assess the <strong>in</strong>ventive and <strong>in</strong>novativeperformance of a country.Patents are generally used to protectR & D results, but they are also significantas a source of technical <strong>in</strong>formation,which may prevent re-<strong>in</strong>vent<strong>in</strong>gand re-develop<strong>in</strong>g ideas because of alack of <strong>in</strong>formation. However, the use ofpatents is relatively restricted <strong>with</strong><strong>in</strong> theEU – this may be for a number of reasons<strong>in</strong>clud<strong>in</strong>g: their relative cost; the overlapbetween national and <strong>Europe</strong>an procedures;or the need for translation <strong>in</strong>to foreignlanguages.Most studies <strong>in</strong> this area show that <strong>in</strong>novativeenterprises tend to make moreuse of <strong>in</strong>tellectual property protectionthan companies that do not <strong>in</strong>novate.Enterprise size and the economic sector<strong>in</strong> which an enterprise operates are alsolikely to play an important role <strong>in</strong> determ<strong>in</strong><strong>in</strong>gwhether an enterprise chooses toprotect its <strong>in</strong>tellectual property.The <strong>Europe</strong>an Council held <strong>in</strong> Lisbon<strong>in</strong> March 2000 called for the creation ofa Community patent system to addressshortcom<strong>in</strong>gs <strong>in</strong> the legal protection of <strong>in</strong>ventions,while provid<strong>in</strong>g an <strong>in</strong>centive for<strong>in</strong>vestments <strong>in</strong> research and developmentand contribut<strong>in</strong>g to the competitivenessof the economy as a whole. In July 2000the <strong>Europe</strong>an Commission made a firstproposal for the creation of a Communitypatent. This was discussed at variouslevels and despite various proposals andamendments for a Council Regulation onthe Community patent dur<strong>in</strong>g 2003 and2004 no legal basis was forthcom<strong>in</strong>g. InApril 2007 the <strong>Europe</strong>an Commissionreleased a Communication entitled, ‘Enhanc<strong>in</strong>gthe patent system <strong>in</strong> <strong>Europe</strong>’ (8) .It highlighted that the <strong>Europe</strong>an patentsystem is more expensive, uncerta<strong>in</strong>and unattractive, while underl<strong>in</strong><strong>in</strong>g thatthe <strong>Europe</strong>an Commission believes amore competitive and attractive Communitypatent system can be achieved,based upon the creation of a unified andspecialised patent judiciary, <strong>with</strong> competencefor litigation on <strong>Europe</strong>an patentsand future Community patents.Def<strong>in</strong>ition and data availabilityFollow<strong>in</strong>g changes <strong>in</strong> the production ofpatent statistics at <strong>Eurostat</strong> <strong>in</strong> 2007, datashown on the <strong>Eurostat</strong> website are nolonger fully comparable <strong>with</strong> data previouslydissem<strong>in</strong>ated. From 2007 onwards,<strong>Eurostat</strong>’s production of <strong>Europe</strong>an Patent(8) COM(2007) 165 f<strong>in</strong>al; http://eur-lex.europa.eu/LexUriServ/LexUriServ.do?uri=COM:2007:0165:FIN:en:PDF.EUROPE IN FIGURES — <strong>Eurostat</strong> <strong>yearbook</strong> <strong>2009</strong>491
14 Science and technologyOffice (EPO) and United States Patentand Trademark Office (USPTO) data hasbeen based almost exclusively on the EPOWorldwide Statistical Patent Database.The worldwide statistical patent database,also known as ‘PATSTAT’, was developedby the EPO <strong>in</strong> 2005, us<strong>in</strong>g their collectionand knowledge of patent data.<strong>Europe</strong>an patent applications refer toapplications filed directly under the <strong>Europe</strong>anPatent Convention or to applicationsfiled under the Patent Co-operationTreaty (PCT) and designated to the EPO(Euro-PCT), regardless of whether thepatents are granted or not. For patentapplications to the EPO all direct applications(EPO-direct) are taken <strong>in</strong>to account,but among the PCT applications(applications follow<strong>in</strong>g the procedurelaid down by the PCT) made to the EPO,only those that have entered <strong>in</strong>to the regionalphase are counted. Patent applicationsare counted accord<strong>in</strong>g to the prioritydate, i.e. the year <strong>in</strong> which they werefiled anywhere <strong>in</strong> the world at the EPOand are broken down accord<strong>in</strong>g to theInternational Patent Classification (IPC).Applications are assigned to a countryaccord<strong>in</strong>g to the <strong>in</strong>ventor’s place of residence,us<strong>in</strong>g fractional count<strong>in</strong>g if thereare multiple <strong>in</strong>ventors to avoid doublecount<strong>in</strong>g. To normalise the data, the totalnumber of applications at the EPO can bedivided by the national population andexpressed <strong>in</strong> terms of patent applicationsper million <strong>in</strong>habitants.High-technology patents are countedfollow<strong>in</strong>g the criteria established by thetrilateral statistical report, where thesubsequent technical fields are def<strong>in</strong>edas high technology groups <strong>in</strong> accordanceto the <strong>in</strong>ternational patent classification(IPC): computer and automated bus<strong>in</strong>essequipment; micro-organism and geneticeng<strong>in</strong>eer<strong>in</strong>g; aviation; communicationtechnology; semiconductors; and lasers.The <strong>Europe</strong>an Patent Office (EPO) grants<strong>Europe</strong>an patents for the contract<strong>in</strong>gstates to the <strong>Europe</strong>an Patent Convention(EPC). There are currently 32 of these; theEU-27 Member States, Iceland, Liechtenste<strong>in</strong>,Switzerland, Monaco and Turkey.The fall<strong>in</strong>g trend between 2000 and 2005is l<strong>in</strong>ked to the length of patent<strong>in</strong>g proceduresand should not be understoodas a real decl<strong>in</strong>e <strong>in</strong> the patent<strong>in</strong>g activity.For this reason the 2005 <strong>figures</strong> <strong>in</strong> <strong>Eurostat</strong>’sreference database are flagged asprovisional.In contrast, the United States Patent andTrademark Office (USPTO) data refersto patents granted and data are recordedby year of publication as opposed to theyear of fil<strong>in</strong>g. Patents are allocated to thecountry of the <strong>in</strong>ventor, us<strong>in</strong>g fractionalcount<strong>in</strong>g <strong>in</strong> the case of multiple <strong>in</strong>ventorcountries. The methodology used isnot harmonised <strong>with</strong> that of <strong>Eurostat</strong> andtherefore the comparison between EPOand USPTO patents data should be <strong>in</strong>terpreted<strong>with</strong> caution.492 EUROPE IN FIGURES — <strong>Eurostat</strong> <strong>yearbook</strong> <strong>2009</strong>
Science and technology 14Ma<strong>in</strong> f<strong>in</strong>d<strong>in</strong>gsEU-27 patent applications to the EPO <strong>in</strong>creasedsignificantly from 1995 to 2000 toreach 51 158, <strong>with</strong> the number of applications<strong>in</strong>creas<strong>in</strong>g, on average, by 11.6 %per annum. However, the steady upwardtrend then stagnated and there was littlechange <strong>in</strong> the number of applicationsthrough to another relative peak <strong>in</strong> 2004(52 968 patent applications). The latest<strong>in</strong>formation available for 2005 showed acontraction <strong>in</strong> applications of 6.1 %, suchthat a total of 49 730 applications weremade to the EPO.Among the Member States, Germany hadby far the highest number of patent applicationsto the EPO, some 22 219 <strong>in</strong> 2005(which was 44.7 % of the EU-27 total).In relative terms, Germany was also theMember State <strong>with</strong> the highest number ofpatent applications per million <strong>in</strong>habitants(269), followed by F<strong>in</strong>land (223) andLuxembourg (189).EU-27 high-tech patent applications tothe EPO represented an <strong>in</strong>creas<strong>in</strong>g shareof total patent applications up until 2001(when they accounted for 18.5 % of allapplications). Their relative importancedecl<strong>in</strong>ed somewhat after this, as did theirabsolute number. From a high of 9 337high-tech patent applications <strong>in</strong> 2001,there was a relatively slow reductionthrough to 2004, followed by a collapse<strong>in</strong> the number of high-tech applications<strong>in</strong> 2005, fall<strong>in</strong>g from 8 484 <strong>in</strong> 2004 to3 192 a year later (-62.4 %). This patternwas observed across the majority of theMember States, <strong>in</strong> particular for the largercountries or <strong>in</strong> those countries <strong>with</strong>traditionally the highest propensity tomake patent applications. Germany andBelgium registered the highest numberof high-technology patent applicationsper million <strong>in</strong>habitants <strong>in</strong> 2005, both justover 15, while Sweden and France werethe only other Member States to record aratio <strong>in</strong> double-digits. These <strong>figures</strong> were<strong>in</strong> stark contrast to those for the majorityof the previous decade, when F<strong>in</strong>land andSweden were clearly the most specialisedcountries.Figure 14.3: Patent applications to the <strong>Europe</strong>an Patent Office (EPO), EU-27(number of applications)60 00040 00020 00001995 1996 1997 1998 1999 2000 2001 2002 2003 2004 2005 (1)Patent applications to the EPOHigh-tech patent applications to the EPO(1) Estimate.Source: <strong>Eurostat</strong> (tsc00009 and pat_ep_ntec), <strong>Europe</strong>an Patent OfficeEUROPE IN FIGURES — <strong>Eurostat</strong> <strong>yearbook</strong> <strong>2009</strong>493
14 Science and technologyTable 14.9: Patent applications to the <strong>Europe</strong>an Patent Office (EPO) andpatents granted by the USPTOPatentapplicationsto the EPO(number ofapplications)(permillion<strong>in</strong>hab.)High technologypatent applicationsto the EPO(number ofapplications)(permillion<strong>in</strong>hab.)Patents granted by the USPatent & Trademark Office(USPTO)(number ofpatents granted)(permillion<strong>in</strong>hab.)2000 2005 (1) 2005 (1) 2000 2005 (2) 2005 (2) 1997 2002 2002 (3)EU-27 51 158 49 730 101.3 9 110 3 192 6.5 28 565 20 394 42.1Euro area 41 768 41 990 : 6 974 2 728 : 22 130 16 485 :Belgium 1 288 1 302 124.6 198 159 15.2 842 451 43.8Bulgaria 7 4 0.5 1 2 0.2 6 2 0.3Czech Republic 67 71 7.0 3 9 0.8 39 44 4.3Denmark 936 842 155.6 175 39 7.1 481 293 54.6Germany 22 016 22 219 269.3 3 100 1 272 15.4 11 677 9 204 111.6Estonia 6 7 5.2 1 1 0.4 4 3 2.2Ireland 218 237 57.7 56 8 2.1 139 173 44.4Greece 54 48 4.3 10 7 0.6 27 10 0.9Spa<strong>in</strong> 790 1 135 26.4 105 44 1.0 302 304 7.4France 7 250 7 201 115.2 1 401 722 11.6 4 375 2 491 40.6Italy 3 982 4 197 71.8 369 254 4.3 1 782 1 454 25.5Cyprus 7 6 8.2 1 3 3.9 1 2 2.8Latvia 7 12 5.2 1 1 0.3 2 2 0.9Lithuania 5 2 0.6 1 1 0.2 3 1 0.3Luxembourg 79 86 189.0 5 3 6.6 34 54 121.6Hungary 121 64 6.3 26 2 0.2 71 26 2.6Malta 5 9 22.4 : 1 2.5 1 2 5.1Netherlands 3 418 2 695 165.3 1 015 133 8.2 1 451 1 156 71.8Austria 1 175 1 477 180.0 106 55 6.7 582 555 68.8Poland 43 108 2.8 4 15 0.4 31 39 1.0Portugal 42 113 10.7 4 24 2.2 15 21 2.0Romania 7 45 2.1 2 1 0.0 7 12 0.6Slovenia 51 59 29.5 3 1 0.3 11 19 9.5Slovakia 11 31 5.8 0 2 0.4 7 1 0.2F<strong>in</strong>land 1 393 1 169 223.2 601 46 8.8 891 588 113.2Sweden 2 270 1 370 152.0 532 107 11.9 1 875 797 89.5United K<strong>in</strong>gdom 5 912 5 206 86.7 1 391 287 4.8 3 910 2 690 45.4Croatia 15 24 5.4 : 1 0.1 11 20 4.5Turkey 43 211 3.0 5 2 0.0 9 18 0.3Iceland 36 21 73.0 7 3 9.2 14 7 24.4Liechtenste<strong>in</strong> 23 21 606.9 2 1 28.9 17 17 507.1Norway 395 401 87.1 49 4 1.0 298 141 31.2Switzerland 2 694 2 929 395.0 339 189 25.5 1 519 1 088 150.0Japan 21 356 20 099 157.3 5 040 2 515 19.7 35 083 32 942 258.5United States 30 513 29 538 99.6 8 043 1 530 5.2 99 614 90 870 315.2(1) Cyprus and Malta, 2004.(2) Iceland, 2004; Cyprus, Lithuania and Malta, 2003.(3) Estonia, 2001.Source: <strong>Eurostat</strong> (tsc00009, tsiir060, pat_ep_ntec, tsc00010, pat_us_ntot and tsiir070), <strong>Europe</strong>an Patent Office494 EUROPE IN FIGURES — <strong>Eurostat</strong> <strong>yearbook</strong> <strong>2009</strong>
Science and technology 1414.4 Information societyIntroductionInformation and communication technologies(ICT) are considered as criticalfor improv<strong>in</strong>g the competitiveness of<strong>Europe</strong>an <strong>in</strong>dustry and, more generally,to meet the demands of its society andeconomy. ICT affects many aspects ofeveryday lives, at both work and <strong>in</strong> thehome, and EU policies <strong>in</strong> this area rangefrom the regulation of entire <strong>in</strong>dustrialsectors to the protection of an <strong>in</strong>dividual’sprivacy.The policy framework for ICT is thei2010 <strong>in</strong>itiative (9) – ‘A <strong>Europe</strong>an InformationSociety for Growth and Employment’– which seeks to boost efficiencythroughout the <strong>Europe</strong>an economy bymeans of wider use of ICT. The <strong>in</strong>itiativeis designed to promote an open and competitivedigital economy, research <strong>in</strong>to<strong>in</strong>formation and communication technologies,as well as their application toimprove social <strong>in</strong>clusion, public servicesand quality of life. Indeed, at the heart ofthe policy is a desire to ensure that socialand geographical differences are overcome,thus creat<strong>in</strong>g a fully-<strong>in</strong>clusive digitalsociety. The i2010 <strong>in</strong>itiative has threema<strong>in</strong> priorities:• creat<strong>in</strong>g a S<strong>in</strong>gle <strong>Europe</strong>an InformationSpace, which promotes an openand competitive <strong>in</strong>ternal marketfor <strong>in</strong>formation society and mediaservices;• stimulat<strong>in</strong>g the <strong>in</strong>formation society– to strengthen <strong>in</strong>vestment <strong>in</strong> <strong>in</strong>novationand research <strong>in</strong> ICT;• exploit<strong>in</strong>g the benefits of ICT – to foster<strong>in</strong>clusion, better public servicesand quality of life through the use ofICT.Digital literacy and e-skills are crucialto <strong>in</strong>creas<strong>in</strong>g participation <strong>in</strong> the <strong>in</strong>formationsociety. The 2007 results of <strong>Eurostat</strong>’shousehold survey of <strong>in</strong>formationand communication technologies presented<strong>in</strong> this subchapter <strong>in</strong>clude f<strong>in</strong>d<strong>in</strong>gson the levels of computer skills of thepopulation. Additional data on Internetskills of the population and demand fore-skilled labour by enterprises can befound <strong>in</strong> the <strong>Eurostat</strong> database. Accord<strong>in</strong>gto a Communication from the <strong>Europe</strong>anCommission on ‘e-skills for the21st century: foster<strong>in</strong>g competitiveness,growth and jobs’ (10) , there is evidenceof skills shortages across <strong>Europe</strong>, <strong>with</strong> alack of up to half a million people <strong>with</strong>advanced network<strong>in</strong>g technology skills,while enterprises report a skills shortfallfor ICT practitioners, particularly <strong>in</strong> ICTstrategy, security and new bus<strong>in</strong>ess solutions.The i2010 benchmark<strong>in</strong>g framework(11) has addressed specific moduleson e-skills <strong>in</strong> the 2007 surveys.After undergo<strong>in</strong>g a mid-term review, anupdated i2010 strategy was presented <strong>in</strong>April 2008, address<strong>in</strong>g key challengesfor the period 2008-2010. This was followedby a <strong>Europe</strong>an Commission communicationon future networks andthe Internet (12) which outl<strong>in</strong>ed the fullbreadth of the social and economic potentialof the Internet <strong>in</strong> the future, based(9) http://ec.europa.eu/<strong>in</strong>formation_society/eeurope/i2010/<strong>in</strong>dex_en.htm.(10) COM(2007) 496 f<strong>in</strong>al, http://ec.europa.eu/enterprise/ict/policy/ict-skills/2007/COMM_PDF_COM_2007_0496_F_EN_ACTE.pdf.(11) For more <strong>in</strong>formation: http://ec.europa.eu/<strong>in</strong>formation_society/eeurope/i2010/benchmark<strong>in</strong>g/<strong>in</strong>dex_en.htm.(12) COM(2008) 594 f<strong>in</strong>al; http://ec.europa.eu/<strong>in</strong>formation_society/eeurope/i2010/docs/future_<strong>in</strong>ternet/act_future_networks_<strong>in</strong>ternet_en.pdf.EUROPE IN FIGURES — <strong>Eurostat</strong> <strong>yearbook</strong> <strong>2009</strong>495
14 Science and technologyon the premise of a high-speed Internetavailable to all, <strong>in</strong>ternationally open andcompetitive, secure and safe to use, <strong>with</strong>transparent and effective governance.These fundamental conditions of accessibility,openness, transparency andsecurity form the basis of the <strong>Europe</strong>anCommission’s short-term agenda for theInternet of the future, as summarised bysix actions:• the construction of high-speed <strong>in</strong>ternet<strong>in</strong>frastructures that are open tocompetition and give consumers realchoices.• promot<strong>in</strong>g access for all to a goodqualityInternet connection at an affordableprice.• keep<strong>in</strong>g the Internet open to competition,<strong>in</strong>novation and consumerchoice.• launch<strong>in</strong>g a debate on the design anddevelopment of the Internet of thefuture.• provid<strong>in</strong>g clear guidel<strong>in</strong>es on the implementationof exist<strong>in</strong>g rules on dataprotection and a coherent strategy fora secure Internet of the future.• tak<strong>in</strong>g <strong>in</strong>to account the crucial roleplayed by <strong>in</strong>ternational policy, regulatorydialogue and research cooperation<strong>in</strong> all these developments.Broadband technologies are consideredto be of major importance when measur<strong>in</strong>gaccess and use of the Internet asthey offer users the possibility to rapidlytransfer large volumes of data and keeptheir access l<strong>in</strong>e open; the take-up ofbroadband is considered a key <strong>in</strong>dicator<strong>with</strong><strong>in</strong> the doma<strong>in</strong> of ICT policy mak<strong>in</strong>g.Widespread access to the Internetvia broadband is seen as essential for thedevelopment of advanced services on theInternet, such as eBus<strong>in</strong>ess, eGovernmentor eLearn<strong>in</strong>g. Broadband growth hascont<strong>in</strong>ued <strong>in</strong> recent years and 42 % of allhouseholds <strong>in</strong> the EU-27 have broadband.Digital Subscriber L<strong>in</strong>es (DSL) rema<strong>in</strong>the ma<strong>in</strong> form of delivery for broadbandtechnology, although alternatives such ascable, satellite, fibre optics and wirelesslocal loops are see<strong>in</strong>g more widespreaduse.Def<strong>in</strong>ition and data availabilityStatisticians are well aware of the challengesposed by rapid technologicalchange <strong>in</strong> areas related to the Internet andother new means of ICT. As such, therehas been a considerable degree of evolution<strong>in</strong> this area, <strong>with</strong> statistical tools be<strong>in</strong>gadapted to satisfy new demands fordata. Statistics <strong>with</strong><strong>in</strong> this doma<strong>in</strong> arere-assessed on an annual basis <strong>in</strong> order tomeet user needs and reflect the rapid paceof technological change.The data presented <strong>with</strong><strong>in</strong> this sectionare from <strong>Eurostat</strong>’s surveys on <strong>in</strong>formationand communication technologies<strong>in</strong> households and by <strong>in</strong>dividuals, andsurveys on <strong>in</strong>formation and communicationtechnologies <strong>in</strong> enterprises ande-commerce. These annual surveys onICT usage <strong>in</strong> enterprises and <strong>in</strong> households/by<strong>in</strong>dividuals are carried out byNational Statistical Institutes. Resultsare used to benchmark ICT-driven developments.While the surveys <strong>in</strong>itiallyconcentrated on access and connectivityissues, their scope has subsequently beenextended to cover a variety of subjects(<strong>in</strong>clud<strong>in</strong>g, for example, e-government, e-skills) and socio-economic breakdowns,496 EUROPE IN FIGURES — <strong>Eurostat</strong> <strong>yearbook</strong> <strong>2009</strong>
Science and technology 14such as regional diversity, gender specificity,age, educational differences andthe <strong>in</strong>dividual’s employment situation<strong>in</strong> the household survey or a breakdownby size (small, medium, large) <strong>in</strong> the enterprisesurvey. The scope of the surveys<strong>with</strong> respect to different technologies isalso adapted so as to cover new productgroups and means of deliver<strong>in</strong>g communicationtechnologies to end-users (enterprisesand households).Households are def<strong>in</strong>ed as hav<strong>in</strong>g at leastone member <strong>in</strong> the age group 16-74 yearsold. Internet access of households refersto the percentage of households <strong>with</strong> anInternet access, so anyone <strong>in</strong> the householdcould use the Internet at home, ifdesired, even if just to send an e-mail. Internetusers are def<strong>in</strong>ed as all <strong>in</strong>dividualsaged 16-74 who had used the Internet <strong>in</strong>the previous three months. Regular Internetusers are <strong>in</strong>dividuals who used theInternet, on average, at least once a week<strong>in</strong> the three months prior to the survey(<strong>in</strong> general, dur<strong>in</strong>g the first quarter of2007).The most commonly used technologies toaccess the Internet are divided betweenbroadband and dial-up access. Broadband<strong>in</strong>cludes digital subscriber l<strong>in</strong>es(DSL) and uses technology that transportsdata at high speeds. Broadbandl<strong>in</strong>es are def<strong>in</strong>ed as hav<strong>in</strong>g a capacityequal to or higher than 144 kbit/s. A dialupaccess us<strong>in</strong>g a modem can be madeover a normal or an ISDN telephone l<strong>in</strong>e.Due to its limited bandwidth it is oftenreferred to as narrowband.A computer is def<strong>in</strong>ed as a personal computerthat is run us<strong>in</strong>g one of the ma<strong>in</strong>operat<strong>in</strong>g systems (Mac<strong>in</strong>tosh, L<strong>in</strong>ux orMicrosoft); handheld computers or palmtops(PDAs) are also <strong>in</strong>cluded. Individualswere asked if they have experiences <strong>in</strong>carry<strong>in</strong>g out selected activities <strong>in</strong> orderto measure their level of basic computerskills. Six computer-related items wereapplied: copied or moved a file or folder;used copy and paste tools to duplicate ormove <strong>in</strong>formation <strong>with</strong><strong>in</strong> a document;used basic arithmetic formulas to add,subtract, multiply or divide <strong>figures</strong> <strong>in</strong> aspreadsheet; compressed files; connectedand <strong>in</strong>stalled new devices, e.g. a pr<strong>in</strong>teror a modem; wrote a computer programus<strong>in</strong>g a specialised programm<strong>in</strong>g language.The level of an <strong>in</strong>dividual’s skillswas determ<strong>in</strong>ed as: low level: 1 or 2 activitiescarried out; medium level: 3 or 4activities carried out; high level: 5 or 6activities carried out.The order<strong>in</strong>g of goods and services by<strong>in</strong>dividuals <strong>in</strong>cludes confirmed reservationsfor accommodation, purchas<strong>in</strong>gf<strong>in</strong>ancial <strong>in</strong>vestments, participation <strong>in</strong>lotteries and bett<strong>in</strong>g, Internet auctions,as well as <strong>in</strong>formation services from theInternet that are directly paid for. Goodsand services that are obta<strong>in</strong>ed via theInternet for free are excluded. Ordersmade by manually written e-mails arealso excluded. The <strong>in</strong>dicator shows thepercentage of <strong>in</strong>dividuals aged 16-74 whohave used the Internet, <strong>in</strong> the 12 monthsprior to the survey, for order<strong>in</strong>g goods orservices.EUROPE IN FIGURES — <strong>Eurostat</strong> <strong>yearbook</strong> <strong>2009</strong>497
14 Science and technologyThe survey on ICT usage <strong>in</strong> enterprisescovers enterprises <strong>with</strong> 10 or more personsemployed. Its activity coverage is restrictedto those enterprises whose pr<strong>in</strong>cipalactivity is <strong>with</strong><strong>in</strong> NACE Sections D,F, G, I and K and Groups 55.1, 55.2, 92.1and 92.2, <strong>in</strong> other words manufactur<strong>in</strong>g,construction, distributive trades, hotelsand accommodation, transport and communication,real estate, rent<strong>in</strong>g and bus<strong>in</strong>essactivities, motion picture, video, radioand television activities.Internet access among enterprises ismeasured <strong>in</strong> terms of the proportion ofthe total number of persons employedhav<strong>in</strong>g access to the Internet or access viaa broadband connection; this <strong>in</strong>dicatoris considered as a proxy for productivity<strong>with</strong><strong>in</strong> enterprises. The availability ofbroadband is measured by the percentageof enterprises that are connectable to anexchange that has been converted to supportxDSL-technology, to a cable networkupgraded for Internet traffic, or to otherbroadband technologies.The <strong>in</strong>dicator measur<strong>in</strong>g enterprise turnoverfrom e-commerce is shown as a percentageof total turnover. The <strong>in</strong>dicator iscalculated as the enterprises’ receipts fromsales through the Internet as percentageof the total turnover. Sales throughother networks are not <strong>in</strong>cluded, leav<strong>in</strong>gout for <strong>in</strong>stance EDI-based sales. Theyear given relates to the survey year. Thee-commerce data relates to the year priorto the survey. E-commerce is def<strong>in</strong>ed asorder<strong>in</strong>g or sell<strong>in</strong>g goods and servicesover computer mediated networks. Onl<strong>in</strong>epurchases or orders received excludethose relat<strong>in</strong>g to manually typed e-mailpurchases or orders received. The <strong>in</strong>dicatoron enterprises hav<strong>in</strong>g received ordersor made purchases onl<strong>in</strong>e covers onl<strong>in</strong>esell<strong>in</strong>g via Internet and EDI or othernetworks <strong>with</strong><strong>in</strong> the previous year. Onlyenterprises buy<strong>in</strong>g/sell<strong>in</strong>g more than 1 %onl<strong>in</strong>e are <strong>in</strong>cluded.Indicators relat<strong>in</strong>g to onl<strong>in</strong>e access topublic services show the percentage of20 selected basic services which are fullyavailable onl<strong>in</strong>e, <strong>in</strong> other words, forwhich it is possible to carry out full electroniccase handl<strong>in</strong>g. For example, if <strong>in</strong> acountry 13 of the 20 services were measuredas be<strong>in</strong>g 100 % available onl<strong>in</strong>e andone service was not relevant (e.g. doesnot exist), the <strong>in</strong>dicator is 13/19 which is68.4 %. Measurement is based on a sampleof URLs of public websites agreed<strong>with</strong> Member States as relevant for eachservice.The <strong>in</strong>dicators concern<strong>in</strong>g the use ofe-government services are based on usagedur<strong>in</strong>g the three months prior to the surveyfor <strong>in</strong>dividuals and the year prior tothe survey for enterprises. E-governmentservices concern <strong>in</strong>teraction <strong>with</strong> publicauthorities <strong>in</strong> one or more of the follow<strong>in</strong>gactivities: obta<strong>in</strong><strong>in</strong>g <strong>in</strong>formation frompublic authority websites, download<strong>in</strong>g officialforms, submitt<strong>in</strong>g completed formsand e-procurement (for the enterprisesurvey).Data on <strong>in</strong>formation technology (IT)expenditure covers expenditure for IThardware, equipment, software and otherservices.498 EUROPE IN FIGURES — <strong>Eurostat</strong> <strong>yearbook</strong> <strong>2009</strong>
Science and technology 14Ma<strong>in</strong> f<strong>in</strong>d<strong>in</strong>gsDur<strong>in</strong>g the last decade, <strong>in</strong>formation andcommunication technologies (ICTs) havebecome widely available to the generalpublic, <strong>in</strong> terms of accessibility as wellas cost. The <strong>in</strong>creas<strong>in</strong>g use of these technologiesis such that <strong>in</strong> 2007 for the firsttime, a majority (54 %) of households <strong>in</strong>the EU-27 had an Internet access. Amongthe Member States, a high proportion(83 %) of households <strong>in</strong> the Netherlandshad an Internet access <strong>in</strong> 2007, while Sweden,Denmark and Luxembourg reportedshares of at least 75 %.Widespread and affordable broadbandaccess would appear to be one meansof promot<strong>in</strong>g the knowledge-based and<strong>in</strong>formed society. The vast majority ofhouseholds <strong>in</strong> the EU-27 accessed theInternet us<strong>in</strong>g a broadband connection,some 42 % compared <strong>with</strong> 14 % of householdsthat had a dial-up or ISDN Internetaccess. Romania and Greece werethe only Member States where a higherproportion of households used a dial-upor ISDN connection to access the Internet.Some 81% of <strong>in</strong>dividuals liv<strong>in</strong>g <strong>in</strong> ahousehold <strong>in</strong> the EU-27 <strong>with</strong> broadbandconnection accessed the Internet regularly(at least once a week), compared <strong>with</strong>63 % of <strong>in</strong>dividuals liv<strong>in</strong>g <strong>in</strong> households<strong>with</strong> Internet access but no broadband.Just over four fifths (81 %) of all Internetusers aged 16 to 74 <strong>in</strong> the EU-27 declaredthey accessed Internet at home <strong>in</strong> 2007;while 43 % of Internet users accessed theInternet from their place of work.Results on the supply of e-skills from2007 show that three quarters or morethan three quarters of the population <strong>in</strong>Denmark, Luxembourg, the Netherlands,Sweden and Germany had basic computerskills. The lowest proportions were registered<strong>in</strong> Bulgaria (32 %) and Romania(29 %). The Member States which had thehighest proportions of <strong>in</strong>dividuals <strong>with</strong> ahigh level of computer skills were Denmarkand Luxembourg.The proportion of <strong>in</strong>dividuals aged 16-74 <strong>in</strong> the EU-27 who used the Internet atleast once <strong>in</strong> the last 12 months to buy ororder goods or services for private use was30 % <strong>in</strong> 2007. Between 2006 and 2007, allEU Member States registered an <strong>in</strong>crease<strong>in</strong> e-shopp<strong>in</strong>g. In 2007, more than half ofall <strong>in</strong>dividuals <strong>in</strong> Denmark, Germany,the Netherlands, Sweden and the UnitedK<strong>in</strong>gdom had bought or ordered goodsor services over the Internet <strong>in</strong> the last 12months. On the other hand, less than 5 %of <strong>in</strong>dividuals had shopped over the Internet<strong>in</strong> Bulgaria and Romania.The provision of fully-onl<strong>in</strong>e e-governmentservices <strong>in</strong> EU-27 reached a levelof 59 % <strong>in</strong> 2007. Consider<strong>in</strong>g the availableresults from previous years, therehas been a considerable <strong>in</strong>crease dur<strong>in</strong>gthe last years. The EU-25 average grew by11 percentage po<strong>in</strong>ts from 2006 to 2007.Austria is the only Member State <strong>with</strong> anonl<strong>in</strong>e availability of 100 %, i.e. all consideredgovernment services can be completelymanaged via the Internet. Malta,Portugal, Slovenia and the United K<strong>in</strong>gdomexceed a level of 75 % of the consideredgovernment services, whereas Polandand Bulgaria achieve a maximum of25 % of government services fully availableonl<strong>in</strong>e. It seems that political prioritisationof e-government services together<strong>with</strong> a moderate size and a more centrallyorganised adm<strong>in</strong>istration enable a morerapid progress <strong>in</strong> e-government onl<strong>in</strong>eavailability.Almost one third (30 %) of <strong>in</strong>dividualsmade use of e-government <strong>in</strong>itiatives toaccess a range of public services onl<strong>in</strong>e <strong>in</strong>2007, ma<strong>in</strong>ly for obta<strong>in</strong><strong>in</strong>g <strong>in</strong>formation,EUROPE IN FIGURES — <strong>Eurostat</strong> <strong>yearbook</strong> <strong>2009</strong>499
14 Science and technologybut <strong>in</strong>creas<strong>in</strong>gly for download<strong>in</strong>g andfill<strong>in</strong>g <strong>in</strong> forms (such as tax returns). TheNordic Member States, the Netherlandsand Luxembourg stood out, as a majorityof <strong>in</strong>dividuals <strong>in</strong> each of these countriesmade use of such e-government services.Almost all (97 %) of the workforce amongenterprises <strong>with</strong> ten or more full-timepersons employed <strong>in</strong> the EU-27 had an Internetconnection <strong>in</strong> 2007 and more than90 % of these accessed the Internet us<strong>in</strong>ga broadband connection. An average of17 % of enterprises <strong>with</strong> ten or more fulltimepersons employed had <strong>in</strong> 2006 thefacility to allow remote persons to connectto their IT systems from home; thisfigure grew considerably as a function ofthe average size of an enterprise, ris<strong>in</strong>gto a 55 % share among those enterprisesemploy<strong>in</strong>g 250 or more persons. Enterprises<strong>in</strong> the Nordic Member States, theNetherlands and the United K<strong>in</strong>gdomreported the highest propensity to makeuse of remote access to their IT systems,irrespective of the size of enterprise.Around two thirds (65 %) of enterprisesmade use of e-government services: a majorityus<strong>in</strong>g e-government services to obta<strong>in</strong><strong>in</strong>formation and to download forms(57 % and 58 % respectively), while 45 %of enterprises returned filled <strong>in</strong> formsus<strong>in</strong>g e-government services. The takeupof e-government services among enterprises<strong>in</strong> 2007 reflected the relativelyhigh levels of take-up among households<strong>in</strong> countries like Denmark, Luxembourg,the Netherlands or F<strong>in</strong>land. Several othercountries – <strong>in</strong>clud<strong>in</strong>g Ireland, Greece,Italy, Austria, Slovenia and Slovakia –also recorded relatively high take-up ofe-government services by enterprises, <strong>in</strong>contrast to household take-up. Bulgaria,Latvia and Romania were the only countriesto report a m<strong>in</strong>ority of enterprisesmak<strong>in</strong>g use of e-government services.Some 15 % of enterprises <strong>in</strong> the EU-27 receivedorders onl<strong>in</strong>e dur<strong>in</strong>g 2007, whichwas roughly half the proportion of enterprises(29 %) that used the Internet toplace orders to purchase goods or services.The general pattern across MemberStates is one where a considerably higherproportion of enterprises have made purchasesonl<strong>in</strong>e when compared <strong>with</strong> thosethat have received orders onl<strong>in</strong>e (probablyreflect<strong>in</strong>g the greater complexity ofsett<strong>in</strong>g up an onl<strong>in</strong>e sell<strong>in</strong>g system compared<strong>with</strong> mak<strong>in</strong>g purchases). One thirdof all enterprises <strong>in</strong> Denmark received ordersonl<strong>in</strong>e <strong>in</strong> 2007, while correspond<strong>in</strong>gshares were equal to or above one quarter<strong>in</strong> the United K<strong>in</strong>gdom, Ireland, Swedenand the Netherlands. In contrast, a majorityof enterprises <strong>in</strong> Ireland and Germany(55 % and 52 % respectively) madepurchases onl<strong>in</strong>e <strong>in</strong> 2007, while upwardsof 40 % of all enterprises <strong>in</strong> the UnitedK<strong>in</strong>gdom, Sweden, Belgium and Austriamade purchases onl<strong>in</strong>e.The proportion of total turnover accountedfor by e-commerce via the Internetequated to 4.2 % <strong>in</strong> the EU-27 <strong>in</strong>2007, <strong>with</strong> only a handful of countries– Ireland, the United K<strong>in</strong>gdom, Spa<strong>in</strong>and Lithuania – report<strong>in</strong>g that e-commercerepresented more than 5 % of totalturnover.Compared <strong>with</strong> its ma<strong>in</strong> competitors, theEU has a relatively low share of ICT expenditurewhen expressed as a share ofGDP. Indeed, expenditure on <strong>in</strong>formationtechnology represented 2.7% of GDP<strong>in</strong> the EU-27 <strong>in</strong> 2006, compared <strong>with</strong>3.4 % <strong>in</strong> Japan and 3.3 % <strong>in</strong> the UnitedStates.500 EUROPE IN FIGURES — <strong>Eurostat</strong> <strong>yearbook</strong> <strong>2009</strong>
Science and technology 14Figure 14.4: Internet access of households(% of all households)1007550250EU-27Euro area (1)NetherlandsSwedenDenmarkLuxembourgGermanyF<strong>in</strong>landUnited K<strong>in</strong>gdomBelgiumAustriaSloveniaIrelandMaltaEstoniaLatviaFranceSlovakiaSpa<strong>in</strong>LithuaniaItalyPolandPortugalCyprusHungaryCzech RepublicGreeceRomaniaBulgariaIcelandNorwayFYR of Macedonia (2)(1) EA-12 <strong>in</strong> 2006; EA-13 <strong>in</strong> 2007.(2) Not available for 2007.Source: <strong>Eurostat</strong> (tsiir040)2006 2007Figure 14.5: Internet access of households by type of connection, 2007(% of all households)1007550250EU-27Euro area (1)NetherlandsDenmarkSwedenF<strong>in</strong>landLuxembourgUnited K<strong>in</strong>gdomBelgiumGermanyEstoniaAustriaSloveniaMaltaFranceSpa<strong>in</strong>LithuaniaHungaryLatviaIrelandPortugalPolandCzech RepublicSlovakiaItalyCyprusBulgariaRomaniaGreeceIcelandNorwayFYR of Macedonia (2)(1) EA-13 <strong>in</strong>stead of EA-15.(2) 2006.Source: <strong>Eurostat</strong> (t<strong>in</strong>00073)BroadbandDial-up access or ISDNEUROPE IN FIGURES — <strong>Eurostat</strong> <strong>yearbook</strong> <strong>2009</strong>501
14 Science and technologyTable 14.10: Place of Internet use by <strong>in</strong>dividuals, 2007(% of <strong>in</strong>dividuals aged 16 to 74 who used the Internet <strong>in</strong> the last three months)Place of work(other thanhome)Neighbour,friend orrelative's housePlace ofOtherHomeeducationplaceEU-27 81 43 13 21 12Euro area (1) 81 43 11 23 12Belgium 89 34 10 8 5Bulgaria 71 38 12 6 16Czech Republic 76 42 19 15 6Denmark 95 52 13 17 8Germany 89 42 10 18 10Estonia 83 43 18 15 7Ireland 77 39 11 5 9Greece 62 44 11 12 17Spa<strong>in</strong> 74 45 13 25 21France 72 40 8 36 11Italy 78 48 13 22 16Cyprus 72 54 11 15 9Latvia 77 40 19 15 12Lithuania 80 40 24 23 13Luxembourg 92 44 11 11 3Hungary 74 40 21 23 11Malta 92 40 9 9 3Netherlands 97 50 13 16 5Austria 82 48 10 8 5Poland 74 33 23 23 13Portugal 68 43 21 32 20Romania 67 34 21 12 9Slovenia 85 53 18 25 16Slovakia 60 51 21 20 15F<strong>in</strong>land 89 49 21 35 20Sweden 91 52 14 22 12United K<strong>in</strong>gdom 87 45 13 19 11FYR of Macedonia (2) 32 17 19 9 54Iceland 93 63 30 48 30Norway 92 56 15 18 13(1) EA-13 <strong>in</strong>stead of EA-15.(2) 2006.Source: <strong>Eurostat</strong> (isoc_pibi_pai)502 EUROPE IN FIGURES — <strong>Eurostat</strong> <strong>yearbook</strong> <strong>2009</strong>
Science and technology 14Figure 14.6: Individuals regularly us<strong>in</strong>g the Internet by type of connection, 2007(% of all <strong>in</strong>dividuals aged 16 to 74)1007550250EU-27Euro area (1)HungaryGreeceNetherlandsF<strong>in</strong>landDenmarkLuxembourgSlovakiaBelgiumSwedenCzech RepublicEstoniaFranceUnited K<strong>in</strong>gdomGermanyRomaniaIrelandLatviaLithuaniaAustriaBulgariaSloveniaPolandSpa<strong>in</strong>CyprusMaltaPortugalItalyIcelandNorwayLiv<strong>in</strong>g <strong>in</strong> a household <strong>with</strong> a broadband connectionLiv<strong>in</strong>g <strong>in</strong> a household <strong>with</strong> Internet access but <strong>with</strong> no broadband connection(1) EA-13 <strong>in</strong>stead of EA-15.Source: <strong>Eurostat</strong> (t<strong>in</strong>00061)Figure 14.7: Individuals’ level of computer skills, 2007(% of all <strong>in</strong>dividuals aged 16 to 74)1007550250EU-27Euro area (1)DenmarkNetherlandsLuxembourgSwedenGermanyF<strong>in</strong>landAustriaUnited K<strong>in</strong>gdomFranceSlovakiaBelgiumSloveniaHungarySpa<strong>in</strong>EstoniaCzech RepublicHighMediumLowIrelandLatviaLithuaniaPolandCyprusPortugalMaltaItalyGreeceBulgariaRomaniaIcelandNorwayFYR of Macedonia (2)(1) EA-13 <strong>in</strong>stead of EA-15.(2) 2006.Source: <strong>Eurostat</strong> (tsdsc460)EUROPE IN FIGURES — <strong>Eurostat</strong> <strong>yearbook</strong> <strong>2009</strong>503
14 Science and technologyFigure 14.8: Individuals who ordered goods or services over the Internet for private use <strong>in</strong> thelast twelve months(% of all <strong>in</strong>dividuals aged 16 to 74)706050403020100EU-27Euro area (1)DenmarkNetherlandsSwedenUnited K<strong>in</strong>gdomGermanyF<strong>in</strong>landLuxembourgAustriaFranceIrelandBelgiumMaltaSpa<strong>in</strong>Czech RepublicPolandSloveniaSlovakiaLatviaHungaryItalyCyprusEstoniaPortugalGreeceLithuaniaBulgariaRomaniaNorwayIcelandFYR of Macedonia (2)(1) EA-12 <strong>in</strong> 2006; EA-13 <strong>in</strong> 2007.(2) Not available for 2007.Source: <strong>Eurostat</strong> (isoc_ec_ibuy)2006 2007Figure 14.9: E-government on-l<strong>in</strong>e availability, 2007(% of onl<strong>in</strong>e availability of 20 basic public services)1007550250EU-27AustriaMaltaPortugalSloveniaUnited K<strong>in</strong>gdomSwedenGermanyEstoniaSpa<strong>in</strong>FranceItalyF<strong>in</strong>landDenmarkNetherlandsBelgiumCzech RepublicIrelandHungaryGreeceCyprusLuxembourgLithuaniaRomaniaSlovakiaLatviaPolandBulgariaNorwayTurkeyIcelandSwitzerlandSource: <strong>Eurostat</strong> (tsiir120), Directorate-General Information Society and Media504 EUROPE IN FIGURES — <strong>Eurostat</strong> <strong>yearbook</strong> <strong>2009</strong>
Science and technology 14Table 14.11: Individuals us<strong>in</strong>g the Internet for <strong>in</strong>teract<strong>in</strong>g <strong>with</strong> public authorities, 2007(% of all <strong>in</strong>dividuals aged 16 to 74)E-government usageby <strong>in</strong>dividualsIndividuals us<strong>in</strong>g the Internet for<strong>in</strong>teract<strong>in</strong>g <strong>with</strong> public authoritiesTotal Male FemaleObta<strong>in</strong><strong>in</strong>g<strong>in</strong>formationDownload<strong>in</strong>gofficial formsReturn<strong>in</strong>gfilled <strong>in</strong> formsEU-27 30 33 28 27 18 13Euro area (1) 33 36 30 30 19 13Belgium 23 26 20 21 11 8Bulgaria 6 6 7 4 4 3Czech Republic 16 17 15 14 8 4Denmark 58 62 55 58 37 33Germany 43 47 39 39 26 17Estonia 30 29 32 27 21 20Ireland 32 34 31 26 22 19Greece 12 14 9 10 4 5Spa<strong>in</strong> 26 29 24 25 14 8France 41 42 40 37 24 18Italy 17 19 14 15 11 5Cyprus 20 21 19 18 13 10Latvia 18 16 20 17 7 6Lithuania 18 17 19 18 12 11Luxembourg 52 62 41 44 38 21Hungary 25 25 25 22 19 14Malta 25 28 21 22 17 9Netherlands 55 61 49 49 30 33Austria 27 32 23 24 19 13Poland 15 15 15 12 9 4Portugal 19 22 17 17 13 13Romania 5 6 5 4 3 2Slovenia 30 29 31 28 15 6Slovakia 24 23 24 20 15 8F<strong>in</strong>land 50 51 50 43 31 17Sweden 53 55 50 47 29 24United K<strong>in</strong>gdom 38 42 34 33 22 18FYR of Macedonia (2) 15 19 11 12 5 2Turkey (3) 6 8 4 5 2 1Iceland 59 63 54 54 33 19Norway 60 65 55 55 33 26(1) EA-13 <strong>in</strong>stead of EA-15.(2) 2006.(3) 2005.Source: <strong>Eurostat</strong> (tsiir130 and t<strong>in</strong>00064)EUROPE IN FIGURES — <strong>Eurostat</strong> <strong>yearbook</strong> <strong>2009</strong>505
14 Science and technologyTable 14.12: Proportion of enterprises that have remote employed persons who connect to ITsystems from home, 2006 (1)(% of enterprises)Total (10+persons employed)Small (10-49persons employed)Medium (50-249persons employed)Large (250+persons employed)EU-27 17 13 30 55Euro area (2) 15 11 30 57Belgium 27 21 50 71Bulgaria 9 9 10 17Czech Republic 19 15 31 48Denmark 53 46 81 95Germany 21 15 39 65Estonia 22 18 34 53Ireland 25 20 38 59Greece 16 14 25 52Spa<strong>in</strong> 8 5 17 40France : : : :Italy 3 2 7 23Cyprus 14 10 28 62Latvia 7 5 12 27Lithuania 12 11 13 30Luxembourg 19 16 25 66Hungary 10 8 16 36Malta : : : :Netherlands 35 29 56 85Austria 20 16 37 64Poland 4 3 8 15Portugal 9 7 21 49Romania 7 6 9 20Slovenia 26 23 32 65Slovakia 13 12 17 34F<strong>in</strong>land 32 24 56 77Sweden 39 34 59 84United K<strong>in</strong>gdom 32 26 49 79Iceland 47 42 67 66Norway 49 44 78 94(1) Enterprises <strong>with</strong> 10 or more full-time persons employed; enterprises that have their ma<strong>in</strong> activity <strong>in</strong> NACE Sections D, F, G, I and K orNACE Groups 55.1, 55.2, 92.1 and 92.2.(2) EA-12 <strong>in</strong>stead of EA-15.Source: <strong>Eurostat</strong> (t<strong>in</strong>00082 and isoc_ci_tw_e)506 EUROPE IN FIGURES — <strong>Eurostat</strong> <strong>yearbook</strong> <strong>2009</strong>
Science and technology 14Table 14.13: Enterprises us<strong>in</strong>g the Internet for <strong>in</strong>teract<strong>in</strong>g <strong>with</strong> public authorities, 2007 (1)(% of enterprises)E-governmentusage by enterprisesObta<strong>in</strong><strong>in</strong>g<strong>in</strong>formationDownload<strong>in</strong>gofficial formsReturn<strong>in</strong>gfilled <strong>in</strong> formsEU-27 65 57 58 45Euro area (2) 68 58 60 47Belgium 51 44 35 37Bulgaria 45 40 36 29Czech Republic 73 70 65 34Denmark 88 83 83 61Germany 56 44 49 43Estonia 76 74 71 58Ireland 89 79 82 69Greece 82 71 70 77Spa<strong>in</strong> 58 53 53 38France 69 61 64 59Italy 84 74 70 35Cyprus 54 53 43 14Latvia 45 42 41 26Lithuania 76 71 75 60Luxembourg 85 76 81 35Hungary 55 51 52 44Malta 77 74 68 49Netherlands 81 67 69 73Austria 81 60 75 54Poland 64 53 56 56Portugal 72 66 65 66Romania 42 39 36 20Slovenia 83 78 76 61Slovakia 85 78 80 56F<strong>in</strong>land 94 88 91 78Sweden 79 77 76 55United K<strong>in</strong>gdom 54 52 49 40Croatia 51 45 48 33Iceland (3) 95 85 79 81Norway 71 65 66 61(1) Enterprises <strong>with</strong> 10 or more full-time persons employed; enterprises that have their ma<strong>in</strong> activity <strong>in</strong> NACE Sections D, F, G, I and K orNACE Groups 55.1, 55.2, 92.1 and 92.2. The year given relates to the survey year. The e-government data relates to the year prior to thesurvey.(2) EA-13 <strong>in</strong>stead of EA-15.(3) 2006.Source: <strong>Eurostat</strong> (tsiir140 and t<strong>in</strong>00065)EUROPE IN FIGURES — <strong>Eurostat</strong> <strong>yearbook</strong> <strong>2009</strong>507
14 Science and technologyFigure 14.10: Internet access and broadband connections among enterprises, 2007 (1)(% of persons employed)1007550250EU-27Euro area (2)Spa<strong>in</strong>FranceMaltaF<strong>in</strong>landSwedenBelgiumNetherlandsUnited K<strong>in</strong>gdomSloveniaGermanyLuxembourgDenmarkPortugalCzech RepublicItalyHungaryEstoniaAustriaCyprusSlovakiaGreeceBulgariaPolandLithuaniaLatviaRomaniaIrelandIceland (3)NorwayCroatiaWith access to the InternetWith access to the Internet via a fixed broadband connection(1) Enterprises <strong>with</strong> 10 or more full-time persons employed; enterprises that have their ma<strong>in</strong> activity <strong>in</strong> NACE Sections D, F, G, I and K orNACE Groups 55.1, 55.2, 92.1 and 92.2.(2) EA-13 <strong>in</strong>stead of EA-15.(3) 2006.Source: <strong>Eurostat</strong> (isoc_ci_<strong>in</strong>_p and isoc_ci_it_p)Figure 14.11: Proportion of enterprises’ total turnover from e-commerce via Internet, 2007 (1)(%)1086420EU-27Euro area (2)IrelandUnited K<strong>in</strong>gdomSpa<strong>in</strong>LithuaniaCzech RepublicBelgiumGermanyPolandPortugal (3)HungaryAustria (3)RomaniaSlovakiaEstonia (4)GreeceItalyCyprusBulgariaNorwayIceland (3)Croatia(1) Enterprises <strong>with</strong> 10 or more full-time persons employed; enterprises that have their ma<strong>in</strong> activity <strong>in</strong> NACE Sections D, G, I and Kor NACE Groups 55.1 and 55.2; Denmark, France, Latvia, Luxembourg, Malta, the Netherlands, Slovenia, F<strong>in</strong>land and Sweden, notavailable.(2) EA-13 <strong>in</strong>stead of EA-15.(3) 2006.(4) 2005.Source: <strong>Eurostat</strong> (tsiir100)508 EUROPE IN FIGURES — <strong>Eurostat</strong> <strong>yearbook</strong> <strong>2009</strong>
Science and technology 14Figure 14.12: Enterprises hav<strong>in</strong>g received orders/made purchases on-l<strong>in</strong>e, 2007 (1)(% of enterprises)706050403020100EU-27Euro area (2)IrelandGermanyUnited K<strong>in</strong>gdomSwedenBelgiumAustriaDenmarkNetherlandsLuxembourgMaltaCzech RepublicSloveniaF<strong>in</strong>landLithuaniaSpa<strong>in</strong>EstoniaPolandCyprusPortugalItalyGreeceRomaniaSlovakiaHungaryLatviaBulgariaNorwayIceland (3)Japan (4)CroatiaReceived orders on-l<strong>in</strong>ePurchased on-l<strong>in</strong>e(1) Enterprises <strong>with</strong> 10 or more full-time persons employed; enterprises that have their ma<strong>in</strong> activity <strong>in</strong> NACE Sections D, F, G, I and K orNACE Groups 55.1, 55.2, 92.1 and 92.2; France, not available.(2) EA-13 <strong>in</strong>stead of EA-15.(3) 2006.(4) 2005.Source: <strong>Eurostat</strong> (t<strong>in</strong>00068 and isoc_ec_ebuy)Figure 14.13: Information technology expenditure, 2006 (1)(% of GDP)43210EU-27SwedenUnited K<strong>in</strong>gdomNetherlandsCzech RepublicDenmarkF<strong>in</strong>landFranceGermanyEstoniaBelgiumAustriaPolandHungarySlovakiaLatviaSloveniaRomaniaBulgariaLithuaniaPortugalItalyIrelandSpa<strong>in</strong>GreeceSwitzerlandJapanUnited StatesNorway(1) Cyprus, Luxembourg and Malta, not available.Source: <strong>Eurostat</strong> (tsiir090), <strong>Europe</strong>an Information Technology Observatory (EITO)EUROPE IN FIGURES — <strong>Eurostat</strong> <strong>yearbook</strong> <strong>2009</strong>509
14 Science and technology14.5 TelecommunicationsIntroductionTelecommunication networks and servicesare the backbone of <strong>Europe</strong>’s develop<strong>in</strong>g<strong>in</strong>formation society. Individuals,enterprises and public organisations alikehave come to rely ever more on convenient,reliable networks and services for avariety of services.The <strong>Europe</strong>an telecommunications sectorwas historically characterised by publicservice, monopoly providers, often run<strong>in</strong> conjunction <strong>with</strong> postal services. Liberalisationmoves began <strong>in</strong> the first halfof the 1980s and, at first, concerned valueadded services or bus<strong>in</strong>ess users, whilebasic services were left <strong>in</strong> the hands ofmonopoly providers. By 1998, telecommunicationswere, <strong>in</strong> pr<strong>in</strong>ciple, fully liberalisedacross all of the Member States.The liberalisation of telecommunicationmarkets has led to considerable reductions<strong>in</strong> prices. This may, <strong>in</strong> part, reflectthe <strong>in</strong>troduction of competition <strong>in</strong>to anumber of markets that were previouslythe doma<strong>in</strong> of <strong>in</strong>cumbent, monopolysuppliers, as well as reflect<strong>in</strong>g technologicalchanges that have <strong>in</strong>creased capacityand made it possible to communicate notonly by voice, but also over the Internet.Market regulation has nonetheless cont<strong>in</strong>ued,and the <strong>Europe</strong>an Commissionoversees this to ensure that consumersbenefit. Regulation cont<strong>in</strong>ues to monitorthe significant market power of formermonopolies, ensure universal serviceand protect consumers, especially thosesocial groups that may otherwise faceexclusion, through oversee<strong>in</strong>g the correctimplementation and enforcement ofDirectives.On 30 June 2007, a new set of rules onroam<strong>in</strong>g entered <strong>in</strong>to force. These foreseethat people travell<strong>in</strong>g <strong>with</strong><strong>in</strong> the EUare able to phone across borders at moreaffordable and transparent prices. TheRoam<strong>in</strong>g Regulation (13) put <strong>in</strong> place a setof maximum prices for phone calls madeand received while abroad (Eurotariff);these maximum prices apply to all consumersunless they opt for special packagesoffered by operators. The <strong>Europe</strong>anCommission and national regulators haveclosely monitored price developments fortext messages and data services. On thebasis of this monitor<strong>in</strong>g, a review wasconducted which came to the conclusionthat competition has not encouraged mobileoperators to voluntarily reduce veryhigh roam<strong>in</strong>g charges for text messages.The <strong>Europe</strong>an Commission thereforeproposed on 23 September 2008:• to br<strong>in</strong>g down prices for text messagessent while travell<strong>in</strong>g <strong>in</strong> anotherEU country;• to ensure that consumers are kept <strong>in</strong>formedof the charges that apply fordata roam<strong>in</strong>g services;• to <strong>in</strong>troduce a Euro-SMS Tariff from1 July <strong>2009</strong> so that send<strong>in</strong>g an SMSfrom abroad would cost no more than11 cents (exclud<strong>in</strong>g VAT), while receiv<strong>in</strong>gan SMS <strong>in</strong> another EU countrywould rema<strong>in</strong> free of charge;(13) Regulation (EC)No 717/2007 of the <strong>Europe</strong>an Parliament and of the Council of 27 June 2007 on roam<strong>in</strong>g on publicmobile telephone networks <strong>with</strong><strong>in</strong> the Community and amend<strong>in</strong>g Directive 2002/21/EC; http://eur-lex.europa.eu/LexUriServ/LexUriServ.do?uri=OJ:L:2007:171:0032:0040:EN:PDF.510 EUROPE IN FIGURES — <strong>Eurostat</strong> <strong>yearbook</strong> <strong>2009</strong>
Science and technology 14• to improve transparency so that customerstravell<strong>in</strong>g to another MemberState should receive an automatedmessage of the charges that apply fordata roam<strong>in</strong>g services upon arrival;while from 1 July 2010, operatorsshould provide customers <strong>with</strong> theopportunity to determ<strong>in</strong>e <strong>in</strong> advancehow much they want to spend beforea data roam<strong>in</strong>g service is ‘cut-off’;• to restrict to EUR 1 per megabytewholesale data roam<strong>in</strong>g fees, so theseare more predictable for operators;• to reduce further the cost of Eurotariffvoice calls, <strong>with</strong> the price for mak<strong>in</strong>gcalls decreas<strong>in</strong>g from 43 cents on1 July <strong>2009</strong>, to 40 cents, 37 cents and34 cents <strong>in</strong> each of the subsequentyears, while the price of receiv<strong>in</strong>g acall would decrease from 19 cents on1 July <strong>2009</strong> to 16 cents, 13 cents and10 cents.Def<strong>in</strong>ition and data availability<strong>Eurostat</strong>’s data collection <strong>in</strong> relation totelecommunications statistics is conductedthrough the use of a predef<strong>in</strong>edquestionnaire (TELECOM), which is senton annual basis to the national statistical<strong>in</strong>stitutes. They collect <strong>in</strong>formation fromtheir relevant regulatory authorities andsend the completed questionnaires backto <strong>Eurostat</strong>.Ma<strong>in</strong> telephone l<strong>in</strong>es are the traditionalway of connect<strong>in</strong>g to communicationnetworks. They are usually used for voicetelephony, but may also be used for access<strong>in</strong>gthe Internet via a modem or dialupconnection. The rapid growth of morepowerful means to access the Internet(broadband) and mobile communicationshas eroded somewhat the marketfor traditional fixed telecommunicationnetworks.Indicators presented <strong>in</strong> relation to marketshare refer to fixed-l<strong>in</strong>e telecommunicationsand mobile telephony. The marketshare of the <strong>in</strong>cumbent for fixed-l<strong>in</strong>etelephony is def<strong>in</strong>ed as the enterpriseactive <strong>in</strong> the market just before liberalisationand is calculated on the basisof retail revenues. Indicators relat<strong>in</strong>g tothe mobile market refer to the numberof subscriptions to public cellular mobiletelecommunication systems and also <strong>in</strong>cludeactive pre-paid cards. Note that an<strong>in</strong>creas<strong>in</strong>g number of people have multiplemobile subscriptions (for example, forprivate and work use, or for use <strong>in</strong> differentcountries).Data on expenditure for telecommunicationscovers hardware,equipment, software and other services.The data are not collected by <strong>Eurostat</strong>;further methodological <strong>in</strong>formation isavailable at: http://www.eito.com/.Telecommunications prices are basedon the price (<strong>in</strong>clud<strong>in</strong>g VAT) <strong>in</strong> euro ofa 10-m<strong>in</strong>ute call at 11 am on a weekday<strong>in</strong> August, based on normal rates. Threemarkets are presented, namely a localcall (3 km), a national long distance call(200 km) and an <strong>in</strong>ternational call (to theUnited States). The data are not collectedby <strong>Eurostat</strong>; further methodological <strong>in</strong>formationis available at: http://www.teligen.com/.EUROPE IN FIGURES — <strong>Eurostat</strong> <strong>yearbook</strong> <strong>2009</strong>511
14 Science and technologyMa<strong>in</strong> f<strong>in</strong>d<strong>in</strong>gsTelecommunications expenditure accountedfor 3.0 % of GDP <strong>in</strong> the EU-27 <strong>in</strong>2006, compared <strong>with</strong> 2.1 % <strong>in</strong> the UnitedStates and 4.2 % <strong>in</strong> Japan. The highestrelative levels of expenditure were generallyrecorded <strong>in</strong> those Member Statethat jo<strong>in</strong>ed the EU s<strong>in</strong>ce 2004 (Cyprusand Malta, not available), <strong>in</strong> particular <strong>in</strong>the Baltic Member States, Bulgaria andRomania.Although overall expenditure on telephonyhas <strong>in</strong>creased, the proportion accountedfor by ex-monopoly providers hasgenerally been reduced, as the share ofthe total telecommunication market accountedfor by fixed-l<strong>in</strong>e voice operationshas shrunk, whereas growth has beenconcentrated <strong>in</strong> mobile markets and otherdata services. The <strong>in</strong>cumbents <strong>in</strong> fixedtelecommunications markets across theEU-25 accounted for 72 % of local calls <strong>in</strong>2005, 66 % of national calls and 56 % of<strong>in</strong>ternational calls. In contrast, the shareof <strong>in</strong>cumbents <strong>in</strong> the mobile market wasrelatively low at 39 % <strong>in</strong> 2006.The average number of mobile subscriptionsper 100 <strong>in</strong>habitants stood at 106 <strong>in</strong>the EU-27 <strong>in</strong> 2006, and surpassed parity<strong>in</strong> 17 of the Member States, wherethere were more subscriptions than<strong>in</strong>habitants.The price of telecommunications fell between2004 and 2006 <strong>in</strong> a large numberof Member States. Price reductions weremost apparent for national long distanceand <strong>in</strong>ternational calls (def<strong>in</strong>ed here ascalls to the United States), as on average<strong>in</strong> the EU-25 the price of a national longdistance call was reduced by almost 20 %overall between 2004 and 2006, while theprice of an <strong>in</strong>ternational call was reducedby almost 16 %. In comparison, there wasa modest reduction <strong>in</strong> the price of a localcall, which was reduced by less than 3 %.The prices of local, national long distanceor <strong>in</strong>ternational calls varied greatly acrossthe Member States <strong>in</strong> 2006. Local andnational distance calls were most expensive<strong>in</strong> Slovakia, while the price of <strong>in</strong>ternationalcalls was highest <strong>in</strong> Latvia. Thecheapest tariff for local calls was found <strong>in</strong>Spa<strong>in</strong>, for national long distance calls <strong>in</strong>Cyprus, and for calls to the United States<strong>in</strong> Germany.512 EUROPE IN FIGURES — <strong>Eurostat</strong> <strong>yearbook</strong> <strong>2009</strong>
Science and technology 14Table 14.14: Market share of <strong>in</strong>cumbents and lead<strong>in</strong>g operators <strong>in</strong> telecommunication markets(% of total market)Fixed telecommunications, 2005Market share of the lead<strong>in</strong>gLocalcalls (1)National longdistance calls (2)Internationalcalls (3)operator <strong>in</strong> mobile telecommunications,2006 (4)EU-25 72 66 56 39Belgium 68 68 58 45Bulgaria : : : :Czech Republic 76 63 65 41Denmark : : : 32Germany 56 57 39 37Estonia : : : 46Ireland 83 63 62 47Greece 78 73 74 41Spa<strong>in</strong> 78 75 62 46France 80 68 67 46Italy 71 73 47 41Cyprus 100 100 86 90Latvia 97 98 72 35Lithuania 97 88 76 36Luxembourg : : : 51Hungary 92 90 87 45Malta 99 99 98 52Netherlands 75 75 45 48Austria 53 59 50 39Poland 85 70 71 34Portugal : 78 80 46Romania : : : :Slovenia 100 100 83 71Slovakia 99 100 88 56F<strong>in</strong>land 95 45 41 45Sweden : : : 43United K<strong>in</strong>gdom 60 52 53 26Norway : 73 61 57(1) Austria and F<strong>in</strong>land, 2004; Cyprus, 2003.(2) F<strong>in</strong>land, 2004; Cyprus, 2003.(3) F<strong>in</strong>land, 2004.(4) Norway, 2005.Source: <strong>Eurostat</strong> (tsier070 and tsier080), National Regulatory AuthoritiesEUROPE IN FIGURES — <strong>Eurostat</strong> <strong>yearbook</strong> <strong>2009</strong>513
14 Science and technologyFigure 14.14: Telecommunications expenditure, 2006 (1)(% of GDP)86420EU-27LatviaBulgariaEstoniaRomaniaLithuaniaHungaryPolandCzech RepublicPortugalSlovakiaSloveniaSwedenGreeceSpa<strong>in</strong>BelgiumItalyNetherlandsAustriaUnited K<strong>in</strong>gdomDenmarkGermanyF<strong>in</strong>landIrelandFranceJapanSwitzerlandUnited StatesNorway(1) Cyprus, Luxembourg and Malta, not available.Source: <strong>Eurostat</strong> (tsiir090), <strong>Europe</strong>an Information Technology Observatory (EITO)Figure 14.15: Mobile phone subscriptions, 2006(average number of subscriptions per 100 <strong>in</strong>habitants)200150100500EU-27LuxembourgLithuaniaItaly (1)Czech RepublicEstoniaPortugalUnited K<strong>in</strong>gdom (1)CyprusNetherlandsIrelandAustriaF<strong>in</strong>landBulgariaDenmarkSpa<strong>in</strong>SwedenGermanyGreece (1)HungaryPolandLatvia (1)SloveniaSlovakia (1)BelgiumMalta (1)FranceRomaniaNorwayIcelandSwitzerlandCroatiaTurkey(1) Source: International Telecommunication Union (ITU).Source: <strong>Eurostat</strong> (t<strong>in</strong>00060)514 EUROPE IN FIGURES — <strong>Eurostat</strong> <strong>yearbook</strong> <strong>2009</strong>
Science and technology 14Table 14.15: Price of fixed telecommunications(EUR per 10-m<strong>in</strong>ute call)Local callsNational long distance calls Calls to the United States2004 2005 2006 2004 2005 2006 2004 2005 2006EU-25 0.37 0.35 0.36 0.92 0.76 0.74 2.13 2.11 1.79Belgium 0.57 0.57 0.57 0.57 0.57 0.57 1.98 1.98 1.98Bulgaria : : : : : : : : :Czech Republic 0.56 0.56 0.56 1.46 1.13 0.56 3.64 2.02 2.02Denmark 0.37 0.37 0.37 0.37 0.37 0.37 2.38 2.38 2.38Germany 0.42 0.39 0.39 1.20 0.49 0.49 1.23 1.23 0.46Estonia 0.23 0.23 0.23 0.23 0.23 0.23 2.26 2.10 2.13Ireland 0.49 0.49 0.49 0.82 0.82 0.82 1.91 1.91 1.91Greece 0.31 0.31 0.31 0.73 0.74 0.74 2.91 2.93 3.49Spa<strong>in</strong> 0.28 0.28 0.19 0.88 0.84 0.85 1.53 1.53 1.53France 0.39 0.33 0.36 0.96 0.83 0.89 2.24 2.27 2.32Italy 0.25 0.22 0.22 1.15 1.15 1.15 2.12 2.12 2.12Cyprus 0.20 0.22 0.22 0.20 0.22 0.22 0.80 0.66 0.66Latvia 0.36 0.36 0.36 1.03 1.03 1.03 5.94 5.94 5.94Lithuania 0.39 0.39 0.39 0.79 0.79 0.79 4.07 4.07 4.07Luxembourg 0.31 0.31 0.31 : : : 1.37 1.37 1.37Hungary 0.41 0.41 0.40 1.09 1.09 1.04 2.43 2.97 2.88Malta 0.25 0.25 0.25 : : : 1.65 1.77 1.64Netherlands 0.33 0.33 0.33 0.49 0.49 0.49 0.85 0.85 0.85Austria 0.49 0.49 0.49 0.59 0.59 0.59 1.90 1.90 1.90Poland 0.35 0.30 0.50 1.22 1.22 1.00 3.67 3.74 1.23Portugal 0.40 0.37 0.37 0.65 0.65 0.65 3.06 3.11 3.11Romania : : : : : : : : :Slovenia 0.26 0.26 0.26 0.26 0.26 0.26 1.75 1.40 1.40Slovakia 0.60 0.60 0.60 1.29 1.23 1.29 3.02 3.02 1.23F<strong>in</strong>land 0.24 0.24 0.24 0.90 0.94 0.94 4.77 4.90 4.90Sweden 0.29 0.29 0.29 0.29 0.29 0.29 1.06 1.06 1.18United K<strong>in</strong>gdom 0.44 0.44 0.44 0.44 0.44 0.44 2.08 2.08 2.23Norway 0.32 0.34 : 0.32 0.34 : 0.82 0.77 :Japan 0.25 0.25 0.25 1.02 1.02 1.02 4.39 4.39 4.34United States 0.07 0.07 0.07 1.03 1.03 1.03 - - -Source: <strong>Eurostat</strong> (tsier030), TeligenEUROPE IN FIGURES — <strong>Eurostat</strong> <strong>yearbook</strong> <strong>2009</strong>515
<strong>Europe</strong>’s regionsIntroductionThe EU’s regional policy aims to strengthen economic, social and territorial cohesionby reduc<strong>in</strong>g disparities <strong>in</strong> the level of development among regions and Member States.Its three ma<strong>in</strong> concerns are:• convergence, under which the poorest Member States and regions are eligible, account<strong>in</strong>gfor around 82 % of the funds available <strong>in</strong> the period 2007 to 2013;• regional competitiveness and employment, account<strong>in</strong>g for around 16 % of thefunds available <strong>in</strong> the period 2007 to 2013;• <strong>Europe</strong>an territorial cooperation, account<strong>in</strong>g for around 2.5 % of the funds available<strong>in</strong> the period 2007 to 2013.The ma<strong>in</strong> <strong>in</strong>struments of regional policy are the structural and cohesion funds.• The <strong>Europe</strong>an Regional Development Fund (ERDF) operates <strong>in</strong> all MemberStates and co-f<strong>in</strong>ances physical <strong>in</strong>vestments and, to a limited extent, tra<strong>in</strong><strong>in</strong>g forcitizens.• The <strong>Europe</strong>an Social Fund (ESF) will be implemented <strong>in</strong> l<strong>in</strong>e <strong>with</strong> the <strong>Europe</strong>anEmployment Strategy.• The Cohesion Fund co-f<strong>in</strong>ances ma<strong>in</strong>ly transport and environment projects <strong>in</strong>Member States whose gross national <strong>in</strong>come per <strong>in</strong>habitant is less than 90 % of theEU average.• The regional development component, as well as the cross-border cooperationcomponent of the new Instrument for Pre-Accession (IPA), helps candidate countriesto develop their competitiveness, particularly through the development oftransport networks and environmental <strong>in</strong>frastructure.EUROPE IN FIGURES — <strong>Eurostat</strong> <strong>yearbook</strong> <strong>2009</strong>517
15 <strong>Europe</strong>’s regionsThe ERDF is concentrated on the poorestregions <strong>in</strong> terms of gross domesticproduct (GDP) per <strong>in</strong>habitant. It aims tostrengthen economic and social cohesion<strong>in</strong> the EU by correct<strong>in</strong>g imbalances betweenits regions. The fund can <strong>in</strong>tervene<strong>in</strong> the three objectives of regional policy.In regions covered by the convergenceobjective, it focuses its <strong>in</strong>tervention onmodernis<strong>in</strong>g and diversify<strong>in</strong>g economicstructures as well as safeguard<strong>in</strong>g or creat<strong>in</strong>gsusta<strong>in</strong>able jobs. Concern<strong>in</strong>g regionalcompetitiveness and employment,the priorities of the ERDF are <strong>in</strong>novationand the knowledge-based economy,environment and risk prevention, andaccess to transport and telecommunicationsservices of general economic <strong>in</strong>terest.With respect to <strong>Europe</strong>an territorialcooperation, the ERDF is concerned <strong>with</strong>the development of economic and socialcross-border activities, the establishmentand development of transnational cooperation,and <strong>in</strong>creas<strong>in</strong>g the efficiency ofregional policy through <strong>in</strong>terregionalpromotion and cooperation, as well as thenetwork<strong>in</strong>g and exchange of experiencesbetween regional and local authorities.The ESF sets out to improve employmentand job opportunities <strong>in</strong> the EU. It <strong>in</strong>tervenes<strong>in</strong> the framework of the convergenceand regional competitiveness andemployment objectives. The ESF supportsactions <strong>in</strong> Member States and focuses onfour key areas: <strong>in</strong>creas<strong>in</strong>g adaptability ofworkers and enterprises (lifelong learn<strong>in</strong>gschemes, design<strong>in</strong>g and spread<strong>in</strong>g <strong>in</strong>novativework<strong>in</strong>g organisations); enhanc<strong>in</strong>gaccess to employment and participation<strong>in</strong> the labour market; re<strong>in</strong>forc<strong>in</strong>g social<strong>in</strong>clusion by combat<strong>in</strong>g discrim<strong>in</strong>ationand facilitat<strong>in</strong>g access to the labour marketfor disadvantaged people; and promot<strong>in</strong>gpartnership for reform <strong>in</strong> thefields of employment and <strong>in</strong>clusion.The Cohesion Fund is aimed at MemberStates whose gross national <strong>in</strong>come(GNI) per <strong>in</strong>habitant is less than 90 % ofthe EU average. It serves to reduce theireconomic and social shortfall, as well asto stabilise their economy. It supportsactions <strong>in</strong> the framework of the convergenceobjective. For the 2007-2013 period,the Cohesion Fund concerns Bulgaria,the Czech Republic, Estonia, Greece, Cyprus,Hungary, Latvia, Lithuania, Malta,Poland, Portugal, Romania, Slovenia andSlovakia; Spa<strong>in</strong> is eligible to a phase-outfund only. The Cohesion Fund f<strong>in</strong>ancesactivities under two categories: trans-<strong>Europe</strong>an transport networks, notablypriority projects of <strong>Europe</strong>an <strong>in</strong>terest;and the environment, also support<strong>in</strong>gprojects related to energy or transport,as long as they clearly present a benefit tothe environment.Def<strong>in</strong>itions and data availabilityComparable regional statistics form animportant part of the <strong>Europe</strong>an statisticalsystem, and have been collected forseveral decades. <strong>Eurostat</strong>’s regional statisticscover the pr<strong>in</strong>cipal features of economicand social life <strong>with</strong><strong>in</strong> the EU. Theconcepts and def<strong>in</strong>itions used for theseregional statistics are as close as possibleto those used for the production of statisticsat a national level.518 EUROPE IN FIGURES — <strong>Eurostat</strong> <strong>yearbook</strong> <strong>2009</strong>
<strong>Europe</strong>’s regions 15All statistics at a regional level <strong>with</strong><strong>in</strong>the EU are based on the nomenclatureof territorial units for statistics (NUTS).The NUTS classification has been usedfor many decades for regional statistics,but it was only <strong>in</strong> 2003 that NUTS acquireda legal basis (Regulation (EC) No1059/2003). As new Member States havejo<strong>in</strong>ed the EU the NUTS Regulation hasbeen amended to <strong>in</strong>clude the regionalclassification <strong>in</strong> those countries. This wasthe case <strong>in</strong> 2004, when the EU took <strong>in</strong> 10new Member States, and aga<strong>in</strong> <strong>in</strong> 2007when Bulgaria and Romania becamemembers. A review of the NUTS classificationwas conducted <strong>in</strong> 2006 and a revisedversion (NUTS 2006 – Regulation(EC) No 105/2007) entered <strong>in</strong>to force on1 January 2008.NUTS is a hierarchical classification;it subdivides each Member State <strong>in</strong>to anumber of regions at NUTS 1 level. Eachof these is then subdivided <strong>in</strong>to regions atNUTS 2 level, and these <strong>in</strong> turn <strong>in</strong>to regionsat NUTS 3 level. The NUTS regionsare, <strong>in</strong> general, adm<strong>in</strong>istrative units, reflect<strong>in</strong>gthe remit of local authorities.These adm<strong>in</strong>istrative regions are generallyadopted by statisticians as the mostappropriate units for data collection,process<strong>in</strong>g and dissem<strong>in</strong>ation. The currentNUTS (version 2006) subdivides theterritory of the <strong>Europe</strong>an Union (EU-27)<strong>in</strong>to 97 NUTS level 1 regions, 271 NUTSlevel 2 regions and 1 303 NUTS level 3regions.S<strong>in</strong>ce 2004, <strong>Eurostat</strong> has also collectedand published urban statistics, measur<strong>in</strong>gthe ‘quality of life’ through a set ofsome 338 <strong>in</strong>dicators for 321 cities <strong>with</strong><strong>in</strong>the EU, Croatia, Turkey, Norway andSwitzerland. Data are available for threelevels: the core city; larger urban zones;and for sub-city districts. The ma<strong>in</strong> goalof the Urban Audit data collection is toprovide <strong>in</strong>formation to assess the qualityof life <strong>in</strong> <strong>Europe</strong>an towns and cities,as measured through a broad range of<strong>in</strong>dicators (cover<strong>in</strong>g urban liv<strong>in</strong>g, suchas demography, hous<strong>in</strong>g, health, crime,the labour market, <strong>in</strong>come disparity, localadm<strong>in</strong>istration, educational qualifications,the environment, climate, travelpatterns, <strong>in</strong>formation society and cultural<strong>in</strong>frastructure), as well as perceptionsurveys conducted among persons liv<strong>in</strong>g<strong>in</strong> these cities.Ma<strong>in</strong> f<strong>in</strong>d<strong>in</strong>gsThe maps presented here illustrate thediversity of <strong>Europe</strong>’s regions. They showthat for many economic and social aspects,quite large variations can also befound <strong>with</strong><strong>in</strong> a given country. In mostcases, the capital region of a country iseconomically better off than the more ruralareas.The richest <strong>Europe</strong>an regions <strong>in</strong> 2005, asdef<strong>in</strong>ed by GDP per <strong>in</strong>habitant, were concentrated<strong>with</strong><strong>in</strong> the major conurbationsof the EU-15 Member States, <strong>with</strong> <strong>in</strong>nerLondon topp<strong>in</strong>g the list (EUR 67 798 per<strong>in</strong>habitant). Among the top 20 regionsPraha and Bratislavský kraj stood out asthe only regions from the countries thathave jo<strong>in</strong>ed the EU s<strong>in</strong>ce 2004, ranked<strong>in</strong> 12th and 18th place respectively of the271 regions <strong>with</strong><strong>in</strong> the EU-27 MemberStates for which data are presented. Theten poorest regions (us<strong>in</strong>g this measure)were all <strong>in</strong> Bulgaria and Romania, <strong>with</strong>Polish, Romanian and Hungarian regionsmak<strong>in</strong>g up those regions ranked between10th and 20th poorest. The region at thetop of the rank<strong>in</strong>g was more than twelvetimes as rich as the one at the bottom.EUROPE IN FIGURES — <strong>Eurostat</strong> <strong>yearbook</strong> <strong>2009</strong>519
15 <strong>Europe</strong>’s regionsThe widest disparities <strong>in</strong> the distributionof wealth creation between the regions<strong>with</strong><strong>in</strong> a country were recorded <strong>in</strong> theUnited K<strong>in</strong>gdom, France, Belgium andSlovakia. In each of these cases the highestGDP per <strong>in</strong>habitant was recorded forthe region <strong>in</strong>clud<strong>in</strong>g the capital city, andthe exclusion of this region narrows considerablythe distribution. The pattern ofthe highest GDP per <strong>in</strong>habitant be<strong>in</strong>g recorded<strong>in</strong> the region <strong>with</strong> the capital citywas not observed <strong>in</strong> all of the MemberStates, as for example, Hamburg was thewealthiest region <strong>in</strong> Germany, Åland thewealthiest <strong>in</strong> F<strong>in</strong>land, while the prov<strong>in</strong>cesof Bolzano/Bozen and Lombardia werethe wealthiest <strong>in</strong> Italy. Care should betaken <strong>with</strong> the <strong>in</strong>terpretation of data onGDP per <strong>in</strong>habitant as the ratio is <strong>in</strong>fluencedby commuters work<strong>in</strong>g <strong>in</strong> one regionbut liv<strong>in</strong>g <strong>in</strong> another: the very highGDP per <strong>in</strong>habitant <strong>with</strong><strong>in</strong> Inner London,Luxembourg or Bruxelles-Capitale/Brussels Hoofdstedelijk Gewest (the threeregions <strong>with</strong> the highest GDP per <strong>in</strong>habitant)can, at least <strong>in</strong> part, be expla<strong>in</strong>ed bya large daily <strong>in</strong>flux of commuters fromneighbour<strong>in</strong>g regions or, <strong>in</strong> the case ofLuxembourg, from across neighbour<strong>in</strong>gborders.In stark contrast to the level of GDP per<strong>in</strong>habitant, several regions of Bulgariaand Romania as well as the three BalticMember States (Estonia, Latvia andLithuania) recorded strong growth <strong>in</strong>GDP per <strong>in</strong>habitant: an analysis of theperiod 2001-2005 shows that the top 15regions <strong>with</strong><strong>in</strong> the EU-27 for the growthof GDP per <strong>in</strong>habitant <strong>in</strong>cluded eightfrom Romania, three from Bulgaria, thethree Baltic Member States, as well as oneregion each from the Czech Republic andSlovakia. The highest growth rate was11.5 % for Estonia, while four Romanianregions (Vest, Sud – Muntenia, Nord-Vestand Sud-Est) reported growth <strong>in</strong> excessof 10 %. The slowest grow<strong>in</strong>g 20 regions<strong>in</strong> the EU-27 <strong>in</strong>cluded 18 regions <strong>in</strong> Italy,Åland <strong>in</strong> F<strong>in</strong>land and French Guyane. Ofthese, seven of the Italian regions, Ålandand Guyane all reported a fall <strong>in</strong> GDP per<strong>in</strong>habitant over the period considered,the largest reduction be<strong>in</strong>g an average of1.1 % per annum <strong>in</strong> Abruzzo.There were 19 regions <strong>in</strong> the EU-27 thathad a population density of more than1 000 <strong>in</strong>habitants per square kilometre.Out of these, six were <strong>in</strong> the UnitedK<strong>in</strong>gdom (<strong>in</strong>clud<strong>in</strong>g the most denselypopulous region of Inner London (9 159<strong>in</strong>habitants per km2)), three were <strong>in</strong> Germany(<strong>in</strong>clud<strong>in</strong>g Berl<strong>in</strong>), alongside thecapitals of Belgium, Austria, the CzechRepublic, Romania and Greece, whilethe other regions <strong>in</strong>cluded Malta, Zuid-Holland (the Netherlands) and the twoautonomous regions of Melilla and Ceuta(Spa<strong>in</strong>). Eight out of the ten least populousregions for which data are availablewere <strong>in</strong> F<strong>in</strong>land or Sweden, along <strong>with</strong>Guyane (France) and Castilla-la Mancha(Spa<strong>in</strong>).Although Guyane reported the lowestpopulation density, it also reported thehighest population growth (3.5 % per annum)between January 2001 and January2006. Seven of the ten fastest grow<strong>in</strong>gpopulations <strong>in</strong> the EU-27 were <strong>in</strong> Spa<strong>in</strong>,pr<strong>in</strong>cipally <strong>in</strong> the islands, easterly coastalregions and the Comunidad de Madrid.The two other regions among the tenfastest grow<strong>in</strong>g <strong>in</strong> the EU-27 were Flevoland(the Netherlands) and Border, Midlandsand Western (Ireland). Just overone quarter (27.8 %) of the 263 regionsfor which data are available reported a520 EUROPE IN FIGURES — <strong>Eurostat</strong> <strong>yearbook</strong> <strong>2009</strong>
<strong>Europe</strong>’s regions 15decl<strong>in</strong>e <strong>in</strong> their populations over the periodconsidered. Of these, six regions,two <strong>in</strong> Germany and four <strong>in</strong> Bulgaria,recorded annual population reductions<strong>in</strong> excess of 1 % per annum; <strong>with</strong> onlySeverozapaden (Bulgaria) report<strong>in</strong>g a decl<strong>in</strong>e<strong>in</strong> excess of 2 % per annum.Some of the highest old-age dependencyratios are found <strong>in</strong> rural, agriculturalareas of Italy, France and Portugal, oreastern regions of Germany (Chemnitz,Dresden, Sachsen-Anhalt or Leipzig).The highest unemployment rates <strong>in</strong> 2007were recorded <strong>in</strong> the four French departmentsof Réunion, Guadeloupe, Mart<strong>in</strong>iqueand Guyane, followed by the twoSpanish autonomous regions of Ceutaand Melilla. Out of the next 11 regions,seven were <strong>in</strong> eastern Germany, two were<strong>in</strong> Slovakia and the other was Bruxelles-Capitale/Brussels Hoofdstedelijk Gewest.Seven of the 15 regions <strong>with</strong> the lowestunemployment rates were Dutch, <strong>in</strong>clud<strong>in</strong>gthe region <strong>with</strong> the lowest rate, Zeeland(2.1 %).EUROPE IN FIGURES — <strong>Eurostat</strong> <strong>yearbook</strong> <strong>2009</strong>521
15 <strong>Europe</strong>’s regionsMap 15.1: Gross domestic product (GDP) per <strong>in</strong>habitant, by NUTS 2 regions, 2005 (1)(PPS per <strong>in</strong>habitant)Gross domestic product (GDP) per <strong>in</strong>habitant,by NUTS 2 regions, 2005 (1)Guadeloupe (FR)Mart<strong>in</strong>ique (FR)(PPS per <strong>in</strong>habitant) 15 000 and 22 000 and 26 000 and 30 000Data not available(1) Germany and the Netherlands, provisional;Ireland, estimates.0 25Guyane (FR)0 100Açores (PT)0 20Réunion (FR)0 20Madeira (PT)0 1000 20Data source: <strong>Eurostat</strong>© EuroGeographics Association, for the adm<strong>in</strong>istrative boundariesCartography: <strong>Eurostat</strong> — GISCO, 01/<strong>2009</strong>Canarias (ES)Malta0 600 km0 1000 10Ísland0 100Source: <strong>Eurostat</strong> (tgs00005)522 EUROPE IN FIGURES — <strong>Eurostat</strong> <strong>yearbook</strong> <strong>2009</strong>
<strong>Europe</strong>’s regions 15Map 15.2: Average annual growth rate of gross domestic product (GDP) per <strong>in</strong>habitant,by NUTS 2 regions, 2001-2005 (1)(% per annum)Average annual growth rate of grossdomestic product (GDP) per <strong>in</strong>habitant,by NUTS 2 regions, 2001-2005 (1)(% per annum)Guadeloupe (FR)Mart<strong>in</strong>ique (FR) 2.5% and 3.5% and 5%Data not available0 25Guyane (FR)0 1000 20Réunion (FR)0 20Açores (PT)Madeira (PT)(1) Germany and the Netherlands, provisional;Ireland, estimates;Denmark, country level.0 1000 20Data source: <strong>Eurostat</strong>© EuroGeographics Association, for the adm<strong>in</strong>istrative boundariesCartography: <strong>Eurostat</strong> — GISCO, 01/<strong>2009</strong>Canarias (ES)Malta0 600 km0 1000 10Ísland0 100Source: <strong>Eurostat</strong> (tgs00005)EUROPE IN FIGURES — <strong>Eurostat</strong> <strong>yearbook</strong> <strong>2009</strong>523
15 <strong>Europe</strong>’s regionsMap 15.3: Population density, by NUTS 2 regions, 2006 (1)(<strong>in</strong>habitants per km²)Population density,by NUTS 2 regions, 2006 (1)(<strong>in</strong>habitants per km²) 60 and 120 and 300Data not availableGuadeloupe (FR)0 25Guyane (FR)Mart<strong>in</strong>ique (FR)0 20Réunion (FR)(1) Scotland (United K<strong>in</strong>gdom), level 1;Belgium, Ireland, Greece, Spa<strong>in</strong>, France, Austria, Polandand Iceland, 2005;the United K<strong>in</strong>gdom, 2004.Data source: <strong>Eurostat</strong>© EuroGeographics Association, for the adm<strong>in</strong>istrative boundariesCartography: <strong>Eurostat</strong> — GISCO, 01/<strong>2009</strong>Açores (PT)0 1000 20Madeira (PT)0 600 km0 1000 20Canarias (ES)Malta0 1000 10Ísland0 100Source: <strong>Eurostat</strong> (tgs00024)524 EUROPE IN FIGURES — <strong>Eurostat</strong> <strong>yearbook</strong> <strong>2009</strong>
<strong>Europe</strong>’s regions 15Map 15.4: Average annual growth rate of population, by NUTS 2 regions, 1 Jan. 2001 - 1 Jan. 2006 (1)(% per annum)Average annual growth rate of population,by NUTS 2 regions,1 Jan. 2001 - 1 Jan. 2006 (1)(% per annum)Guadeloupe (FR)Mart<strong>in</strong>ique (FR) 0 and 0.3 and 0.75Data not available0 25Guyane (FR)0 1000 20Réunion (FR)0 20(1) Denmark and Slovenia, country level;Scottish regions (United K<strong>in</strong>gdom), 2002-2004;Northern Ireland, English and Welsh regions (United K<strong>in</strong>gdom),2001-2004;Croatia, 2002-2006.Açores (PT)Madeira (PT)0 1000 20Data source: <strong>Eurostat</strong>© EuroGeographics Association, for the adm<strong>in</strong>istrative boundariesCartography: <strong>Eurostat</strong> — GISCO, 01/<strong>2009</strong>Canarias (ES)Malta0 600 km0 1000 10Ísland0 100Source: <strong>Eurostat</strong> (reg_d2jan)EUROPE IN FIGURES — <strong>Eurostat</strong> <strong>yearbook</strong> <strong>2009</strong>525
15 <strong>Europe</strong>’s regionsMap 15.5: Old age dependency, population ratio by age: > 64 / 15-64, by NUTS 2 regions, 2007 (1)(%)Old age dependency,population ratio by age: > 64 / 15-64,by NUTS 2 regions, 2007 (1)(%) 21 and 25 and 30Data not availableGuadeloupe (FR)0 25Guyane (FR)Mart<strong>in</strong>ique (FR)0 20Réunion (FR)(1) Denmark, country level;Belgium, Denmark, France, Austria and the formerYugoslav Republic of Macedonia, 2006;United K<strong>in</strong>gdom, 2004.Data source: <strong>Eurostat</strong>© EuroGeographics Association, for the adm<strong>in</strong>istrative boundariesCartography: <strong>Eurostat</strong> — GISCO, 01/<strong>2009</strong>Açores (PT)0 1000 20Madeira (PT)0 600 km0 1000 20Canarias (ES)Malta0 1000 10Ísland0 100Source: <strong>Eurostat</strong> (reg_d2jan)526 EUROPE IN FIGURES — <strong>Eurostat</strong> <strong>yearbook</strong> <strong>2009</strong>
<strong>Europe</strong>’s regions 15Map 15.6: Disposable <strong>in</strong>come, by NUTS 2 regions, 2005 (1)(EUR per <strong>in</strong>habitant)Disposable <strong>in</strong>come,by NUTS 2 regions, 2005 (1)(EUR per <strong>in</strong>habitant)Guadeloupe (FR)Mart<strong>in</strong>ique (FR) 9 000 and 15 000 and 18 000Data not available0 25Guyane (FR)0 1000 20Réunion (FR)0 20(1) Denmark and Slovenia, country level;Italy and Norway, 2004;French overseas departments, 2000, estimates;Italy, provisional.Açores (PT)Madeira (PT)0 1000 20Data source: <strong>Eurostat</strong>© EuroGeographics Association, for the adm<strong>in</strong>istrative boundariesCartography: <strong>Eurostat</strong> — GISCO, 04/<strong>2009</strong>Canarias (ES)Malta0 600 km0 1000 10Ísland0 100Source: <strong>Eurostat</strong> (tgs00026)EUROPE IN FIGURES — <strong>Eurostat</strong> <strong>yearbook</strong> <strong>2009</strong>527
15 <strong>Europe</strong>’s regionsMap 15.7: Employment rate, by NUTS 2 regions, 2007 (1)(%)Employment rate,by NUTS 2 regions, 2007 (1)(%) 60 and 65 and 70Data not availableGuadeloupe (FR)0 25Guyane (FR)Mart<strong>in</strong>ique (FR)0 20Réunion (FR)(1) Denmark and Slovenia, country level;Iceland, 2006.Data source: <strong>Eurostat</strong>© EuroGeographics Association, for the adm<strong>in</strong>istrative boundariesCartography: <strong>Eurostat</strong> — GISCO, 04/<strong>2009</strong>Açores (PT)0 1000 20Madeira (PT)0 600 km0 1000 20Canarias (ES)Malta0 1000 10Ísland0 100Source: <strong>Eurostat</strong> (tgs00007)528 EUROPE IN FIGURES — <strong>Eurostat</strong> <strong>yearbook</strong> <strong>2009</strong>
<strong>Europe</strong>’s regions 15Map 15.8: Old age employment rate (55-64), by NUTS 2 regions, 2007 (1)(%)Old age employment rate (55-64),by NUTS 2 regions, 2007 (1) 34 and 43 and 50 and 54(%)Data not availableGuadeloupe (FR)0 25Guyane (FR)Mart<strong>in</strong>ique (FR)0 20Réunion (FR)(1) Denmark, Slovenia and Switzerland, country level;Iceland, 2006.Data source: <strong>Eurostat</strong>© EuroGeographics Association, for the adm<strong>in</strong>istrative boundariesCartography: <strong>Eurostat</strong> — GISCO, 04/<strong>2009</strong>Açores (PT)0 1000 20Madeira (PT)0 600 km0 1000 20Canarias (ES)Malta0 1000 10Ísland0 100Source: <strong>Eurostat</strong> (reg_lfe2emprt)EUROPE IN FIGURES — <strong>Eurostat</strong> <strong>yearbook</strong> <strong>2009</strong>529
15 <strong>Europe</strong>’s regionsMap 15.9: Unemployment rate, by NUTS 2 regions, 2007 (1)(%)Unemployment rate,by NUTS 2 regions, 2007 (1)(%) 4 and 6.5 and 10Data not availableGuadeloupe (FR)0 25Guyane (FR)Mart<strong>in</strong>ique (FR)0 20Réunion (FR)(1) Denmark and Slovenia, country level;Iceland, 2005;Valle d'Aosta/Vallée d'Aoste (Italy), Zeeland (the Netherlands)and Burgenland (Austria), unreliable due to small sample size;Åland (F<strong>in</strong>land) and Hedmark og Oppland (Norway) extremlyunreliable due to small sample size.Data source: <strong>Eurostat</strong>© EuroGeographics Association, for the adm<strong>in</strong>istrative boundariesCartography: <strong>Eurostat</strong> — GISCO, 05/<strong>2009</strong>Açores (PT)0 1000 20Madeira (PT)0 600 km0 1000 20Canarias (ES)Malta0 1000 10Ísland0 100Source: <strong>Eurostat</strong> (tgs00010)530 EUROPE IN FIGURES — <strong>Eurostat</strong> <strong>yearbook</strong> <strong>2009</strong>
<strong>Europe</strong>’s regions 15Table 15.1: Dispersion of regional employment rates (1)(coefficient of variation)1999 2000 2001 2002 2003 2004 2005 2006 2007EU-27 12.9 13.0 13.2 13.2 12.9 12.1 11.9 11.4 11.1Euro area 13.3 13.0 12.7 12.1 11.5 10.5 10.6 10.6 10.8Belgium 8.0 7.9 8.0 8.0 7.7 8.7 8.4 8.7 8.6Bulgaria : : : : 6.6 6.9 7.2 7.3 7.1Czech Republic 5.6 5.8 5.7 5.6 5.8 5.6 5.5 5.2 4.6Denmark : : : : : : : : :Germany 5.4 5.4 5.8 5.7 5.9 6.0 5.6 5.2 4.8Estonia - - - - - - - - -Ireland - - - - - - - - -Greece 5.2 5.1 4.3 3.8 3.2 4.1 4.3 3.7 3.5Spa<strong>in</strong> 10.8 10.7 10.0 9.3 9.0 8.7 8.3 7.8 7.5France 7.1 6.9 8.3 8.0 7.2 7.1 7.2 7.4 6.6Italy 17.4 17.5 17.1 16.7 17.0 15.6 16.0 16.0 16.3Cyprus - - - - - - - - -Latvia - - - - - - - - -Lithuania - - - - - - - - -Luxembourg - - - - - - - - -Hungary 9.1 9.0 8.8 9.4 8.5 9.4 9.9 9.1 9.7Malta - - - - - - - - -Netherlands 2.3 2.2 2.3 2.2 2.3 2.3 2.0 2.2 2.2Austria 2.3 2.5 2.6 2.5 3.0 3.5 4.1 3.4 3.8Poland 4.8 6.9 7.2 7.3 7.2 6.4 5.6 5.1 4.5Portugal 3.6 4.3 3.5 3.8 3.9 3.5 3.3 3.1 3.3Romania 4.2 4.6 5.6 3.2 3.5 4.9 4.5 3.6 4.6Slovenia - - - - - - - - -Slovakia 8.1 9.1 8.3 7.3 7.6 9.0 9.8 8.6 8.3F<strong>in</strong>land 6.7 6.8 7.0 6.7 6.1 5.5 5.5 5.4 5.6Sweden 4.8 4.5 4.2 4.6 4.3 4.4 3.0 2.9 2.4United K<strong>in</strong>gdom 7.5 7.1 6.8 6.6 6.1 5.9 5.7 5.5 5.4Croatia : : : : : : : : 7.5Iceland - - - - - - - - -Liechtenste<strong>in</strong> - - - - - - - - -Norway 2.4 2.4 2.2 1.6 1.6 1.7 1.3 2.3 2.5(1) Variation of employment rates for the age group 15-64 across regions (NUTS 2 level) and <strong>with</strong><strong>in</strong> countries.Source: <strong>Eurostat</strong> (tsisc050)EUROPE IN FIGURES — <strong>Eurostat</strong> <strong>yearbook</strong> <strong>2009</strong>531
L<strong>in</strong>k<strong>in</strong>g statisticsto <strong>Europe</strong>an policiesEffective economic and political decision-mak<strong>in</strong>g depends on the regular supply ofreliable <strong>in</strong>formation. Statistics are one of the pr<strong>in</strong>ciple sources of such <strong>in</strong>formation,provid<strong>in</strong>g essential quantitative support to the elaboration and implementation of policies.Statistics are also a powerful tool for communicat<strong>in</strong>g <strong>with</strong> the general public.The <strong>in</strong>formation needs of politicians require constant <strong>in</strong>teraction between policymakersand statisticians: the former formulate their needs for data, and the latter attemptto adapt the statistical production system so as to fulfil those needs. In this fashion,new policies lead to improvements <strong>in</strong> statistical production, both <strong>in</strong> terms of enhanc<strong>in</strong>gthe quality of exist<strong>in</strong>g <strong>in</strong>dicators and of creat<strong>in</strong>g new ones.Whereas politicians require aggregated <strong>in</strong>dicators which provide a synthetic andclear picture of the different phenomena they are <strong>in</strong>terested <strong>in</strong>, statisticians tend todeal <strong>with</strong> less aggregated basic data. Statisticians therefore have to transform, synthesiseand model basic data <strong>in</strong> order to <strong>in</strong>crease data readability and extract signals (i.e.<strong>in</strong>dicators).Over recent years, three particularly significant policies have substantially <strong>in</strong>fluenced<strong>Eurostat</strong>’s priorities and activities:• economic and monetary union (EMU) and the creation of the euro area (1999);• the Lisbon strategy (2000, re-focused <strong>in</strong> 2005);• the susta<strong>in</strong>able development strategy (2001, renewed <strong>in</strong> 2006).EUROPE IN FIGURES — <strong>Eurostat</strong> <strong>yearbook</strong> <strong>2009</strong>533
16 L<strong>in</strong>k<strong>in</strong>g statistics to <strong>Europe</strong>an policiesEconomic and monetary union and thesett<strong>in</strong>g-up of the <strong>Europe</strong>an Central Bank(ECB) required a broad range of <strong>in</strong>fraannualshort-term statistics to measureeconomic and monetary developments<strong>with</strong><strong>in</strong> the euro area and to assist <strong>in</strong> theimplementation of a common monetarypolicy. Effective monetary policy dependson timely, reliable and comprehensiveeconomic statistics giv<strong>in</strong>g an overview ofthe economic situation. Such data are alsoneeded for the assessment of the bus<strong>in</strong>esscycle.However, measur<strong>in</strong>g economic andmonetary developments <strong>with</strong><strong>in</strong> the euroarea is not the only concern of <strong>Europe</strong>anpolicies. <strong>Europe</strong>ans place a high valueon their quality of life, <strong>in</strong>clud<strong>in</strong>g aspectssuch as a clean environment, social protection,prosperity and equity.In recent years the <strong>Europe</strong>an Councilhas focused on a number of key areas <strong>in</strong>tendedto shape the future developmentof the EU, <strong>in</strong> particular by adopt<strong>in</strong>g twocomplementary strategies. While the goalof the Lisbon strategy is for the EU to ‘becomethe most competitive and dynamicknowledge-based economy <strong>in</strong> the world,capable of susta<strong>in</strong>able economic growth<strong>with</strong> more and better jobs and greatersocial cohesion’, the susta<strong>in</strong>able developmentstrategy is concerned <strong>with</strong> the cont<strong>in</strong>uousimprovement of quality of life,both for current and future generations,through seek<strong>in</strong>g a balance between economicdevelopment, social cohesion andprotection of the environment.<strong>Eurostat</strong> has responded to politiciansneeds <strong>in</strong> these new areas by develop<strong>in</strong>gthree sets of <strong>in</strong>dicators:• Euro-Indicators, of which the Pr<strong>in</strong>cipal<strong>Europe</strong>an Economic Indicators(PEEIs) are the core, for monetarypolicy purposes;• structural <strong>in</strong>dicators, for the (revised)Lisbon strategy, used to underp<strong>in</strong>the Commission’s analysis <strong>in</strong> an annualprogress report to the <strong>Europe</strong>anCouncil;• susta<strong>in</strong>able development <strong>in</strong>dicators,extend<strong>in</strong>g across a wide range of issuesaffect<strong>in</strong>g the quality of life, <strong>in</strong>clud<strong>in</strong>genvironmental, social, economicand governance issues.These <strong>in</strong>dicators have been developed byexperts and agreed at a political level.They are cont<strong>in</strong>uously monitored, improvedand reviewed <strong>in</strong> order to be <strong>in</strong> l<strong>in</strong>e<strong>with</strong> evolv<strong>in</strong>g policy requirements.<strong>Eurostat</strong> has created three ‘special topics’on its website, l<strong>in</strong>ked to these three collectionsof <strong>in</strong>dicators. This chapter brieflypresents the ma<strong>in</strong> characteristics of thesethree areas.534 EUROPE IN FIGURES — <strong>Eurostat</strong> <strong>yearbook</strong> <strong>2009</strong>
L<strong>in</strong>k<strong>in</strong>g statistics to <strong>Europe</strong>an policies 16Euro-<strong>in</strong>dicators/PEEISS<strong>in</strong>ce October 2001 the Euro-Indicators/PEEIs web pages have been a referencepo<strong>in</strong>t for all users of official statisticsdeal<strong>in</strong>g <strong>with</strong> short-term data. They were<strong>in</strong>itially conceived as an <strong>in</strong>dependentwebsite, available <strong>in</strong> parallel to the <strong>Eurostat</strong>website. However, s<strong>in</strong>ce October2004, Euro-Indicators/PEEIs have been<strong>in</strong>tegrated <strong>in</strong>to the <strong>Eurostat</strong> website as aso-called ‘special topic’. It is possible toaccess Euro-Indicators/PEEIs from <strong>Eurostat</strong>’shomepage or directly via the follow<strong>in</strong>gl<strong>in</strong>k: http://ec.europa.eu/eurostat/euro<strong>in</strong>dicators. It is also possible to e-mail the Euro-Indicators/PEEIs team at:ESTAT-EUROINDICATORS@ec.europa.eu.Euro-Indicators/PEEIs aims to supplybus<strong>in</strong>ess-cycle analysts, policymakers,media, researchers, students, and other<strong>in</strong>terested users <strong>with</strong> a comprehensive,well structured and high quality set of<strong>in</strong>formation which is useful <strong>in</strong> their dailyactivities. The core of Euro-Indicators/PEEIs comprises a set of statistical <strong>in</strong>dicatorsgiv<strong>in</strong>g an accurate and as timely aspossible overview of the economic evolutionof the euro area, the EU, and the<strong>in</strong>dividual Member States. Moreover, Euro-Indicatorsconta<strong>in</strong>s the follow<strong>in</strong>g additionalproducts and services <strong>in</strong>tendedto assist <strong>in</strong> the understand<strong>in</strong>g and analysisof data:• Pr<strong>in</strong>cipal <strong>Europe</strong>an Economic Indicators(PEEIs),• background,• data,• publications,• news releases,• methodology.Euro-<strong>in</strong>dicators/PEEIS dataThe data presented <strong>in</strong> Euro-Indicators/PEEIs are built around a set of the mostrelevant statistical <strong>in</strong>dicators, calledPr<strong>in</strong>cipal <strong>Europe</strong>an Economic Indicators,a complete list of which can befound <strong>in</strong> the Commission communicationCOM(2002) 661. Euro-Indicators/PEEIs <strong>in</strong>cludes detailed breakdowns forPEEIs, as well as additional qualitativeand quantitative <strong>in</strong>dicators which areuseful to give an overall picture of theeconomic situation <strong>in</strong> <strong>Europe</strong>. They arestructured <strong>in</strong> three ma<strong>in</strong> parts:• selected Pr<strong>in</strong>cipal <strong>Europe</strong>an EconomicIndicators (conta<strong>in</strong><strong>in</strong>g 22 selected<strong>in</strong>dicators for the euro area and <strong>Europe</strong>anUnion) directly accessible on theEuro-Indicators/PEEIs homepage;• key short-term <strong>in</strong>dicators (a subset ofpre-def<strong>in</strong>ed tables);• <strong>Europe</strong>an and national short-termstatistics database (Euro<strong>in</strong>d).Both the key short-term <strong>in</strong>dicators andthe Euro<strong>in</strong>d database are divided <strong>in</strong>to thefollow<strong>in</strong>g eight doma<strong>in</strong>s:• balance of payments,• bus<strong>in</strong>ess and consumer surveys,• consumer prices,• external trade,• <strong>in</strong>dustry, commerce and services,• labour market,• monetary and f<strong>in</strong>ancial <strong>in</strong>dicators,• national accounts.EUROPE IN FIGURES — <strong>Eurostat</strong> <strong>yearbook</strong> <strong>2009</strong>535
16 L<strong>in</strong>k<strong>in</strong>g statistics to <strong>Europe</strong>an policiesThe new Euro-Indicators/PEEIs homepagelaunched <strong>in</strong> October 2007 gives ageneral overview of the economic situationof the euro area and <strong>Europe</strong>an Union,br<strong>in</strong>g<strong>in</strong>g together <strong>in</strong> one s<strong>in</strong>gle placea set of the most relevant and timelyshort-term economic <strong>in</strong>dicators for theeuro area and the <strong>Europe</strong>an Union. Thiswebpage provides policy-makers, analysts,academics, the media, and the public<strong>with</strong> essential <strong>in</strong>formation for decisionmak<strong>in</strong>g, economic analysis and research.Key short-term <strong>in</strong>dicators are availablefrom the data page and these provide aneasy way to look at the most recent data<strong>in</strong> tabular or graphical format, <strong>in</strong>clud<strong>in</strong>ga short explanatory text; a downloadfacility is also provided for the 320 tablesthat are currently available.The Euro<strong>in</strong>d database (accessible eitherfrom the Euro-Indicators data page orfrom the data dissem<strong>in</strong>ation tree on the<strong>Eurostat</strong> website as <strong>Europe</strong>an and nationalshort-term <strong>in</strong>dicators) constitutesa large database of <strong>in</strong>fra-annual macroeconomic<strong>in</strong>dicators; about 70 000 seriesare currently available and these can beselected and downloaded <strong>in</strong> a variety offormats.Meta-dataIn conformity <strong>with</strong> <strong>Eurostat</strong> standards,the Euro-Indicators data are documented<strong>in</strong> accordance <strong>with</strong> the InternationalMonetary Fund’s (IMF) special data dissem<strong>in</strong>ationstandard (SDDS). SDDS filesare regularly monitored and revised sothat they are <strong>in</strong> l<strong>in</strong>e <strong>with</strong> the publisheddata. The creation of a more user-orientedmeta-data set is one of the objectivesof the Euro-Indicators team (currentlyunder construction).Quality reportsS<strong>in</strong>ce 2001, the Euro<strong>in</strong>d database hasbeen subject to monthly quality monitor<strong>in</strong>g.The results of this assessment arepresented <strong>in</strong> a detailed onl<strong>in</strong>e publicationcalled ‘State of affairs’, accessible fromthe tab entitled ‘Publications’ <strong>with</strong><strong>in</strong> theEuro-Indicators/PEEIs ‘special topic’. Asynthesis of this monthly assessment ispresented <strong>in</strong> another onl<strong>in</strong>e publication,entitled the ‘Monitor<strong>in</strong>g report’, which isalso accessible from the same tab.Publications and work<strong>in</strong>g papersThe ma<strong>in</strong> publication produced by theEuro-Indicators team is the monthly ‘<strong>Eurostat</strong>istics’.It presents a synthetic pictureof the economic situation together <strong>with</strong>detailed statistical analysis of the latesteconomic events for the euro area, EUand the Member States. The current issueof ‘<strong>Eurostat</strong>istics’ is accessible from theEuro-Indicators/PEEIs home page as anessential product. Past issues are accessiblefrom the ‘Publications’ tab <strong>with</strong><strong>in</strong>the Euro-Indicators/PEEIs ‘special topic’.Moreover, under the same tab users canf<strong>in</strong>d a collection of Euro-Indicators selectedread<strong>in</strong>gs and work<strong>in</strong>g papers, conta<strong>in</strong><strong>in</strong>gboth methodological and empiricalstudies on statistical improvementsand analyses of <strong>Europe</strong>an data.536 EUROPE IN FIGURES — <strong>Eurostat</strong> <strong>yearbook</strong> <strong>2009</strong>
L<strong>in</strong>k<strong>in</strong>g statistics to <strong>Europe</strong>an policies 16Other products and servicesThe Euro-Indicators/PEEIs ‘special topic’also provides users <strong>with</strong> access to the <strong>Europe</strong>anrelease calendar for <strong>in</strong>fra-annualstatistics, which is updated on a weeklybasis, as well as access to related pressreleases – both of these are found <strong>with</strong><strong>in</strong>the tab entitled ‘news releases’. In addition,a monthly onl<strong>in</strong>e newsletter is accessiblefrom the ‘Publications’ tab. Thenewsletter conta<strong>in</strong>s short articles, newsfrom the Member States and <strong>Eurostat</strong>,announcements, useful l<strong>in</strong>ks, etc. Notethat all papers and proceed<strong>in</strong>gs presented<strong>in</strong> conferences <strong>in</strong> relation to Euro-Indicatorsare also available on the Euro-Indicators/PEEIs‘special topic’ under thetab for methodology by select<strong>in</strong>g the f<strong>in</strong>alpo<strong>in</strong>t concern<strong>in</strong>g ‘<strong>Eurostat</strong> sem<strong>in</strong>ars andconferences’.Planned improvementsEuro-Indicators/PEEIs is constantlyevolv<strong>in</strong>g to meet user needs. The ma<strong>in</strong>improvements for <strong>2009</strong> will concern theimprovement of the new Euro-Indicators/PEEIshomepage and the methodologicalpages. Concern<strong>in</strong>g the new Euro-Indicators/PEEIs page, new features andfacilities will be added and the list of <strong>in</strong>dicatorsupdated. A new set of methodologicalpages related to key topics, suchas flash estimates, back-recalculation,<strong>in</strong>terpolation and extrapolation, seasonaladjustment, bus<strong>in</strong>ess-cycle analysis, andthe construction of co<strong>in</strong>cident and lead<strong>in</strong>g<strong>in</strong>dicators will be progressively implemented<strong>with</strong><strong>in</strong> the ‘Methodology’ tab.These pages will cover methodologicalpapers, onl<strong>in</strong>e bibliographies, softwareand rout<strong>in</strong>es, l<strong>in</strong>ks to specialised sitesand, whenever possible, new <strong>in</strong>dicatorsor quantitative analyses (documented <strong>in</strong>SDDS format) produced on the basis ofadvanced statistical techniques.Structural <strong>in</strong>dicatorsAt the Lisbon <strong>Europe</strong>an Council <strong>in</strong> thespr<strong>in</strong>g of 2000, the EU set itself the follow<strong>in</strong>gstrategic goal for the next decade:‘to become the most competitive and dynamicknowledge-based economy <strong>in</strong> theworld, capable of susta<strong>in</strong>able economicgrowth <strong>with</strong> more and better jobs andgreater social cohesion’.The Council recognised the need to regularlydiscuss and assess progress made <strong>in</strong>achiev<strong>in</strong>g this goal on the basis of a commonlyagreed set of structural <strong>in</strong>dicatorsand to this end, <strong>in</strong>vited the <strong>Europe</strong>anCommission to draw up an annual spr<strong>in</strong>greport on progress be<strong>in</strong>g made. This reportwas to be based on the evolution ofstructural <strong>in</strong>dicators <strong>in</strong> the follow<strong>in</strong>gareas:• general economic background,• employment,• <strong>in</strong>novation and research,• economic reform,• social cohesion,• environment (s<strong>in</strong>ce 2002).For the first time, <strong>in</strong> 2004, the <strong>Europe</strong>anCommission presented a shortlist of 14structural <strong>in</strong>dicators which were <strong>in</strong>cluded<strong>in</strong> the statistical annex to its spr<strong>in</strong>g reportto the <strong>Europe</strong>an Council. This shortlistwas agreed <strong>with</strong> the Council; its conciselayout makes it easier to present policymessages and the Member States’ positions<strong>with</strong> regard to the key Lisbon targets.The same shortlist <strong>in</strong>dicators werepresented <strong>in</strong> the annexes of subsequentannual progress reports to the <strong>Europe</strong>anCouncil.EUROPE IN FIGURES — <strong>Eurostat</strong> <strong>yearbook</strong> <strong>2009</strong>537
16 L<strong>in</strong>k<strong>in</strong>g statistics to <strong>Europe</strong>an policiesShortlist of structural <strong>in</strong>dicatorsGeneral economic background• GDP per capita <strong>in</strong> PPS• Labour productivityEmployment• Employment rate• Employment rate of older workersInnovation and research• Youth educational atta<strong>in</strong>ment level bygender• Gross domestic expenditure on R & Drelative to GDPEconomic reform• Comparative price levels• Bus<strong>in</strong>ess <strong>in</strong>vestmentSocial cohesion• At risk-of-poverty rate after socialtransfers• Long-term unemployment rate• Dispersion of regional employmentratesEnvironment• Greenhouse gas emissions• Energy <strong>in</strong>tensity of the economy• Volume of freight transport relativeto GDPThe Lisbon strategy has entered a newphase s<strong>in</strong>ce the spr<strong>in</strong>g of 2005, <strong>with</strong> thespotlight on deliver<strong>in</strong>g results, focus<strong>in</strong>gon growth and jobs. By submitt<strong>in</strong>gnational reform programmes, MemberStates have accepted a new responsibility,sett<strong>in</strong>g out detailed commitments for action.At the same time, Community programmesspecify what has to be done atan EU level. National reform programmesprovide the basis for the reform agenda,prioritis<strong>in</strong>g growth and employment.Time-series are presented for the EU-27,the euro area, the Member States, thecandidate countries, the EFTA countries,Japan and the United States (subject todata availability).More <strong>in</strong>formation regard<strong>in</strong>g structural<strong>in</strong>dicators may be found on <strong>Eurostat</strong>’swebsite at: http://ec.europa.eu/eurostat/structural<strong>in</strong>dicators. Alternatively, for further<strong>in</strong>formation, contact <strong>Eurostat</strong>’s structural<strong>in</strong>dicators co-ord<strong>in</strong>ation team, at:estat-structural<strong>in</strong>dicators@ec.europa.eu.Susta<strong>in</strong>able development<strong>in</strong>dicatorsThe <strong>Europe</strong>an Union’s Susta<strong>in</strong>able DevelopmentStrategy (SDS), adopted by the<strong>Europe</strong>an Council <strong>in</strong> Gothenburg <strong>in</strong> June2001, and renewed <strong>in</strong> June 2006, aims tocont<strong>in</strong>uously improve quality of life, bothfor current and for future generations,538 EUROPE IN FIGURES — <strong>Eurostat</strong> <strong>yearbook</strong> <strong>2009</strong>
L<strong>in</strong>k<strong>in</strong>g statistics to <strong>Europe</strong>an policies 16through reconcil<strong>in</strong>g economic development,social cohesion and protection ofthe environment. A set of susta<strong>in</strong>able development<strong>in</strong>dicators (SDI) has been developedto monitor progress <strong>in</strong> the implementationof the strategy. The <strong>in</strong>dicatorsare organised under ten different themesthat reflect different political priorities:socio-economic development, susta<strong>in</strong>ableconsumption and production, social<strong>in</strong>clusion, demographic changes, publichealth, climate change and energy, susta<strong>in</strong>abletransport, natural resources,global partnership and good governance.Each theme is further divided <strong>in</strong>to subthemesto organise the set of <strong>in</strong>dicators<strong>in</strong> a way that reflects the operationalobjectives and actions of the susta<strong>in</strong>abledevelopment strategy. In order to facilitatecommunication, the set of <strong>in</strong>dicatorshas been built as a three-level pyramid.This dist<strong>in</strong>ction between the three levelsof <strong>in</strong>dicators reflects the structure of therenewed strategy (overall lead objectives,operational priority objectives, actions/explanatory variables) and also respondsto different k<strong>in</strong>ds of user needs, <strong>with</strong> theheadl<strong>in</strong>e <strong>in</strong>dicators hav<strong>in</strong>g the highestcommunication value, as described <strong>in</strong> thetable below.The three-levels are complemented <strong>with</strong>contextual <strong>in</strong>dicators, which do not monitordirectly the strategy’s objectives, butprovide valuable background <strong>in</strong>formationfor analysis. The SDI data set also describes<strong>in</strong>dicators which are not yet fullydeveloped but which will, <strong>in</strong> the future,be necessary to get a more complete pictureof progress, differentiat<strong>in</strong>g between<strong>in</strong>dicators that are expected to becomeavailable <strong>with</strong><strong>in</strong> two years, <strong>with</strong> sufficientquality (‘<strong>in</strong>dicators under development’),and those to be developed <strong>in</strong> the longerterm (‘<strong>in</strong>dicators to be developed’).Table 16.1: Framework for susta<strong>in</strong>able development <strong>in</strong>dicatorsIndicatorlevelHierarchicalframeworkObjectivesLevel 1 Lead objectives Headl<strong>in</strong>e (or level-1) <strong>in</strong>dicators are at the top of the pyramid.They are <strong>in</strong>tended to monitor the ‘overall objectives’ of thestrategy. They are well-known <strong>in</strong>dicators <strong>with</strong> a highcommunication value. They are robust and available for most EUMember States for a period of at least five years.Level 2 SDS priority objectives The second level of the pyramid consists of <strong>in</strong>dicators related tothe operational objectives of the strategy. They are the lead<strong>in</strong>dicators <strong>in</strong> their respective subthemes. They are robust andavailable for most EU Member States for a period of at least threeyears.Level 3 Actions/explanatoryvariablesThe third level consists of <strong>in</strong>dicators related to actions outl<strong>in</strong>ed <strong>in</strong>the strategy or to other issues which are useful to analyseprogress towards the SDS objectives. Breakdowns of level-1 or -2<strong>in</strong>dicators are usually also found at level 3.Contextual<strong>in</strong>dicatorsBackgroundContextual <strong>in</strong>dicators are part of the SDI set, but they either donot monitor directly any of the strategy’s objectives or they arenot policy responsive. Generally they are difficult to <strong>in</strong>terpret <strong>in</strong> anormative way. However, they provide valuable background<strong>in</strong>formation on issues hav<strong>in</strong>g direct relevance for susta<strong>in</strong>abledevelopment policies and are useful for the analysis.EUROPE IN FIGURES — <strong>Eurostat</strong> <strong>yearbook</strong> <strong>2009</strong>539
16 L<strong>in</strong>k<strong>in</strong>g statistics to <strong>Europe</strong>an policiesHeadl<strong>in</strong>e susta<strong>in</strong>able development<strong>in</strong>dicatorsEconomic development• Growth rate of GDP per <strong>in</strong>habitantProduction and consumption patterns• Resource productivityPoverty and social exclusion• At-risk-of-poverty rate after socialtransfers, by genderAge<strong>in</strong>g society• Employment rate of older workersPublic health• Healthy life years and life expectancyat birth, by genderClimate change and energy• Total greenhouse gas emissions• Renewables <strong>in</strong> gross <strong>in</strong>land energyconsumptionTransport• Energy consumption by transportmodeManagement of natural resources• Common bird <strong>in</strong>dex• Fish catches taken from stocks outsidesafe biological limitsGlobal partnership• Official development assistanceMore <strong>in</strong>formation regard<strong>in</strong>g susta<strong>in</strong>abledevelopment <strong>in</strong>dicators may be found onthe <strong>Eurostat</strong> website: (http://ec.europa.eu/eurostat/susta<strong>in</strong>abledevelopment).Alternatively, for further <strong>in</strong>formation,contact <strong>Eurostat</strong>’s susta<strong>in</strong>able development<strong>in</strong>dicators team at: estat-sdi@ec.europa.eu.540 EUROPE IN FIGURES — <strong>Eurostat</strong> <strong>yearbook</strong> <strong>2009</strong>
AnnexesAnnexesNUTS (classification of territorialunits for statistics)<strong>Europe</strong>an Union: NUTS 2regionsBelgiumBE10BE21BE22BE23BE24BE25BE31BE32BE33BE34BE35BulgariaBG31BG32BG33BG34BG41BG42Czech RepublicCZ01CZ02CZ03CZ04CZ05CZ06CZ07CZ08DenmarkDK01DK02DK03DK04DK05Région de Bruxelles-Capitale/Brussels Hoofdstedelijk GewestProv. AntwerpenProv. Limburg (B)Prov. Oost-VlaanderenProv. Vlaams-BrabantProv. West-VlaanderenProv. Brabant WallonProv. Ha<strong>in</strong>autProv. LiègeProv. Luxembourg (B)Prov. NamurSeverozapadenSeveren tsentralenSeveroiztochenYugoiztochenYugozapadenYuzhen tsentralenPrahaStřední ČechyJihozápadSeverozápadSeverovýchodJihovýchodStřední MoravaMoravskoslezskoHovedstadenSjællandSyddanmarkMidtjyllandNordjyllandGermanyDE11 StuttgartDE12 KarlsruheDE13 FreiburgDE14 Tüb<strong>in</strong>genDE21 OberbayernDE22 NiederbayernDE23 OberpfalzDE24 OberfrankenDE25 MittelfrankenDE26 UnterfrankenDE27 SchwabenDE30 Berl<strong>in</strong>DE41 Brandenburg — NordostDE42 Brandenburg — SüdwestDE50 BremenDE60 HamburgDE71 DarmstadtDE72 GießenDE73 KasselDE80 Mecklenburg-VorpommernDE91 BraunschweigDE92 HannoverDE93 LüneburgDE94 Weser-EmsDEA1 DüsseldorfDEA2 KölnDEA3 MünsterDEA4 DetmoldDEA5 ArnsbergDEB1 KoblenzDEB2 TrierDEB3 Rhe<strong>in</strong>hessen-PfalzDEC0 SaarlandDED1 ChemnitzDED2 DresdenDED3 LeipzigDEE0 Sachsen-AnhaltDEF0 Schleswig-Holste<strong>in</strong>DEG0 Thür<strong>in</strong>genEUROPE IN FIGURES — <strong>Eurostat</strong> <strong>yearbook</strong> <strong>2009</strong>541
AnnexesEstoniaFranceEE00IrelandIE01IE02GreeceGR11GR12GR13GR14GR21GR22GR23GR24GR25GR30GR41GR42GR43Spa<strong>in</strong>ES11ES12ES13ES21ES22ES23ES24ES30ES41ES42ES43ES51ES52ES53ES61ES62ES63ES64ES70EestiBorder, Midland and WesternSouthern and EasternAnatoliki Makedonia, ThrakiKentriki MakedoniaDytiki MakedoniaThessaliaIpeirosIonia NisiaDytiki ElladaSterea ElladaPeloponnisosAttikiVoreio AigaioNotio AigaioKritiGaliciaPr<strong>in</strong>cipado de AsturiasCantabriaPaís VascoComunidad Foral de NavarraLa RiojaAragónComunidad de MadridCastilla y LeónCastilla-La ManchaExtremaduraCataluñaComunidad ValencianaIlles BalearsAndalucíaRegión de MurciaCiudad Autónoma de CeutaCiudad Autónoma de MelillaCanariasFR10FR21FR22FR23FR24FR25FR26FR30FR41FR42FR43FR51FR52FR53FR61FR62FR63FR71FR72FR81FR82FR83FR91FR92FR93FR94ItalyITC1ITC2ITC3ITC4ITD1ITD2ITD3ITD4ITD5ITE1ITE2ITE3ITE4ITF1ITF2Île-de-FranceChampagne-ArdennePicardieHaute-NormandieCentreBasse-NormandieBourgogneNord – Pas-de-CalaisLorra<strong>in</strong>eAlsaceFranche-ComtéPays de la LoireBretagnePoitou-CharentesAquita<strong>in</strong>eMidi-PyrénéesLimous<strong>in</strong>Rhône-AlpesAuvergneLanguedoc-RoussillonProvence-Alpes-Côte d’AzurCorseGuadeloupeMart<strong>in</strong>iqueGuyaneRéunionPiemonteValle d’Aosta/Vallée d’AosteLiguriaLombardiaProv<strong>in</strong>cia Autonoma Bolzano/BozenProv<strong>in</strong>cia Autonoma TrentoVenetoFriuli-Venezia GiuliaEmilia-RomagnaToscanaUmbriaMarcheLazioAbruzzoMolise542 EUROPE IN FIGURES — <strong>Eurostat</strong> <strong>yearbook</strong> <strong>2009</strong>
AnnexesITF3 CampaniaITF4 PugliaITF5 BasilicataITF6 CalabriaITG1 SiciliaITG2 SardegnaCyprusCY00 Kypros/KıbrısLatviaLV00 LatvijaLithuaniaLT00 LietuvaLuxembourgLU00 Luxembourg (Grand-Duché)HungaryHU10 Közép-MagyarországHU21 Közép-DunántúlHU22 Nyugat-DunántúlHU23 Dél-DunántúlHU31 Észak-MagyarországHU32 Észak-AlföldHU33 Dél-AlföldMaltaMT00 MaltaNetherlandsNL11 Gron<strong>in</strong>genNL12 Friesland (NL)NL13 DrentheNL21 OverijsselNL22 GelderlandNL23 FlevolandNL31 UtrechtNL32 Noord-HollandNL33 Zuid-HollandNL34 ZeelandNL41 Noord-BrabantNL42 Limburg (NL)AustriaAT11 Burgenland (A)AT12 NiederösterreichAT13 WienAT21 KärntenAT22 SteiermarkAT31 OberösterreichAT32 SalzburgAT33 TirolAT34 VorarlbergPolandPL11 ŁódzkiePL12 MazowieckiePL21 MałopolskiePL22 ŚląskiePL31 LubelskiePL32 PodkarpackiePL33 ŚwiętokrzyskiePL34 PodlaskiePL41 WielkopolskiePL42 ZachodniopomorskiePL43 LubuskiePL51 DolnośląskiePL52 OpolskiePL61 Kujawsko-PomorskiePL62 Warmińsko-MazurskiePL63 PomorskiePortugalPT11 NortePT15 AlgarvePT16 Centro (P)PT17 LisboaPT18 AlentejoPT20 Região Autónoma dos AçoresPT30 Região Autónoma da MadeiraRomaniaRO11 Nord-VestRO12 CentruRO21 Nord-EstRO22 Sud-EstRO31 Sud — MunteniaRO32 Bucureşti — IlfovRO41 Sud-Vest OlteniaRO42 VestEUROPE IN FIGURES — <strong>Eurostat</strong> <strong>yearbook</strong> <strong>2009</strong>543
AnnexesSloveniaSI01 Vzhodna SlovenijaSI02 Zahodna SlovenijaSlovakiaSK01 Bratislavský krajSK02 Západné SlovenskoSK03 Stredné SlovenskoSK04 Východné SlovenskoF<strong>in</strong>landFI13 Itä-SuomiFI18 Etelä-SuomiFI19 Länsi-SuomiFI1A Pohjois-SuomiFI20 ÅlandSwedenSE11 StockholmSE12 Östra MellansverigeSE21 Småland med öarnaSE22 SydsverigeSE23 VästsverigeSE31 Norra MellansverigeSE32 Mellersta NorrlandSE33 Övre NorrlandUnited K<strong>in</strong>gdomUKC1 Tees Valley and DurhamUKC2 Northumberland and Tyne andWearUKD1 CumbriaUKD2 CheshireUKD3 Greater ManchesterUKD4 LancashireUKD5 MerseysideUKE1UKE2UKE3UKE4UKF1UKF2UKF3UKG1UKG2UKG3UKH1UKH2UKH3UKI1UKI2UKJ1UKJ2UKJ3UKJ4UKK1UKK2UKK3UKK4UKL1UKL2UKM2UKM3UKM5UKM6UKN0East Yorkshire and NorthernL<strong>in</strong>colnshireNorth YorkshireSouth YorkshireWest YorkshireDerbyshire andNott<strong>in</strong>ghamshireLeicestershire, Rutland andNorthamptonshireL<strong>in</strong>colnshireHerefordshire, Worcestershireand WarwickshireShropshire and StaffordshireWest MidlandsEast AngliaBedfordshire and HertfordshireEssexInner LondonOuter LondonBerkshire, Buck<strong>in</strong>ghamshireand OxfordshireSurrey, East and West SussexHampshire and Isle of WightKentGloucestershire, Wiltshire andBristol/Bath areaDorset and SomersetCornwall and Isles of ScillyDevonWest Wales and the ValleysEast WalesEastern ScotlandSouth Western ScotlandNorth Eastern ScotlandHighlands and IslandsNorthern Ireland544 EUROPE IN FIGURES — <strong>Eurostat</strong> <strong>yearbook</strong> <strong>2009</strong>
AnnexesCandidate countries:statistical regions at level 2CroatiaHR01HR02HR03Sjeverozapadna HrvatskaSredišnja i Istočna (Panonska)HrvatskaJadranska HrvatskaThe former Yugoslav Republic ofMacedoniaMK00TurkeyTR10TR21TR22TR31TR32TR33TR41TR42TR51TR52TR61TR62TR63TR71TR72TR81TR82TR83TR90TRA1TRA2TRB1TRB2TRC1TRC2TRC3Poranešna jugoslovenskaRepublika MakedonijaİstanbulTekirdağBalıkesirİzmirAydınManisaBursaKocaeliAnkaraKonyaAntalyaAdanaHatayKırıkkaleKayseriZonguldakKastamonuSamsunTrabzonErzurumAğrıMalatyaVanGaziantepŞanlıurfaMard<strong>in</strong>EFTA countries:statistical regions at level 2IcelandIS00ÍslandLiechtenste<strong>in</strong>LI00NorwayNO01NO02NO03NO04NO05NO06NO07SwitzerlandCH01CH02CH03CH04CH05CH06CH07Liechtenste<strong>in</strong>Oslo og AkershusHedmark og OpplandSør-ØstlandetAgder og RogalandVestlandetTrøndelagNord-NorgeRégion lémaniqueEspace MittellandNordwestschweizZürichOstschweizZentralschweizTic<strong>in</strong>oA full list<strong>in</strong>g of the classification is accessibleon the <strong>Eurostat</strong> website (http://ec.europa.eu/eurostat/ramon/nuts/codelist_en.cfm?list=nuts).EUROPE IN FIGURES — <strong>Eurostat</strong> <strong>yearbook</strong> <strong>2009</strong>545
AnnexesNACE Rev. 1.1 (classificationof economic activities <strong>in</strong> the<strong>Europe</strong>an Community)A Agriculture, hunt<strong>in</strong>g and forestryB Fish<strong>in</strong>gC M<strong>in</strong><strong>in</strong>g and quarry<strong>in</strong>gD Manufactur<strong>in</strong>gE Electricity, gas and water supplyF ConstructionG Wholesale and retail trade; repairof motor vehicles, motorcycles andpersonal and household goodsH Hotels and restaurantsI Transport, storage andcommunicationJ F<strong>in</strong>ancial <strong>in</strong>termediationK Real estate, rent<strong>in</strong>g and bus<strong>in</strong>essLactivitiesPublic adm<strong>in</strong>istration and defence;compulsory social securityM EducationN Health and social workO Other community, social andpersonal service activitiesP Activities of householdsQ Extra-territorial organisations andbodiesA full list<strong>in</strong>g of the NACE Rev. 1.1 classificationis accessible on the <strong>Eurostat</strong>website (http://ec.europa.eu/eurostat/ramon/nomenclatures/<strong>in</strong>dex.cfm?TargetUrl=ACT_OTH_BUILD_TREE&StrNom=NACE_1_1&StrLanguageCode=EN).Note that a revised classification (NACERev. 2) is <strong>in</strong> the process of be<strong>in</strong>g implementedand that data based on this classificationis be<strong>in</strong>g collected from referenceyear 2008 onwards. Given that thevast majority of the data presented <strong>in</strong> thispublication for economic activities is foryears prior to 2008, NACE Rev. 1.1 hasbeen used systematically for all sources.SITC Rev. 4 (standard<strong>in</strong>ternational trade classification)0 Food and live animals1 Beverages and tobacco2 Crude materials, <strong>in</strong>edible, exceptfuels3 M<strong>in</strong>eral fuels, lubricants and relatedmaterials4 Animal and vegetable oils, fats andwaxes5 Chemicals and related products,n.e.s.6 Manufactured goods classified chieflyby material7 Mach<strong>in</strong>ery and transport equipment8 Miscellaneous manufactured articles9 Commodities and transactions notclassified elsewhere <strong>in</strong> the SITCA full list<strong>in</strong>g of the classification is accessibleon the UN website (http://unstats.un.org/unsd/trade/sitcrev4.htm).546 EUROPE IN FIGURES — <strong>Eurostat</strong> <strong>yearbook</strong> <strong>2009</strong>
AnnexesISCED (<strong>in</strong>ternational standardclassification of education)The classification comprises 25 fields ofeducation (at two-digit level) which canbe further ref<strong>in</strong>ed <strong>in</strong>to three-digit level.For the purpose of this publication onlythe follow<strong>in</strong>g n<strong>in</strong>e broad groups (at onedigitlevel) are dist<strong>in</strong>guished, exceptfor the fields dealt <strong>with</strong> by the Spotlightchapter (where more <strong>in</strong>formation is presentedfor some two-digit codes <strong>in</strong> relationto science and to eng<strong>in</strong>eer<strong>in</strong>g, manufactur<strong>in</strong>gand construction):0 General programmes1 Education2 Humanities and arts3 Social sciences, bus<strong>in</strong>ess and law4 Science42 Life sciences44 Physical sciences46 Mathematics and statistics48 Comput<strong>in</strong>g5 Eng<strong>in</strong>eer<strong>in</strong>g, manufactur<strong>in</strong>g andconstruction52 Eng<strong>in</strong>eer<strong>in</strong>g and eng<strong>in</strong>eer<strong>in</strong>g trades6 Agriculture7 Health and welfare8 ServicesEmpirically, ISCED assumes that severalcriteria exist which can help allocateeducation programmes to levels of education.The follow<strong>in</strong>g ISCED levels can bedist<strong>in</strong>guished:0 Pre-primary education1 Primary education2 Lower secondary education3 Upper secondary education4 Post-secondary non-tertiaryeducation5 Tertiary education (first stage)6 Tertiary education (second stage)A full list<strong>in</strong>g of the classification andmore details are accessible on theUNESCO website (http://www.uis.unesco.org/TEMPLATE/pdf/isced/ISCED_A.pdf).Statistical symbols,abbreviations and acronymsStatistical symbolsStatistical data are often accompanied byadditional <strong>in</strong>formation <strong>in</strong> form of statisticalsymbols (also called ‘flags’) to <strong>in</strong>dicatemiss<strong>in</strong>g <strong>in</strong>formation or some othermeta-data. In this <strong>yearbook</strong>, the use ofstatistical symbols has been restricted toa m<strong>in</strong>imum. The follow<strong>in</strong>g symbols are<strong>in</strong>cluded where necessary:Italic Value is either a forecast,provisional or an estimate andis therefore likely to change: Not available, confidential orunreliable value– Not applicable or zero bydefault0 Less than half the f<strong>in</strong>al digitshown and greater than realzeroBreaks <strong>in</strong> series are <strong>in</strong>dicated <strong>in</strong> thefootnotes provided <strong>with</strong> each table andgraph.In the case of the EU Member States, evenwhen data are not available, these countrieshave been <strong>in</strong>cluded <strong>in</strong> tables andgraphs systematically (<strong>with</strong> appropriatefootnotes for graphs <strong>in</strong>dicat<strong>in</strong>g that dataare not available, while <strong>in</strong> tables use hasbeen made of the colon (:) to <strong>in</strong>dicate thatdata are not available). For non-membercountries outside of the EU, when dataare not available for a particular <strong>in</strong>dicatorthe country has been removed from thetable or graph <strong>in</strong> question.EUROPE IN FIGURES — <strong>Eurostat</strong> <strong>yearbook</strong> <strong>2009</strong>547
AnnexesGeographical aggregatesEUEU-27 (1)EU-25EU-15<strong>Europe</strong>an Union<strong>Europe</strong>an Union of27 Member States from1 January 2007 (BE, BG, CZ,DK, DE, EE, IE, EL, ES, FR,IT, CY, LV, LT, LU, HU, MT,NL, AT, PL, PT, RO, SI, SK,FI, SE, UK)<strong>Europe</strong>an Union of25 Member States from1 May 2004 to 31 December2006 (BE, CZ, DK, DE, EE,IE, EL, ES, FR, IT, CY, LV,LT, LU, HU, MT, NL, AT,PL, PT, SI, SK, FI, SE, UK)<strong>Europe</strong>an Union of15 Member States from1 January 1995 to 30 April2004 (BE, DK, DE, IE, EL,ES, FR, IT, LU, NL, AT, PT,FI, SE, UK)Euro area (2) At the time of writ<strong>in</strong>g theeuro area is composed of BE,DE, IE, EL, ES, FR, IT, CY,LU, MT, NL, AT, PT, SI, FI.The euro area was <strong>in</strong>itiallycomposed of 11 MemberStates (BE, DE, IE, ES, FR,IT, LU, NL, AT, PT, FI) – asof 1 January 2001 Greecejo<strong>in</strong>ed; as of 1 January 2007Slovenia jo<strong>in</strong>ed; and as of1 January 2008 Cyprus andMalta jo<strong>in</strong>edEA-15 Euro area of BE, DE, IE, EL,ES, FR, IT, CY, LU, MT, NL,AT, PT, SI, FIEA-13 Euro area of BE, DE, IE, EL,ES, FR, IT, LU, NL, AT, PT,SI, FIEA-12 Euro area of BE, DE, IE, EL,ES, FR, IT, LU, NL, AT, PT,FIEA-11 Euro area of BE, DE, IE, ES,FR, IT, LU, NL, AT, PT, FI(1) Note that EU aggregates are back-calculated when sufficient <strong>in</strong>formation is available – for example, data relat<strong>in</strong>g to theEU-27 aggregate is often presented for periods prior to the accession of Bulgaria and Romania <strong>in</strong> 2007 and the accessionof ten new Member States <strong>in</strong> 2004, as if all 27 Member States had always been members of the EU. A footnote is addedwhen this is not the case and the data for the EU refers to either another aggregate (EU-25 or EU-15) or to a partial totalthat has been created from an <strong>in</strong>complete set of country <strong>in</strong>formation (no data for certa<strong>in</strong> Member States).(2) Note that the euro area aggregate is back-calculated when sufficient <strong>in</strong>formation is available – for example, data relat<strong>in</strong>gto the euro area is often presented for periods prior to the accession of Cyprus and Malta <strong>in</strong> 2008, Slovenia <strong>in</strong> 2007 orGreece <strong>in</strong> 2001, as if all 15 Member States had always been members of the euro area. A footnote is added when this isnot the case and the data for the euro area refers to another aggregate based on either 11 (EA-11), 12 (EA-12) or 13 (EA-13) participat<strong>in</strong>g Member States.548 EUROPE IN FIGURES — <strong>Eurostat</strong> <strong>yearbook</strong> <strong>2009</strong>
AnnexesOther abbreviations and acronymsACP African, Caribbean andPacific countriesBOD biochemical oxygen demandBoP balance of paymentsBPM5 fifth balance of paymentsmanualCAP common agricultural policyCBD convention on biologicaldiversityCC classification of types ofconstructionCFP common fisheries policyCif cost, <strong>in</strong>surance and freightCIP competitiveness and<strong>in</strong>novation frameworkprogrammeCIS5 fifth Community <strong>in</strong>novationsurveyCMO common market organisationCMR carc<strong>in</strong>ogenic, mutagenic andreprotoxic (chemicals)COD 1. chemical oxygen demand2. causes of deathCOFOG classification of the functionsof governmentCOICOP classification of <strong>in</strong>dividualconsumption by purposeCVT cont<strong>in</strong>u<strong>in</strong>g vocationaltra<strong>in</strong><strong>in</strong>gDAC development assistancecommitteeDFLE disability-free life expectancyDMC domestic materialconsumptionDSL digital subscriber l<strong>in</strong>eEAA economic accounts foragricultureEAP environmental actionprogrammeECB <strong>Europe</strong>an Central BankECHO <strong>Europe</strong>an Commission’sHumanitarian Aid OfficeECHP <strong>Europe</strong>an Communityhousehold panelEEA 1. <strong>Europe</strong>an economic area2. <strong>Europe</strong>an EnvironmentAgencyEEAICP <strong>Europe</strong>an economic area<strong>in</strong>dex of consumer pricesEES <strong>Europe</strong>an employmentstrategyEFF <strong>Europe</strong>an fisheries fundEFTA <strong>Europe</strong>an free tradeassociationEICP <strong>Europe</strong>an <strong>in</strong>dex of consumerpricesEITO <strong>Europe</strong>an InformationTechnology ObservatoryEMAS eco-management and auditschemeEMU economic and monetaryunionEPO <strong>Europe</strong>an Patent OfficeEPC <strong>Europe</strong>an patent conventionERA <strong>Europe</strong>an research areaERDF <strong>Europe</strong>an regionaldevelopment fundERM exchange rate mechanismERTMS <strong>Europe</strong>an railway trafficmanagement systemESA <strong>Europe</strong>an system of nationaland regional accounts (ESA95)ESAW <strong>Europe</strong>an statistics onaccidents at workESF <strong>Europe</strong>an social fundEsspros <strong>Europe</strong>an system of <strong>in</strong>tegratedsocial protection statisticsETS external trade statisticsEU <strong>Europe</strong>an UnionEU-SILC Community statistics on<strong>in</strong>come and liv<strong>in</strong>g conditionsEUROPE IN FIGURES — <strong>Eurostat</strong> <strong>yearbook</strong> <strong>2009</strong>549
AnnexesEurofarm a project for standardisationof methods for obta<strong>in</strong><strong>in</strong>gagricultural statistics;provides an overview offarm structure, agriculturalhold<strong>in</strong>gs, w<strong>in</strong>e grow<strong>in</strong>g andorchard fruit trees.<strong>Eurostat</strong> the statistical office of the<strong>Europe</strong>an CommunitiesFAO Food and AgricultureOrganisation (UN)Fob free on boardFDI foreign direct <strong>in</strong>vestmentFP7 seventh frameworkprogrammeFSSGATSfarm structure surveyGeneral Agreement on Trade<strong>in</strong> ServicesGBAORD government budgetappropriation or outlays onR & DGDPGERDGHGGNIGUFGWPHBSHICPHRSTICTILOIMFIPAIPCISCEDgross domestic productgross domestic expenditureon R & Dgreenhouse gasgross national <strong>in</strong>comegeneral university fundsglobal warm<strong>in</strong>g potentialhousehold budget surveyharmonised <strong>in</strong>dex ofconsumer priceshuman resources <strong>in</strong> scienceand technology<strong>in</strong>formation andcommunication technologyInternational LabourOrganisationInternational Monetary Fund<strong>in</strong>strument for pre-accession<strong>in</strong>ternational patentclassification<strong>in</strong>ternational standardclassification of educationISHMT <strong>in</strong>ternational shortlist forhospital morbidity tabulationIT <strong>in</strong>formation technologyJVR job vacancy rateKIS knowledge-<strong>in</strong>tensive servicesLDCs least developed countriesLFS labour force surveyLLP lifelong learn<strong>in</strong>g programmeLMP labour market policyMUICP monetary union <strong>in</strong>dex ofconsumer pricesNACE statistical classification ofeconomic activities <strong>with</strong><strong>in</strong> the<strong>Europe</strong>an CommunityNAFTA North American free tradeagreement (CA, MX, US)n.e.c. not elsewhere classifiedn.e.s. not elsewhere specifiedNGO non-governmentalorganisationNPISH non-profit <strong>in</strong>stitutions serv<strong>in</strong>ghouseholdsNUTS classification/nomenclature ofterritorial units for statistics(<strong>Eurostat</strong>) (NUTS 1, 2, etc.)ODA overseas developmentassistanceOE<strong>CD</strong> Organisation for EconomicCooperation andDevelopmentOPEC Organisation of PetroleumExport<strong>in</strong>g CountriesPCT Patent co-operation treatyPECBMS Pan-<strong>Europe</strong>an common birdmonitor<strong>in</strong>g schemePEEI pr<strong>in</strong>cipal <strong>Europe</strong>an economic<strong>in</strong>dicatorPES public employment serviceR & D research and developmentREACH (<strong>Europe</strong>an Regulation onthe) registration, evaluation,authorisation and restrictionof chemicals550 EUROPE IN FIGURES — <strong>Eurostat</strong> <strong>yearbook</strong> <strong>2009</strong>
AnnexesRONRPPS & TSBSSEPARSESARSGPSHASIISITCSMESNASTSUNUNCATUNECEresearch octane numberregional protectionprogrammescience and technologystructural bus<strong>in</strong>ess statisticss<strong>in</strong>gle euro payments areas<strong>in</strong>gle <strong>Europe</strong>an sky ATMresearchstability and growth pactsystem of health accountssummary <strong>in</strong>novation <strong>in</strong>dexstandard <strong>in</strong>ternational tradeclassificationsmall and medium-sizedenterprisesystem of national accounts(UN)short-term (bus<strong>in</strong>ess)statisticsUnited NationsUnited Nations conventionaga<strong>in</strong>st torture and otherforms of cruel or <strong>in</strong>humantreatmentUnited Nations economiccommission for <strong>Europe</strong>UNESCO United Nations educational,scientific and culturalorganisationUNFCCC United Nations frameworkconvention on climate changeUNHCR United Nations HighCommissioner for refugeesUOE United Nations/OE<strong>CD</strong>/<strong>Eurostat</strong>USPTO United States patent andtrademark officeUWWTP urban wastewater treatmentVATVETWHOWTOplantvalue added taxvocational education andtra<strong>in</strong><strong>in</strong>gWorld Health OrganisationWorld Trade OrganisationUnits of measurement% percent(age)AWU annual work unitBMI body mass <strong>in</strong>dexCHF Swiss francEUR euroFTE full-time equivalentGT gross tonnageGWh gigawatt-hourha hectare (1 ha = 10 000 squaremetres)HC head countHLY healthy life yearsJPY Japanese yenkbit/s kilobit per secondkg kilogramkgoe kilogram of oil equivalentkm kilometrekm 2 square kilometrekW kilowattkWh kilowatt hourLSU livestock unitm metrem3 cubic metreMWh megawatt-hourp-km passenger-kilometrePPP purchas<strong>in</strong>g power parityPPS purchas<strong>in</strong>g power standardSDR standard death ratet tonnet-km tonne-kilometretoe tonne of oil equivalentUAA utilised agricultural areaUSD United States dollarEUROPE IN FIGURES — <strong>Eurostat</strong> <strong>yearbook</strong> <strong>2009</strong>551
AnnexesSubject <strong>in</strong>dexAAccidents 222, 224, 226, 228-231, 401-402, 404, 407, 415Accommodation 253, 255, 326-329, 335,497-498Age 133-144, 149-151, 158-159, 169-170,178-181, 198-199, 202, 206-211, 213-216,222-223, 235-242, 243, 245, 248, 254-258,267-268, 271-274, 280, 283-284, 329-330,336, 477, 497, 499, 502-505, 521, 526, 529,531Agricultural area 339-340, 355, 357, 521Agricultural hold<strong>in</strong>gs 334-337, 339, 355,550Agricultural labour force 336Agricultural output, price <strong>in</strong>dices and<strong>in</strong>come 341Agricultural production 335, 341, 344,347, 349-350, 353, 355Agricultural products 341-342, 347Agriculture and the environment 354AIDS 129, 223-224, 226Air 321-323, 354, 358, 375, 395, 397-398,401-402, 406, 409-411, 413, 415, 417, 419-426, 434, 442, 462-463, 469, 477Airports 402, 405, 410Allowable catch (fisheries) 364Amsterdam Treaty 233, 265Annual work unit (AWU) 336, 338, 341,551Aquaculture 364-366, 369Arable land 335-336, 339-340Assets 66, 68-71, 84-85, 111-112, 116-120,293Asylum 134, 162-166, 171-173At-risk-of-poverty 235-241, 538, 540Average personnel costs 296, 299, 302BBalance of payments 111, 116-117, 372,375-376, 384, 535Bed places 326-328Biodiversity 325, 334, 415, 445-447Biomass 422, 441, 450-454, 458-459, 463,467Biotechnology 475Births 127, 134, 145, 149-153, 222-225,298Body mass <strong>in</strong>dex (BMI) 209-210Broadband 496-499, 501, 503, 508, 511Build<strong>in</strong>g 69, 85, 309, 318, 335, 396, 462Buses 397, 399-400Bus<strong>in</strong>ess demography 298Bus<strong>in</strong>ess economy 56, 61, 99, 103, 294-295, 298-306, 319Bus<strong>in</strong>ess enterprise 33-39, 476, 480-481,487, 489-490CCancer 209, 217, 220-227Carbon emissions 470Cars 315, 397, 399-400, 417Causes of death 159, 222-226, 549Central bank 93-96, 286Cereals 345, 347-351Children 99, 128, 134, 137, 149-151, 154-155, 164, 178-179, 186-187, 209-210, 222,235, 237, 240-241, 245, 251, 255,258, 266Citizenship 134, 163-165, 171, 173, 175,178, 189Civil eng<strong>in</strong>eer<strong>in</strong>g 309, 318Climate change 415-420, 423, 426, 445,449, 539-540Coal-fired power stations 459Common agricultural policy (CAP) 333,341, 354Common fisheries policy (CFP) 364Communications 54, 110, 247, 249, 383Compensation of employees 67, 69, 72,80-81, 84, 111Competitiveness 21-22, 56, 67, 69, 104-106, 116, 189-190, 196, 229, 293-294, 307,319, 333-334, 358, 364, 395, 440, 442, 449,470, 475, 491, 495, 517-518Computer-based learn<strong>in</strong>g 197Computers 311-313, 477, 497Construction 22, 38, 40, 65, 68, 71, 77-78, 111, 191-195, 230, 295, 297-303, 307,309-313, 318-319, 376, 383, 426, 435, 438,482, 498Consumption 66-71, 78, 84, 105, 107,109-110, 233, 243-251, 309, 348, 352, 375,395, 433, 441-443, 451552 EUROPE IN FIGURES — <strong>Eurostat</strong> <strong>yearbook</strong> <strong>2009</strong>
AnnexesConvergence (criteria) 85Current account 111-115, 372, 376DDeath(s) 134, 145, 158, 209, 222-223, 227-228, 230, 402, 422Debt 66, 83-86, 88-89, 92, 254Demography 298, 306, 519Dependency 133, 135-137, 142-143, 450-452, 457-458, 462, 521, 526Development aid 121Diesel 315, 423, 464, 471, 473Direct <strong>in</strong>vestment 116,-117, 122Disability 158-159, 206-208, 210-211,254-258, 549Discharges 216-218, 220-221Diseases 158, 209, 216-217, 220-224, 226-227, 229-230, 423Disposable <strong>in</strong>come 70, 72, 81-82, 234-236, 527Distributive trades 297-299, 303, 408, 498EEarly school leavers 176, 180-181, 185Earn<strong>in</strong>gs 98-102, 255EC Treaty 13, 97, 158, 196, 294, 319E-commerce 498, 500, 508Economic and monetary union 65, 92,533-534, 549Economy 12, 44, 56, 58, 61, 65-124, 159,177, 189, 207, 230, 234, 266, 294-295, 298-306, 319-320, 333- 334, 372, 395-396, 427,440-441, 449, 463-464, 469, 476, 486-487,491, 495, 518, 534, 537-538Educational expenditure 176, 201Electricity 38, 53, 55, 65, 107, 110, 244-245, 247, 249, 252, 299, 303, 311-313, 318,449- 451, 458-463, 467, 470-472Emigration 145-146, 164-165Employees 23, 29, 44, 46, 56, 61-62, 84,98-103, 198, 200, 229, 255-256, 267, 269,277, 297, 307, 402, 407, 498Employment 22, 35, 42, 57, 60-62, 66-70,85, 97-99, 121, 127, 133-134, 149, 158,162, 177, 186, 196, 215, 229, 233, 243, 250,265-280, 285, 288-291, 293, 296, 298-299,303, 305, 309-311, 320-321, 325, 336, 372,475, 477, 479, 483, 485, 495, 497, 517-518,528-531, 537-540Energy 15, 22, 32, 49-50, 209, 252, 307,309-310, 318, 335, 395-396, 412-413,417-418, 421-422, 424, 426, 428, 435, 441,449-473, 475, 518, 538-540Energy consumption 396, 417, 451, 462-463, 466-469, 540Energy <strong>in</strong>tensity 463-464, 469, 538Environment 12-13, 15, 21-22, 32, 85,186, 325-326, 333-334, 354-355, 357-358,408, 415-447, 475, 517-519, 534, 537-538Equivalised <strong>in</strong>come 235Euro-Indicators 15, 18, 535-537<strong>Europe</strong>an Central Bank (ECB) 68, 92,104, 286, 308, 534<strong>Europe</strong>an employment strategy (EES)196, 265, 278, 517<strong>Europe</strong>an Environment Agency (EAA)416-417, 419-421, 423, 426<strong>Europe</strong>an Fisheries Fund (EFF) 364<strong>Europe</strong>an Patent Office (EPO) 492-494<strong>Europe</strong>an Statistical System (ESS) 13,16-17, 518<strong>Europe</strong>an system of <strong>in</strong>tegrated socialprotection statistics (Esspros) 254EU-SILC (Community statistics on<strong>in</strong>come and liv<strong>in</strong>g conditions) 207, 211,234, 252-253, 549Exchange rate(s) 67, 92-95, 104-105Expenditure 23, 30, 32-34, 44, 48, 66-72,78-79, 83-84, 86-90, 98, 105, 133-134, 137,176, 201-203, 207, 233, 235, 243-259, 288-289, 291, 296, 325, 331, 486-490, 498, 500,509, 511-512, 514, 538Exports 67-69, 111-112, 374, 377, 384-393,441, 451-452FFarm labour force 336, 338Farm structure and land use 334Fatal accidents at work 229-230Fertility 127-128, 133-135, 145, 149-150,154-155, 223, 236F<strong>in</strong>ancial services 77, 78, 383Fisheries 364-365, 367Foreign direct <strong>in</strong>vestment (FDI) 116-120,122EUROPE IN FIGURES — <strong>Eurostat</strong> <strong>yearbook</strong> <strong>2009</strong>553
AnnexesForestry 38, 295, 333-369, 417, 546Fossil fuels 422, 441, 470Freight 376, 384, 396-399, 408-413, 538GGas 38, 65, 107, 110, 244-245, 247, 249,252, 299-303, 311-313, 318, 415-421, 442,449-459, 462, 467, 470-473, 538, 540, 546,550Gender pay gap 97, 99, 102General government 68-69, 79, 83-90,111, 255-256, 260Global warm<strong>in</strong>g 417, 442Globalisation 71, 97, 116, 278, 307, 396Good governance 233, 261, 539Goods 44, 49-51, 65, 67-69, 71, 79, 85,104-105, 107, 110-112, 114, 116, 122,243-244, 247, 249, 255, 296, 307, 309-310,315, 319-320, 324, 345, 372-377, 384-386,395-397, 400-402, 408-410, 413, 441, 462,477, 497-500, 504Government 12, 30-39, 44, 66, 68-69,79, 83-90, 93, 111, 201-202, 252, 255-256,260, 280, 289, 376, 417, 445, 478, 480-481,487, 489-490, 496-507Graduates 23, 27-28, 176, 194-195, 478,484Greenhouse gas emissions 415-421, 449,458, 538, 540Gross domestic expenditure on R & D(GERD) 487-490, 538Gross domestic product (GDP) 23, 25, 30,32-33, 66-75, 78-81, 83, 85-92, 105, 112,114, 117-118, 134, 202-203, 234, 243244,246, 255-257, 259, 289, 291, 326-327, 331,372-374, 400, 409-411, 441-443, 463, 469,486-500, 509, 512, 514, 518-523, 538Gross fixed capital formation (GFCF) 79Gross <strong>in</strong>land consumption 451-452, 457,462-463, 465Gross operat<strong>in</strong>g rate 307, 313, 319, 322Gross operat<strong>in</strong>g surplus 67, 69, 72, 80-81,296, 307HHazardous waste 415, 435Health 22, 24, 32, 49-50, 53, 71, 86, 89,110, 121, 128, 133-134, 137, 158-159, 191-192, 194-195, 205-231, 234, 236, 247, 249,254-256, 258, 278, 295, 326, 333, 355, 376,415, 422-423, 427, 440, 445-446, 475, 477,482, 519, 539, 540, 546-547Healthy life years 159, 206-208, 540Higher education 33-39, 44, 49, 176-177,189-190, 201, 478, 480-481, 487, 489High-technology 35, 42, 53-54, 477, 479,485, 492-494Holiday(s) 267, 308, 329Hospital beds 215-216, 218-219Hourly labour costs 98, 103Hours worked 68, 98, 267Household consumption expenditure243-245, 249Household(s) 65, 68, 70-72, 79, 82, 85, 93,96, 104-105, 109-110, 149, 197, 201-202,234-237, 240-255, 325, 400, 430, 433-435,438, 462-463, 468, 470-472, 496-497,499-501, 546Hous<strong>in</strong>g 94, 104-105, 107, 110, 133-134,149, 233, 244-245, 247, 249, 252-256, 258,376, 519Human resources <strong>in</strong> science and technology(HRST) 35, 40-41, 477, 483Hydropower 451-452, 454, 458-459, 463IImmigration 134, 145-146, 162, 164-166,169-171Imports 67-69, 72, 80-81, 84-85, 87, 90,111-112, 121, 372, 374, 377, 384-390, 392-393, 441, 450-452, 455-457Inactive persons 267, 288Income 66-72, 80-82, 84-85, 87, 90, 99,111-112, 114, 122-123, 149, 189, 201, 207,209, 211, 233-238, 243-245, 249, 252, 254-255, 289, 296, 341-342, 346, 372, 517-519,527Income distribution 69, 234-235, 237Individuals regularly us<strong>in</strong>g the Internet503Industry 15, 22, 45, 47, 49, 62-63, 68, 71,77-78, 98, 100-101, 103, 230, 245, 250,293-331, 334, 343-344 424, 427, 438, 440,442, 462-463, 468, 472, 487, 495, 535Infant mortality 206, 222-225Informal learn<strong>in</strong>g 197554 EUROPE IN FIGURES — <strong>Eurostat</strong> <strong>yearbook</strong> <strong>2009</strong>
AnnexesInformation and communication technology(ICT) 22, 71, 175, 178, 495-496,498-500Information technology (IT) 52, 476,498, 500, 509, 514Inland freight transport 397-399, 409-412Inland passenger transport 397-398, 400-401, 403Innovation 15, 21-63, 293, 307, 440, 475,486, 491, 495-496, 518, 537-538Integrated Services Digital Network(ISDN) 497, 499, 501Intellectual property rights 53, 307, 491Interest rates 92-96Intermediate consumption 68, 84, 296,341International Monetary Fund (IMF) 375,536International Standard Classification ofEducation (ISCED) 24-28, 179-180, 182,184, 186-188, 190, 195, 273, 284, 478, 482,547International trade 121, 375-376, 385,408, 546Internet 197, 495-505, 507-508, 510-511Investment 22-23, 30, 67, 69-71, 79, 83,92, 105, 116-122, 175, 196, 201, 234, 265,293, 296, 299, 372, 486, 491, 495, 497, 517,538Irrigable area 337, 354-355, 357JJob rotation and job shar<strong>in</strong>g 289, 291Jobless households 235, 237, 241-242KKnowledge-<strong>in</strong>tensive services (KIS) 35,477, 479Kyoto 395, 416, 418-420, 442LLabour costs 49-50, 97-100, 103, 106, 296Labour market 97, 133, 149, 162, 179, 190,254-255, 265-291, 478, 518-519, 535Labour productivity 67-68, 70, 76, 297,307, 312, 319, 321, 538Land area 335-336, 339-340, 354, 359, 441Land use 334-335, 339-340, 354, 395-396,417, 446Language learn<strong>in</strong>g 175-178, 186-187Levels of education 175, 177, 179, 190,279, 547Life expectancy 127-128, 133-134, 145,158-161, 206-209, 214, 540Lifelong learn<strong>in</strong>g 23, 133, 175-177, 189,196-199, 266, 278, 518Lisbon 15, 22, 30, 97, 127, 158, 189, 196,205, 207, 254, 265-266, 268, 293, 319, 325,416, 486-487, 491, 533-534, 537-538Livestock 335, 354-355, 357Liv<strong>in</strong>g conditions 207, 211, 233-263MManufactur<strong>in</strong>g 35, 38, 40, 42, 71, 85, 191,195, 294-295, 298-303, 310-314, 318, 426,435, 438, 442, 477, 479, 485, 498, 546-547Mar<strong>in</strong>e 364, 367, 415, 451Marriage 134, 149-151, 153, 156Meat 347-348, 353Migration 128-129, 133-135, 145-146,148-149, 162-171, 285Milk 345, 347-349, 352-353, 355M<strong>in</strong>imum wage 99-101Modal breakdown (transport) 396Monetary policy 92-94, 104, 308, 534Mortality 128-129, 135, 145, 158-159,206-207, 222-225Motorways 396Municipal waste 434-437NNational accounts 3, 5, 66-68, 83, 243-245, 535, 551-552National calls 512Natural gas 311-313, 451, 452, 454, 456-459, 470-471Natural population change 145-148Natural resources 334, 354, 415, 430, 441,445, 450, 463, 539-540Net lend<strong>in</strong>g/net borrow<strong>in</strong>g 83Nights spent <strong>in</strong> hotels and similarEUROPE IN FIGURES — <strong>Eurostat</strong> <strong>yearbook</strong> <strong>2009</strong>555
Annexesestablishments 328Nomenclature of territorial units forstatistics (NUTS) 519Non-profit <strong>in</strong>stitutions serv<strong>in</strong>g households(NPISH) 79Nuclear 311-314, 318, 450-451, 454, 458-459, 463, 475OObesity 209-210Oil 107, 310, 335, 345, 354, 415-416,423-424, 429, 434, 442, 449-459, 463,465-468, 470-471, 473, 546, 551Old age 66, 133, 135-137, 142-143, 176,209, 235-236, 254-256, 258, 521, 526, 529Organic farm<strong>in</strong>g 354, 356Output price <strong>in</strong>dex 309, 316-317, 320Ozone 422-424, 426PPart-time 67, 99, 149, 266-267, 269, 276-277, 288, 298-299, 320Passenger(s) 6, 376, 395-407, 462, 551Patent(s) 5, 7, 23, 44, 52-55, 293, 491-494,549-551Patient(s) 205, 214, 218, 220-221Personnel 5, 7, 35-37, 52, 97-99, 202, 215,296-297, 299, 302, 307, 476-477, 479, 481,500Pesticides 354-356, 415, 418PhD students 478, 482Physicians 215-216, 218Pipel<strong>in</strong>es 397-399, 451Pollution 7, 354, 358, 395-396, 415, 422-424, 426-429, 434, 440-441Population 2, 5, 15, 25, 29, 61, 66-67, 84,98, 105, 127-173, 176-177, 180-181, 186,190-191, 197-199, 202, 206-207, 210-214,222, 224, 229, 235-241, 243, 250, 252-253,260-261, 266-268, 272, 298, 325, 327, 329,359, 402, 410, 423-424, 426-428, 430,432, 446-447, 477, 492, 495, 499, 520-521,524-526, 552Poverty 121, 233-241, 252, 254, 538, 540Power stations 458-459, 462Precipitation 428Pre-primary education 177-180, 182, 547Price convergence 104-107, 110Prices 5, 7, 65-68, 71-75, 77-78, 85, 92,104-107, 244, 309-310, 319, 333, 341-344,449, 458, 463, 470-472, 510-512, 535, 549,550, 552Primary education 180-181, 184, 187, 547Pr<strong>in</strong>cipal <strong>Europe</strong>an economic <strong>in</strong>dicators(PEEIs) 308, 534-535PRODCOM (statistics on the productionof manufactured goods) 441Production 1-4, 7, 9, 13, 66-67, 69, 72,80-81, 84-85, 87, 90, 122, 207, 234, 243-244, 296, 298-299, 307-313, 315-318, 333,335, 341, 344, 347-355, 358-366, 369, 375,384-385, 395, 422, 427-428, 433, 441-443,450-454, 458, 463, 475, 491, 518, 533,539-540, 552Public balance 85-88Public education 202Public expenditure 23, 25, 201-203, 288,291Public health 158, 205, 207, 209-210, 229,539-540Pupils 23, 176-182, 184,186-188, 201Purchases onl<strong>in</strong>e 498, 500Purchas<strong>in</strong>g power parities (PPPs) 67, 105Purchas<strong>in</strong>g power standard (PPS) 256QQualifications 163, 179, 189-190, 197, 280,288, 293, 519RRailway(s) 315, 397-402, 407, 409, 549Raw materials 309, 385, 393, 433, 441, 470Refugees 128, 163, 165-166, 551Regions 2, 5, 7, 12, 22, 71, 104, 121, 128-130, 134, 145, 159, 167-168, 209, 222, 268,271, 278, 325, 335, 367-368, 381-382, 427,517-531, 541, 545, 552-553Renewable energy 335, 417, 449- 452,556 EUROPE IN FIGURES — <strong>Eurostat</strong> <strong>yearbook</strong> <strong>2009</strong>
Annexes454, 458, 461Research and development (R & D) 30,475, 486Researchers 1, 13, 22, 35, 37-39, 162, 475-478, 480-481, 535Resource use (environment) 415, 440Retail trade 297-298, 309, 320-324, 546Retirement 66, 133-134, 159, 166, 235,255-256, 268, 278, 289Road accidents 401-402, 407Road(s) 335, 375, 396-402, 407-410, 412,423, 462-463, 468-469Roundwood 358-361SSafety at work 6, 229Sav<strong>in</strong>gs 66-67, 70, 72, 81-82, 243, 427Sawnwood 358-361School(s) 5, 176-181, 185-187, 197, 201-202, 209, 279, 336Science and technology 2, 5, 7, 15, 22-23,28, 35, 40-41, 176, 178, 191, 475-515,550-551Serious accidents at work 230-231Services 2, 6, 14-15, 21-22, 24, 35, 37-38,42, 44, 49-51, 62-63, 65, 67-69, 71, 77-79,85-86, 89, 91, 98, 100-105, 107, 110-112,114, 116, 121-122, 133, 178, 192, 194-195,197, 201, 205, 207, 214-216, 223, 230, 234,243-245, 247, 249, 250, 255, 279, 285,289, 291, 293-331, 334-335, 372-384, 386,395-396, 400, 429, 438, 440-442, 462,468, 476-477, 479, 482, 485, 495-500, 504,510-512, 518, 535, 537, 547, 550, 552Seventh framework programme (FP7)22, 475, 550Short-term bus<strong>in</strong>ess statistics (STS) 308,319Skills 21, 23, 25, 162, 175, 177, 179, 196-197, 234, 265, 278, 286, 293-294, 307, 476,495-497, 499-500, 503Small and medium-sized enterprises(SMEs) 22, 294, 297, 299, 552Smok<strong>in</strong>g 209-213Social benefits 70, 84-85, 234, 236, 254-256, 258Social cohesion 15, 233, 254, 280, 518,534, 537-538Social contributions 69, 84-85, 87, 90,235, 255-256, 260, 297Social exclusion 233-234, 252, 254-256,258, 540Social protection 4, 6, 86, 89, 134, 236,254-258, 260, 265-266, 278, 534, 549Social transfers 68, 84, 235-237, 240-241,538, 540Solar energy 451, 454Solid fuels 451-452, 454, 463, 467Stability and Growth Pact 83, 551Standard <strong>in</strong>ternational trade classification(SITC) 7, 385, 546, 551Statistical Programme Committee (SPC)13Statistical symbols 7, 9, 11, 547Structural bus<strong>in</strong>ess statistics (SBS) 295,307, 319Structural Funds 134Structural <strong>in</strong>dicators 15, 158, 207, 233,434, 534, 537-538Students 23-26, 162, 164, 177, 180-182,186-187, 189-193, 195, 201-202, 236, 478,482, 535Susta<strong>in</strong>able development 1, 15, 252, 325,364, 416, 433, 445, 533-534, 538-540, 552TTaxes 66-70, 72, 80-81, 84-85, 87, 90, 98-99, 109-111, 235, 244, 296-297, 309-310,319, 341, 471-473Teachers 176-178, 180, 197Telecommunications 7, 35, 65, 321-323,477, 510-515, 518Tertiary education 5, 24, 26, 40, 179-182,189-195, 201-202, 268, 280, 284, 477, 547Tourism 4, 6, 325-329, 331, 333, 553, 553Trade 7, 13, 15, 26-27, 44, 47, 49, 52, 65,68, 71, 77-78, 92, 97, 104, 111, 116, 121,202, 244, 297-303, 309, 319-324, 333, 347,371-393, 396, 408-409, 450-451, 470, 492,494, 498, 535, 546-547, 549-552Tra<strong>in</strong><strong>in</strong>g 5, 21, 23, 29, 85, 97-98, 175-180,189, 196-201, 209, 234, 255, 267-268,278-279, 289-291, 408, 449, 475, 482, 517,EUROPE IN FIGURES — <strong>Eurostat</strong> <strong>yearbook</strong> <strong>2009</strong>557
Annexes549, 551Trans-<strong>Europe</strong>an networks (TENs) 396Transport 2, 4, 6, 15, 35, 47, 53, 65, 68,71, 77-78, 104, 107, 110-111, 133, 201, 230,234, 244, 247, 249, 299, 303, 310-315, 318-323, 326, 335, 347, 375-377, 383-386, 393,395-413, 417-418, 421-423, 426, 449, 462-464, 468-469, 471, 473, 475, 477, 497-498,517-518, 538-540, 546, 552-553Treaty establish<strong>in</strong>g the <strong>Europe</strong>an Community175, 196Treaty of Amsterdam 83, 233, 265Treaty of Rome 333Turnover 51, 57, 61, 295-298, 307, 309,319-320, 323-324, 498, 500, 508UUnemployment 6, 66, 99, 127, 254-256,258, 265-266, 278-284, 288, 521, 530, 538United Nations 122, 128, 130-132, 141,143, 151, 153, 155, 158, 163, 165, 177, 224,358, 375, 385, 416, 445, 551Unleaded petrol 471Upper secondary education 176, 179-181,184, 187, 190, 547Urban Audit 519Urban wastewater treatment 427, 429-430, 432, 551Utilised agricultural area (UAA) 335, 357VValue added 67-68, 71, 77-78, 295-300,303-304, 307, 309-311, 314, 319-322, 342-344, 377, 471, 510, 551Vocational tra<strong>in</strong><strong>in</strong>g 5, 23, 28, 97-98, 175,177, 196-198, 200-201, 255, 549Volume of sales 309, 324WWages 5, 69, 97-100, 103, 243, 267, 299Waste 7, 347, 415, 421, 426-430, 432-439,441, 445, 451, 452, 454, 458, 551Water 321-323, 354, 365, 375, 396-399,408-410, 412, 415, 424, 427-432, 434, 442,451, 463-464, 469, 477, 546, 551W<strong>in</strong>d 417, 450-452, 454, 458-459, 467Women 35, 97, 99, 121, 149-151, 155, 159,164, 181, 190-191, 198, 207-208, 210-211,222-223, 230, 268-269, 280, 288, 476, 478YYouth education 180, 185, 538558 EUROPE IN FIGURES — <strong>Eurostat</strong> <strong>yearbook</strong> <strong>2009</strong>
Selection of <strong>Eurostat</strong> publicationsFor further read<strong>in</strong>g, <strong>Eurostat</strong> offers various types of publications on a wide range of statistical topics.Below you f<strong>in</strong>d some references to some of the most recent <strong>Eurostat</strong> publications. All publicationsare made available <strong>in</strong> PDF format and can be downloaded free of charge from the <strong>Eurostat</strong> websiteat http://ec.europa.eu/eurostat. Paper copies of publications can be ordered via the EU Bookshopat http://bookshop.europa.eu. Both websites allow searches to be made us<strong>in</strong>g the catalogue number(e.g.: KS-HA-08-001-EN-C) and offer guidance on how paper copies can be ordered.Statistical booksThis collection conta<strong>in</strong>s publications which provide <strong>in</strong>-depth analysis, tables, graphs or maps for one ormore statistical doma<strong>in</strong>s.<strong>Europe</strong>an Economic StatisticsThe publication covers key economic <strong>in</strong>dicatorsavailable <strong>with</strong><strong>in</strong> <strong>Eurostat</strong>, <strong>in</strong>clud<strong>in</strong>g: nationalaccounts, government f<strong>in</strong>ances, balance of payments,foreign trade, prices, monetary and f<strong>in</strong>ancialaccounts, and the labour market. In addition,editorial and methodologicalsections provide commentaryon topical issues and onthe data presented.Available language: EnglishKS-30-08-410-EN-C;paper version: EUR 20<strong>Europe</strong>an bus<strong>in</strong>essThis publication gives a comprehensive pictureof the structure, development and characteristicsof <strong>Europe</strong>an bus<strong>in</strong>ess and its different activities:from energy and the extractive <strong>in</strong>dustries to communications,<strong>in</strong>formation services and media. Itdescribes for each activity:production and employment;country specialisationand regional distribution;productivity and profitability;the importance of small andmedium-sized enterprises(SMEs); employment characteristics;external trade, etc.Available language: EnglishKS-BW-07-001-EN-C; paperversion: EUR 25<strong>Eurostat</strong> regional <strong>yearbook</strong> 2008The <strong>Eurostat</strong> regional <strong>yearbook</strong> 2008 offers a wealthof <strong>in</strong>formation on life across <strong>Europe</strong>an regions. Abroad set of regional data are presented on the follow<strong>in</strong>gthemes: population, urban statistics, grossdomestic product, household accounts, structuralbus<strong>in</strong>ess statistics, the labourmarket, sectoral productivity,labour costs, transport,tourism, science, technologyand <strong>in</strong>novation, health andagriculture.Available languages: German,English, FrenchKS-HA-08-001-EN-C;paper version: EUR 30Measur<strong>in</strong>g progress towards amore susta<strong>in</strong>able <strong>Europe</strong>The EU’s susta<strong>in</strong>able development strategy,launched <strong>in</strong> 2001 and renewed <strong>in</strong> June 2006, aimsfor the cont<strong>in</strong>uous improvement <strong>with</strong> respect tothe quality of life for current and future generations.<strong>Eurostat</strong>’s monitor<strong>in</strong>greport, to be publishedevery two years, underp<strong>in</strong>sthe <strong>Europe</strong>an Commission’sprogress report onthe implementation of thisstrategy. It provides an objective,statistical picture ofprogress, based on an EU setof susta<strong>in</strong>able development<strong>in</strong>dicators.Available language: EnglishKS-77-07-115-EN-C; paper version: EUR 35EUROPE IN FIGURES — <strong>Eurostat</strong> <strong>yearbook</strong> <strong>2009</strong>559
Pocketbooks and brochuresPocketbooks aim to give users a set of basic <strong>figures</strong> on a specific topic. Available <strong>in</strong> both PDF and paperversions, all pocketbooks are free of charge. Brochures are also analytical publications that are published<strong>in</strong> a slightly bigger A5 format; they are available only <strong>in</strong> English.Key <strong>figures</strong> on<strong>Europe</strong>Liv<strong>in</strong>gconditions <strong>in</strong><strong>Europe</strong>Food: fromfarm to forkstatisticsTourismstatisticsEU foreigndirect<strong>in</strong>vestmentAgriculturalstatisticsKey <strong>figures</strong>on <strong>Europe</strong>anbus<strong>in</strong>essKS-EI-08-001-EN-CKS-DZ-08-001-EN-CKS-30-08-339-EN-CKS-DS-08-001-EN-CKS-BK-08-001-EN-CKS-ED-08-001-EN-CKS-ET-08-001-EN-CCandidatecountriesScience,technologyand <strong>in</strong>novationEnergy,transport andenvironmentEU economicdataStatisticalportrait 2008:<strong>Europe</strong>an Yearof Interculturaldialogue<strong>Europe</strong>an PriceStatisticsRegions ofthe <strong>Europe</strong>anUnionKS-PF-08-001-EN-C KS-30-08-148-EN-C KS-DK-07-001-EN-C KS-CZ-08-002-EN-C KS-EP-07-001-EN-C KS-70-07-038-EN-C KS-EP-08-001-EN-CNews-oriented publicationsThree collections are dedicated to the rapid release of key data: news releases, Statistics <strong>in</strong> focus andData <strong>in</strong> focus. They are web-based publications that are freely available on the <strong>Eurostat</strong> website.Methodologies and work<strong>in</strong>g papersStatistical manuals, classifications or nomenclatures are published under the collection ‘Methodologiesand work<strong>in</strong>g papers’. Intended for specialists, these publications are also only released through the Internet,they are freely on the <strong>Eurostat</strong> website.More <strong>in</strong>formation on <strong>Eurostat</strong> publications may be found at: http://epp.eurostat.ec.europa.eu/portal/page/portal/publications/collections.560 EUROPE IN FIGURES — <strong>Eurostat</strong> <strong>yearbook</strong> <strong>2009</strong>
<strong>Europe</strong>an Commission<strong>Europe</strong> <strong>in</strong> <strong>figures</strong> – <strong>Eurostat</strong> <strong>yearbook</strong> <strong>2009</strong>Luxembourg: Office for Official Publications of the <strong>Europe</strong>an Communities<strong>2009</strong> — 560 pp. — 17.6 x 25 cmISBN 978-92-79-11625-4ISSN 1681-4789Price (exclud<strong>in</strong>g VAT) <strong>in</strong> Luxembourg: EUR 30
Publications for sale:How to obta<strong>in</strong> EU publications via EU Bookshop (http://bookshop.europa.eu); from your bookseller by quot<strong>in</strong>g the title, publisher and/or ISBN number; by contact<strong>in</strong>g one of our sales agents directly. You can obta<strong>in</strong> their contactdetails on the Internet (http://bookshop.europa.eu) or by send<strong>in</strong>g a faxto +352 2929-42758.Free publications: via EU Bookshop (http://bookshop.europa.eu); at the <strong>Europe</strong>an Commission’s representations or delegations. You can obta<strong>in</strong>their contact details on the Internet (http://ec.europa.eu) or by send<strong>in</strong>g a fax to+352 2929-42758.
KS-<strong>CD</strong>-09-001-EN-C<strong>Europe</strong> <strong>in</strong> <strong>figures</strong><strong>Eurostat</strong> <strong>yearbook</strong> <strong>2009</strong> (<strong>with</strong> <strong>CD</strong>-<strong>ROM</strong>)<strong>Europe</strong> <strong>in</strong> <strong>figures</strong> – <strong>Eurostat</strong> <strong>yearbook</strong> <strong>2009</strong> – presentsa comprehensive selection of statistical dataon <strong>Europe</strong>. Most data cover the period 1997-2007for the <strong>Europe</strong>an Union and some <strong>in</strong>dicators areprovided for other countries such as candidatecountries to the <strong>Europe</strong>an Union, members of EFTA,Japan or the United States (subject to availability).<strong>Europe</strong> <strong>in</strong> <strong>figures</strong> is divided <strong>in</strong>to an <strong>in</strong>troduction,16 ma<strong>in</strong> chapters and a set of annexes. Thema<strong>in</strong> chapters conta<strong>in</strong> data and/or background<strong>in</strong>formation relat<strong>in</strong>g to particular topics, start<strong>in</strong>g<strong>with</strong> a spotlight chapter on creativity and <strong>in</strong>novation– the theme of the <strong>Europe</strong>an year <strong>2009</strong>. With justover 500 statistical tables, graphs and maps, the<strong>yearbook</strong> treats the follow<strong>in</strong>g areas: the economy,population, education, health, liv<strong>in</strong>g conditionsand welfare, the labour market, <strong>in</strong>dustry andservices, agriculture, forestry and fisheries, externaltrade, transport, the environment, energy, scienceand technology and <strong>Europe</strong>’s regions.The paper version of the <strong>yearbook</strong> is accompaniedby a <strong>CD</strong>-<strong>ROM</strong> which conta<strong>in</strong>s the full <strong>yearbook</strong>content <strong>in</strong> PDF format, as well as all tables andgraphs <strong>in</strong> Excel spreadsheet format.The <strong>yearbook</strong> may be viewed as an <strong>in</strong>troductionto <strong>Europe</strong>an statistics and provides guidanceto the vast range of data freely available fromthe <strong>Eurostat</strong> website at:http://ec.europa.eu/eurostatPrice (exclud<strong>in</strong>g VAT) <strong>in</strong> Luxembourg: EUR 30ISBN 978-92-79-11625-49 7 8 9 2 7 9 1 1 6 2 5 4