dto annual report 06.indd - National Transport Authority
dto annual report 06.indd - National Transport Authority
dto annual report 06.indd - National Transport Authority

Create successful ePaper yourself
Turn your PDF publications into a flip-book with our unique Google optimized e-Paper software.
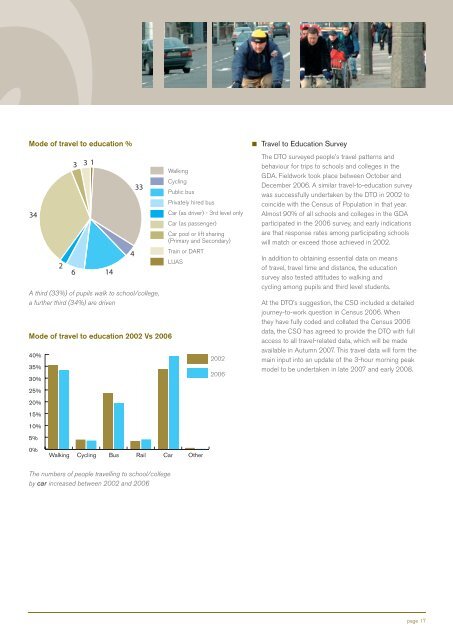
Mode of travel to education % WalkingA third (33%) of pupils walk to school/college,a further third (34%) are drivenMode of travel to education 2002 Vs 2006 CyclingPublic busPrivately hired busCar (as driver) - 3rd level onlyCar (as passenger)Car pool or lift sharing(Primary and Secondary)Train or DARTLUAS20022006< Travel to Education SurveyThe DTO surveyed people’s travel patterns andbehaviour for trips to schools and colleges in theGDA. Fieldwork took place between October andDecember 2006. A similar travel-to-education surveywas successfully undertaken by the DTO in 2002 tocoincide with the Census of Population in that year.Almost 90% of all schools and colleges in the GDAparticipated in the 2006 survey, and early indicationsare that response rates among participating schoolswill match or exceed those achieved in 2002.In addition to obtaining essential data on meansof travel, travel time and distance, the educationsurvey also tested attitudes to walking andcycling among pupils and third level students.At the DTO’s suggestion, the CSO included a detailedjourney-to-work question in Census 2006. Whenthey have fully coded and collated the Census 2006data, the CSO has agreed to provide the DTO with fullaccess to all travel-related data, which will be madeavailable in Autumn 2007. This travel data will form themain input into an update of the 3-hour morning peakmodel to be undertaken in late 2007 and early 2008.The numbers of people travelling to school/collegeby car increased between 2002 and 2006page 17