Cell 3D - Maryland Department of Natural Resources Data
Cell 3D - Maryland Department of Natural Resources Data
Cell 3D - Maryland Department of Natural Resources Data
- No tags were found...

You also want an ePaper? Increase the reach of your titles
YUMPU automatically turns print PDFs into web optimized ePapers that Google loves.
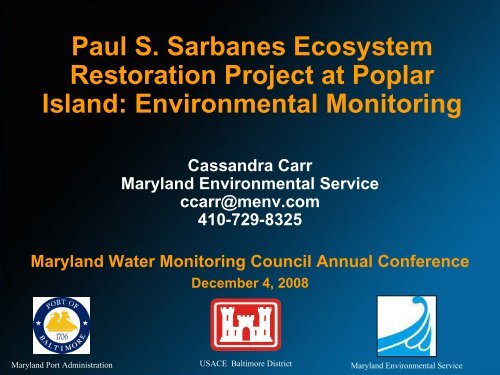
Paul S. Sarbanes EcosystemRestoration Project at PoplarIsland: Environmental MonitoringCassandra Carr<strong>Maryland</strong> Environmental Serviceccarr@menv.com410-729-8325<strong>Maryland</strong> Water Monitoring Council Annual ConferenceDecember 4, 2008<strong>Maryland</strong> Port AdministrationUSACE Baltimore District<strong>Maryland</strong> Environmental Service
Paul S. Sarbanes EcosystemRestoration Project at Poplar Island• Located in the Mid-Chesapeake Bay inTalbot County,<strong>Maryland</strong>• Clean dredgedmaterial from theChesapeake Bayshipping channelsapproaching the Port<strong>of</strong> Baltimore is placedat the site• Over 1,140 acres <strong>of</strong>wetland and uplandhabitat to be restoredat Poplar IslandPoplar Island
Paul S. Sarbanes Ecosystem RestorationProject at Poplar Island• 6 Large Containment <strong>Cell</strong>s: 4 Wetland <strong>Cell</strong>s & 2 Upland <strong>Cell</strong>s• Wetland <strong>Cell</strong>s Temporarily Divided via Interior Dikes
Poplar Island Expansion ProjectNorthernAccess ChannelRockReefsProposed OpenWaterEmbaymentProposedBreakwatersNOB 8-7Wetland<strong>Cell</strong>s• Capacity shortfall fordredged material wasanticipated<strong>Cell</strong>s 2 and 6Dike RaisingNOB 8-10Southwestern SandBorrow Area<strong>Cell</strong> 6 ClosureBorrowArea GExisting AccessChannel<strong>Cell</strong> 2<strong>Cell</strong><strong>3D</strong><strong>Cell</strong> 3<strong>Cell</strong> 6<strong>Cell</strong> 1PoplarHarbor<strong>Cell</strong> 4JeffersonIsland<strong>Cell</strong> 5CoachesIslandBorrowArea FUpland<strong>Cell</strong>sNOB 8-11Relocation <strong>of</strong> SouthernAccess Channel andTurning Basin0 0.25 0.5 1Miles• Expansion beyond theoriginal footprintapproved in WRDA2007• Existing project cost:~ $407 million• With Expansion: ~ $715million
Habitat Restoration Goals• Create tidal marsh habitat forChesapeake Bay fish and wildlife• Create bare or sparsely vegetatednesting islands for colonial waterbirds(i.e. terns)• Create vegetated islands for otherwaterbirds (such as egrets and herons)• Create a diversity <strong>of</strong> habitat types forfish and wildlife• Create quiescent condition for SAVrecovery• Minimize and <strong>of</strong>fset loss <strong>of</strong> benthichabitat
Habitat Restoration Goals – FrameworkMonitoring• A long-term monitoring plan and schedule was developed beforeconstruction began (Framework Monitoring Document) to ensuregoals were being met• Developed by numerous Federal and State agencies, as well asuniversity experts and private consultants – called Poplar IslandWorking Group• Exterior sediment quality• Exterior water quality• Benthics – community and tissue• Discharge monitoring• Construction turbidity monitoring• Shellfish bed sedimentation• Interior water quality- algaemonitoring•Wetland vegetation• Wetlands use by fish• Fisheries use <strong>of</strong> exteriorproximal water• Wetlands use by wildlife• Bird utilization counts• Submerged aquatic vegetation• Diamondback terrapinmonitoring• Wetland cell soil and vegetation
Poplar Island Working Group• USACE• MPA• MES• USFWS• NMFS• NOAA• MD DNR• MGS• MDE• EPA• USGS• UMCES• APHIS• CCA• Waterman’sAssoc.• Talbot CountyGov’t• Nat’l BiologicalSurvey• Consultants• Citizens
Wetland Development – <strong>Cell</strong> <strong>3D</strong><strong>Cell</strong> <strong>3D</strong> October 2002Proposed <strong>Cell</strong> <strong>3D</strong>Development Plan<strong>Cell</strong> <strong>3D</strong> September 2008
Wetland Development – <strong>Cell</strong> <strong>3D</strong>Inflow: April 2001 – November 2003• 0.35 million cubic yards(mcy) <strong>of</strong> dredgedmaterial inflowed into<strong>Cell</strong> <strong>3D</strong>• Slurry ratio isapproximately 80%water and 20%solids
Wetland Development – <strong>Cell</strong> <strong>3D</strong>Dewatering: April 2001 – November 2003• Wetlands License & WaterQuality Certification issued byMDE set requirements forturbidity, total suspended solidsand pH in discharge water
Wetland Development – <strong>Cell</strong> <strong>3D</strong>Crust Management: April 2001 – November 2003• Crust develops after dewatering• Once material is dry, trenches aredug using specialized equipment• Trenches drain water to spillwaysPontoon trencher• Goal <strong>of</strong> crustmanagement is tomaximize consolidationand achieve theappropriate elevations
Wetland <strong>Cell</strong> Development – <strong>Cell</strong> <strong>3D</strong>Grading & Channel Excavation: Dec. 2003-Oct. 2004Channel Excavation• Material excavated from channels was redistributedthroughout the cell by grading• Required to have a 80/20 low marsh to high marsh ratio
Wetland <strong>Cell</strong> Development – <strong>Cell</strong> <strong>3D</strong>Inlet Structure Construction: Dec. 2004 – Jan. 2005Pipes allow tidalinteractionWeir boards
Wetland <strong>Cell</strong> Development – <strong>Cell</strong> <strong>3D</strong>Inlet Structure – Opening to Tidal Flow: March 2005<strong>Cell</strong> <strong>3D</strong> during 1 st opening• Opened to tidal flow inMarch 2005 to note anyareas <strong>of</strong> erosion beforeplanting• Inlet structure and roadabove will eventually beremoved to allow open tidalaccess, similar to a naturalmarsh
Wetland <strong>Cell</strong> Development – <strong>Cell</strong> <strong>3D</strong>Planting: Planning<strong>Cell</strong> <strong>3D</strong> Features:DESIGNTREATMENTSFEATUREWetland Species Spartina patens,Spartina alternifloraDensity <strong>of</strong> Geese 100’ x 100’, 75’ x 75’,Fencing50’ x 50’ and 25’ x25’Wetland Plant 1’, 2’, 3’, 4’, 6’DensityAddition <strong>of</strong> None, 0.5 oz., 1.0 oz.FertilizerMethod <strong>of</strong> Planting Volunteer,ContractorType <strong>of</strong> Planting Seed, Container,Plug and Bare RootType <strong>of</strong> Substrate Dredged,Sandy/Dredged,SandyUSACE, 2004
Wetland <strong>Cell</strong> Development – <strong>Cell</strong> <strong>3D</strong>Marsh Planting: April - July 2005• Total area planted: 897,500 sq ft• Total Spartina alternifloraplugs: 312,560• Total Spartina patens plugs:174,160• Planting conducted by acontractor and volunteersorganized by the NationalAquarium in Baltimore (6acres)
<strong>Cell</strong> <strong>3D</strong> Monitoring Elements• Vegetation monitoring• Plant chemicalcomposition• Photo-documentation• Visual inspections• Soil composition• Fish use• Wildlife use• Water qualitymonitoring• Hydrologic studies
<strong>Cell</strong> <strong>3D</strong> Time Sequence(view looking east)June 2005 August 2005June 2006
<strong>Cell</strong> <strong>3D</strong> –Water Quality Monitoring• Interior water quality monitoring at three locationsPhoto Location #3Photo Location # 5Sampling Site #2Photo Location #2Photo Location #4Sampling Site #3Sampling Site #1 &Photo Location #1
<strong>Cell</strong> <strong>3D</strong> –Water Quality MonitoringSummary <strong>of</strong> 2007 Dissolved Metals dataUnits SWQS Minimum Maximum AverageDissolved Antimony UG/L NA < 2 < 5 < 3.<strong>3D</strong>issolved Arsenic UG/L 69 < 2 28 6.1Dissolved Beryllium UG/L NA < 0.5 < 4 < 2.7Dissolved Cadmium UG/L 40 < 0.5 < 5 < 3.1Dissolved Cadmium UG/L NA < 2 < 5 < 3.<strong>3D</strong>issolved Copper UG/L 6.1 < 2 17 4.5Dissolved Lead UG/L 210 < 2 < 5 < 3.<strong>3D</strong>issolved Mercury UG/L 1.8 < 0.2 < 2 < 1.1Dissolved Nickel UG/L 74 < 2 19 3.7Dissolved Selenium UG/L 290 < 2 34 6.9Dissolved Silver UG/L 1.9 < 1 < 5 < <strong>3D</strong>issolved Thallium UG/L NA < 2 < 4 < 2.2Dissolved Zinc UG/L 90 < 5 46 10.6
<strong>Cell</strong> <strong>3D</strong> –Water Quality MonitoringLessons Learned• <strong>Cell</strong> <strong>3D</strong> displays good hydrodynamics with a tidal flushing period<strong>of</strong> a little over 24 hours.• All <strong>of</strong> the daily pH levels and all turbidity levels were within theWQC guidance at the Site #1 outflow pipes, supporting the ideathat the vegetation stabilizes the material.• TSS levels were significantly below the WQC guidelines fordischarge (800 mg/L daily maximum, 400 mg/L monthly average).• Most DO concentrations recorded at the 3 sampling sites metmonthly, weekly, and daily MD State Water Quality Standards,except during June through August at shallow channel edge.- 30-day average a minimum DO <strong>of</strong> 5.0 mg/L- 7-day average a minimum DO <strong>of</strong> 4.0 mg/L- Instantaneous DO reading a minimum DO <strong>of</strong> 3.2 mg/L
<strong>Cell</strong> <strong>3D</strong> – Mineral NutritionLessons Learned• The vegetation willgradually removenitrogen from thesediments and overtime <strong>Cell</strong> <strong>3D</strong> shouldhave a more typicalgrowth pattern• Ongoing studieswill continue totrack progress <strong>of</strong><strong>Cell</strong> <strong>3D</strong>• Studies includetissue samplingand above andbelow groundbiomass surveysJuly 2007
<strong>Cell</strong> <strong>3D</strong> – Soil & Vegetation MonitoringLessons Learned• Fertilization is not needed• Volunteers plant just as well as contractors (with the properoversight)• Plant spacing can be increased to 3 foot spacing except onchannel edges• Although plugs are more efficient at marsh establishment,seeds can still be used in moderation to cut costs as longas they are prepped properly• 75 X 75 foot grid for goose fencing is sufficient• Nitrogen levels in plant tissue needs to be monitoredclosely as well as above to below ground biomass ratios
Wildlife DestinationSandpiperGreat Blue HeronAmerican AvocetWilletTree SwallowGullsAmerican OystercatcherSnowy EgretBlack Skimmer
Questions?