Factors Affecting Enzyme Activity: Lactose Intolerance
Factors Affecting Enzyme Activity: Lactose Intolerance
Factors Affecting Enzyme Activity: Lactose Intolerance

You also want an ePaper? Increase the reach of your titles
YUMPU automatically turns print PDFs into web optimized ePapers that Google loves.
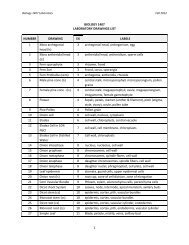
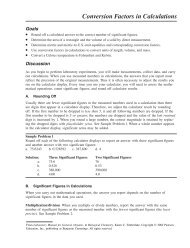
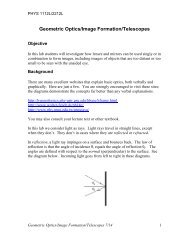
Background to the Procedure<strong>Factors</strong> <strong>Affecting</strong> <strong>Enzyme</strong> <strong>Activity</strong>In this experiment, a substitute for lactose will be used, called o-nitrophenyl-b-dgalactopyranoside(ONPG). ONPG is hydrolyzed by lactase to form the yellow-coloredo-nitrophenolate ion. The rate of the reaction can be studied by measuring the intensity of theyellow color using a spectrophotometer.O 2 NCH 2 OHCH 2 OHO 2 NHOOHOOLactaseH 2 OHOOHOOH+ H ++OOHOHONPGgalactoseo-nitrophenolate ion(yellow)If a liquid is colored, it is because some component of the liquid absorbs visible light. In a solutionthe greater the concentration of the light-absorbing substance, the more light absorbed, and themore intense the color. The quantity of light absorbed can be measured by a spectrophotometer.The next page will give you more information about the spectrophotometer.Without going into the derivation of the equations, the concentration of the light-absorbingsubstance is directly proportional to the absorbance (one of the readings the spectrophotometergives). Therefore, the greater the reaction rate (enzyme activity), the more yellow-coloredo-nitrophenolate ion is produced. The more yellow-colored o-nitrophenolate ion produced, thedeeper the color and the greater the absorbance. Thus,Absorbance ∝ enzyme activityIn this experiment, you will plot the absorbance on the y-axis and one of the factors affectingenzyme activity (enzyme concentration, pH, or substrate concentration) on thex-axis. The expected graphs of enzyme activity versus the various factors are shown below:<strong>Enzyme</strong> <strong>Activity</strong><strong>Enzyme</strong> <strong>Activity</strong><strong>Enzyme</strong> <strong>Activity</strong><strong>Enzyme</strong> ConcentrationpHSubstrate Concentration
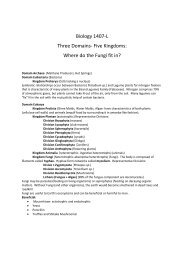
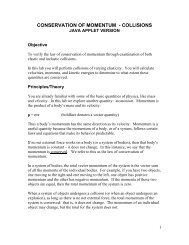
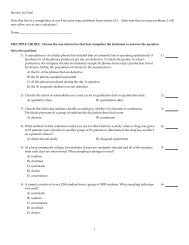
<strong>Factors</strong> <strong>Affecting</strong> <strong>Enzyme</strong> <strong>Activity</strong>A.3 Your next 5 cuvettes will contain different enzyme concentrations, but each contains thesame amount of buffer and substrate. Place 3 mL of the pH 7 buffer in each of the fivecuvettes using a 5 mL disposable pipette. Add 0.5 mL of the substrate (ONPG) to each ofthe cuvettes using a 1 mL disposable pipette.A summary of the dilution process is shown on the following page.A.4 Cuvette #1 will contain the most dilute enzyme solution. In a separate test tube, add 1 mLof the stock lactase solution and 2 mL of distilled water. Mix by inversion three times.Adding the enzyme solution:Add 0.5 mL of this diluted enzyme solution to one of the cuvettes with the buffer andsubstrate and quickly mix by inversion three times. Start timing the solution. Wipe off anyfingerprints or spills on the outside of the cuvette and place it in the spectrophotometer.Make sure the spectrophotometer is set to read absorbance. At exactly 2 minutes, record theabsorbance reading of this solution.A.5 Cuvette #2 will contain the next dilute enzyme solution. Use the following dilution. In aseparate test tube, add 1 mL of the stock lactase solution and 1.5 mL of distilled water. Mixby inversion three times. Follow the Adding the enzyme solution procedure.A.6 Cuvette #3 will contain the next dilute enzyme solution. Use the following dilution. In aseparate test tube, add 1 mL of the stock lactase solution and 1 mL of distilled water. Mix byinversion three times. Follow the Adding the enzyme solution procedure.A.7 Cuvette #4 will contain the next dilute enzyme solution. Use the following dilution. In aseparate test tube, add 1 mL of the stock lactase solution and 0.5 mL of distilled water. Mixby inversion three times. Follow the Adding the enzyme solution procedure.A.8 Cuvette #5 will contain the most concentrated enzyme solution. No dilution is necessary.Add 0.5 mL of the stock lactase solution to the last cuvette with the buffer and substrateand quickly mix by inversion three times. Start timing the solution. Make the absorbancemeasurement as before.A.9 Make a graph of absorbance on the y-axis versus relative enzyme concentration onthe x‐axis. Using a ruler, draw a straight line through your data points. (Optional): useMicrosoft Excel to graph the data. A template will be provided.
<strong>Factors</strong> <strong>Affecting</strong> <strong>Enzyme</strong> <strong>Activity</strong>Start with stock lactase solutionDilution factorDilution No Dilution1.0 mL 1.0 mL1.0 mLStocklactasesolution1.0 mLStocklactasesolution2.0 mLH 2O1.5 mLH 2O1.0 mLH 2O0.5 mLH 2O11 + 2 = 0. 11 +1.5 = 0.40 1 +1 = 0.50 1 + 0.5 = 0.67110.5 mL0.5 mL0.5 mL0.5 mL0.5 mLCuvette#1Cuvette#2Cuvette#Cuvette#4Cuvette#5
B. Effect of pH<strong>Factors</strong> <strong>Affecting</strong> <strong>Enzyme</strong> <strong>Activity</strong>Materials:10 cuvettes, about 6 mL of the substrate solution (ONPG), about 3 mL of theenzyme solution (lactase), Buffer solutions: pH 4, pH 6, pH 7, pH 8, and either pH 9or 10, disposable pipettes (5 mL and 1 mL), ice, test tubesB.1 You must have a reference blank for each pH buffer. Start with the pH 4 buffer. To makeyour reference blank, place 3 mL of the buffer solution in a cuvette using a 5 mL disposablepipette. Add 0.5 mL of the substrate (ONPG) to the cuvette using a 1 mL disposable pipette.Add 0.5 mL of distilled water to the cuvette. Mix by inversion three times.B.2 Use the first reference blank to calibrate the spectrophotometer (reread the section on Howto Calibrate the Spectrophotometer. Once calibrated, don’t turn the dials or you will loseyour calibration.B.3 Make the sample solution at the same pH that you calibrated the spectrophotometer. Place3 mL of the buffer in an empty cuvette. Add 0.5 mL of the substrate (ONPG) to a cuvetteusing a 1 mL disposable pipette.Adding the enzyme solution:Add 0.5 mL of the stock lactase solution to the cuvette with the buffer and substrate andquickly mix by inversion three times. Start timing the solution. Wipe off any fingerprintsor spills on the outside of the cuvette and place it in the spectrophotometer. Make sure thespectrophotometer is set to read absorbance. At exactly 2 minutes, record the absorbancereading of this solution.B.4 Make a new reference blank with the next pH buffer using the procedure in B.1.Recalibrate the spectrophotometer with the new reference blank. Again, once calibrated,don’t turn the dials or you will lose your calibration.B.5 Make a new sample solution with the new pH buffer, following the procedure in B.3. Followthe Adding the enzyme solution procedure.B.6 Repeat until you have a reading for each pH buffer.B.7 Make a graph of absorbance on the y-axis versus pH on the x‐axis. Draw a smooth curvethrough your data points. (Optional): use Microsoft Excel to graph the data. A template willbe provided.
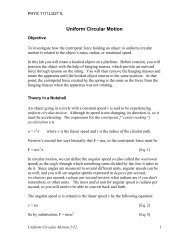
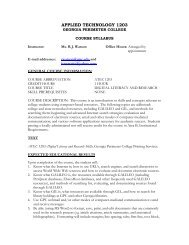
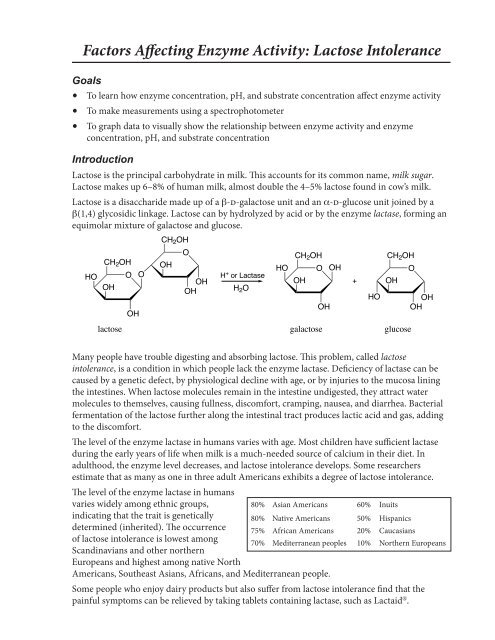
C. Effect of Substrate Concentration<strong>Factors</strong> <strong>Affecting</strong> <strong>Enzyme</strong> <strong>Activity</strong>Materials:7 cuvettes, about 7 mL of the substrate solution (ONPG), about 4 mL of the enzymesolution (lactase), about 20 mL of pH 7 buffer solution, disposable pipettes (5 mLand 1 mL), ice, test tubesC.1 To make your reference blank, place 3 mL of the pH 7 buffer in a cuvette using a 5 mLdisposable pipette. Add 0.5 mL of the enzyme (lactase) solution to the cuvette using a 1 mLdisposable pipette. Add 0.5 mL of distilled water to the cuvette. Mix by inversion threetimes.C.2 Use the reference blank to calibrate the spectrophotometer (reread the section on How toCalibrate the Spectrophotometer. Once calibrated, don’t turn the dials or you will lose yourcalibration.C.3 Your next 4 cuvettes will contain different substrate concentrations, but each contains thesame amount of buffer and enzyme. Place 3 mL of the pH 7 buffer in each of four cuvettesusing a 5 mL disposable pipette. Add 0.5 mL of the enzyme (lactase) to each of the cuvettesusing a 1 mL disposable pipette.A summary of the dilution process is shown on page 10.C.4 Cuvette #1 will contain the most dilute substrate solution. In a separate test tube, add 1 mLof the stock substrate (ONPG) solution and 2 mL of distilled water. Mix by inversion threetimes.Adding the substrate solution:Add 0.5 mL of this diluted substrate solution to one of the cuvettes with the buffer andenzyme and quickly mix by inversion three times. Start timing the solution. Wipe off anyfingerprints or spills on the outside of the cuvette and place it in the spectrophotometer.Make sure the spectrophotometer is set to read absorbance. At exactly 2 minutes, record theabsorbance reading of this solution.C.5 Cuvette #2 will contain the next dilute substrate solution. Use the following dilution. In aseparate test tube, add 1 mL of the stock ONPG solution and 1 mL of distilled water. Mixby inversion three times. Follow the Adding the substrate solution procedure.C.6 Cuvette #3 will contain the next dilute substrate solution. Use the following dilution. In aseparate test tube, add 1 mL of the stock ONPG solution and 0.5 mL of distilled water. Mixby inversion three times. Follow the Adding the substrate solution procedure.C.7 Cuvette #4 will contain the stock substrate solution; no dilution is necessary. Add 0.5 mLof the stock ONPG solution to the cuvette with the buffer and enzyme and quickly mix byinversion three times. Make the absorbance measurement as before.C.8 Cuvettes #5, and #6 contain different amounts of buffer and substrate than your first fourcuvettes! Read carefully how to make these last two samples.In cuvette #5, place 2.5 mL of the pH 7 buffer in the cuvette using a 5 mL disposable pipette.Add 0.5 mL of the enzyme (lactase) to the cuvette using a 1 mL disposable pipette.Add 1.0 mL of the stock ONPG solution to the cuvette with the buffer and enzyme and
<strong>Factors</strong> <strong>Affecting</strong> <strong>Enzyme</strong> <strong>Activity</strong>quickly mix by inversion three times. Start timing the solution. Make the absorbancemeasurement as before.C.9 In cuvette #6, place 2 mL of the pH 7 buffer in the cuvette using a 5 mL disposable pipette.Add 0.5 mL of the enzyme (lactase) to the cuvette using a 1 mL disposable pipette.Add 1.5 mL of the stock ONPG solution to the cuvette with the buffer and enzyme andquickly mix by inversion three times. Start timing the solution. Make the absorbancemeasurement as before.C.10 Make a graph of absorbance on the y-axis versus relative substrate concentration on thex‐axis. Compare your graph with the expected graph of enzyme activity versus substrateconcentration. Draw a smooth curve through your data points that mimics the expectedcurve. (Optional): use Microsoft Excel to graph the data. A template will be provided.
<strong>Factors</strong> <strong>Affecting</strong> <strong>Enzyme</strong> <strong>Activity</strong>Start with stock ONPG solutionDilution factorDilution No Dilution1.0 mL1.0 mLStockONPGsolution1.0 mLStockONPGsolutionStockONPGsolution2.0 mLH 2O1.0 mLH 2O0.5 mLH 2O11 + 2 = 0. 11 +1 = 0.50 11 + 0.5 = 0.670.5 mL0.5 mL0.5 mL0.5 mL1.0 mLCuvette#1Cuvette#2Cuvette#Cuvette#4Cuvette#5StockONPGsolution1.5 mLCuvette#610
Report Sheet<strong>Factors</strong> <strong>Affecting</strong> <strong>Enzyme</strong> <strong>Activity</strong>DateSectionNameTeamInstructorPre-Lab Study Questions1.What is the function of enzymes in the body?2.Into what category of biological molecules (carbohydrates, lipids, proteins, or nucleic acids) doenzymes belong?.What is meant by the activity of an enzyme?4.How can the activity of an enzyme be measured?5. List at least four factors that affect enzyme activity.11
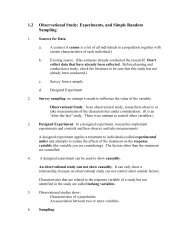
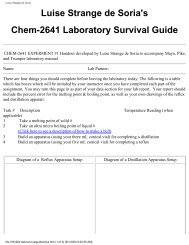
A. Effect of <strong>Enzyme</strong> Concentration<strong>Factors</strong> <strong>Affecting</strong> <strong>Enzyme</strong> <strong>Activity</strong>Cuvette #Relative <strong>Enzyme</strong>ConcentrationAbsorbanceBlank 0 01 0.332 0.403 0.504 0.675 1<strong>Enzyme</strong> <strong>Activity</strong> vs. <strong>Enzyme</strong> Concentration2.0001.500Absorbance1.0000.5000.0000.00 0.20 0.40 0.60 0.80 1.00Relative <strong>Enzyme</strong> ConcentrationQ.1 Explain why the enzyme activity increased when the enzyme concentration increased.12
B. Effect of pH<strong>Factors</strong> <strong>Affecting</strong> <strong>Enzyme</strong> <strong>Activity</strong>Cuvette # pH Absorbance12345<strong>Enzyme</strong> <strong>Activity</strong> vs. pH2.01.5Absorbance1.00.50.04 5 6 7 8 9 10pHQ.2 What was the optimum pH for lactase?13
<strong>Factors</strong> <strong>Affecting</strong> <strong>Enzyme</strong> <strong>Activity</strong>Q.3 There are many digestive enzymes in the human body, each with optimum reactionconditions (pH, temperature, etc.). Use your data to explain why lactase most likely is notfound in the stomach (very acidic, pH = 1–2) or in the large intestine (slightly basic,pH = 8).Q.4 Lactase is produced in the small intestine. Use your data to predict the general pH of thesmall intestine.14
C. Effect of Substrate Concentration<strong>Factors</strong> <strong>Affecting</strong> <strong>Enzyme</strong> <strong>Activity</strong>Cuvette #Relative SubstrateConcentrationAbsorbanceBlank 0 01 0.332 0.503 0.674 15 26 3<strong>Enzyme</strong> <strong>Activity</strong> vs. Substrate Concentration2.01.5Absorbance1.00.50.00.00 0.50 1.00 1.50 2.00 2.50 3.00Relative Substrate ConcentrationQ.5 What happens to the rate of an enzyme-catalyzed reaction as substrate concentration israised beyond the saturation point?15