The solar zenith angle dependence of desert albedo - Boston ...
The solar zenith angle dependence of desert albedo - Boston ...
The solar zenith angle dependence of desert albedo - Boston ...
You also want an ePaper? Increase the reach of your titles
YUMPU automatically turns print PDFs into web optimized ePapers that Google loves.
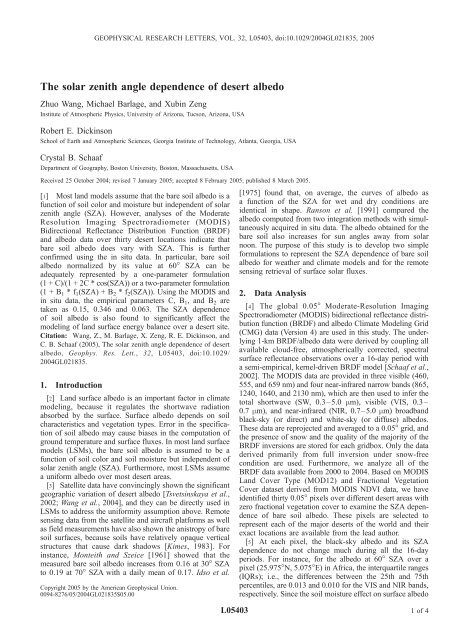
GEOPHYSICAL RESEARCH LETTERS, VOL. 32, L05403, doi:10.1029/2004GL021835, 2005<strong>The</strong> <strong>solar</strong> <strong>zenith</strong> <strong>angle</strong> <strong>dependence</strong> <strong>of</strong> <strong>desert</strong> <strong>albedo</strong>Zhuo Wang, Michael Barlage, and Xubin ZengInstitute <strong>of</strong> Atmospheric Physics, University <strong>of</strong> Arizona, Tucson, Arizona, USARobert E. DickinsonSchool <strong>of</strong> Earth and Atmospheric Sciences, Georgia Institute <strong>of</strong> Technology, Atlanta, Georgia, USACrystal B. SchaafDepartment <strong>of</strong> Geography, <strong>Boston</strong> University, <strong>Boston</strong>, Massachusetts, USAReceived 25 October 2004; revised 7 January 2005; accepted 8 February 2005; published 8 March 2005.[1] Most land models assume that the bare soil <strong>albedo</strong> is afunction <strong>of</strong> soil color and moisture but independent <strong>of</strong> <strong>solar</strong><strong>zenith</strong> <strong>angle</strong> (SZA). However, analyses <strong>of</strong> the ModerateResolution Imaging Spectroradiometer (MODIS)Bidirectional Reflectance Distribution Function (BRDF)and <strong>albedo</strong> data over thirty <strong>desert</strong> locations indicate thatbare soil <strong>albedo</strong> does vary with SZA. This is furtherconfirmed using the in situ data. In particular, bare soil<strong>albedo</strong> normalized by its value at 60° SZA can beadequately represented by a one-parameter formulation(1 + C)/(1 + 2C * cos(SZA)) or a two-parameter formulation(1 + B 1 *f 1 (SZA) + B 2 *f 2 (SZA)). Using the MODIS andin situ data, the empirical parameters C, B 1 , and B 2 aretaken as 0.15, 0.346 and 0.063. <strong>The</strong> SZA <strong>dependence</strong><strong>of</strong> soil <strong>albedo</strong> is also found to significantly affect themodeling <strong>of</strong> land surface energy balance over a <strong>desert</strong> site.Citation: Wang, Z., M. Barlage, X. Zeng, R. E. Dickinson, andC. B. Schaaf (2005), <strong>The</strong> <strong>solar</strong> <strong>zenith</strong> <strong>angle</strong> <strong>dependence</strong> <strong>of</strong> <strong>desert</strong><strong>albedo</strong>, Geophys. Res. Lett., 32, L05403, doi:10.1029/2004GL021835.1. Introduction[2] Land surface <strong>albedo</strong> is an important factor in climatemodeling, because it regulates the shortwave radiationabsorbed by the surface. Surface <strong>albedo</strong> depends on soilcharacteristics and vegetation types. Error in the specification<strong>of</strong> soil <strong>albedo</strong> may cause biases in the computation <strong>of</strong>ground temperature and surface fluxes. In most land surfacemodels (LSMs), the bare soil <strong>albedo</strong> is assumed to be afunction <strong>of</strong> soil color and soil moisture but independent <strong>of</strong><strong>solar</strong> <strong>zenith</strong> <strong>angle</strong> (SZA). Furthermore, most LSMs assumea uniform <strong>albedo</strong> over most <strong>desert</strong> areas.[3] Satellite data have convincingly shown the significantgeographic variation <strong>of</strong> <strong>desert</strong> <strong>albedo</strong> [Tsvetsinskaya et al.,2002; Wang et al., 2004], and they can be directly used inLSMs to address the uniformity assumption above. Remotesensing data from the satellite and aircraft platforms as wellas field measurements have also shown the anistropy <strong>of</strong> baresoil surfaces, because soils have relatively opaque verticalstructures that cause dark shadows [Kimes, 1983]. Forinstance, Monteith and Szeice [1961] showed that themeasured bare soil <strong>albedo</strong> increases from 0.16 at 30° SZAto 0.19 at 70° SZA with a daily mean <strong>of</strong> 0.17. Idso et al.Copyright 2005 by the American Geophysical Union.0094-8276/05/2004GL021835$05.00[1975] found that, on average, the curves <strong>of</strong> <strong>albedo</strong> asa function <strong>of</strong> the SZA for wet and dry conditions areidentical in shape. Ranson et al. [1991] compared the<strong>albedo</strong> computed from two integration methods with simultaneouslyacquired in situ data. <strong>The</strong> <strong>albedo</strong> obtained for thebare soil also increases for sun <strong>angle</strong>s away from <strong>solar</strong>noon. <strong>The</strong> purpose <strong>of</strong> this study is to develop two simpleformulations to represent the SZA <strong>dependence</strong> <strong>of</strong> bare soil<strong>albedo</strong> for weather and climate models and for the remotesensing retrieval <strong>of</strong> surface <strong>solar</strong> fluxes.2. Data Analysis[4] <strong>The</strong> global 0.05° Moderate-Resolution ImagingSpectroradiometer (MODIS) bidirectional reflectance distributionfunction (BRDF) and <strong>albedo</strong> Climate Modeling Grid(CMG) data (Version 4) are used in this study. <strong>The</strong> underlying1-km BRDF/<strong>albedo</strong> data were derived by coupling allavailable cloud-free, atmospherically corrected, spectralsurface reflectance observations over a 16-day period witha semi-empirical, kernel-driven BRDF model [Schaaf et al.,2002]. <strong>The</strong> MODIS data are provided in three visible (460,555, and 659 nm) and four near-infrared narrow bands (865,1240, 1640, and 2130 nm), which are then used to infer thetotal shortwave (SW, 0.3–5.0 mm), visible (VIS, 0.3–0.7 mm), and near-infrared (NIR, 0.7–5.0 mm) broadbandblack-sky (or direct) and white-sky (or diffuse) <strong>albedo</strong>s.<strong>The</strong>se data are reprojected and averaged to a 0.05° grid, andthe presence <strong>of</strong> snow and the quality <strong>of</strong> the majority <strong>of</strong> theBRDF inversions are stored for each gridbox. Only the dataderived primarily from full inversion under snow-freecondition are used. Furthermore, we analyze all <strong>of</strong> theBRDF data available from 2000 to 2004. Based on MODISLand Cover Type (MOD12) and Fractional VegetationCover dataset derived from MODIS NDVI data, we haveidentified thirty 0.05° pixels over different <strong>desert</strong> areas withzero fractional vegetation cover to examine the SZA <strong>dependence</strong><strong>of</strong> bare soil <strong>albedo</strong>. <strong>The</strong>se pixels are selected torepresent each <strong>of</strong> the major <strong>desert</strong>s <strong>of</strong> the world and theirexact locations are available from the lead author.[5] At each pixel, the black-sky <strong>albedo</strong> and its SZA<strong>dependence</strong> do not change much during all the 16-dayperiods. For instance, for the <strong>albedo</strong> at 60° SZA over apixel (25.975°N, 5.075°E) in Africa, the interquartile ranges(IQRs); i.e., the differences between the 25th and 75thpercentiles, are 0.013 and 0.010 for the VIS and NIR bands,respectively. Since the soil moisture effect on surface <strong>albedo</strong>L054031<strong>of</strong>4
L05403 WANG ET AL.: SZA DEPENDENCE OF DESERT ALBEDO L05403Figure 1. <strong>The</strong> median curves <strong>of</strong> the MODIS black-sky<strong>albedo</strong>s in (a) VIS band and (b) NIR band versus the cosine<strong>of</strong> SZA at 30 <strong>desert</strong> locations. <strong>The</strong> normalized curves withrespect to their <strong>albedo</strong> values at 60° SZA are shown in(c) VIS band and (d) NIR band.would be minimal over this <strong>desert</strong> location, these smallvariations in black-sky <strong>albedo</strong> are probably primarily causedby the uncertainty <strong>of</strong> MODIS data themselves, although insome places, there may be a subpixel vegetation contributionas well. For each location, there is a median <strong>albedo</strong> amongall the 16-day periods at each SZA, so a curve can beobtained from median <strong>albedo</strong>s over all SZAs. Figures 1aand 1b show these median SZA <strong>dependence</strong> curves <strong>of</strong> blacksky<strong>albedo</strong> over all thirty pixels. <strong>The</strong> significant geographicvariation <strong>of</strong> <strong>desert</strong> <strong>albedo</strong> is consistent with previous studies[Tsvetsinskaya et al., 2002; Wang et al., 2004]. For instance,the IQRs <strong>of</strong> the black-sky <strong>albedo</strong>s at 60° SZA are 0.065 and0.116 in the VIS and NIR bands, respectively. To see theSZA <strong>dependence</strong> more clearly, we normalize each curve inFigures 1a and 1b by its value at 60° SZA, and results areshown in Figures 1c and 1d. While the <strong>albedo</strong> increases withSZA over each pixel, its variation with SZA is quantitativelydifferent over different pixels.[6] <strong>The</strong> SZA <strong>dependence</strong> <strong>of</strong> the MODIS surface <strong>albedo</strong>has been evaluated using field measurements which includea <strong>desert</strong> site at the Surface Radiation Budget Network. Acase study over three stations reveals that the MODISBRDF model is able to capture the SZA <strong>dependence</strong> <strong>of</strong>surface <strong>albedo</strong> as shown by the field measurements [Jin etal., 2003]. Complementary to this study, here additional insitu data are used to further evaluate the MODIS data. Weuse the 0.05° (5 km) MODIS data to compare withheritage field measurements collected at a single location.Figure 2a compares the MODIS data with surface measurementsover a plowed field in Tunisia, Africa in April 1983[Pinty et al., 1989]. MODIS black-sky <strong>albedo</strong>s are muchhigher than surface observations in both the VIS and NIRbands, possibly because <strong>of</strong> different surface conditions(including soil moisture) in April between 1983 and 2001and because <strong>of</strong> the inherent difference between a pointmeasurement and satellite measurements in a 0.05° grid.<strong>The</strong>se differences are also contributed, to a lesser degree, bythe comparison <strong>of</strong> the MODIS black-sky <strong>albedo</strong> with the insitu measurements <strong>of</strong> true <strong>albedo</strong> that is a weighted average<strong>of</strong> direct and diffuse <strong>albedo</strong>s. To better compare the SZA<strong>dependence</strong>, we normalize each curve in Figure 2a by its<strong>albedo</strong> at 60° SZA in Figure 2b. Evidently, both MODIS andin situ <strong>albedo</strong>s increase with SZA and their SZA <strong>dependence</strong>sare consistent with each other. Figures 2c and 2dcompare MODIS data with the in situ data over an Avondaleloam soil site in Phoenix, Arizona in May, July, September,and December 1973 [Idso et al., 1975]. Over dry or wet soil,the observed in situ <strong>albedo</strong> minimum occurred near thesmallest SZA at <strong>solar</strong> noon, while its maximum occurredat the greatest SZA in the morning and afternoon. <strong>The</strong>MODIS black-sky <strong>albedo</strong> and its SZA <strong>dependence</strong> in theSW band (i.e., the spectrally weighted average <strong>of</strong> VIS andNIR bands) agree with the in situ measurements over drysoil. Figures 2e and 2f compare the in situ <strong>albedo</strong> measurements<strong>of</strong> the tiger-bush soil over the Sahel <strong>desert</strong> in Marchand September 1990 [Allen et al., 1994] with the MODISSW <strong>albedo</strong>s in 2001. It is unclear why the in situ <strong>albedo</strong> overwet soil actually decreases slightly with the increase <strong>of</strong> SZAfor SZA greater than 60°. <strong>The</strong> in situ <strong>albedo</strong>s over dry soil lielargely between the MODIS <strong>albedo</strong>s in March and September2001. However, the MODIS <strong>albedo</strong> increases faster withSZA than indicated by the in situ data.3. Two Simple Formulations for the SZADependence <strong>of</strong> Bare Soil Albedo[7] To adequately describe the SZA <strong>dependence</strong> <strong>of</strong> baresoil <strong>albedo</strong> as given in Figures 1 and 2, a new <strong>albedo</strong>Figure 2. Comparison <strong>of</strong> MODIS data with in situmeasurements. (a) <strong>The</strong> bare soil <strong>albedo</strong> in VIS and NIRbands versus cosine SZA in Tunisia, Africa in April 1983[Pinty et al., 1989]; (b) Same as (a) except for normalizedblack-sky <strong>albedo</strong>s with respect to the <strong>albedo</strong> at 60° SZA;(c) <strong>The</strong> bare soil <strong>albedo</strong> in the SW band in Phoenix, Arizonain May, July, September, and December 1973 [Idso et al.,1975]; (d) Same as (c) except for normalized black-sky<strong>albedo</strong>s; (e) <strong>The</strong> bare soil <strong>albedo</strong> in the SW band over theSahel <strong>desert</strong> in March and September 1990 [Allen et al.,1994]; (f) Same as (e) except for normalized black-sky<strong>albedo</strong>s.2<strong>of</strong>4
L05403 WANG ET AL.: SZA DEPENDENCE OF DESERT ALBEDO L05403formulation is derived here using the MODIS BRDF/<strong>albedo</strong>algorithm and data [Schaaf et al., 2002]:aq ðÞ¼a r f1þ B 1 bg 1 ðÞ qg 1 ð60 Þcþ B 2 bg 2 ðÞ qg 2 ð60 Þcgð1Þwhere a is the black-sky <strong>albedo</strong>, q is <strong>solar</strong> <strong>zenith</strong> <strong>angle</strong>, a r isthe <strong>albedo</strong> at 60° SZA and depends on season and location.<strong>The</strong> functions g 1 and g 2 are from the MODIS algorithm:g 1 ðÞ¼ q 0:007574 0:070987q 2 þ 0:307588q 3 andg 2 ðÞ¼ q 1:284909 0:166314q 2 þ 0:04184q 3 :<strong>The</strong> parameters B 1 and B 2 are the average <strong>of</strong> the ratios <strong>of</strong>the volumetric and geometric parameters in the MODISalgorithm [Schaaf et al., 2002] over a r for 30 pixels,respectively. Figures 3a–3d shows these parameters in VISand NIR bands for thirty pixels as a function <strong>of</strong> a r . Based onthis figure, we obtain B 1 = 0.346 and B 2 = 0.063.[8] We have also tested the simple formulation [Brieglebet al., 1986]:1 þ Caq ðÞ¼a r 1 þ 2C cos qwhere the empirical parameter C was taken as 0.4 for arablegrass, grassland and <strong>desert</strong>, and 0.1 for all other types[Briegleb et al., 1986]. Equation (2) and the above valuesfor C have also been used in the remote sensing retrieval <strong>of</strong>land surface <strong>solar</strong> fluxes [Pinker and Laszlo, 1992] and insome land-atmosphere coupled models [e.g., Hou et al.,2002].[9] A more appropriate value for C can be determined byfitting each curve in Figures 1a and 1b to (2) by minimizingthe integral over all SZA’s for each 16-day period:V ¼ 2Z p=2q¼0ð2Þcos q sin q ða M a C Þ 2 dq ð3Þwhere a M is the MODIS <strong>albedo</strong> and a c is computed from(2). <strong>The</strong> weighting factor <strong>of</strong> cosq is the same as that used forcomputing the white-sky <strong>albedo</strong> [Schaaf et al., 2002]. Thisis chosen also because MODIS data are more reliable atSZA less than 70° and because the <strong>albedo</strong> is more importantat a smaller SZA when <strong>solar</strong> flux itself is large. <strong>The</strong> valuesfor C over all thirty pixels are plotted as a function <strong>of</strong> a r inFigures 3e and 3f. <strong>The</strong>ir mean values for the VIS and NIRbands are 0.17 and 0.13, respectively, and their average <strong>of</strong>0.15 is used for both bands to be consistent with Briegleb etal. [1986]. Furthermore, the best-fit linear equations can beobtained: C VIS (a r ) = 0.29 0.51a r and C NIR (a r ) = 0.130.02a r . To compare the performance <strong>of</strong> (1) and (2), weP 1compute d = 30 1=2 , where V i is computed from (3)30V ii¼1for each <strong>of</strong> the 30 pixels. <strong>The</strong> values <strong>of</strong> d are 0.0061,0.0081, and 0.0072 using the two-parameter model, oneparametermodel with constant C as well as the best-fitlinear equations, respectively. This shows that the twoparametermodel is a little better than the one-parameterFigure 3. <strong>The</strong> median B 1 versus the MODIS black-sky<strong>albedo</strong>s at 60° SZA (a r ) for 30 pixels in (a) VIS band and(b) NIR band. <strong>The</strong> median B 2 versus a r in (c) VIS band and(d) NIR band. <strong>The</strong> values for C versus a r in (e) VIS bandand (f) NIR band (solid line: the best-fit linear function;dotted line: the average C value <strong>of</strong> VIS and NIR bands).(g) <strong>The</strong> SZA <strong>dependence</strong> at a pixel (19.975°N, 43.325°E)using the MODIS data directly and computed using (1) and(2) with different C (the best-fit linear function or fixedvalues) in the VIS band; (h) Same as (g) except in the NIRband.model. If the white-sky <strong>albedo</strong> is used (i.e., withoutconsidering the SZA <strong>dependence</strong>), the d value would be0.0195 and is much bigger than those using (1) or (2). Thisindicates the importance <strong>of</strong> the SZA <strong>dependence</strong>. Figures 3gand 3h evaluates the SZA <strong>dependence</strong> over a pixel(19.975°N, 43.325°E) using (1) and (2) with differentvalues for C. <strong>The</strong> simulated SZA <strong>dependence</strong> using the twoparameter,one-parameter model with the best-fit linearequation or the C fixed at 0.15 are consistent with theMODIS data for SZA less than 60°. In contrast, the <strong>albedo</strong>computed with C = 0.4 increases with SZA much faster thanindicated by the MODIS data, and its value at zero SZA islower by 0.03 for the VIR band and 0.05 for the NIR band.[10] We have further evaluated the impact <strong>of</strong> the prescribedparameters C, B 1 , and B 2 on the computed SZA<strong>dependence</strong> using the in situ data in Figure 2e. It is foundthat the deviations <strong>of</strong> the simulated <strong>albedo</strong> using (1) or (2)with C = 0.15 from in situ data are much smaller than thosewith C = 0.4 for SZA less than 70° (figure not shown).Based on these analyses, we recommend the use <strong>of</strong> thepolynomial (1) or (2) with C = 0.15 over bare soil in landmodeling and remote sensing retrieval <strong>of</strong> land surface<strong>solar</strong> fluxes. <strong>The</strong>n the white-sky <strong>albedo</strong> can be obtainedanalytically by integrating (1) and (2) over all SZA’s [using3<strong>of</strong>4
L05403 WANG ET AL.: SZA DEPENDENCE OF DESERT ALBEDO L05403transferred into the soil (Figure 4c). <strong>The</strong> remaining energy isprimarily used to increase the ground temperature (Figure 4d)and is emitted as longwave radiation. Compared with CTL,the ground temperature at local <strong>solar</strong> noon is higher by 0.7°C,0.4°C, and 0.3°C in the RAD, NEW, and POL simulations,respectively (Figure 4d). <strong>The</strong>re are systematic temperaturebiases in all four simulations in comparison with observations(Figure 4d), but it goes beyond the scope <strong>of</strong> this study t<strong>of</strong>urther address this issue. Additional observational data fromtwo sites in Arizona lead to similar conclusions.[13] In summary, our analyses <strong>of</strong> the MODIS and in situdata indicate that bare soil <strong>albedo</strong> depends on the SZA, andthis <strong>dependence</strong> can be adequately represented by (1) withB 1 = 0.346 and B 2 = 0.063 as well as (2) with C = 0.15.<strong>The</strong>se <strong>dependence</strong>s need to be considered in land modeling.Further work is also needed to evaluate the impact <strong>of</strong> theseformulations on the remote sensing retrieval <strong>of</strong> land surface<strong>solar</strong> fluxes.Figure 4. <strong>The</strong> sensitivity <strong>of</strong> the Noah land model to theSZA <strong>dependence</strong> <strong>of</strong> the bare soil <strong>albedo</strong> at a Sahel site.(a) Absorbed <strong>solar</strong> radiation difference between threedifferent simulations and CTL; (b) Sensible heat fluxdifference; (c) Ground heat flux difference; and (d) Groundtemperature bias <strong>of</strong> simulations from observations. See thetext for the meaning <strong>of</strong> each simulation.the weighting factor in (3)], and is a ws = 0.97a r for (1) anda ws = 0.96a r for (2).4. Impact <strong>of</strong> the SZA Dependence <strong>of</strong> SoilAlbedo on Land Modeling[11] We have incorporated (1) and (2) into the Noah landsurface model [Mitchell et al., 2004]. <strong>The</strong> model is forcedusing observations over a tiger bush site from the HydrologicAtmospheric Pilot Experiment in the Sahel [Goutorbeet al., 1997]. We run the model from Aug. 20 to Sept. 30,1992. <strong>The</strong> sensitivity <strong>of</strong> the Noah model to the SZA<strong>dependence</strong> <strong>of</strong> the <strong>albedo</strong> is shown in Figure 4. Foursimulations are completed. <strong>The</strong> observed monthly averaged<strong>albedo</strong>s for Aug., Sept., and Oct. are interpolated into theaverage daily <strong>albedo</strong> for these four runs. <strong>The</strong> controlsimulation (CTL) has no SZA <strong>dependence</strong>, similar to the<strong>of</strong>fline Noah model setup. Equation (1) is used to define aSZA <strong>dependence</strong> (B 1 = 0.346, B 2 = 0.063) in the POL run.<strong>The</strong> NEW run uses (2) with C = 0.15. <strong>The</strong> RAD simulationis also done using (2) with C = 0.4, as implemented inthe atmospheric radiative transfer scheme in the NCEP landatmospherecoupled model [Hou et al., 2002].[12] Figure 4 shows the 5-day averaged diurnal cycle forthe last 5 days <strong>of</strong> Sept. 1992. Compared with CTL, the SZA<strong>dependence</strong> formulations in (1) and (2) increase <strong>albedo</strong> atlarge SZA and decrease <strong>albedo</strong> at small SZA. <strong>The</strong>refore, theabsorbed <strong>solar</strong> radiation (Figure 4a) behaves as expected,with increases at <strong>solar</strong> noon <strong>of</strong> about 38, 20, and 16 W/m 2 forthe RAD, NEW, and POL simulations, respectively. Sinceless <strong>solar</strong> radiation is incident at low sun <strong>angle</strong>s, the SZA<strong>dependence</strong> does not affect the simulations much at sunriseand sunset. About 76% <strong>of</strong> the extra <strong>solar</strong> energy goes into anincrease in sensible heat flux (Figure 4b) while another 18% is[14] Acknowledgment. This work was supported by NASA undergrant NNG04GL25G and through its EOS IDS Program (429-81-22; 428-81-22), and by NOAA under grant NA03NES4400013.ReferencesAllen, S. J., J. S. Wallance, J. H. C. Gash, and M. V. K. Sivakumar (1994),Measurements <strong>of</strong> <strong>albedo</strong> variation over natural vegetation in the Sahel,Int. J. Remote Sens., 14, 625–636.Briegleb, B. P., P. Minnis, V. Ramanathan, and E. Harrison (1986),Comparison <strong>of</strong> regional clear sky <strong>albedo</strong>s inferred from satellite observationsand model calculations, J. Clim. Appl. Meteorol., 25, 214–226.Goutorbe, J. P., et al. (1997), An overview <strong>of</strong> HAPEX-Sahel: A study inclimate and <strong>desert</strong>ification, J. Hrdrol., 188–189, 4 – 17.Hou, Y. T., S. Moorthi, and K. Campana (2002), Parameterization <strong>of</strong> <strong>solar</strong>radiation transfer in the NCEP models, NCEP Off. Note 441, 34 pp., Natl.Cent. for Environ. Predict., Camp Springs, Md.Idso,S.B.,R.D.Jackson,R.J.Reginato,B.A.Kimball,andF.S.Nakayama (1975), <strong>The</strong> <strong>dependence</strong> <strong>of</strong> bare soil <strong>albedo</strong> on soil watercontent, J. Appl. Meteorol., 14, 109–113.Jin, Y., C. B. Schaaf, C. E. Woodcock, F. Gao, X. Li, A. H. Strahler,W. Lucht, and S. Liang (2003), Consistency <strong>of</strong> MODIS surface bidirectionalreflectance distribution function and <strong>albedo</strong> retrievals: 2. Validation,J. Geophys. Res., 108(D5), 4159, doi:10.1029/2002JD002804.Kimes, D. S. (1983), Dynamics <strong>of</strong> directional reflectance factor distributionsfor vegetation canopies, Appl. Opt., 22, 1364–1372.Mitchell, K. E., et al. (2004), <strong>The</strong> multi-institution North AmericanLand Data Assimilation System (NLDAS): Utilizing multiple GCIPproducts and partners in a continental distributed hydrological modelingsystem, J. Geophys. Res., 109, D07S90, doi:10.1029/2003JD003823.Monteith, J. L., and G. Szeice (1961), <strong>The</strong> radiation balance <strong>of</strong> bare soil andvegetation, Q. J. R. Meteorol. Soc., 87, 159–170.Pinker, R. T., and I. Laszlo (1992), Modeling <strong>of</strong> surface <strong>solar</strong> irradiance forsatellite applications on a global scale, J. Appl. Meteorol., 31, 194–211.Pinty, B., M. E. Verstrate, and R. E. Dickinson (1989), A physical modelfor predicting bidirectional reflectances over bare soil, Remote Sens.Environ., 27, 273–288.Ranson, K. J., J. R. Irons, and C. S. T. Daughtry (1991), Surface albed<strong>of</strong>rom bidirectional reflectance, Remote Sens. Environ., 35, 201–211.Schaaf, C. B., et al. (2002), First operational BRDF, <strong>albedo</strong> nadir reflectanceproducts from MODIS, Remote Sens. Environ., 83, 135–148.Tsvetsinskaya, E. A., C. B. Schaaf, F. Gao, A. H. Strahler, R. E. Dickinson,X. Zeng, and W. Lucht (2002), Relating MODIS-derived surface <strong>albedo</strong>to soils and rock types over Northern Africa and the Arabian peninsula,Geophys. Res. Lett., 29(9), 1353, doi:10.1029/2001GL014096.Wang, Z., et al. (2004), Using MODIS BRDF and <strong>albedo</strong> data to evaluateglobal model land surface <strong>albedo</strong>, J. Hydrometeorol., 5, 3–14.M. Barlage, Z. Wang, and X. Zeng, Institute <strong>of</strong> Atmospheric Physics,University <strong>of</strong> Arizona, Tucson, AZ 85721, USA. (zhuowang@atmo.arizona.edu)R. E. Dickinson, School <strong>of</strong> Earth and Atmospheric Sciences, GeorgiaInstitute <strong>of</strong> Technology, Atlanta, GA 30332–0340, USA.C. B. Schaaf, Department <strong>of</strong> Geography, <strong>Boston</strong> University, <strong>Boston</strong>,MA 02215, USA.4<strong>of</strong>4


