ROADSIDE INSPECTION DATA AND CRASH DATA ANALYSIS - CAIT
ROADSIDE INSPECTION DATA AND CRASH DATA ANALYSIS - CAIT
ROADSIDE INSPECTION DATA AND CRASH DATA ANALYSIS - CAIT

You also want an ePaper? Increase the reach of your titles
YUMPU automatically turns print PDFs into web optimized ePapers that Google loves.
clearing the air:How the San Joaquin Valley Can Achieve Clean Air by 2017
DISCLAIMER STATEMENT“The contents of this report reflect the views of the author(s) who is (are) responsible forthe facts and the accuracy of the data presented herein. The contents do notnecessarily reflect the official views or policies of the New Jersey Department ofTransportation or the Bureau of Trucking Services. This report does not constitute astandard, specification, or regulation.The contents of this report reflect the views of the authors, who are responsible for thefacts and the accuracy of the information presented herein. This document isdisseminated under the sponsorship of the Department of Transportation,University Transportation Centers Program, in the interest of information exchange. TheU.S. Government assumes no liability for the contents or use thereof.ii
TECHNICAL REPORT ST<strong>AND</strong>ARD TITLEPAGE1. Report No. 2.Government Accession No. 3. Recipient‟s Catalog No.MH-0734-14. Title and Subtitle 5. Report DateSep., 2008Roadside Inspection Data and Crash Data Analysis6. Performing Organization Code<strong>CAIT</strong>/Rutgers7. Author(s)Dr. Mohsen Jafari, PI,Dr. Davood Golmohammadi, andMs. Nadereh Moini8. Performing OrganizationReport No.MH-0734-19. Performing Organization Name and Address 10. Work Unit No.Rutgers-<strong>CAIT</strong>The State University of New Jersey100 Brett Rd.Piscataway, NJ, 0885411. Contract or Grant No.12. Sponsoring Agency Name and Address 13. Type of Report and PeriodCoveredNew Jersey Department of TransportationFederal Highway Administration Final reportPO 600U.S. Department of Transportation 10/1/2006 – 9/30/2008Trenton, NJ 08625Washington, D.C.14. Sponsoring Agency Code15. Supplementary Notes16. AbstractThe New Jersey Department of Transportation- Bureau of Trucking Service (NJDOT- BTS) had requested areview of inspection and crash data to determine frequent lateness and erroneous reporting by inspectors andlaw enforcement officers. In response, the Rutgers University team conducted this research to fulfill theNJDOT-BTS requirements. The project had two main objectives: 1) providing an independent and quantitativeassessment of crash and inspection data contained in the FMCSA database (SAFETYNET); 2) development ofhuman-centered decision support system. Our technical approach included a thorough analysis of inspectionand crash databases, site visits and field studies, and interviews with stakeholders and domain experts. Ourassessment of inspection and crash data concluded that data quality and integrity can be significantly improvedby streamlining the underlying data collection, hand-off and storage processes, and by using advancedtechnologies. We also prepared the functional specification of a decision support system that the NJDOT-BTSis planning to use for planning and decision making. Finally, this report included a preliminary analysis oncommercial motor vehicles crashes to identify locations with most crash incidents in the NJ roadway network.17. Key WordsCrash rate, critical crash rate, State Safety DataQuality, GIS analysis, inspection, Safetynet, Aspen18. Distribution Statement19. Security Classif (of thisreport)20. Security Classif. (of this page)21. No ofPages22. PriceUnclassified Unclassified 167 pp.Form DOT F 1700.7 (8-69)iii
ACKNOWLEDGEMENTThis project was sponsored by the New Jersey Department of Transportation- Bureau ofTrucking Service (NJDOT- BTS). The authors wish to express appreciation especially toTom Harcar (NJDOT- BTS), Shari D. Leichter (NJDOT- BTS), William Beans (NJDOT-BSP), Jonathan Kasper (NJSP), and Talvin Davis (NJDOT-BTS) for useful insights andexpertise on this project. A grateful acknowledgement should also be made for theirassistants in the development and review of this report which influenced the successfulcompletion of this project.iv
TABLE OF CONTENTSIntroduction ..................................................................................................................... 1Background ................................................................................................................. 1Project Objectives ........................................................................................................ 1Project Accomplishments ............................................................................................ 1Outline of the Report .................................................................................................... 4Appendix One: Crash and Inspection Data Collection Process Analyses ....................... 5Introduction .................................................................................................................. 5Crash Data Collection Process Analysis ...................................................................... 5Overview of the Current Process ............................................................................. 5Evaluation of Current Crash Data Collection Process ............................................ 10Crash Data Collection Process Issues ................................................................... 12Recommendations ................................................................................................. 14Inspection Data Collection Process Analysis ............................................................. 17Overview of Current Process ................................................................................. 17Evaluation of Inspection Process ........................................................................... 21Recommendations ................................................................................................. 23Methodology for State Safety Data Quality ................................................................ 25Methodology Review .............................................................................................. 25NJ State Ratings and SSDQ Measures Evaluation ................................................ 32Summary of Issues ................................................................................................ 43Appendix two: Commercial Motor Vehicle Crash Analyses .......................................... 45Introduction ................................................................................................................ 45Frequency Analysis ................................................................................................... 46Comparing CMV and truck crashes ....................................................................... 46Trend Analysis ........................................................................................................... 47GIS Analysis .............................................................................................................. 47Cross Tabulation (Cross tab) Analysis ....................................................................... 48Crash Rate Analysis .................................................................................................. 50Critical Crash Rate Analysis ...................................................................................... 51Severity Rate Analysis ............................................................................................... 52v
Critical Severity Rate Analysis ................................................................................... 52Recommendations ..................................................................................................... 53Appendix three: Functional Specification Framework................................................... 54Current Data Collection Process ............................................................................... 55Crash and Inspection Safety System (CISS) ............................................................. 56Data Specification .................................................................................................. 60Layer 1: Data Analysis & Report Creation .............................................................. 61Layer 2: GIS Analysis ............................................................................................. 62Layer 3: Network Screening .................................................................................. 62Layer 4: Diagnosis and Evaluation ......................................................................... 63Reference ...................................................................................................................... 65Appendix Four: Supplement materials .......................................................................... 67vi
LIST OF FIGURESFigure 1. Crash Data collection and reporting process flow diagram. 7Figure 2. Process of Inspection Data Collection. 18Figure 3. Roadside Inspection Data Collection and Reporting Process Flow Diagram. 20Figure 4. NJ Overall State Rating Report. 33Figure 5. NJ Crash Rating Report 34Figure 6. Crash Record Completeness Report. 35Figure 7. Driver Identification Completeness Report. 36Figure 8. Vehicle Identification Completeness Report 36Figure 9. Crash Accuracy Measure. 37Figure10. Crash Timeliness Measure. 38Figure 11. Non-fatal Crash Completeness Measure. 39Figure 12. Fatal Crash Completeness Measure. 40Figure 13. Inspection Timeliness Measure Report. 41Figure 14. Inspection Accuracy Measure Report. 42Figure 15. Crash Consistency Indicator Report. 43Figure 16. Reporting criteria for truck and Bus crashes extracted from FMCSA web site. 45Figure 17. Trend of fatal injuries in crashes in a period of four years (2003-2006). 47Figure 18. Thematic representation of CMV crashes throughout NJ State on County level. 47Figure 19. FMCSA Crash Event Data Elements. 58Figure 20. Functional Specification framework. 59Figure 21. Input and output of the CISS system. 61Figure 22. Trend of all crashes in a period of four years (2003-2006). 88Figure 23. Trend of injuries in crashes in a period of four years (2003- 2006). 88vii
LIST OF TABLESTable 1. Number of State-wide Inspections in the Year 2007. 18Table 2. Operating Hours of Inspection Facilities. 22Table 3. Annual number of vehicle involved in CMV crashes based on their cargo body typeoccurred at or not at intersection. 48Table 4. Annual number of trucks‟ crashes based on their cargo body type occurred at or not atintersection. 49Table 5. Number of crashes based on the crash type reported by police officer. 72Table 6. Number of crashes happening at or not at intersections. 73Table 7. Number of crashes occurred in different environment conditions. 74Table 8. Number of crashes occurred in different light conditions. 75Table 9. Number of crashes based on different cargo body type. 76Table 10. Number of crashes based on pre crash actions. 77Table 11. Number of crashes occurred in each roadway functional class. 78Table 12. Crash frequency in each level of crash severity. 79Table 13. Condition of vehicles in crash scene. 80Table 14. Crash frequency in a monthly base. 81Table 15. Crash frequency in a daily base. 82Table 16. Crash frequency in an annual base. 83Table 17. Crash types for All CMV and trucks only. 84Table 18. Crash frequency for each roadway system for All CMV and trucks only. 85Table 19. Annual number of CMV and truck crashes. 86Table 20. Daily crash frequency for all CMV and trucks. 87Table 21. Annual percentages of CMV crash locations based on a vehicle‟s cargo body type. 89Table 22. Annual percentages of truck crash locations based on a vehicle‟s cargo body type. 90Table 23. Calculated crash rate in descending order for Urban Principal Arterial. 91viii
Table 24. Calculated crash rate in descending order for Urban Minor Arterial. 103Table 25. Calculated crash rate in descending order for Urban Interstate. 107Table 26. Calculated crash rate in descending order for Urban Freeway/ Expressway. 109Table 27. Calculated crash rate in descending order for Urban Collector. 110Table 28. Calculated crash rate in descending order for Rural Minor Collector. 110Table 29. Calculated crash rate in descending order for Rural Principal Arterial. 111Table 30. Calculated crash rate in descending order for Rural Minor Arterial. 112Table 31. Calculated crash rate in descending order for Rural Major Collector. 113Table 32. Calculated crash rate in descending order for Rural Interstate. 113Table 33. Calculated Critical Crash rate in descending order for Urban Principal Arterial. 114Table 34. Calculated Critical Crash rate in descending order Urban Minor Arterial. 117Table 35. Calculated Critical Crash rate in descending order for Urban Interstate. 118Table 36. Calculated Critical Crash rate in descending order for Urban Freeway/Expressway.119Table 37. Calculated Critical Crash rate in descending order for Urban Collector. 120Table 38. Calculated Critical Crash rate in descending order for Rural Principal Arterial. 120Table 39. Calculated Critical Crash rate in descending order for Rural Minor Collector. 120Table 40. Calculated Critical Crash rate in descending order for Rural Minor Arterial. 120Table 41. Calculated Critical Crash rate in descending order for Rural Major Collector. 120Table 42. Calculated Critical Crash rate in descending order for Rural Interstate. 120Table 43. Calculated severity rate in descending order for Urban Principal Arterial. 121Table 44. Calculated severity rate in descending order for Urban Minor Arterial. 124Table 45. Calculated severity rate in descending order for Urban Local. 131Table 46. Calculated severity rate in descending order for Urban Interstate. 132Table 47. Calculated severity rate in descending order for Urban Freeway/ Expressway. 137Table 48. Calculated severity rate in descending order for Urban Collector. 139Table 49. Calculated severity rate in descending order for Rural Principal Arterial. 142ix
Table 50. Calculated severity rate in descending order for Rural Minor Collector. 144Table 51. Calculated severity rate in descending order for Rural Minor Arterial. 145Table 52. Calculated severity rate in descending order for Rural Major Collector. 147Table 53. Calculated severity rate in descending order for Rural Interstate. 149Table 54. Calculated critical severity rate in descending order for Urban Principal. 150Table 55. Calculated critical severity rate in descending order for Urban Minor Arterial. 152Table 56. Calculated critical severity rate in descending order for Urban Interstate. 153Table 57. Calculated critical severity rate in descending order for Urban Freeway/Expressway.154Table 58. Calculated critical severity rate in descending order for Urban Collector. 154Table 59. Calculated critical severity rate in descending order for Rural Principal Arterial. 155Table 60. Calculated critical severity rate in descending order for Rural Minor Arterial. 155Table 61. Calculated critical severity rate in descending order for Rural Major Collector. 155Table 62. Calculated critical severity rate in descending order for Rural Interstate. 155Table 63. Predefined reports requested by the BTS. 156x
LIST OF CHARTSChart 1. Crash frequency Versus Crash type. 72Chart 2. frequency Versus Crash type. 73Chart 3. Crash frequency in different environment conditions. 74Chart 4. Crash frequency in different light conditions. 75Chart 5. Number of crashes based on vehicle cargo body type by excluding “NULL” records. 76Chart 6. Crash frequency in each class of roadway. 78Chart 7. Crash frequency in each level of severity. 79Chart 8. Crash frequency based on a vehicle‟s condition. 80Chart 9. Crash frequency in a monthly base. 81Chart 10. Crash frequency in a daily base. 82Chart 11. Crash frequency in an annual base. 83Chart 12. Crash types for All CMV and trucks only. 84Chart 13. CMV and truck crashes in each roadway class. 85Chart 14. Annual number of CMV and truck crashes. 86Chart 15. Daily crash frequency for all CMV and trucks. 87xi
Roadside inspection and crash data analysisINTRODUCTIONBackgroundThe SAFETYNET database maintained by the New Jersey Department ofTransportation- Bureau of Trucking Service (NJDOT- BTS), stores in excess of 8Krecords on crash data, and up to 50K records on inspection data per year. The datamaintained in the SAFETYNET database are collected using various methodologiesand from various sources ranging from computer analysis to law enforcement to fieldcollection. The data maintained in this database currently provides decision makingsupport to the BTS. The decision support system planned to be developed as part ofthis project would also use the SAFETYNET data as well as the data from NJTR-1.Furthermore, the Federal Motor Carrier Safety Administration (FMCSA) rates states onmonthly basis on the completeness, timeliness, accuracy, and consistency of StatereportedCMV crashes and roadside inspection data in the Motor Carrier ManagementInformation System (MCMIS). (1) . Therefore, it is imperative to ensure data integrity,timeliness and quality in all stages of data collection, data maintenance, and data usagefor the purpose of planning and decision making.Project ObjectivesThis project was in response to the task order “<strong>ROADSIDE</strong> INPECTION <strong>DATA</strong> <strong>AND</strong><strong>CRASH</strong> <strong>DATA</strong> <strong>ANALYSIS</strong>” announced by the NJDOT- BTS in 2006. Two mainobjectives were identified:To provide an independent and quantitative assessment of the data contained inthe SAFETYNET database on random roadside inspections of commercial motorvehicles and crashes involving commercial vehicles.To develop a decision support system which will assist system planners througha GIS based interface, by identifying hot spots in the NJ road network;categorizing carriers and drivers by such attributes as number of crashers andseverity of crashes; categorizing crashes by the geographical locations andvehicle types, etc. Furthermore, the system is expected to allow for the statisticalquantification of changes in hot spots and/or vehicle types.Project AccomplishmentsThe research was conducted in two phases according to the original proposal. Next wedescribe our findings and results according to the tasks defined in the proposal.1
Roadside inspection and crash data analysisPhase I: Inspection and crash data validity and integrityTask 1- Team formationA technical team was formed including researchers from <strong>CAIT</strong> (Center for AdvancedInfrastructure and Transportation) and project management from NJDOT-BTS, NJ StatePolice (NJSP), and FMCSA.Task 2 – Inspection data study and validationWe conducted field studies, and interviewed commercial roadside inspectors, Statepolice officers, and SAFETYNET users. The following two issues were identified to bemajor concerns:It seems to be significant evidence of lack of timeliness in reporting ofinspection data. The supporting arguments and data are presented in appendixone.We found evidence of lack of data integrity and were able to spot errors andredundancy in various stages of data location and data storage in theSAFETYNET database. Appendix one provides details.Task 3 – Crash data and validationThe following two issues were also identified to be major concerns for crash datacollections and data processing:There is evidence that the quality of data gathered in crash scene alongreporting status varies based on crash involvement factors such as crashseverity and time of year. The supporting arguments and data are presented inappendix one.Some of major elements required by FMCSA are not collected by policeofficers. More discussions are presented in appendix one.It seems to be significant evidence of lack of timeliness in reporting of crashdata. Appendix one provides details.Appendix one includes a series of recommendations to remedy the above issues andenhance quality and integrity of inspection and crash databases. Theserecommendations were formulated following extensive data analysis, interviews withexperts, and discussions with the stakeholders. For the crash data, significantenhancements can be made by improving data gathering techniques, verification and2
Roadside inspection and crash data analysisanalysis, and utilization of more advanced technologies. The inspection data qualityand integrity can significantly benefit from training, and a monitoring and trackingsystem.Phase II: Development of human-centered Decision Support System (DSS)Task 1- Development of a functional system specificationA functional specification document was prepared for the crash and inspection safetysystem. The document benefits extensively from our discussions and interviews withthe various members of the technical team as well as comprehensive survey of therelated literature. This document is included in appendix three of this report. This multilayer system will be developed to provide the following major functionalities:Automating existing manual calculations and analyses conducted by NJDOT-BTS on crash and inspection data.Providing customized filtering, assessments and predefined reports in tabularand GIS environments.Developing new evaluation methods to reduce Commercial Motor Vehicle (CMV)crashes by establishing a relation between crash and inspection records.Task 2 and Task 3– Software Design and ImplementationDue to the unexpected changes in the project schedule and its early termination, thetasks involving software design specification and implementation were not performed aspart of this project. The team from Rutgers was instead asked to prepare a newproposal for a follow up task order. The proposal has been prepared and alreadysubmitted to the NJDOT-BTS.Task 4 – Preliminary AnalysisThe Rutgers team was asked to perform this additional task, which was intended toconduct a preliminary analysis to identify locations with the most predominant crashincidents in the NJ roadway network. It involves extensive data analysis includingfrequency, crash rate calculations and geo-spatial analyses. Our preliminary findingsare reported in appendix two of this report. The team also made somerecommendations including data collection on Annual Average Daily Truck Traffic(AADTT) and others enhancements which are covered in details in appendix two.3
Roadside inspection and crash data analysisOutline of the ReportThis report contains the introduction and four appendices; appendix one presents crashand inspection data collection process analyses. Appendix Two provides thepreliminary analyses on CMV crashes; appendix three shows the technical specificationframework of the CISS system; and appendix four includes all the supplementalmaterials.4
Roadside inspection and crash data analysisAPPENDIX ONE: <strong>CRASH</strong> <strong>AND</strong> <strong>INSPECTION</strong> <strong>DATA</strong> COLLECTION PROCESSANALYSESIntroductionThe following report analyzes the crash and inspection data collection process with afocus on data integrity and timeliness issues for further improvement steps.The crash and inspection data maintained in the SAFETYNET database providesdecision making support to BTS. The FMCSA data elements are sent throughSAFETYNET to the MCMIS. Therefore, it is imperative to ensure data integrity,timeliness and quality in all stages of data collection, data maintenance, and data usagefor the purpose of planning and decision making.In this appendix, information has been collected after a set of interviews, meetings,documents analysis and on-site visit. The first section analyzes crash data collectionprocesses. After that, the evaluation on the process of inspection data collection ispresented. Finally, the FMCSA measurements are discussed.Crash Data Collection Process AnalysisOverview of the Current ProcessThe number of crashes reported in NJ is about 320,000 annually, and about 8,000 ofthese are FMCSA reportable crashes. The number of weekly reports submitted toNJDOT varies from 600 to 1200. Approximately, 30 forms per day are FMCSAreportable crashes (NJTR-1).When a crash occurs, the officers must perform triage in assisting injured people,managing the crash scene, and preventing safety issues. The data is gathered at thecrash scene by an officer who fills out the crash report (NJTR-1form). The NJTR-1should be submitted within 5 days to the Bureau of Safety Programs (BSP) at NJDOT.After the data is processed at the BSP, the FMCSA reportable crash event dataelements are sent to the Bureau of Trucking Services. Consequently, the information isinput into the SAFETYNET software where the data validation procedure takes place.Finally, the corrected data sets are transferred to the federal database, MCMIS. Theflow of this process and how each of the previously mentioned entities collaborates inthe overall process is shown in Figure 1.5
Roadside inspection and crash data analysisTitleNJDOT BSP (continued)AThe raw data is reviewed during the verification processAverageProcess TimeThe raw data table is verified by ARDNoNeedmodification?YesYesIs achangeflagged?NoThe data is downloaded intothe ARD production serverContinuedThe verifier accept changes made by the ARDapplication .A verifier review the image of the NJTR-1 tCrash records meeting FMCSA criteria as reportable crashes are exported to an ASCII text fileASCII textcrash records is emailed to MCSAP officeTitleMCSAPThe MCSAP office inputs the ASCII file into SAFETYNETA log file is created and reviewedLog fileYesFatal errors are correctedNoAre fatalerrorslisted in thelog file?NoAre zip codewarnings lYes2 days(for fatal errorsor missinginformation itmay go to aweek)Zip code warnings are correctedThe SAFETYNET matchingprocess is performedThe SAFETYNET export file is transferred to the MCMIS FTP site.YesFatal errors are corrected inSAFETYNET.Any fatalerrors?(Fatal errorsindicate that therecord(s) identifiedwas not accepted byMCMIS)NoProcess is completePage 2Figure 1. Crash Data collection and reporting process flow diagram.7
Roadside inspection and crash data analysisreturned to BSP. Images of the NJTR-1 forms, which are used during the verificationprocess, are then uploaded to the New Jersey Department of Treasury Filenet Program.At the BSP, the data from the NJTR-1 forms are loaded from the data disk to a raw datatable. The crash data for each crash report is verified by the BSP staff. Images of theoriginal crash report are compared to the data that CTI has transcribed. In addition tothe verifier efforts, there are numerous other program edits that help with the erroridentification and verification process. The verification program edits identify errorsthrough color coding in red, yellow, and green fields that require additional attentionand/or approval. If a field is flagged for modification, the verifier reviews the image ofthe NJTR-1 form to determine what information should be in the corresponding datafields. If a field is flagged but there is no need to modify any information, the verifiermust accept changes made by the ARD application. The verifier then continues toverify the remaining fields. Every night the data that was verified that day goes througha nightly programmatic run that geo-codes the records and downloads it into the ARDproduction server. After these steps are completed, all crash records meeting FMCSAreportable crash criteria are exported to an ASCII text file and e-mailed to the BTS.At the BTS, the ASCII file is input into SAFETYNET. This process creates a log filewhich summarizes the results of the import. This file is then reviewed for errors andwarnings which may have occurred during in the import of the data. If there are fatalerrors listed in the log file, the ASCII text file is corrected using the SAFETYNET CrashFile Editor and the data merging process is re- run to import these corrected records.If there are no fatal errors listed in the log file or if they have previously been corrected,the SAFETYNET operator checks if there are any zip code or any other type ofwarnings listed in the log file. If this is the case, a set of queries are run in an attempt toprovide the information missing from the crash records. This information could includeunmatched crashes, intrastate with USDOT number, crashes with blank zip codes, orcrashes with passenger vehicles incorrectly marked as hazardous material carriers. Allof these records are then corrected by modifying them in SAFETYNET.After all errors are corrected, the SAFETYNET matching process is conducted on eachnew record. Those carriers that are not automatically matched during this process aresearched in the local SAFETYNET census file to allow for a match. After this process iscompleted, an export file is created by SAFETYNET and is electronically transferred tothe MCMIS FTP site. This transfer creates a communication log file which is checkedby the SAFETYNET operator for any fatal errors. If no fatal errors are found the crashrecord processing is completed. If the log documents any fatal errors, the error is thencorrected in SAFETYNET and the transfer is repeated.9
Roadside inspection and crash data analysisEvaluation of Current Crash Data Collection ProcessThe process is analyzed in terms of data quality and timeliness issues. These issuesare addressed as follows:Data QualityData quality cannot be improved without considering all the steps of the process. Thecrash data collection process can be considered in two parts:‣ External ProcessThis consists of local jurisdictions which gather the crash scene data.‣ Internal ProcessThis process starts at the BSP and ends at the BTS office.The NJDOT has no authority or control over the external process. In this area, furtherimprovement can only be achieved by taking steps such as personnel training andensuring effective collaboration with agencies. The following issues could be consideredas major problems in deficiency of data accuracy:‣ External ProcessSome investigating officers sent to the crash scene do not have clear understanding ofthe importance of obtaining accurate and complete data. One reason could be the lackof a comprehensive knowledge of the NJTR-1 data fields and the coding found in thisform. Some of the main issues found in the filled reports are; missing carrierinformation, USDOT number, and crash location. After the completion of the crashreports, no further evaluations are also performed on the quality of the crash reports tomeasure officers‟ performances.In practice, investigating officers spend more time completing the crash reportaccurately when crash severity is high (fatal or incapacitated injuries). Police officershave to be educated to realize the importance of the accuracy of each record inanalyzing crashes that assist police officers in a bottom line.These issues demonstrate that the systematic performance evaluation, continuouspersonnel training, and the collaboration between transportation agencies play vitalroles in obtaining an accurate data.‣ Internal Process10
Roadside inspection and crash data analysisDuring the verification process at the BSP, crash reports with errors or blank fields arenot sent back to the agencies for correction. Also, there is no routine evaluation systemto measure the frequency of errors, type of officers‟ mistakes, etc.Currently, the ARD system encounters fatal errors when some fields are left blank suchas carrier information (address, city, state) which are not collected in the crash scene. Inaddition, the blank fields are filled with faulty information such as filling carrierinformation with an owner‟s information. Though, the ARD system performs well incapturing some errors, not all FMCSA data have a check point in this system such ascarrier zip code.Although BTS provides reports on accuracy etc. to BSP, there are no trained anddedicated personals to correct problems. More collaboration between BSP and BTS hasto be established addressing the FMCSA data elements and improving the process (4) .Timeliness Issues‣ External ProcessWhile the reporting agencies should submit a crash report within 5 days, in practice, thisguide line is not followed. According to the NJDOT, the average time to receive a crashreport is about 3 weeks from the crash date. However, it sometimes takes about 3months or more. Backlog is another issue affecting accuracy and timeliness which isdiscussed in the following.‣ Internal ProcessAfter receiving the crash report from the reporting agencies, the BSP starts three mainsteps before sending the FMCSA data elements to the BTS office. The first stepperformed by the BSP is reports‟ patch preparation which generally takes one week tocomplete. If there is a missing page, the report is to be set back to the reportingagencies for rectification. This normally occurs within a week.In the second step, vendors key the data and return it to the BSP which generally takestwo weeks. The third step is to verify the data and prepare FMCSA data elements forthe BTS office which takes about 10 days. After receiving the FMCSA data elements,the BTS may take days to a week to transfer the data to MCMIS. As a result, the entireinternal process takes about 6 weeks. Our evaluation, however, shows that there is apotential for process improvement and possible solutions to decrease the process time.A summary of process issues and associated recommendations are as follows:11
Roadside inspection and crash data analysisCrash Data Collection Process IssuesA classification of crash data collection process issues are as follows: Data Gatheringo There is no evaluation and tracking process for agencies‟ performance.It would be helpful if the role of each individual agency involved in theprocess was made clear for all data integrity and timeliness issues. Forexample, the evaluation results should embrace the answer for thefollowing questions:- Which data fields are being filled inaccurate, incomplete orunreadable in each agency?- How each individual officer is performing and what is thecorrelation between the errors and his/her role?- What is the rank of agencies based on their performance?- What are their training needs?- In what manner training was helpful for each agency and forindividual officers?- What is the improvement rate in comparison with theprevious evaluation?o The quality of the data reported varies based on crash severity andjurisdiction.The quality of data and report transferring within a defined time framedepends on severity of crash and the preparation of the report. Also, thetime of the year when a crash happens is another factor that affects thereporting process. For instance, in practice, the accuracy of reportedcrashes occurred in the beginning of the year are much better thancrashes reported in the end of the year.o Backlog affects data accuracy and timeliness.Although backlog is forced from the external processes to the internalprocesses, this may affect the performance of internal processes likeverification process. More collaboration and training among the involvedagencies can reduce this effect.o Some agencies are not aware of the NJDOT role and requirements.There is a lack of good understanding of the NJDOT role and theimportance of crash data in some reporting agencies that affects thereporting process and data quality. More collaboration, focused trainingprograms, and a feedback system can have a crucial impact on theimprovement.12
Roadside inspection and crash data analysiso The chance of losing data at the scene is increased due to other issuesinvolving an accident (towing, legal process, medical care).There is a chance when the vehicle is towed from the crash scene ormedical emergency is needed, some of data needed for accuracypurposes will be missed. For example, the report might not have the finaldiagnosis of injured people after they are taken to the hospital (he/ shemight die at the hospital), or driver/passenger information.o Crash report (NJTR-1 form) is not always submitted by reporting agencieswithin a 5-day period.o Some of the FMCSA required data elements are not in the NJTR1 Form.All FMCSA elements which are the basis for state evaluation are not beinggathered by the NJTR-1. These elements are the license class code,carrier address, intrastate, and interstate. In addition, other data elements,such as carrier and USDOT information, which are part of the collectionprocess, are not properly prepared.o NJTR-1 errors:- Blank fields- Erroneous fields- Mismarked fields- Illegible fields Verification and Analyzing the Process and Datao Crash reports with errors (blank fields, erroneous and unreadable data,etc.) are not sent to the police departments (no feedback).o Data collection and preparation take a long time (from Crash date totransferring to MCMIS).o Inaccuracy of data is increased when data is unreadable by vendor.o If more that 25 percent of data is unreadable in the NJTR-1, report is notadded to the system. (4)o The FMCSA data fields, which are the basis for the NJDOT evaluation bythe FMCSA, need more attention. Accuracy and completeness of theFMCSA elements are being treated as other data elements in theverification process. No extra efforts, priority or check points are observedfor the FMCSA data elements.o ARD system has default values which are not accurate for some of theFMCSA data fields (e.g., carrier name, carrier state).o Required checkpoints for critical fields in SAFETYNET and MCMIS are notenough. All critical data fields (FMCSA data elements) need to be checked13
Roadside inspection and crash data analysisfor accuracy and completeness. As we were informed, SAFETYNETignores any blank field even for the critical data fields (blue colormandatory)as an error. Warning errors are ignored in the current process.There is still a chance that the data accepted in SAFETYNET will create anerror in MCMIS. If all the FMCSA data fields are being considered forevaluation metrics, SAFETYNET should not pass blank and inaccuratedata. In this area, the improvement would be necessary.o SAFETYNET has potential for improvement in recognizing completion ofdata fields.RecommendationsA set of recommendations for the crash data collection process issues are as follows: Data Gatheringo Expedite focused training program periodically for agencies- Bring awareness to the importance of officers‟ role for accuracy,completion, and timeliness.- Classify agencies and officers based on their performance andtraining needs.o Data from severe crashes needs more attention.More attention to the severe crash data in the verification process and BTSoffice can be very helpful for data analysis and safety improvementdecisions and tasks.o Collaboration is imperative to expedite sharing information process (e.g.NJMVC can help with Driver/ Vehicle information).Expedite the collaboration with other stakeholders like NJMVC to obtainaccurate data with a high rate of data completion.o Sharing information and strong cooperation with Fatality AnalysisReporting System (FARS) system may be helpful for completeness andaccuracy measures.FARS may be a good source to complete the incomplete report, or wronginformation.o The analysis of updating process for USDOT numbers and carrierinformation is necessary.The updating process for USDOT number and carrier information is notunder control of NJDOT. However, apart from focused training for lowperformanceagencies, a new vision for the whole process (from the timethat USDOT number or carrier information is created or updated) may14
Roadside inspection and crash data analysisreduce the cause of confusion of complex data gathering process byagencies. Different scenarios are involved when agencies are analyzingthe vehicle and driver documents to find accurate USDOT and carrierinformation. If the process is simplified from the beginning with someimprovements, greater accuracy and completeness will be added to thesystem.o All needed data elements of FMCSA should be gathered (e.g., licenseclass code). Verification and Analyzing the Process and Data (Internal Process)o A feedback system is needed for process improvement.o A monitoring, tracking, and evaluating system is needed for:- Type of errors, frequencies, and causes for improvement analysis.- Agencies‟ performance (accuracy, timeliness, completeness) andimprovement activities (problem classification, training activities,collaboration, etc.).o For timeliness issues, all the process steps need to be analyzed to findpotential improvements; such as- Reduce the batches for vendors with less cycle time for vendors (2weeks now).- Prioritize the NJTR-1 forms which meet the FMCSA criteria.o ARD system and verification processes have potential for enhancementwith a focus on FMCSA elements. If all FMCSA elements have checkpoints with a proper algorithm in ARD system, there will be less chance tohave inaccurate data.o User requirements and priorities should be cleared for BSP group.BTS office should clarify all requirements and data errors to BSP. Lack of asystematic feedback procedure may cause continuing adding inaccuratedata to the database, which can lead to a cumbersome task for data qualityimprovement process.o BTS personnel‟s training with SAFETYNET is necessary to ensure that allfeatures of the software are used correctly.o Matching Feature of SAFETYNET applying for inspection records (explainin details in the following section) should be applied for crash records to fixthe issues for the crash accuracy rate improvement.o Solution to problems at onset will offer efficiency improvements.We strongly recommend looking at the issues from the starting point anddetermining the causes to improve the data integrity and timeliness in15
Roadside inspection and crash data analysisfuture. For example, if a solution is considered for carrier information orUSDOT number issues, the data quality rate is increased.o Training and applying improvement approaches such as Six Sigma canfacilitate increasing productivity of overall process. TechnologyThe optimal solution for collecting precise information related to the driver andvehicle might be to swipe the driver license and send pertinent information toNJDOT instantaneously. The following alternatives can accommodate thecurrent situation:o Officers scan the document by a simple portable scanner at scene.o All agencies should be equipped with GPS.o Expedite crash data collection process electronically.16
Roadside inspection and crash data analysisInspection Data Collection Process AnalysisThe following section analyzes the inspection data collection process with a focus on dataintegrity and timeliness issues for further improvement steps. This information has beencollected after a set of interviews, meetings, documents analysis, and on-site visits.According to the inspection manual (2) , “a roadside inspection is an examination of a motorcarrier‟s commercial motor vehicle(s) and/or its driver(s). It is performed at a fixed orroadside facility and consists of examining the driver‟s hours of service, commercial driver‟slicense requirements, operating authority, financial responsibility, vehicle maintenance,hazardous materials, and other required items. A roadside inspection is intended to assessthe compliance of a company‟s motor vehicles and/or its drivers with FMCSA safety, andhazardous materials regulations. The inspection should be conducted in such a manner thatassures violations are not missed, overlooked, or unrecorded.”Overview of Current ProcessThe inspection process starts with collecting data either through Aspen software or apaper inspection form. Several groups in New Jersey empower to inspect CommercialMotor Vehicle (CMV): NJMVC, Port Authority Police (PAP), and NJ State Police (NJSP)(including Transportation Safety Bureau (TSB), NJ Turnpike (NJT), and Garden StateParkway (GSP)). These groups use Aspen to capture the data. After the inspection, theofficers send the file from ASPEN to SAFER; then, it is uploaded to SAFETYNET byNJDOT. After processing the data for possible errors, SAFETYNET sends the data toMCMIS and Safer (180 day mail box).Some inspectors who are transferred to other units may be completing paper inspectionforms because some of those units don‟t have access to computers. There are about 20inspectors who fall into this category. The minimum number of Level I & V inspectionsthat an inspector must complete is 32 per year in order to keep his/her certification. Inthe year 2007, the number of paper inspection forms completed was 3,186. Table 1contains the number of inspections completed through ASPEN and the paper inspectionforms corresponding to the year 2007. If the paper inspection form is used, it is sent tothe TSB to be keyed into SAFETYNET. The rest of the process is the same as ifASPEN software was initially used.17
Roadside inspection and crash data analysisStart with the Aspen SoftwareASPENSAFERNJ mail BoxSAFETYNETMCMIS180 dayStart with the Inspection formSAFETYNETMCMISFigure 2. Process of Inspection Data Collection.Table 1. Number of State-wide Inspections in the Year 2007.Process DetailsASPENPaperNJSP TSB 32,965 3,186NJSP GSP 837 N/ANJSP NJT 1,634 N/APAP 1,759 N/ANJ MVC 1,370 N/AIn the data collection and reporting process of roadside inspections, various entitiesparticipate in the overall process at different stages. The BTS office plays an importantrole in the overall process. Their role will be further discussed the data collection andreporting process for roadside inspection, the in-process relationship among theseentities, and how they collaborate along the process.When a roadside inspection is performed, the inspector must decide whether he/shecan collect data electronically utilizing ASPEN, which runs on laptops. If the electronicdata collection is feasible, then the inspector collects and sends the data to the SAFERInbox by means of wireless air cards. However, in some rare instances, the electronicsubmissions are delayed because of connectivity issues, such as poor wireless signal(e.g., hills and high-peak times). These submissions are likely to be sent the next time18
Roadside inspection and crash data analysisthe inspector performs an inspection. On average, inspection records are submittedwithin a 2 to 3 day timeframe.The staff at the BTS office downloads the inspection records from the SAFER Inbox andimports into SAFETYNET. After each SAFETYNET import process, a log file is createdby the system and it is reviewed for errors. If there are fatal errors in the log file, thenthe records are not imported to SAFETYNET and the BTS office e-mails the log file tothe NJSP Headquarters. The NJSP review the log files for errors and warnings. If thereis a recurring warning, this matter is discussed with the inspector. If the log files stillcontain fatal errors, the inspector is asked to correct the ASPEN record. Then, theAspen file is sent to the SAFER Inbox again.If no errors are found after the inspection record is downloaded from the SAFER Inboxinto the SAFETYNET, “Matchware” tool is utilized. The SAFETYNET matching processor standard procedure is performed on records. If the carrier information is not matchedduring this process, this information is entered into the local SAFETYNET census file toallow for a match. The SAFETYNET export file is then electronically transferred to theMCMIS-FTP site and a confirmation report is generated by the system and is placed inthe State‟s MCMIS mailbox. This confirmation report is retrieved and it is checked forerrors. If there is a fatal error, the inspection record is e-mailed to the State PoliceTransportation Safety Bureau and it is corrected by the modus operandi which waspreviously discussed. If no fatal errors appear in the confirmation report the process iscomplete.If the electronic data collection is not possible, then the roadside inspector manually fillsout the paper inspection form. These inspection reports are batched and delivered tothe supervisor who sends the paper forms to the NJSP headquarters for entry intoSAFETYNET. After the paper inspection forms are entered into SAFETYNET, matchingprocesses are performed on all records (electronic & paper form) for error‟s checking.Forms with errors are carefully examined and an attempt is made to correct the erroron-site. If such attempt fails, the forms are sent back to the inspector to be corrected.The inspector has the responsibility to fix the data on the inspection forms, which aresent to the field supervisor for a final review. The field supervisor then delivers thereports to the TSB. The inspection reports are inputted to SAFETYNET once again, andit is checked if any error exists.If no errors are found in the data obtained from the paper inspection forms or if the datahas been corrected on-site, then the SAEFYNET matching process is performed usingthe “Matchware” tool on new entered records. The data collection process is shown inFigure 3.19
Roadside inspection and crash data analysisRoadside InspectionNoCan ASPEN beused?YesIf not using ASPEN, paper inspection form is filledoutInspectors send inspection record to theSafer Inbox using wireless aircardsInspector delivers paper copies to supervisorSupervisor sends paper forms to State Police forentry into SAFETYNETInspection records are downloaded fromSafer InboxInspection data is manually keyed intoSAFETYNETASCII file uploaded to SAFETYNET.Log file is created and reviewedYesDoes formcontainerrors?NoNoFatal errors inlog file?YesIncomplete and erroneousforms are examinedMatchware tool is utilized on eachrecordCan forms becorrected onsite?YesSAFETYNET generates exportfile which is transferred to MCMISLog file is e-mailed tothe State PoliceNoForms returned toinspectorState Police correctsdata on-siteNoAny fatal errorsin confirmationreport?YesState Police review log file forerrors and warningsInspector correctsformNoAny fatalerrors in logfiles?YesNoIs it an errorfrom an ASPENrecord?Process completeYesEndInspector corrects data inASPENFigure 3. Roadside Inspection Data Collection and Reporting Process Flow Diagram.20
Roadside inspection and crash data analysisEvaluation of Inspection ProcessThe focus of inspection process evaluation is on the data collection process and theinspection tasks. The issues which may affect data quality and timeliness are discussedin the following:When the inspection is started, using either ASPEN or paper form, the inspector selectsthe level of inspection. Physical on-the-road inspections of CMV and their drivers fallinto five „levels.‟ In the U.S., a Level I inspection is the most comprehensive inspection,focusing on all aspects of the driver and the vehicle. A Level II inspection consists of a„walk around‟ (no under carriage inspection) as well as inspection of the driver‟scredentials; and the Level III inspection focuses specifically on the driver. Level IV is aone-time special inspection of a particular item. Level V inspection is conducted withouta driver present for vehicle‟s faulty points at the carrier facility. The level selection isbased on human judgment and depends on several factors, such as inspection historyof the truck, weather condition, and traffic at the station. These factors may affect dataaccuracy such as collection of correct USDOT number, carrier information and safetyissues.Although inspectors have the ability to see if a truck was previously stopped and theycheck if previous recommendations were actually implemented, this ability is true onlyfor ASPEN application, not for paper form. The driver receives a copy of the inspectionreport and if any deficiencies are found, it is the drivers and carriers responsibility to fixthe issues. Sometimes drivers or vehicles are placed to be out-of-service until thedeficiencies are corrected. Driver signature is required acknowledging a receipt of theinspection copy and it is the carrier or driver‟s responsibility to fix a problem. In case thata mechanical problem would be an issue, they are required to return a form signed bythe mechanic. The issue is that the request for fixing violations or receiving approvalfrom the carrier/driver after taking care of mechanical problems is not tracked. In otherwords, if no response is received, inspectors do not follow up the case. (5) Often,mechanical repairs are not made and drivers may face criminal charges if and only ifthey are involved in an accident that may have been caused by a mechanical failure.After utilizing ASPEN, the inspector has a choice to send the inspection information toSAFER or save the information on the laptop and send it later. Every effort should bemade to upload the inspections on a daily basis. If a daily upload is not possible,inspections should be uploaded within five (5) business days of the inspection closeoutdate. However, if the inspector fills out the paper inspection form instead of ASPEN, itmay take up to a couple of weeks to transfer the data to SAFETYNET.21
Roadside inspection and crash data analysisEven though, the information transferring to SAFER is not a bothersome task and it canbe performed in one minute, it is postponed in some cases. This postponement causestardiness or in the worst scenario, the inspector may forget to send the record toSAFER later. Timely transfer of data to SAFER is an indispensable task and it isreferred by FMCSA.Technical issues may force inspectors to postpone uploading information to SAFERimmediately but that is rare. The main concern is the lack of attention from inspectorswhich can negatively impact issues of timeliness and data accuracy. Lack of a tracking,monitoring, and feedback system for the inspectors‟ performance may make theimprovement process problematic.As part of the processing of data in the BTS office, reports with errors are sent back tothe inspectors to review the record and fix it. However, there is no feedback or trackingsystem to assure that the error will eventually be fixed and send back to SAFETYNETand the BTS office.Another issue is related to the inspection premise and operating hours of inspectionfacilities. One type of locations where inspections can be conducted is scale houses. Ifthe scale house is open, the driver must stop since they are required by law. However,many truck drivers bypass the inspection area and are not inspected since it is verydifficult to monitor every single truck that is approaching the weigh station. It was notedthat the amount of CMV that are inspected is affected by the lack of resources(equipment, manpower, etc.). Also, there is no 24-hour inspection in all stations whichmeans that the inspection data for all commercial vehicles may not be gathered. Table 2contains the list of NJSP inspection facilities and their hours of operation.Table 2. Operating Hours of Inspection Facilities.DivisionNJSP TSBFacilityLocationI-78 GreenwichScale East andWest (2)I-295 CarneysPoint Scale North(1)Hours of OperationMonday thru Friday,6am - 12amSaturday, 6am - 4pmSunday, 2pm -12amMonday thru Friday,6am - 12amSaturday, 6am - 4pmSunday, 2pm -12amTotal Number ofHours per Week110 hours110 hoursI-80 Knowlton No set hours No set hours22
Roadside inspection and crash data analysisScaleI-287 PiscatawayScaleHerbertsvilleInspection siteNo set hoursNo set hoursNJSP GSPMonday thru Friday,6am - 4pm50 hoursThe mismatch of the carrier information and USDOT numbers are the other mainconcerns for data integrity. Several reasons are involved, such as:o Lack of sufficient training, especially among younger troopers who are notfamiliar with the system.o Not enough questions asked from the driver or sometimes the driverdoesn‟t know for whom he/she is working.o Drivers provide misleading information.o USDOT number may be difficult to identify since different situations mayapply for different drivers. The carrier isn‟t always the one responsible forthe load.o USDOT numbers must be changed within 30 days when the operatingcircumstances have changed for a motor carrier.o The Federal regulation is that any information pertaining to the motorcarrier must be updated every two years.Recommendationso Expedite focused training program for agencies to:- Bring awareness about the importance of officers‟ role for accuracy,completion, and timeliness.- Classify agencies and officers based on their performance andtraining needs.o A monitoring, tracking, and evaluating system is needed for:- Type of errors, frequencies, and causes for improvementanalysis.- Agencies‟ performance (accuracy, timeliness, completeness)and improvement activities (problem classification, trainingactivities, collaboration, etc.).- Errors and requested information to fix the issues (from BTSoffice to inspectors – a feedback system).- Reinspection of the vehicle after presenting the correctionverification, especially for mechanical problems.23
Roadside inspection and crash data analysis- Drivers who bypass the inspection stations.o Evaluation of the required resources (trained troopers, equipments, etc.)should be performed for each station in order to guarantee a high qualityinspection.o Analysis of update process for USDOT number and carrier information isnecessary.o The updating process for USDOT number and carrier information is notunder control of NJDOT. Apart from focused training for low-performanceagencies, a new vision for the whole process (from the time that USDOTnumber or carrier information is created or updated) may reduce thefactors causing confusion of complex data gathering process by agencies.Different scenarios are involved when agencies are analyzing the vehicleand driver documents to find accurate USDOT and carrier information.o All personnel‟s involved in SAFETYNET should have sufficient training toensure that all features of the software are used correctly.24
Roadside inspection and crash data analysisMethodology for State Safety Data QualityIn this section, NJ measures are analyzed based on the methodology for State SafetyData Quality (SSDQ). The FMCSA developed the Methodology for SSDQ to assess thecompleteness, timeliness, accuracy, and consistency of the commercial motor vehiclecrash and inspection records for each state. These records are available on the MotorCarrier Analysis and Information Resource (A&I) website.The SSDQ utilizes a 12-month timeframe which generally expires three months prior tothe MCMIS snapshot. Therefore, the inspection and crash records used in this reportoccurred during the 12-month time period, not taking into consideration when thoserecords were uploaded to MCMIS.On a monthly basis, the quality of the data is evaluated and each state receives a ratingof “Good,” “Fair”, or “Poor” for seven SSDQ measures. The Overall State Rating iscalculated based on individual ratings and an overriding Indicator. In addition to theOverall State Rating, each state receives a Crash Rating based on the SSDQ CrashMeasure and the Overriding Indicator. (1)According to this methodology, the NJ measures are analyzed, including thosemeasures that require immediate attention in order to improve the Overall State Ratingand Crash Rating. It will be further discussed the methodology utilized in each of theseratings and measures based on the FMCSA information. It will also be included thesummary charts corresponding to each rating and measures. The data pertaining to thesummary charts corresponds to the monthly results as of February 22, 2008. Theseresults are available in the Federal Motor Carrier Safety Administration website. (1)Methodology ReviewOverall State RatingThe Overall State Rating is calculated considering all seven SSDQ measures and theOverriding Indicator. However, measures with a rating of “Insufficient Data” areexcluded from the Overall State Rating calculations. The SSDQ measures considered inthe Overall State Rating are enumerated as follow:1) Crash Record CompletenessI. Driver Identification Completeness EvaluationII. Vehicle Identification Completeness Evaluation2) Non-Fatal Crash Completeness3) Fatal Crash Completeness25
Roadside inspection and crash data analysis4) Crash Timeliness5) Crash Accuracy6) Inspection Timeliness7) Inspection AccuracyThe Overall State Rating is assigned using the following rules:Crash Rating1) A state that has received a “red flag” will be automatically rated “Poor”2) A state that has at least one “Good” measure and no “Poor” measurereceives a “Good” rating3) A state that only has one “Poor” measure will receive a “Fair” rating4) A state with two or more “Poor” measures will receive a “Poor” ratingThe crash rating is calculated taking into consideration five SSDQ crash measures andthe Overriding Indicator. However, measures with a rating of “Insufficient Data” areexcluded from the Crash Rating calculations. The SSDQ measures considered in theCrash Rating are enumerated as follow:1) Crash Record CompletenessI. Driver Identification Completeness EvaluationII. Vehicle Identification Completeness Evaluation2) Non-Fatal Crash Completeness3) Fatal Crash Completeness4) Crash Timeliness5) Crash AccuracyThe Crash Rating is assigned using the following rules: (1)1) A state that has a “Red Flag” is automatically rated “Poor”2) A state with at least one “Good” measure and no “Poor” measuresreceives a “Good” rating3) A state with only one “Poor” measure receives a “Fair” rating4) A state that has two or more “Poor” measures receives a “Poor” ratingCrash Record Completeness MeasureThe Crash Record Completeness Measure consists of fatal and non-fatal crash recordswhich come from interstate and intrastate carriers. The rating is based on thecompleteness of driver and vehicle crash data reported to the Federal Motor CarrierSafety Administration. The completeness of the driver data and vehicle data are26
Roadside inspection and crash data analysisevaluated separately and their results are averaged together. In order to determine thecompleteness of the crash record, information from both the Driver IdentificationCompleteness Evaluation and the Vehicle Identification Completeness Evaluation isused.The Driver Identification Completeness Evaluation is the percentage of state-reportedfatal and non-fatal crash records in the MCMIS database. Only those records withcomplete driver information corresponding to crashes that have occurred over a 12-month time period are part of the MCMIS database. A crash record reported by a stateis considered complete only when the following information is provided:1) Driver license number2) Driver date-of-birth3) Driver first name4) Driver last name5) License classAdditionally, if any of the items previously enumerated are absent in the DriverIdentification Completeness Evaluation, the crash record is considered incomplete.The Vehicle Identification Completeness Evaluation is the percentage of state-reportedfatal and non-fatal crash records in the MCMIS database. Only those records withcomplete vehicle information which correspond to crashes that have occurred over a12-month time period are part of the MCMIS database. A crash record reported by astate is considered complete only when the following information is provided:1) Vehicle identification number2) License plate number3) Vehicle configuration4) Cargo body type5) Gross vehicle weight ratingAdditionally, if any of the items previously enumerated is absent in the VehicleIdentification Completeness Evaluation, the crash record is considered incomplete.The crash record completeness rating is assigned using the following rules: (1)1) If the percentage of completed driver and vehicle information is greateror equal to 85% (>= 85%), then the Crash Record Completeness ratingwill be “Good.”27
Roadside inspection and crash data analysis2) If the percentage of completed driver and vehicle information isbetween 70% and 84% (70-84%), then the Crash RecordCompleteness rating will be “Fair.”3) If the percentage of completed driver and vehicle information is lessthan 70% (< 70%), then the Crash Record Completeness rating will be“Poor.”Non-Fatal Crash CompletenessIt is defined as the percentage of Non-Fatal Crash Records Reported. Non-Fatal CrashCompleteness Measure assesses crash records that represent interstate and intrastatecarriers. Also, it includes large trucks and bus vehicle types. The number of reportednon-fatal crash records is calculated using a 12-month time period that ends six monthsprior to the MCMIS snapshot date.Furthermore, the number of non-fatal reportable crash involvements is predicted using astatistical model with data from eight states. Since the crash data reported by individualstates has a large variability, the Non-Fatal Crash Completeness Measure serves as aguideline to determine if a state‟s non-fatal crash reporting fall within an expected range.The percent Non-Fatal Crash Completeness is found using the following equation:% Non-Fatal Crash Completeness =Number of reported non-fatal crash recordsNumber of predicted non-fatal crash recordsThe Non-Fatal Crash Completeness rating is determined using the following rules: (1)1) If the percentage of non-fatal crash records reported is greater or equalto 75% (>= 75%), then the Non-Fatal Crash Completeness rating willbe “Good.”2) If the percentage of the non-fatal crash records reported is between50% and 74% (50-74%), then the rating will be “Fair.”3) If the percentage of non-fatal crash records reported is less than 50%(< 50%), then the Non-Fatal Crash Completeness rating will be “Poor.”4) If the state has less than 15 average number of fatal crash records andthe percentage of non-fatal crash records reported is less than 50%,then the Non-Fatal Crash Completeness rating is defined as“Insufficient Data.”28
Roadside inspection and crash data analysisFatal Crash CompletenessOnly those crash records that correspond to large trucks that have been involved in fatalcrashes are evaluated by the Fatal Crash Completeness measure. These crashes musthave been occurred within the calendar year. This measure determines a rating basedon a comparison of the number of state-reported fatal crash records in MCMIS to thenumber of fatal crash records reported in the Fatality Analysis Reporting System(FARS). FARS is the national database of fatal motor vehicle crashes maintained by theNational Highway Traffic Safety Administration (NHTSA). (1)The Fatal Crash Completeness rating is determined as follows: (1)1) If the MCMIS as a percentage of FARS is greater or equal to 90% (>=90%), then the rating is “Good.”2) If the MCMIS as a percentage of FARS is between 80% and 89% (80-89%), then the rating is “Fair.”3) If the MCMIS as a percentage of FARS is less than 80% (< 80%), thenthe rating is “Poor.”4) If a state has less than 15 (< 15) FARS records and MCMIS as apercentage of FARS is less than 80% (< 80%), then the rating isdefined as “Insufficient Data.”Crash TimelinessThe Crash Timeliness is the percentage of Crash Records reported within 90 days. Thismeasure evaluates fatal and non-fatal crash records including large trucks and busvehicles types corresponding to interstate and intrastate carriers. The Crash Timelinessdetermines the rating based on the percentage of crash records reported to FMCSAwithin 90 days over a 12-month period.The Crash Timeliness rating is determined as follows: (1)1) If the percentage reported within 90 days is greater or equal to 85%(>= 85%), then the Crash Timeliness rating is “Good.”2) If the percentage reported within 90 days is between 60% and 84%(60-84%), then the rating is “Fair”.3) If the percentage reported within 90 days is less than 60% (< 60%),then the Crash Timeliness rating is “Poor.”29
Roadside inspection and crash data analysisIf the state has less than 15 (< 15) records reported in current timeframe and thepercentage reported within 90 days is less than 60% (< 60%), then the rating is definedas “Insufficient Data.”Crash AccuracyThe Crash Accuracy is the percentage of matched crash records. It evaluates fatal andnon-fatal crash records that correspond to interstate and intrastate carriers transportinghazardous materials. Additionally, this measure includes large trucks and bus vehicletypes. This measure determines a rating based on the percentage of crash recordsreported by the state over a 12-month period that were matched to a companyregistered in MCMIS. (Crash records entered per FMCSA's "Procedures for EnteringCrashes without Carrier Identification into SAFETYNET" are not evaluated by thismeasure.). The crash accuracy rating is determined as follows: (1)1) If the percentage of matched records is greater or equal to 95%, thenthe rating is “Good.”2) If the percentage of matched records is between 85% and 94% (85-94%), then the rating is “Fair.”3) If the percentage of matched records is less than 85% (
Roadside inspection and crash data analysisInspection Accuracy3) If the percentage reported within 21 days is less than 60% (< 60%),then the Inspection Timeliness rating is “Poor.”Inspection Accuracy is the percentage of matched inspection records. It evaluatesinspection records that correspond to interstate and intrastate carriers. Large trucks andbus vehicle types are included in this measure (1) . The rating is based on the percentageof inspection records reported by the States over a 12-month period that were matchedto a company registered in MCMIS. The Inspection Accuracy rating is assigned usingthe following rules: (1)1) If the percentage of matched records is greater or equal to 95% (>=95%), then the Inspection Accuracy rating is “Good.”2) If the percentage of matched records is between 85% and 94% (85-94%), the rating is “Fair.”3) If the percentage of matched records is less than 85% (< 85%), thenthe Inspection Accuracy rating is “Poor.”Overall Indicator: Crash ConsistencyThe Crash Consistency is the percentage of state-reported non-fatal crash records. Itassesses non-fatal crash records which correspond to interstate and intrastate carriers,including large trucks and bus vehicle types. A red flag is assigned to those states thathave reported less than 50% of non-fatal crash records for the current 12-month periodcompared to the yearly average, based on the previous 36-months. (1)The Crash Consistency Overriding Indicator Flag is assigned as follows: (1)1) If the estimate reported is greater or equal to 50% (>= 50%), then noflag is assigned.2) If the estimate reported is less than 50% (< 50%), then a red flag isassigned.3) If a state has less than 15 (< 15) records reported in current timeframeand a state has less than 15 (< 15) records reported in previous 3 yearaverage and Estimate Reported is
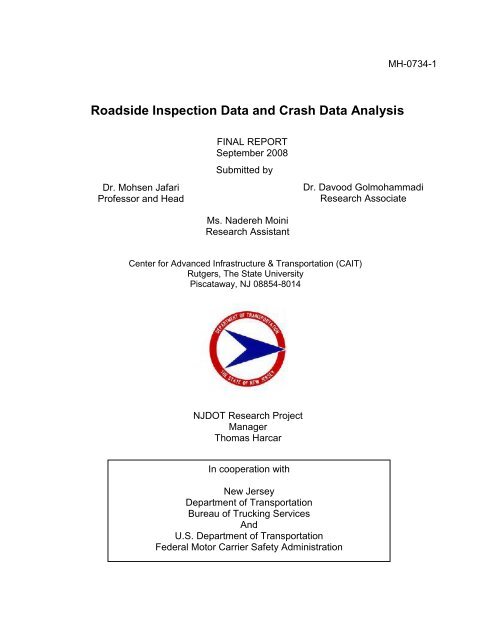
Roadside inspection and crash data analysisNJ State Ratings and SSDQ Measures EvaluationOverall State RatingThe Overall Sate Rating Report summarizes the ratings of the SSDQ measures for thestate of New Jersey. It can be observed in Figure 4 that the Crash RecordCompleteness and Crash Accuracy have “Poor” ratings while Crash Timeliness has a“Fair” rating. Additionally, Figure 4 shows that the Fatal and Non-Fatal CrashCompleteness Measure and the measures of Inspection Timeliness and InspectionAccuracy have maintained their “Good” rating. However, the Overall State Ratingcontinues to be “Poor” because a state with two or more “Poor” measures receives anoverall “Poor” rating.It can clearly be inferred that the following critical SSDQ measures need urgentattention in order to improve the Overall State Rating:1) Crash Record Completeness2) Crash Accuracy3) Crash Timeliness32
Roadside inspection and crash data analysisCrash RatingFigure 4. NJ Overall State Rating Report.The Crash Record Completeness and Crash Accuracy measures have “Poor” ratings asshown in Figure 5. Consequently, New Jersey‟s Crash Rating is “Poor” because it hastwo or more “Poor” measures. Additionally, the Crash Timeliness measure has beenrated as “Fair” which may indicate that this measure could potentially become a “Poor”rating if no efforts are made for improvement.33
Roadside inspection and crash data analysis‣ Critical SSDQ Measures for NJFigure 5. NJ Crash Rating ReportAs mentioned, the following measures need serious attention:• Crash Record Completeness MeasureThe data pertaining to the Crash Record Completeness Report can be observed inFigure 6. Data has been available starting September 2007 when the newmeasurement methodology was implemented. In Figure 6, it can be observed that 0%of the Driver Identification Completeness Evaluations have complete information in thecrash record. In contrast, only 56% of the Vehicle Identification CompletenessEvaluations have all the information required in the crash record. Therefore, the CrashRecord Completeness Measure is rated as “Poor” because the average percentage ofcompleted driver and vehicle information is 28% which is less than 70%.34
Roadside inspection and crash data analysisFigure 6. Crash Record Completeness Report.In Figure 7, it can be observed the number of crash records evaluated in the last sixmonths and the number of those records that comply with the requirements of the DriverIdentification Completeness Measure. In February 2008, only one crash record hadcomplete driver information. Additionally, it may be observed from Figure 7 how manycrash records have the required information for each of the fields in the DriverIdentification Completeness Evaluation. For instance, in February 2008, 7,504 crashrecords were evaluated and only one crash record contained the license class. Eventhough more than 93% of the records specified at least the license number, date ofbirth, or first and last name; it was reported that 0% of the crash records complied withthe Driver Identification Completeness Measure because only one crash recordspecified the license class.35
Roadside inspection and crash data analysisFigure 7. Driver Identification Completeness Report.Figure 8 shows the number of crash records that comply with the requirements of theVehicle Identification Completeness Measure. In February 2008, 4,201 crash recordswere considered as records with complete vehicle information. Additionally, it can beobserved that Cargo Body Type and Gross Vehicle Weight Rating (GVWR) are themost commonly missed vehicle information fields. Further actions need to be taken toincrease the completeness of these fields in the report.• Crash Accuracy MeasureFigure 8. Vehicle Identification Completeness ReportA graphical representation of the percentage of matched records in the past thirteenmonths is depicted in Figure 9. These matched records correspond to the CrashAccuracy Measure. Although there has been a consistent betterment of the matchedpercentages in the past months, the measure is still rated as “Poor” and more effortsshould be made to improve this rating. The right application of matching feature ofSAFETYNET can have a significant improvement on the accuracy rate.36
Roadside inspection and crash data analysis• Crash Timeliness MeasureFigure 9. Crash Accuracy Measure.Since the percentage of crash records reported within 90 days is greater than 60% butless than 84% starting in September 2007, the Crash Timeliness rating is “Fair.”Although some improvement has been made in the year 2007 with respect to this rating,more efforts must be made in order to achieve a higher rating. Figure 10 shows therating that has been assigned to the Crash Timeliness Measure in the last thirteenmonths.37
Roadside inspection and crash data analysisFigure10. Crash Timeliness Measure.‣ Non-critical SSDQ MeasuresThe following measures show a good performance for the State of NJ, but continuousimprovement is an ongoing process to be in a better stage.• Non-Fatal Crash Completeness MeasureIn Figure 11, it can be observed the data pertaining to the Non-Fatal CrashCompleteness Measure corresponding to the last six months. The rating for the Non-Fatal Crash Completeness Measure is “Good” because the percentage of non-fatalcrash records is well beyond the lower limit (75%).38
Roadside inspection and crash data analysis• Fatal Crash Completeness MeasureFigure 11. Non-fatal Crash Completeness Measure.The comparison of the number of state-reported fatal crash records in MCMIS to thenumber of fatal crash records reported in FARS can be observed in Figure 12. It canalso be observed that the MCMIS as a percentage of FARS is greater than 90%; thus,the rating of the Fatal Crash Completeness Measure is “Good.” This has been the casein the last twelve months.39
Roadside inspection and crash data analysis• Inspection Timeliness MeasureFigure 12. Fatal Crash Completeness Measure.The percentage of inspection records reported within 21 days can be observed in Figure13. Even though the Inspection Timeliness Measure has consistently been rated as“Good,” there have been some instances in which the percentage of inspection recordhas been very close to 85%, which is the lower limit of the “Good” rating. The InspectionTimeliness Measure deserves further attention in order to ensure its continued rating of“Good” and find ways to improve the overall measure.40
Roadside inspection and crash data analysis• Inspection Accuracy MeasureFigure 13. Inspection Timeliness Measure Report.In Figure 14, it can be observed that the rating of the Inspection Accuracy Measure is“Good”. Starting May 2007, the percentage of matched records has been equal orslightly greater than 95%, which is the lower limit of the “Good” rating. More efforts canbe made to improve the Inspection Accuracy Measure and ensure its continued rating of“Good.”41
Roadside inspection and crash data analysisFigure 14. Inspection Accuracy Measure Report.• Crash Consistency Overriding IndicatorFigure 15 shows the Crash Consistency Overriding Indicator corresponding to the lastthirteen months. In all instances the reported estimate has been greater than 50%; thus,no flag has been assigned over such period of time. Therefore, this indicator is not aconcern.42
Roadside inspection and crash data analysisSummary of IssuesFigure 15. Crash Consistency Indicator Report.A summary of discussed issues based on SSDQ Measures for The state of NJ is asfollows: Overall State Rating• Crash Record Completeness Measure, Crash Accuracy, and CrashTimeliness need urgent attention in order to improve the Overall State Rating‣ Crash Record Completeness Measure• Crash record Completeness Measures shows that Driver IdentificationCompleteness Evaluation is 0%, while the Vehicle IdentificationCompleteness Measure is 56%. Thus, the Crash Record CompletenessAverage is 28%. This Average is well below the lower limit for “Fair” rating.• The Driver Identification Completeness Evaluation is 0% because DriverLicense Class Code (DLCC) is the most commonly missed field in theNJTR-1 form. In fact, this field is not completed at all. If any of the required43
Roadside inspection and crash data analysisfields are missing in the Driver Identification Completeness Evaluation, thenthe record is considered incomplete.• The Vehicle Identification Completeness Evaluation is affected by the lackof completed Cargo Body Type and GVWR fields in the NJTR-1 form.‣ Crash Accuracy Measure• SAFETYNET matching process is not performed correctly, which have asignificant effect on Crash Accuracy Measure.• In the case of the Crash Accuracy Measure, there is not a clear distinctionbetween mandatory and non-mandatory fields. It is difficult to determinehow critical fields are when the rating for the Crash Accuracy Measure iscalculated.• In the Crash Accuracy Measure, the percentage of data missing, such asthe Carrier Identification Number, is not individually specified in the SSDQsystem, which may represent a difficulty when tracking missing fields.‣ Crash Timeliness• Although the Crash Timeliness Measure has been categorized as yellow,this measure needs more attention as it can be substantially improved.• Break down the overall process into its primary steps and identifybottlenecks and opportunities for reduction of the in-process time. Pleaserefer to Section 2.4 on more details about this approach.‣ Inspection Accuracy• The Inspection Accuracy Measure has been categorized as green. Sincethis measure is close to the border of rating as yellow, 1% above, thismeasure may need attention.A set of slides can be found in appendix four which summarizes the findings discussedin SSDQ measures for NJ.44
Roadside inspection and crash data analysisAPPENDIX TWO: COMMERCIAL MOTOR VEHICLE <strong>CRASH</strong> ANALYSESIntroductionA State‟s crash must have following elements and attribute sets to consider as a CMVcrash and meet the reporting criteria for SAFETYNET: (7)1. A fatal injury, an injury, or a person who needs immediate medical treatment.2. Disable, or tow away a Motor vehicle (MV).3. A truck or truck combination > 10,000 lbs. GVWR/GCWR.4. A bus with seats for 9 or more persons, including the driver.5. A vehicle of any type with a hazardous materials placard (includes auto, lighttruck, van, 10,000 lbs. or less).Figure 16. Reporting criteria for truck and Bus crashes extracted from FMCSA web site.Upon this defined characteristic, the series of analyses are developed for four years(2003-2006) of CMV crashes throughout the New Jersey roadway network. Theseanalyses contain the crash frequency evaluation on CMV crashes and CMV excludingbus crashes, trend of crash frequency, GIS representation of CMV crashes, and anidentification of the most frequent CMV crash locations categorized based on roadwayfunctional class.45
Roadside inspection and crash data analysisFrequency AnalysisThis section presents the frequency of CMV crashes in a tabular and graphical layoutwith respect to a single criterion such as crash type, light condition and crash year. Thisinformation extracted from NJTR-1 police form collected at the crash scene and filled byan investigating officer. The form contains 144 fields filling up five tables; crash, vehicle,occupant, driver, and pedestrian. Note that each crash can occur as the consequenceof involvement of one or more MV depending on a crash type; therefore, one or moreMV records in the vehicle table can be assigned to one crash record in the crash table.Same reading exists in a number of injuries and fatalities in one crash.In following, the evaluation on some crash fields found in vehicle and crash tables areprovided to assist the NJDOT-BTS determining causes of CMV crashes throughanalyzing the outcomes. It is necessary to mention that “NULL” rows in the followingtables indicate that no data is available for that field which can be as a consequence ofirrelevance of a field to crash circumstances (e.g. cargo body type for passenger car) oran inaccuracy in filling the form.The investigation on 21,343 CMV crash records and 42,703 vehicles involved in thesecrashes reveals that most crashes had “Rear End” crashes (Table 5) and occurred in aroadway segment (Table 6 “Not at intersection”), in a “Clear” weather (Table 7), and in a“Day light” (Table 8). Vehicles involved in crashes had “Van/Enclosed Box” body type(Table 9) and crashes occurred when vehicles were going “straight” (Table 10) in “Statehighway” roads (Table 11) ending with “Injury” (Table 12) and “Tow away” vehicles(Table 13). There were no significant differences between months of a year (Table 14),though week day presented more crashes than weekend (Table 15). Also, 2006presents slightly more crashes than any other years (Table 16).Comparing CMV and truck crashesTruck crashes are extracted from CMV crashes by excluding buses (> 9 seats) from thisset. An investigation on truck crashes performed based on their crash types (Table 17),roadway system (Table 18), annual (Table 19), and daily crashes (Table 20) comparingthis set with all CMV crashes. A comparison between these sets (trucks and all CMV)demonstrates that no significant difference can be distinguished and follows the samebehavior except occurring crashes in roadway system. Roadways classified as“Municipal” roads are in the third place for the most occurring CMV crashes; at thesame time, “State/interstate Authority” roads are in the third place for trucks crashes.This result can be interpreted clearly, since trucks present more in the main roadsincluding state highway, county, state and interstate more than “Municipal” roadstraveled by more buses.46
Roadside inspection and crash data analysisTrend AnalysisThis analysis investigates the linear trend of changes in a number of total crashes(Figure 22), injured (Figure 23), and killed (Figure 17) during the period of study in amonthly base. The examination demonstrates an escalation in a number of all abovementioned parameters.GIS AnalysisFigure 17. Trend of fatal injuries in crashes in a period of four years (2003-2006).Geospatial representation of CMV crashes in county level are presented thematically infigure 18. As legend shows, any county having less then 1057 CMV crashes is shown ingreen; a number of CMV crashes between 1057 to 1959 is illustrated in yellow andmore than 1959 is presented in red.Figure 18. Thematic representation of CMV crashes throughout NJ State on County level.47
Roadside inspection and crash data analysisCross Tabulation (Cross tab) AnalysisCross tab displays the joint distribution of two or more variables in a matrix format;whereas a frequency analysis performs an analysis on one variable as single crosstabulation. Table 3 depicts the cross tab analysis on CMV crashes based on the cargobody type of vehicle involved in crashes happening at or not at intersection in an annualbase. Table 4 illustrates the same analysis on truck crashes.Table 3. Annual number of vehicle involved in CMV crashes based on their cargo body type occurred ator not at intersection.Cargo Body Type2003 2004AtIntersectionNot AtIntersectionAt or nearRailroadCrossingAtIntersectionNot AtIntersectionBus (9-15 Seats)Bus (> 15 Seats) 584 751 3 563 781 3Van/Enclosed Box 493 1810 8 442 1765 8Cargo Tank 55 160 2 45 142 2Flatbed 100 255 2 114 325 1Dump 141 374 2 163 392 1Concrete Mixer 9 17 10 16Auto Transporter 33 82 34 98Garbage/Refuse 84 185 66 170Hopper (grain/ gravel/ chips)Pole (trailer)Intermodal ChassisNo Cargo BodyNULL 1496 3122 14 1497 3259 10Other 205 392 5 197 413 2At ornearRailroadCrossingCargo Body Type2005 2006AtIntersectionNot AtIntersectionAt ornearRailroadCrossingAtIntersectionNot AtIntersectionBus (9-15 Seats) 236 312 2Bus (> 15 Seats) 566 707 2 312 467 1Van/Enclosed Box 474 1699 2 373 1757 3Cargo Tank 58 149 40 158 1Flatbed 98 284 1 108 301Dump 155 387 162 407 2Concrete Mixer 11 24 9 22At ornearRailroadCrossing48
Roadside inspection and crash data analysisAuto Transporter 33 64 31 86Garbage/Refuse 84 156 66 156Hopper (grain/ gravel/ chips) 4 21Pole (trailer) 28 95Intermodal Chassis 16 47 1No Cargo Body 51 122NULL 1604 3232 8 1793 4261 2Other 181 340 2 8 18Cargo Body TypeTable 4. Annual number of trucks‟ crashes based on their cargo body type occurred at or not atintersection.2003 2004AtIntersectionNot AtIntersectionAt ornearRailroadCrossingAtIntersectionNot AtIntersectionBus (9-15 Seats)Bus (> 15 Seats) 18 26 15 34Van/Enclosed Box 464 1765 8 427 1735 8Cargo Tank 54 159 2 44 141 2Flatbed 97 253 2 112 322 1Dump 140 368 2 162 390 1Concrete Mixer 9 15 10 16Auto Transporter 19 71 22 84Garbage/Refuse 80 181 63 168Hopper (grain/ gravel/chips)Pole (trailer)Intermodal ChassisNo Cargo BodyNULL 1020 2579 12 1057 2714 9Other 168 332 4 154 352 2At ornearRailroadCrossingCargo Body Type2005 2006AtIntersectionNot AtIntersectionAt ornearRailroadCrossingAtIntersectionNot AtIntersectionBus (9-15 Seats) 10 22Bus (> 15 Seats) 15 28 25 23 1Van/Enclosed Box 442 1670 2 366 1731 3Cargo Tank 57 147 40 154 1Flatbed 95 281 1 108 299Dump 155 382 157 402 2At ornearRailroadCrossing49
Roadside inspection and crash data analysisConcrete Mixer 11 23 9 22Auto Transporter 26 50 28 75Garbage/Refuse 83 154 66 155Hopper (grain/ gravel/chips) 4 21Pole (trailer) 28 95Intermodal Chassis 16 47 1No Cargo Body 42 114NULL 1168 2668 8 1345 3655Other 149 284 2 8 16A percentage is estimated on each row of Table 3 & Table 4 with excluding “NULL”records and illustrated in Table 21& Table 22 to investigate the potential patterns incrash records. Comparison shows that the same percentages follow for each year &location except slightly change in 2006.Crash Rate AnalysisThe crash rate Method identifies hazardous crash locations by calculating the number ofcrashes per million vehicles for intersections and crashes per Hundred Million VehiclesMile Traveled (HMVMT) for roadway segment (see reference 7, 8, 9, and 10.) . In this study, MillionVehicles Mile Traveled (MVMT) is used for roadway segments and intersection, sinceNJDOT applies this rate for crash normalization. VMT is being estimated from theAverage Annual Daily Traffic (AADT) and length of roadway segments (L). Crash rate iscalculated by:Crash rate = CR S =NAADT6*10* L*Y * n(1)Where,N = number of crashes in defined period of timeL = length of roadway segments. For intersection this amount equals to one.n= Number of yearsY = 365 daysWhereas Annual Average Daily Truck Traffic (AADTT) is not available for NJ road waysegments, the study utilizes the AADT.Federal High Way Administration (FHWA) - Safety division requires States to introduceat least 5 percent of their sites currently exhibiting the most severe highway safetyneeds. (see reference 7,10, 11, and 13.) In respond, States represent their methodology to locatethese high crash spots. Derived from reviewing 51 States‟ reports, crash rate is50
Roadside inspection and crash data analysisperformed by 9 states to monitor their crash sites (as of Jun 07). Major deficiency of thismethod is assuming that crash frequency and volume has a linear relationship, which isnot applicable in all time. Therefore, some locations with low volumes could be rankedin a list of unsafe locations incorrectly.Roadways throughout NJ are categorized in twelve classes including rural interstate,rural principal arterial, rural minor arterial, rural major collector, rural minor collector,rural local, urban interstate, urban freeway/expressway, urban principal arterial, urbanminor arterial, urban collector, and urban local. In this study, crash rates are calculatedfor each roadway class presented in table 23 through table 32.Critical Crash Rate AnalysisThe critical crash rate is a well known statistical test to determine atypical high crashlocations comparing crash rate for a particular intersection or segment with the crashrates of all similar characteristic locations. This estimation is based on the assumptionsthat traffic crashes occur randomly and are dispersed following the Poisson distribution.To calculate the critical crash ratio, Statewide Crash Rate (SCR) has to be estimated fora particular functional class of road as mentioned before. Then sum of average of crashrates for each roadway class is determined. The critical rate is computed by applyingstandard deviation equation with 95% confidence level as shown in following.CR f = SCR + K*SCRMVMT1 (2)2MVMTWhere,Sectionlen gth * AADT * n * YMVMT = vehicle exposure =610K= 1.645 for 95% confidence levelCR f = Critical rate for function of roadwaySCR= Statewide crash rate for each functional class of roadIdea behind Equation 2 is that crashes are normally distributed around the crashrate mean for a given functional class of roadway.At last, Critical crash ratio is determined as a ratio of crash rate of roadway segment tocritical rate of class of roadway. If this ratio is more than one, it means the site needsfurther consideration.51(3)
Roadside inspection and crash data analysisExtracted from States‟ five percent reports (14) , 6 states are applying this procedure (asof Jun 2007). The study calculates the critical crash rate for each roadway class andpresents them in table 33 through table 42.Severity Rate AnalysisTo calculate severity rate, crashes are classified based on different levels of severities.Afterward, assorted weights are assigned to these levels; namely fatal, incapacitatedinjuries (Injury A), moderate to simple injuries (Injury B), and property damage only(PDO). Total weight is determined by adding these weights together. Therefore,Equation 1 interprets as follows:Severity Rate = SR =( Fatal * w1 InjuryA * w2 InjuryB * w3 PDO * w4) *10AADT * L*Y * n6(4)In this study the weight of fatal crashes equals eight, incapacitated equals 4, injuredequals 2, and PDO equals 1. Extracted from States‟ five percent reports (14) , Severityrate is applied by 10 states for ranking their sites. . In this study, severity rates arecalculated for each roadway class and presented in table 43 through table 53.Critical Severity Rate AnalysisCritical severity ratio follows same procedure as Critical crash ratio; however, severityrate for each roadway segment (SR s ) and State wide Severity Rate (SSR) for functionalof roadway class obey Equation 4. Therefore,SR f = SSR + K*SSRMVMT1 (5)2MVMTWhere,SR f = Severity rate for function of roadwayCritical severity ratio is determined by Equation 6, in which ratio of more than oneillustrates sites in need of further studies.Finally, the critical severity rate are estimated for each roadway class and presented intable 54 through table 62.52(6)
Roadside inspection and crash data analysisRecommendationsFollowing recommendations are proposed to promote truck and bus safety in NJroadway network:As mentioned before, AADTT must be applied to estimate all above CMV rating.Because of unavailability of AADTT, the analyses are performed on AADTmaking the analyses disputable. Upon extracting the AADTT for all roadways(e.g. states and locals), BTS could improve these calculations and provide thefixed statewide average CMV crash rates and severity rates for different class ofroadways.By visiting the high CMV crash locations, the NJDOT-BTS could recommendappropriate safety counter measurements reducing CMV and motor vehiclecrashes. These recommendations could be varied extensively from geometricdesign to ITS safety applications.By utilizing the evaluation results, NJSP could concentrate their forces on thespecific areas (high crash locations) and time attempting to reduce crashes andincrease safety.The geospatial crash analysis could be expanded by including spot analysis, stripanalysis, and cluster analysis explained in more details in the next appendix.53
Roadside inspection and crash data analysisAPPENDIX THREE: FUNCTIONAL SPECIFICATION FRAMEWORKIntroductionThis appendix focuses on proposing a decision support system tool called Crash andInspection Safety System (CISS) assisting system planners through tabular data andGIS based interfaces to identify hot spots in the NJ road network. The followingfunctionalities are proposed to be corporate into CISS framework:Determination of high crash locations with tabular and GIS interfaces.Categorization of crashes by their geographic locations (e.g.counties, municipalities) using GIS interface.Identification and association of crashes to vehicle types.Establishment of trends in crashes in terms of locations, vehiclestypes, and crash contributed circumstances.Currently, various software applications are developed, at the federal level, to collectand perform the preliminary analyses on crash and inspection records. Somedrawbacks in the current systems as motivations for developing an integrated crash andinspection (CISS) system are: Lack of customized reportsSince the existing applications are not tailored to satisfy the NJDOT-BTSrequirements, the bureau is not capable of developing reports which arecritical for this bureau to provide. Shortcoming on performing some analysesCurrently, the NJDOT-BTS executes various evaluations utilizing theseapplications to inform FMCSA with the latest safety, crashes andinspection information in the state. Meanwhile the NJDOT-BTS isresponsible to provide further investigations satisfying the staterequirements. Since the current software applications are not capable tomaintain these requirements; consequently, the NJDOT-BTS performssome of their evaluations manually. Deficiency in presenting crashes in Geospatial environmentsAs the existing software applications are capable of performing theanalyses on tabular form, they present their shortcoming to offer any GIS54
Roadside inspection and crash data analysiscapability. The GIS presentation of crash locations offers analyst a userfriendly environment for broader and more accurate investigations. Lack of establishing a relation between crash and inspection dataThough, the crash and inspection data are integrated into Safer andSafetyNet applications, no single assessment is provided to demonstratethe potential correlation between the occurrence of crashes and theinspection procedure. This examination could pinpoint to specificdeficiencies in the inspection procedure. For instance, the furtherinvestigation may reveal that a number of truck crashes with the brakefailure as a main crash cause could be reduced, if the inspectionprocedure had been performed more frequently.Current Data Collection ProcessMCMIS are gathered two sets of data:• Crash• InspectionCrashIn the current process, the crash data is gathered at the crash scene by an officer(NJTR1) and it is sent to the NJDOT (BSP). After the several processes on data at theBSP, the FMCSA interested elements are sent to the NJDOT-BTS. The data is importedto SAFETYNET software where the data validation procedure is taking place. Finally,the corrected data sets are transferred to the federal database, MCMIS.InspectionIn the inspection process, though most officers use Aspen to collect inspection dataduring the inspection, some utilize the paper inspection form, as discussed before andillustrated in figure 2. The officers send the file from ASPEN to SAFER; then, it is sent tothe SAFETYNET. After reviewing the data for possible errors, the SAFETYNET sendsthe data to the MCMIS.ASPEN (15) is a software application used by FMCSA and most State Commercial MotorVehicle (CMV) enforcement agencies to conduct inspections on CMVs and drivers. Thesoftware runs on laptop computers either in a mobile unit (State police cruiser), or at afixed inspection site.SAFER (16) (Safety and Fitness Electronic Records) System offers company safety datato industry and the public over the internet. Presently, it consists of interstate carrierdata and several states' intrastate data, and interstate vehicle registration data.Operational data such as inspections and crashes are generally only presented for55
Roadside inspection and crash data analysisinterstate carriers, but plans are to include them for the intrastate carriers at a later time.The SAFER system includes the capability to provide carrier, vehicle, and driver safetyand credential information to fixed and mobile roadside inspection stations andSAFETYNET installations.SAFETYNET (17) is a system designed to manage and provide appropriate access tocrash data, roadside inspection history and data, and motor carrier and shipperidentification information. To do this, SAFETYNET maintains records that include, butare not limited to, truck/bus driver name, social security number, license number, anddate of birth, and truck/bus driver and company contact information, and vehicleidentification numbers. The FMCSA receives these data from designated State officials,either directly into SAFETYNET through paper forms that State data entryrepresentatives enter into the system, or through electronic data upload from Saferdirectly into SAFETYNET. Here they are reviewed by management, authorized, anduploaded to the MCMIS which is the FMCSA national warehouse for CMV data. TheFMCSA and other users access SAFETYNET data and functionality to completeinspections, track issues and trends, take non-compliance actions, and create reportsfrom crash and inspection data.MCMIS (18) is operated and maintained by the Federal Motor Carrier SafetyAdministration (FMCSA). MCMIS contains information on the safety fitness ofcommercial motor carriers and hazardous material (HM) shippers subject to the FederalMotor Carrier Safety Regulations and the Hazardous Materials Regulations. Examplesof this data include federal and state commercial motor vehicle inspection reports, motorcarrier compliance reviews, and crash reports.As illustrated in Figure 19, the FMCSA use the data elements from inspection and crashreports to perform their assessments.Crash and Inspection Safety System (CISS)The CISS will be an integrated system to evaluate crash and inspection data. Theproposed software application will have the capability of receiving the data (crash &inspection) from SAFETYNET and other potential sources, and will provide a userfriendly environment for elaborate analyses on crash and inspection records. Theseanalyses will be designed to attain the following objectives:Automating the existing manual calculation and analysis conducted by BTSoffice on crash and inspection data.56
Roadside inspection and crash data analysisProviding customized filtering, assessments and predefined reports in tabularand GIS environments.Developing a set of analyses to find hot spot crashes with the GIScapabilities.Developing new evaluation methods to reduce CMV crashes by establishinga relation between crash and inspection records.To obtain the above objective, the CISS will be implemented in 4 phases. The functionalspecification framework of CISS is shown in Figure 20.57
Roadside inspection and crash data analysisFMCSA Crash Event Data Elements*FMCSA requires that the states report all of the crash elements listed.Report IdentificationReport NumberCrash DateCrash TimeTime ZoneReporting AgencyOfficer Badge NumberLocation DetailsStreet/HighwayCity NameDriver IdentificationLast NameFirst NameMiddle InitialDate of BirthLicense?License ClassLicense NumberLicense StateVehicle InformationCity CodeConfigurationState Bus Use 2County CodeCarrier IdentificationCarrier TypeUSDOT NumberState Census NumberIssuing StateMC/MX NumberCarrier NameStreet AddressColonia 1City NameCity CodeStateZip Code** REPORT/LOCATION **** CARRIER **Cargo Body TypeGVWRVehicle Ident. # (VIN)License Plate NumberLicense Plate StateHM Placard?HM Class NumberHM 4-Digit NumberHM Name** DRIVER/VEHICLE **1 Applies only for carriers domiciled in Mexico2 Mandatory if Vehicle Configuration is 3 or 4 (i.e., bus)NA - Crash event data represented in this field is required; however, its completeness cannot be determined*Current Fields as of January 30, 2008Figure 19. FMCSA Crash Event Data Elements.58
Roadside inspection and crash data analysisStartNJTR-1 PolicereportInspectionDataFilter NJTR-1 datafield for FMCSAInputCrashTableVehicleTableDriverTableCarrierTableDriverTableVehicleTableVerification/ DecodingVerification/ DecodingData layer preparationData connection/Potentially usingSAFETYNETdatabaseLayer 1: Data analysis & reportpreparationData analysis-Frequency Analysis- Cross tab analysisPotential Report- Predefine (Can report)- Inspection- Crash-Hybrid (crash & Inspection)Output-Spatial representation ofcrashes- Thematic representaionLayer 2: GIS AnalysisLayer 3: Network screeningAll crashes, roadway, driverrelated crashes- Crash rate (FMCSA)- Critical crash rate-Severity rate- Critical severity rateVehicle related crashes- Frequency analysis of contributedcircumstancesLayer 4: Diagnosis andEvaluationEndVehicle related crashes- Inspection relatedCause and effect analysisFrequencyLocation and officersSolutions-Propose solutions based on user defined cost and benefit valuesFigure 20. Functional Specification framework.59
Roadside inspection and crash data analysisData SpecificationSince the proposed system focuses on integrating two separate datasets, crash andinspection, a clear view from data structure, fields, data volume and their formats will benecessary. Upon this knowledge, the research team will be able to integrate datasetstogether and develop an inclusive data table utilized in the proposed layers forevaluations and analyses. These two datasets are as follows:Crash data- Vehicle, driver and crash data from NJTR-1 police reportInspection data - Driver, vehicle, carrier dataSince both information (crash and inspection) have to be entered into the CISSsoftware, the data volume and updating procedure also have to be considered to retainthe system sustainability. Currently, SAFETYNET application integrates these twodatasets and presents them as one collaborative dataset. The CISS may potentiallyutilize this dataset as an input table. Upon obtaining these inputs, the CISS will bedesigned and implemented in four phases:Layer 1: Data analysis & Report creationLayer 2: GIS AnalysisLayer 3: Network ScreeningLayer 4: Diagnosis & EvaluationFigure 21 illustrates the CISS horizon considering the system inputs and outputs.60
Roadside inspection and crash data analysisVehicle table- NJTR1Police reportCrash table- NJTR1Police reportDriver table- NJTR1Police reportCarrierInformation– InspectionreportCISSSoftwareProposed AnalysisLayer 1 Data Analysis & reportCreationLayer 2 GIS AnalysisLayer 3 Network ScreeningLayer 4 Diagnosis & EvaluationDriverinformation– InspectionreportVehicleinformation– InspectionreportFigure 21. Input and output of the CISS system.Layer 1: Data Analysis & Report CreationThe proposed software application, CISS, will be capable of performing:Frequency analysisUsers will have the capability to perform the frequency analysis on theintegrated crash and inspection data without any limitations.Filtering on exiting optionsUsers will have the capability of categorizing crashes based on driverrelated, roadway related, environment related or vehicle related.ReportingThe result of the analyses will be shown in tables or charts and could beexported into one of the common commercial software formats (Excel,PDF, and Word).Predefined reportsCurrently, some reports as fixed formats are used in the state and thefederal level to report crashes with particular fields. The CISS can61
Roadside inspection and crash data analysisLayer 2: GIS Analysisintegrate these reports into the software for the ease of use. However,feedbacks from the NJDOT- BTS would be necessary to customize thesereports appropriately. In the preliminary analysis, the BTS office requestedsome reports illustrated in table 63.For better visualization, the project proposes to integrate the geospatial capabilities intothe application. Two important features are planned to incorporate into this layer:Filtering in a geospatial enviromentBased on a user defined filter performed in data interface (filteringsection), crashes and inspection centers will be mapped throughout NJstate in the Geographic Information System (GIS) environment.Thematic representation of crashesAlso, the thematic representation of crashes will be added to the plannedfeatures. Note that, thematic representation of crashes is displayingcrashes as a symbol (e.g. dot, star,..) with different colors according to thenumber of crashes.To the best knowledge of the research team, this application will be a first attempt toincorporate the GIS presentation of CMV crashes and inspection center into onecollaborative software form.Layer 3: Network ScreeningMost statistical analyses in the layer one and GIS presentation in the layer two have theobjective of identifying locations with the most predominant problems. By properfiltering, the frequency analysis could be determined some critical problems such astruck related fatalities in the specific interstate roadway; but more depth analysis have tobe developed to find the causality of the problems and compare them to the state andnational average. Currently, FMCSA evaluates the following elements to develop thestate profile.1) The number of crashes2) The number of fatal crashes3) Crash rates62
Roadside inspection and crash data analysisNJDOT-BTS could extend its evaluation techniques to find the causality of CMV rashesand address problems considering the crash contributed circumstances. Byconcentrating on these issues, NJ State could be promoted in the ranking systemcomparing to the overall state averages.The research team proposes three approaches to find the hot spot CMV crash locationsthroughout the state considering their contributing circumstances:All CMV crashesIn this approach, the proposed methodologies are:1) Crash rate.2) Critical crash rate.3) Severity rate.4) Critical severity rate.5) Prediction of CMV crashes and the expectation of their severity level.Roadway related crashesIn this approach, CMV crashes will be classified based on crashes relatedfactors. Roadway related crashes will be extracted in each roadway class andcompared with the nation average announced by FHWA. Locations withhigher crash frequency than the nation average will be considered for furtherinvestigations.Vehicle related crashesIt will evaluate the vehicle related crashes and compare them to the stateaverage and report the critical issues to be addressed in the next layer.Layer 4: Diagnosis and EvaluationIn this layer, crashes will be classified and analyzed, based on the correlation betweenthe crashes and inspections. In other words, each crash will be examined to determinewhether the cause of crash is related to the inspection procedure or not. The possiblesolutions will be analyzed based on user defined costs and benefit values.In this step, each crash will be classified into two sets:Crashes happened due to an inspection failure (an inspection test orprocedure steps).A set of analytical techniques such as Pareto Analysis, Cause and Effect areproposed to evaluate and diagnose the root of crashes and find the priority for63
Roadside inspection and crash data analysisimprovement. The inspection location and officers‟ roles in the failure will beanalyzed for training purposes.OthersIn this dataset, the cause of crash is not related to the inspection such asalcohol or high speed.According to the analysis result, a set of possible solutions will be offered for theproblem based on the user defined cost and benefit values.64
Roadside inspection and crash data analysisREFERENCE1. Federal Motor Carrier Safety Administration web site.http://ai.fmcsa.dot.gov/DataQuality/dataquality.asp. Access as of Sep 2008.2. Federal Motor Carrier Safety Administration web site. http://www.fmcsa.dot.gov/.Access as of Sep 2008.3. Green,P.E.; Blower,d.f. ”Evaluation of New Jersey Crash Data Reported toMCMIS crash file. February 2005. 34 p. Report No. UMITRI 2005-13.4. Based on the interview with the NJDOT‟s Bureau of Safety Program Manager,Mr. Bill Beans.5. Based on the interview with the NJ State Police officer, Mr. Jonathan Kasper.6. Main DOT website. http://www.maine.gov/mdot/safety-programs/high-crash.php.Access as of Sep 2008.7. FHWA web site, Virginia 5 percent report.http://safety.fhwa.dot.gov/fivepercent/07va.htm. Access as of Sep 2008.8. Engineering Policy Guide.http://epg.modot.mo.gov/index.php?title=121.5_Prioritization_Factors. Access asof Sep 2008.9. Safety and Design Alternatives for two ways stop controlled expresswayintersections.http://www.ctre.iastate.edu/pubs/midcon2005/MazeIntersections.pdf. Access asof Sep 2008.10. FHWA web site, Maryland 5 percent report.http://safety.fhwa.dot.gov/fivepercent/06md.htm. Access as of Sep 2008.11. FHWA web site, North Dakota. 5 percent report.http://safety.fhwa.dot.gov/fivepercent/07nd.htm. Access as of Sep 2008.12. Kentucky transportation Center. Crash rates at intersections.http://www.ktc.uky.edu/Reports/KTC_03_21_SPR258_03_2I.pdf. Researchreport. Access as of Sep 2008.13. FHWA web site, Delaware 5 percent report.http://safety.fhwa.dot.gov/fivepercent/07de.htm. Access as of Sep 2008.14. FHWA web site, 5 percent report. http://safety.fhwa.dot.gov/fivepercent/. Accessas of Sep 2008.15. Transportation Safety Systems Center.http://www.ugpti.org/tssc/projects/view.php?id=1. Access as of March 2007.16. Federal Motor carrier safety administration.http://safer.fmcsa.dot.gov/about.aspx. Safety and fitness Electronic recordssystem. Access as of March 2007.65
Roadside inspection and crash data analysis17. Federal Motor Carrier Safety Administration.http://www.dot.gov/pia/fmcsa_safetynet.htm. Access as of March 2007.18. National Center for Statistics and analysis.http://24.123.50.125/projects/FMCSA/FMCSA_MCMIS.htm. Access as of March 2007.66
Roadside inspection and crash data analysisAPPENDIX FOUR: SUPPLEMENT MATERIALS67
Roadside inspection and crash data analysis68
Roadside inspection and crash data analysis69
Roadside inspection and crash data analysis70
Roadside inspection and crash data analysis71
Roadside inspection and crash data analysisTable 5. Number of crashes based on the crash type reported by police officer.Values<strong>CRASH</strong>_TYPEFrequency Cum. Frequency PercentageSame Direction - RearEnd 6653 6653 31.2%Same Direction - SideSwipe 3627 10280 17.0%Other 3417 13697 16.0%Right Angle 2715 16412 12.7%Fixed Object 1165 17577 5.5%Struck Parked Vehicle 1078 18655 5.1%Opposite Direction - HeadOn/Angular 762 19417 3.6%Left Turn / U Turn 538 19955 2.5%Overturned 332 20287 1.6%Backing 265 20552 1.2%Pedestrian 255 20807 1.2%Non-fixed Object 201 21008 .9%Opposite Direction - SideSwipe 95 21103 .4%Unknown 83 21186 .4%Pedalcyclist 66 21252 .3%Animal 29 21281 .1%NULL 25 21306 .1%Encroachment 24 21330 .1%Railcar-vehicle 13 21343 .1%Chart 1. Crash frequency Versus Crash type.72
Roadside inspection and crash data analysisTable 6. Number of crashes happening at or not at intersections.ValuesINTERSECTIONFrequency Cum. Frequency PercentageNot At Intersection 14972 14972 70%At Intersection 6327 21299 30%At or near Railroad Crossing 44 21343 %Chart 2. frequency Versus Crash type.73
Roadside inspection and crash data analysisTable 7. Number of crashes occurred in different environment conditions.ValuesENVIRONMENTAL_CONDITIONCum.Frequency FrequencyPercentageClear 17232 17232 80.7%Rain 2940 20172 13.8%Snow 713 20885 3.3%Fog/Smog/Smoke 96 20981 .4%Overcast 206 21187 1.0%Sleet/Hail/Freezing Rain 31 21218 .1%Blowing Snow 5 21223 .0%Severe Crosswinds 6 21229 .0%NULL 64 21293 .3%Other 50 21343 .2%Chart 3. Crash frequency in different environment conditions.74
Roadside inspection and crash data analysisTable 8. Number of crashes occurred in different light conditions.ValuesLIGHT_CONDITIONFrequencyCum.FrequencyPercentageDaylight 16645 16645 78.0%Dark (Street Lights On/continuous) 2777 19422 13.0%Dark (No Street Lights) 827 20249 3.9%Dawn 406 20655 1.9%Dusk 316 20971 1.5%Dark (Street Lights Off) 191 21162 .9%Dark (Street LIghts On/spot) 125 21287 .6%NULL 56 21343 .3%Chart 4. Crash frequency in different light conditions.75
Roadside inspection and crash data analysisTable 9. Number of crashes based on different cargo body type.ValuesCARGO_BODY_TYPEFrequencyPercentageVan/Enclosed Box 8834 20.7%Bus (> 15 Seats) 4740 11.1%Dump 2186 5.1%Other 1763 4.1%Flatbed 1589 3.7%Garbage/Refuse 967 2.3%Cargo Tank 812 1.9%Bus (9-15 Seats) 550 1.3%Auto Transporter 461 1.1%No Cargo Body 173 .4%Pole (trailer) 123 .3%Concrete Mixer 118 .3%Intermodal Chassis 64 .1%Hopper (grain/ gravel/ chips) 25 .1%NULL 20298 48%Chart 5. Number of crashes based on vehicle cargo body type by excluding “NULL” records.76
Roadside inspection and crash data analysisTable 11. Number of crashes occurred in each roadway functional class.ValuesROAD_SYSTEMFrequency Cum. Frequency PercentageState Highway 5772 5772 27.0%County 4809 10581 22.5%Municipal 4101 14682 19.2%State/Interstate Authority 3090 17772 14.5%Interstate 2675 20447 12.5%Private Property 861 21308 4.0%State Park or Institution 14 21322 .1%Co. Auth. 11 21333 .1%Mun Auth 5 21338 .0%US Govt Property 4 21342 .0%NULL 1 21343 .0%Chart 6. Crash frequency in each class of roadway.78
Roadside inspection and crash data analysisTable 12. Crash frequency in each level of crash severity.ValuesSEVERITYCum.Frequency FrequencyPercentageInjury 15694 15694 74%PropertyDamage 5283 20977 25%Fatal 366 21343 2%Chart 7. Crash frequency in each level of severity.79
Roadside inspection and crash data analysisTable 13. Condition of vehicles in crash scene.ValuesTOWEDFrequency Cum. Frequency PercentageTowed 20928 20928 49.0%Driven 19142 40070 44.8%NULL 2144 42214 5.0%Left at Scene 489 42703 1.1%Chart 8. Crash frequency based on a vehicle‟s condition.80
Roadside inspection and crash data analysisTable 14. Crash frequency in a monthly base.Values<strong>CRASH</strong>_MONTHFrequency Cum. Frequency PercentageSeptember 1904 1904 9%June 1893 3797 9%October 1870 5667 9%May 1850 7517 9%August 1814 9331 8%December 1814 11145 8%November 1770 12915 8%July 1758 14673 8%March 1739 16412 8%January 1697 18109 8%April 1689 19798 8%February 1545 21343 7%Chart 9. Crash frequency in a monthly base.81
Roadside inspection and crash data analysisTable 15. Crash frequency in a daily base.Values<strong>CRASH</strong>_DAY_OF_WEEKFrequency Cum. Frequency PercentageWednesday 3886 3886 18%Tuesday 3863 7749 18%Friday 3801 11550 18%Monday 3709 15259 17%Thursday 3686 18945 17%Saturday 1491 20436 7%Sunday 907 21343 4%Chart 10. Crash frequency in a daily base.82
Roadside inspection and crash data analysisTable 16. Crash frequency in an annual base.Values<strong>CRASH</strong>_YEARFrequency Cum. Frequency Percentage2006 5749 5749 27%2004 5291 11040 25%2003 5180 16220 24%2005 5123 21343 24%Chart 11. Crash frequency in an annual base.83
Roadside inspection and crash data analysisTable 17. Crash types for All CMV and trucks only.Values<strong>CRASH</strong>_TYPEFrequencyCum.FrequencyPercentageSame Direction - Rear End 6653 5259 6653 5259 31% 32%Same Direction - SideSwipe 3627 2908 10280 8167 17% 18%Other 3417 2740 13697 10907 16% 17%Right Angle 2715 1707 16412 12614 13% 10%Fixed Object 1165 1027 17577 13641 5% 6%Struck Parked Vehicle 1078 801 18655 14442 5% 5%Opposite Direction - HeadOn/Angular 762 549 19417 14991 4% 3%Left Turn / U Turn 538 348 19955 15339 3% 2%Overturned 332 328 20287 15667 2% 2%Backing 265 225 20552 15892 1% 1%Pedestrian 255 165 20807 16057 1% 1%Non-fixed Object 201 188 21008 16245 1% 1%Opposite Direction - SideSwipe 95 78 21103 16323 % %Unknown 83 54 21186 16377 % %Pedalcyclist 66 46 21252 16423 % %Animal 29 21 21281 16444 % %NULL 25 21 21306 16465 % %Encroachment 24 20 21330 16485 % %Railcar-vehicle 13 12 21343 16497 % %Chart 12. Crash types for All CMV and trucks only.84
Roadside inspection and crash data analysisTable 18. Crash frequency for each roadway system for All CMV and trucks only.ValuesROAD_SYSTEMFrequencyCum.FrequencyPercentageState Highway 5772 5059 5772 5059 27% 29%County 4809 3527 10581 8586 23% 20%State/Interstate Authority 3090 2956 13671 11542 14% 17%Interstate 2675 2593 16346 14135 13% 15%Municipal 4101 2583 20447 16718 19% 15%Private Property 861 679 21308 17397 4% 4%Co. Auth. 11 10 21319 17407 % %State Park or Institution 14 9 21333 17416 % %US Govt Property 4 4 21337 17420 % %Mun Auth 5 3 21342 17423 % %NULL 1 1 21343 17424 % %Chart 13. CMV and truck crashes in each roadway class.85
Roadside inspection and crash data analysisTable 19. Annual number of CMV and truck crashes.Crash Year<strong>CRASH</strong>_YEARFrequency Cum. Frequency Percentage2006 5749 4564 5749 4564 27% 28%2004 5291 4046 11040 8610 25% 25%2003 5180 3947 16220 12557 24% 24%2005 5123 3940 21343 16497 24% 24%Chart 14. Annual number of CMV and truck crashes.86
Roadside inspection and crash data analysisTable 20. Daily crash frequency for all CMV and trucks.Values<strong>CRASH</strong>_DAY_OF_WEEKFrequency Cum. Frequency PercentageWednesday 3886 3236 3886 3236 18% 19%Tuesday 3863 3157 7749 6393 18% 18%Friday 3801 3102 11550 9495 18% 18%Monday 3709 3041 15259 12536 17% 17%Thursday 3686 3019 18945 15555 17% 17%Saturday 1491 1209 20436 16764 7% 7%Sunday 907 660 21343 17424 4% 4%Chart 15. Daily crash frequency for all CMV and trucks.87
Roadside inspection and crash data analysisFigure 22. Trend of all crashes in a period of four years (2003-2006).Figure 23. Trend of injuries in crashes in a period of four years (2003- 2006).88
Roadside inspection and crash data analysisTable 21. Annual percentages of CMV crash locations based on a vehicle‟s cargo body type.AtIntersection2003 2004Not At AtNot AtIntersection Intersection IntersectionCargo Body TypeBus (9-15 Seats)Bus (> 15 Seats) 0.34 0.19 0.34 0.19Van/Enclosed Box 0.29 0.45 0.27 0.43Cargo Tank 0.03 0.04 0.03 0.03Flatbed 0.06 0.06 0.07 0.08Dump 0.08 0.09 0.10 0.10Concrete Mixer 0.01 0.00 0.01 0.00Auto Transporter 0.02 0.02 0.02 0.02Garbage/Refuse 0.05 0.05 0.04 0.04Hopper (grain/ gravel/ chips) 0.00 0.00 0.00 0.00Pole (trailer) 0.00 0.00 0.00 0.00Intermodal Chassis 0.00 0.00 0.00 0.00No Cargo Body 0.00 0.00 0.00 0.00NULLOther 0.12 0.10 0.12 0.102005 2006Cargo Body TypeAtIntersectionNot AtIntersectionAtIntersectionNot AtIntersectionBus (9-15 Seats) 0.16 0.08Bus (> 15 Seats) 0.34 0.19 0.22 0.12Van/Enclosed Box 0.29 0.45 0.26 0.44Cargo Tank 0.03 0.04 0.03 0.04Flatbed 0.06 0.07 0.07 0.08Dump 0.09 0.10 0.11 0.10Concrete Mixer 0.01 0.01 0.01 0.01Auto Transporter 0.02 0.02 0.02 0.02Garbage/Refuse 0.05 0.04 0.05 0.04Hopper (grain/ gravel/ chips) 0.00 0.00 0.00 0.01Pole (trailer) 0.00 0.00 0.02 0.02Intermodal Chassis 0.00 0.00 0.01 0.01No Cargo Body 0.00 0.00 0.04 0.03NULLOther 0.11 0.09 0.01 0.0089
Roadside inspection and crash data analysisTable 22. Annual percentages of truck crash locations based on a vehicle‟s cargo body type.2003 2004Cargo BodyTypeAtIntersection Not At IntersectionAtIntersectionNot AtIntersectionBus (9-15 Seats)Bus (> 15 Seats) 0.02 0.01 0.01 0.01Van/Enclosed Box 0.44 0.56 0.42 0.54Cargo Tank 0.05 0.05 0.04 0.04Flatbed 0.09 0.08 0.11 0.10Dump 0.13 0.12 0.16 0.12Concrete Mixer 0.01 0.00 0.01 0.00Auto Transporter 0.02 0.02 0.02 0.03Garbage/Refuse 0.08 0.06 0.06 0.05Hopper (grain/gravel/ chips) 0.00 0.00 0.00 0.00Pole (trailer) 0.00 0.00 0.00 0.00IntermodalChassis 0.00 0.00 0.00 0.00No Cargo Body 0.00 0.00 0.00 0.00NULLOther 0.16 0.10 0.15 0.112005 2006Cargo BodyTypeAtIntersection Not At IntersectionAtIntersectionNot AtIntersectionBus (9-15 Seats) 0.01 0.01Bus (> 15 Seats) 0.01 0.01 0.03 0.01Van/Enclosed Box 0.43 0.55 0.41 0.55Cargo Tank 0.06 0.05 0.04 0.05Flatbed 0.09 0.09 0.12 0.09Dump 0.15 0.13 0.18 0.13Concrete Mixer 0.01 0.01 0.01 0.01Auto Transporter 0.03 0.02 0.03 0.02Garbage/Refuse 0.08 0.05 0.07 0.05Hopper (grain/gravel/ chips) 0.00 0.00 0.00 0.01Pole (trailer) 0.00 0.00 0.03 0.03IntermodalChassis 0.00 0.00 0.02 0.01No Cargo Body 0.00 0.00 0.05 0.04NULLOther 0.14 0.09 0.01 0.0190
Roadside inspection and crash data analysisTable 23. Calculated crash rate in descending order for Urban Principal Arterial.SRIStartMPEndMPCrashRate Lanes Roadway function of class AADT00000543__ 5.40 5.41 8.15 2 Urban Principal Arterial 840500000028__ 2.27 2.29 3.50 2 Urban Principal Arterial 978100000130__ 55.45 55.46 3.06 2 Urban Principal Arterial 2241100000202__ 71.25 71.31 2.67 4 Urban Principal Arterial 855600000031__ 6.18 6.20 2.47 4 Urban Principal Arterial 2218000000109__ 2.31 2.39 2.36 2 Urban Principal Arterial 362800000571__ 42.38 42.41 1.73 1 Urban Principal Arterial 1323000000023__ 5.44 5.50 1.68 3 Urban Principal Arterial 2044000000129__ 0.32 0.64 1.66 1 Urban Principal Arterial 257300000206__ 17.69 17.72 1.58 3 Urban Principal Arterial 1442600000001T_ 1.05 1.13 1.55 3 Urban Principal Arterial 4968900000206__ 82.27 82.32 1.40 2 Urban Principal Arterial 1951500000015__ 3.90 3.91 1.30 3 Urban Principal Arterial 5266000000001__ 61.91 62.08 1.26 2 Urban Principal Arterial 2873400000001T_ 2.20 2.27 1.15 3 Urban Principal Arterial 4268900000439__ 0.63 0.75 1.13 2 Urban Principal Arterial 2525000000045__ 25.83 25.96 1.11 4 Urban Principal Arterial 1422200000124__ 11.17 11.30 1.03 4 Urban Principal Arterial 1541700000206__ 38.71 39.17 0.90 2 Urban Principal Arterial 818000000206__ 17.58 17.66 0.89 2 Urban Principal Arterial 1919900000551__ 33.59 34.57 0.88 2 Urban Principal Arterial 715000000561__ 50.46 50.93 0.87 2 Urban Principal Arterial 838200000040__ 35.05 35.13 0.86 4 Urban Principal Arterial 995200000206__ 45.01 45.08 0.85 4 Urban Principal Arterial 1156800000503__ 0.55 0.76 0.84 2 Urban Principal Arterial 1951700000021__ 0.89 1.00 0.83 2 Urban Principal Arterial 3751800000206__ 42.74 42.88 0.82 3 Urban Principal Arterial 594600000035__ 29.38 29.47 0.81 2 Urban Principal Arterial 2831100000033__ 0.11 0.18 0.78 3 Urban Principal Arterial 1247900000034__ 22.27 22.41 0.78 4 Urban Principal Arterial 1254600000001B_ 0.25 0.42 0.78 4 Urban Principal Arterial 1035300000009W_ 0.65 0.76 0.78 2 Urban Principal Arterial 2402900000035__ 50.76 50.88 0.76 4 Urban Principal Arterial 2259200000202__ 65.33 65.55 0.73 3 Urban Principal Arterial 1698900000009__ 33.19 33.25 0.69 2 Urban Principal Arterial 1736000000440__ 21.96 21.99 0.66 2 Urban Principal Arterial 3448900000510__ 16.62 16.73 0.64 2 Urban Principal Arterial 1935400000440__ 20.88 21.01 0.61 1 Urban Principal Arterial 3448991
Roadside inspection and crash data analysis00000206__ 42.74 42.88 0.60 3 Urban Principal Arterial 818000000030__ 8.06 8.26 0.60 2 Urban Principal Arterial 3445700000033__ 7.40 7.53 0.60 4 Urban Principal Arterial 1769200000507__ 12.65 12.78 0.58 2 Urban Principal Arterial 1825400000206__ 40.73 41.15 0.54 4 Urban Principal Arterial 594600000079__ 0.00 0.07 0.54 1 Urban Principal Arterial 1806800000070__ 54.22 54.35 0.54 2 Urban Principal Arterial 3903300000033__ 34.70 34.77 0.53 1 Urban Principal Arterial 1837700000124__ 11.00 11.17 0.52 2 Urban Principal Arterial 1541700000510__ 27.12 27.49 0.52 4 Urban Principal Arterial 1418700000009__ 129.36 129.80 0.51 2 Urban Principal Arterial 4570900000027__ 16.55 16.63 0.51 2 Urban Principal Arterial 1752000000031__ 22.02 22.09 0.50 3 Urban Principal Arterial 1916500000202__ 51.43 51.53 0.50 4 Urban Principal Arterial 1361000000007__ 0.00 0.55 0.49 2 Urban Principal Arterial 1788300000130__ 25.63 25.70 0.48 2 Urban Principal Arterial 2028800000009__ 104.40 104.49 0.48 3 Urban Principal Arterial 3190400000001__ 60.76 61.91 0.48 4 Urban Principal Arterial 2873400000070__ 46.70 47.00 0.48 3 Urban Principal Arterial 1438300000046__ 30.09 30.31 0.47 1 Urban Principal Arterial 1328900000124__ 7.34 7.58 0.47 1 Urban Principal Arterial 1227200000577__ 1.23 1.43 0.46 4 Urban Principal Arterial 1501600000206__ 53.94 54.01 0.46 2 Urban Principal Arterial 2147500000049__ 26.44 26.94 0.45 2 Urban Principal Arterial 1223100000506__ 5.22 5.35 0.45 4 Urban Principal Arterial 2359100000503__ 0.31 0.55 0.44 4 Urban Principal Arterial 1951700000028__ 6.73 6.94 0.44 4 Urban Principal Arterial 2237200000027__ 9.60 9.67 0.43 5 Urban Principal Arterial 2255300000514__ 31.48 31.58 0.43 2 Urban Principal Arterial 1591100000009__ 132.79 132.85 0.43 2 Urban Principal Arterial 7982400000130__ 45.92 46.45 0.43 4 Urban Principal Arterial 4226500000440__ 20.88 21.01 0.42 1 Urban Principal Arterial 4967400000093__ 0.00 0.61 0.42 4 Urban Principal Arterial 2152500000206__ 39.17 39.58 0.42 4 Urban Principal Arterial 818000000530__ 8.66 9.03 0.42 4 Urban Principal Arterial 1336500000001__ 57.36 57.48 0.41 4 Urban Principal Arterial 2754000000514__ 31.58 31.79 0.41 4 Urban Principal Arterial 1591100000001__ 62.09 62.73 0.41 4 Urban Principal Arterial 1575600000070__ 43.47 43.56 0.40 1 Urban Principal Arterial 1886500000001__ 62.73 62.80 0.40 4 Urban Principal Arterial 4906800000049__ 20.89 21.40 0.40 2 Urban Principal Arterial 673700000206__ 40.73 41.15 0.39 4 Urban Principal Arterial 818000000036__ 1.72 3.26 0.39 2 Urban Principal Arterial 683092
Roadside inspection and crash data analysis00000001__ 38.50 38.85 0.39 2 Urban Principal Arterial 6518300000027__ 16.63 16.83 0.39 3 Urban Principal Arterial 1752000000046__ 70.50 70.75 0.38 4 Urban Principal Arterial 4324300000130__ 25.74 25.80 0.38 1 Urban Principal Arterial 3014100000031__ 42.84 43.14 0.37 4 Urban Principal Arterial 1222300000045__ 28.38 28.51 0.37 2 Urban Principal Arterial 1422200000046__ 63.81 63.85 0.37 2 Urban Principal Arterial 9307000000033__ 0.18 0.33 0.37 4 Urban Principal Arterial 1247900000031__ 6.09 6.18 0.36 2 Urban Principal Arterial 2218000000001__ 28.54 29.06 0.36 3 Urban Principal Arterial 7996800000206__ 41.15 42.74 0.36 2 Urban Principal Arterial 594600000202__ 48.10 48.23 0.36 4 Urban Principal Arterial 1455200000035__ 17.17 17.26 0.35 2 Urban Principal Arterial 2145700000206__ 109.16 109.25 0.35 3 Urban Principal Arterial 2150300000009__ 120.97 121.63 0.35 3 Urban Principal Arterial 5026100000577__ 7.85 8.11 0.35 5 Urban Principal Arterial 1501600000018__ 30.30 30.35 0.35 2 Urban Principal Arterial 3952400000046__ 69.19 69.37 0.35 6 Urban Principal Arterial 3305700000046__ 71.65 71.74 0.34 3 Urban Principal Arterial 4472400000503__ 1.05 1.48 0.33 2 Urban Principal Arterial 1951700000018__ 34.41 35.32 0.32 4 Urban Principal Arterial 2790000000049__ 24.86 25.58 0.32 4 Urban Principal Arterial 1766000000015__ 14.20 14.41 0.32 2 Urban Principal Arterial 2053900000022__ 36.94 37.17 0.32 3 Urban Principal Arterial 6579600000046__ 69.37 69.97 0.31 4 Urban Principal Arterial 3305700000040__ 51.73 51.93 0.31 3 Urban Principal Arterial 3325300000206__ 44.78 45.01 0.31 2 Urban Principal Arterial 966100000439__ 2.35 2.44 0.30 2 Urban Principal Arterial 2525000000030__ 57.87 58.23 0.30 3 Urban Principal Arterial 1264800000031__ 22.09 22.21 0.30 5 Urban Principal Arterial 1916500000206__ 34.32 35.17 0.30 2 Urban Principal Arterial 2158200000440__ 19.94 20.34 0.30 2 Urban Principal Arterial 3448900000035__ 55.08 56.37 0.30 5 Urban Principal Arterial 1786900000023__ 34.36 35.50 0.30 2 Urban Principal Arterial 1825700000032__ 0.00 0.90 0.29 2 Urban Principal Arterial 2339200000510__ 28.10 28.43 0.29 5 Urban Principal Arterial 1418700000010__ 22.67 23.47 0.29 4 Urban Principal Arterial 878900000004__ 3.30 3.45 0.29 2 Urban Principal Arterial 12569400000206__ 58.08 58.22 0.29 3 Urban Principal Arterial 1693500000035__ 37.00 37.33 0.28 3 Urban Principal Arterial 3659600000018__ 35.32 37.14 0.28 3 Urban Principal Arterial 2790000000010__ 18.75 18.88 0.28 2 Urban Principal Arterial 1870400000031__ 5.93 6.09 0.28 2 Urban Principal Arterial 2990693
Roadside inspection and crash data analysis00000017__ 8.85 9.20 0.28 3 Urban Principal Arterial 8371700000168__ 9.72 9.83 0.28 2 Urban Principal Arterial 2234100000035__ 17.06 17.17 0.28 1 Urban Principal Arterial 2244600000206__ 43.22 44.50 0.27 2 Urban Principal Arterial 778600000508__ 9.94 11.28 0.27 2 Urban Principal Arterial 1681100000508__ 8.30 9.94 0.27 4 Urban Principal Arterial 1681100000017__ 8.55 8.85 0.27 2 Urban Principal Arterial 8371700000501__ 33.88 34.05 0.27 2 Urban Principal Arterial 2955900000577__ 6.97 7.64 0.27 2 Urban Principal Arterial 1501600000030__ 48.93 49.25 0.27 2 Urban Principal Arterial 1576100000030__ 28.76 29.71 0.27 4 Urban Principal Arterial 1327700000033__ 0.33 0.74 0.27 3 Urban Principal Arterial 1247900000040__ 44.39 45.06 0.27 2 Urban Principal Arterial 764400000206__ 41.15 42.74 0.26 2 Urban Principal Arterial 818000000503__ 3.97 4.28 0.26 4 Urban Principal Arterial 839400000046__ 71.74 72.09 0.26 2 Urban Principal Arterial 4472400000070__ 48.81 49.90 0.26 2 Urban Principal Arterial 1438300000001__ 35.45 35.89 0.26 3 Urban Principal Arterial 5345800000001__ 62.80 62.96 0.26 2 Urban Principal Arterial 4906800000124__ 12.58 13.26 0.26 2 Urban Principal Arterial 1541700000510__ 28.43 28.80 0.26 2 Urban Principal Arterial 1418700000168__ 6.58 7.42 0.26 3 Urban Principal Arterial 2817100000508__ 5.74 6.21 0.26 4 Urban Principal Arterial 1681100000551__ 32.18 32.82 0.26 2 Urban Principal Arterial 831400000440__ 20.34 20.88 0.26 3 Urban Principal Arterial 3448900000322__ 10.86 11.25 0.26 2 Urban Principal Arterial 2046700000549__ 10.36 10.69 0.26 4 Urban Principal Arterial 2440200000001T_ 2.74 3.75 0.25 2 Urban Principal Arterial 4268900000501__ 31.15 32.84 0.25 4 Urban Principal Arterial 2238300000030__ 11.68 12.07 0.25 5 Urban Principal Arterial 2798600000046__ 41.53 41.90 0.25 4 Urban Principal Arterial 2248400000130__ 45.59 45.92 0.25 3 Urban Principal Arterial 4226500000503__ 0.76 1.05 0.24 4 Urban Principal Arterial 1951700000046__ 68.21 68.52 0.24 3 Urban Principal Arterial 4565800000070__ 48.41 48.81 0.24 4 Urban Principal Arterial 1438300000028__ 6.60 6.73 0.24 2 Urban Principal Arterial 2237200000031__ 4.95 5.93 0.23 4 Urban Principal Arterial 2990600000035__ 50.63 50.76 0.23 1 Urban Principal Arterial 2259200000168__ 0.00 0.74 0.23 2 Urban Principal Arterial 1195100000506__ 0.00 0.14 0.23 2 Urban Principal Arterial 2121000000027__ 33.48 34.05 0.23 2 Urban Principal Arterial 1049800000202__ 11.36 11.44 0.23 2 Urban Principal Arterial 3750200000440__ 18.89 19.76 0.23 2 Urban Principal Arterial 3448994
Roadside inspection and crash data analysis00000030__ 0.96 1.00 0.23 2 Urban Principal Arterial 7510800000503__ 13.25 14.27 0.23 2 Urban Principal Arterial 1178500000503__ 7.04 7.18 0.23 4 Urban Principal Arterial 2164300000503__ 7.43 7.71 0.23 4 Urban Principal Arterial 2164300000001__ 57.48 60.64 0.22 4 Urban Principal Arterial 3385800000029__ 9.38 10.47 0.22 2 Urban Principal Arterial 1404400000544__ 7.33 7.48 0.22 2 Urban Principal Arterial 2051700000079__ 1.59 2.06 0.22 2 Urban Principal Arterial 1310100000021__ 1.00 2.07 0.22 4 Urban Principal Arterial 3751800000010__ 22.37 22.65 0.22 3 Urban Principal Arterial 1107500000073__ 31.05 31.44 0.22 3 Urban Principal Arterial 3180900000168__ 7.50 8.64 0.22 4 Urban Principal Arterial 1933000000206__ 42.88 44.42 0.22 2 Urban Principal Arterial 818000000168__ 3.42 3.95 0.22 2 Urban Principal Arterial 1786800000506S_ 0.00 1.14 0.22 4 Urban Principal Arterial 2227100000035__ 52.18 53.31 0.21 5 Urban Principal Arterial 2259200000057__ 2.19 3.03 0.21 2 Urban Principal Arterial 1158800000046__ 29.01 29.46 0.21 2 Urban Principal Arterial 2887000000082__ 3.83 4.92 0.21 4 Urban Principal Arterial 2691300000072__ 28.46 28.74 0.21 3 Urban Principal Arterial 2354900000046__ 24.44 24.58 0.21 4 Urban Principal Arterial 2357200000206__ 33.98 34.32 0.21 2 Urban Principal Arterial 2921400000503__ 1.48 1.65 0.21 4 Urban Principal Arterial 1951700000007__ 0.55 1.30 0.20 3 Urban Principal Arterial 1788300000439__ 1.30 2.24 0.20 2 Urban Principal Arterial 2525000000130__ 30.48 34.18 0.20 3 Urban Principal Arterial 4063300000001__ 38.85 43.11 0.20 3 Urban Principal Arterial 6623800000082__ 1.13 2.23 0.20 4 Urban Principal Arterial 2510100000503__ 11.85 12.97 0.20 2 Urban Principal Arterial 2164300000001__ 19.74 20.73 0.20 2 Urban Principal Arterial 5268600000206__ 87.14 87.48 0.20 4 Urban Principal Arterial 2048300000168__ 9.97 10.44 0.20 3 Urban Principal Arterial 2234100000022__ 4.36 4.45 0.19 3 Urban Principal Arterial 3916700000063__ 0.07 1.92 0.19 3 Urban Principal Arterial 2116800000001__ 21.94 22.44 0.19 3 Urban Principal Arterial 7133900000202__ 30.51 31.50 0.19 2 Urban Principal Arterial 3605800000035__ 56.37 56.57 0.19 3 Urban Principal Arterial 1786900000027__ 19.74 20.56 0.19 5 Urban Principal Arterial 1752000000506__ 2.29 2.63 0.19 4 Urban Principal Arterial 2121000000070__ 12.58 13.27 0.19 2 Urban Principal Arterial 2103900000040__ 59.08 59.51 0.19 2 Urban Principal Arterial 2534100000001T_ 1.13 2.20 0.19 3 Urban Principal Arterial 5118200000035__ 30.44 31.25 0.19 4 Urban Principal Arterial 2253995
Roadside inspection and crash data analysis00000202__ 10.97 11.36 0.19 3 Urban Principal Arterial 3750200000070__ 55.71 56.10 0.19 2 Urban Principal Arterial 2814900000022__ 56.16 57.05 0.19 2 Urban Principal Arterial 6583100000001__ 11.27 11.83 0.19 3 Urban Principal Arterial 7863400000009__ 101.47 101.71 0.18 2 Urban Principal Arterial 3120700000202__ 48.23 48.38 0.18 4 Urban Principal Arterial 2498200000206__ 65.42 65.89 0.18 3 Urban Principal Arterial 2395200000046__ 24.63 24.76 0.18 2 Urban Principal Arterial 2887000000082__ 2.23 2.68 0.18 2 Urban Principal Arterial 2510100000184__ 0.29 0.75 0.18 4 Urban Principal Arterial 3280000000070__ 43.27 43.47 0.18 2 Urban Principal Arterial 1886500000206__ 23.48 24.30 0.18 2 Urban Principal Arterial 1845600000206__ 21.90 23.48 0.18 2 Urban Principal Arterial 1442600000027__ 30.65 32.79 0.18 4 Urban Principal Arterial 2308100000206__ 86.75 87.14 0.18 4 Urban Principal Arterial 1951500000023__ 0.00 1.50 0.18 4 Urban Principal Arterial 2044000000544__ 1.59 1.84 0.18 3 Urban Principal Arterial 1536500000009__ 101.71 103.35 0.18 4 Urban Principal Arterial 3048300000035__ 53.27 55.08 0.18 5 Urban Principal Arterial 1491100000206__ 52.09 52.50 0.18 3 Urban Principal Arterial 941900000023__ 5.25 5.44 0.18 2 Urban Principal Arterial 2044000000322__ 17.86 18.23 0.18 2 Urban Principal Arterial 2099400000046__ 70.41 70.50 0.18 2 Urban Principal Arterial 4324300000070__ 54.35 54.62 0.18 2 Urban Principal Arterial 2891300000503__ 1.65 3.26 0.17 2 Urban Principal Arterial 1951700000009__ 135.21 136.28 0.17 3 Urban Principal Arterial 4407400000035__ 23.45 24.86 0.17 2 Urban Principal Arterial 1677200000022__ 1.09 1.49 0.17 3 Urban Principal Arterial 3974500000040__ 25.54 26.71 0.17 2 Urban Principal Arterial 1020300000070__ 43.67 44.79 0.17 2 Urban Principal Arterial 2161700000124__ 9.95 11.00 0.17 4 Urban Principal Arterial 1541700000033__ 36.03 36.26 0.17 4 Urban Principal Arterial 3528400000120__ 2.43 2.65 0.17 4 Urban Principal Arterial 3705600000005__ 0.00 0.48 0.17 2 Urban Principal Arterial 1700600000040__ 27.20 30.21 0.17 2 Urban Principal Arterial 950000000503__ 16.92 17.95 0.17 2 Urban Principal Arterial 794500000031__ 45.30 46.08 0.17 3 Urban Principal Arterial 1062600000130__ 25.21 25.62 0.16 2 Urban Principal Arterial 2028800000009__ 131.69 132.79 0.16 3 Urban Principal Arterial 7982400000168__ 3.07 3.42 0.16 2 Urban Principal Arterial 1195100000130__ 72.07 74.51 0.16 2 Urban Principal Arterial 3264000000030__ 6.98 7.98 0.16 2 Urban Principal Arterial 2098500000206__ 78.66 79.12 0.16 4 Urban Principal Arterial 2743296
Roadside inspection and crash data analysis00000029__ 11.97 13.87 0.16 2 Urban Principal Arterial 1110400000506__ 5.45 7.24 0.16 4 Urban Principal Arterial 2359100000009__ 130.46 131.36 0.16 3 Urban Principal Arterial 7982400000038__ 15.38 16.78 0.16 2 Urban Principal Arterial 2751500000027__ 9.41 9.60 0.16 3 Urban Principal Arterial 2255300000001__ 5.47 5.96 0.16 3 Urban Principal Arterial 5249700000168__ 3.95 5.39 0.16 3 Urban Principal Arterial 1786800000206__ 109.25 109.98 0.16 3 Urban Principal Arterial 2360000000183__ 0.00 0.49 0.16 2 Urban Principal Arterial 1766600000510__ 27.49 28.10 0.16 2 Urban Principal Arterial 1418700000040__ 64.05 64.28 0.16 4 Urban Principal Arterial 3765100000130__ 46.45 46.76 0.16 3 Urban Principal Arterial 4226500000001__ 36.42 38.50 0.16 3 Urban Principal Arterial 6518300000027__ 32.79 32.98 0.16 2 Urban Principal Arterial 2308100000027__ 17.48 19.74 0.16 4 Urban Principal Arterial 1752000000041__ 10.68 10.83 0.16 3 Urban Principal Arterial 2938200000046__ 68.52 69.19 0.15 3 Urban Principal Arterial 3305700000007__ 4.17 4.68 0.15 2 Urban Principal Arterial 1757600000033__ 19.78 21.10 0.15 2 Urban Principal Arterial 2378600000206__ 102.34 103.31 0.15 2 Urban Principal Arterial 1387300000009__ 98.71 101.47 0.15 2 Urban Principal Arterial 2114800000040__ 10.66 11.67 0.15 2 Urban Principal Arterial 1337000000027__ 34.05 34.36 0.15 2 Urban Principal Arterial 1453100000206__ 101.69 102.34 0.15 3 Urban Principal Arterial 1387300000017__ 11.96 12.33 0.15 3 Urban Principal Arterial 10984100000206__ 52.50 53.94 0.15 2 Urban Principal Arterial 941900000027__ 24.69 25.15 0.15 4 Urban Principal Arterial 1978000000027__ 20.56 20.82 0.15 4 Urban Principal Arterial 1752000000040__ 24.70 25.54 0.15 2 Urban Principal Arterial 1089200000009__ 114.01 114.33 0.15 4 Urban Principal Arterial 4293500000045__ 26.31 27.60 0.15 2 Urban Principal Arterial 1422200000182__ 0.00 0.56 0.15 3 Urban Principal Arterial 2458300000001T_ 2.31 2.74 0.15 4 Urban Principal Arterial 4268900000440__ 21.16 21.96 0.15 1 Urban Principal Arterial 3448900000001__ 7.55 8.10 0.15 3 Urban Principal Arterial 8365900000018__ 41.41 41.96 0.15 3 Urban Principal Arterial 4194700000030__ 9.70 11.68 0.15 4 Urban Principal Arterial 2798600000017__ 10.11 11.96 0.15 2 Urban Principal Arterial 10984100000009__ 124.27 126.76 0.15 3 Urban Principal Arterial 7434000000049__ 22.63 24.86 0.15 2 Urban Principal Arterial 835100000046__ 71.18 71.65 0.15 3 Urban Principal Arterial 7943300000124__ 11.54 12.45 0.15 2 Urban Principal Arterial 1541700000001__ 32.66 34.55 0.15 3 Urban Principal Arterial 6682397
Roadside inspection and crash data analysis00000322__ 1.65 2.22 0.15 3 Urban Principal Arterial 3305800000040__ 10.02 10.66 0.14 2 Urban Principal Arterial 1477600000027__ 34.36 37.29 0.14 4 Urban Principal Arterial 1453100000035__ 22.60 23.45 0.14 2 Urban Principal Arterial 1677200000009W_ 0.00 0.35 0.14 4 Urban Principal Arterial 4089600000009__ 132.85 133.38 0.14 2 Urban Principal Arterial 6316900000524__ 1.32 1.91 0.14 2 Urban Principal Arterial 1622700000038__ 5.58 6.12 0.14 2 Urban Principal Arterial 4467800000563__ 12.33 12.91 0.14 1 Urban Principal Arterial 832800000046__ 30.36 31.33 0.14 4 Urban Principal Arterial 1996500000027__ 22.24 22.66 0.14 2 Urban Principal Arterial 2307400000073__ 27.68 28.55 0.14 3 Urban Principal Arterial 7270700000073__ 26.56 26.81 0.14 3 Urban Principal Arterial 5856500000027__ 20.94 21.62 0.14 2 Urban Principal Arterial 1438600000022__ 0.66 1.09 0.14 3 Urban Principal Arterial 4575100000577__ 6.64 6.97 0.14 2 Urban Principal Arterial 1501600000033__ 34.77 35.04 0.14 2 Urban Principal Arterial 1837700000440__ 20.68 20.88 0.14 3 Urban Principal Arterial 4967400000045__ 25.96 26.31 0.14 3 Urban Principal Arterial 1422200000206__ 17.72 21.19 0.14 2 Urban Principal Arterial 1442600000030__ 28.50 28.76 0.14 4 Urban Principal Arterial 1929100000130__ 50.44 53.55 0.14 2 Urban Principal Arterial 1942400000054__ 7.58 8.71 0.14 2 Urban Principal Arterial 1337400000120__ 1.34 2.43 0.14 2 Urban Principal Arterial 3705600000028__ 18.42 19.63 0.14 2 Urban Principal Arterial 1670500000030__ 3.26 3.62 0.13 3 Urban Principal Arterial 5650100000031__ 46.08 46.56 0.13 2 Urban Principal Arterial 1062600000202__ 79.30 80.31 0.13 2 Urban Principal Arterial 1010100000502__ 19.98 23.79 0.13 2 Urban Principal Arterial 1343500000001__ 21.02 21.38 0.13 3 Urban Principal Arterial 7133900000027__ 27.29 28.50 0.13 4 Urban Principal Arterial 2983100000001__ 35.89 36.42 0.13 3 Urban Principal Arterial 5842000000073__ 32.60 33.24 0.13 2 Urban Principal Arterial 4034100000206__ 2.97 4.08 0.13 2 Urban Principal Arterial 932300000027__ 28.50 30.65 0.13 4 Urban Principal Arterial 2650700000035__ 56.57 58.02 0.13 5 Urban Principal Arterial 1786900000010__ 17.85 18.75 0.13 2 Urban Principal Arterial 3479300000015__ 3.09 3.90 0.13 3 Urban Principal Arterial 5805800000130__ 23.79 25.21 0.13 2 Urban Principal Arterial 1474400000206__ 65.89 69.17 0.13 2 Urban Principal Arterial 2395200000206__ 108.62 109.03 0.13 2 Urban Principal Arterial 1286400000322__ 8.73 10.86 0.13 2 Urban Principal Arterial 1245200000030__ 13.53 16.51 0.13 4 Urban Principal Arterial 1604198
Roadside inspection and crash data analysis00000168__ 6.28 6.58 0.13 3 Urban Principal Arterial 1786800000206__ 91.92 92.16 0.13 3 Urban Principal Arterial 2234800000031__ 41.19 42.31 0.13 2 Urban Principal Arterial 1443300000027__ 13.41 15.38 0.13 4 Urban Principal Arterial 3848700000049__ 36.13 36.40 0.13 2 Urban Principal Arterial 2006800000022__ 47.22 47.41 0.13 2 Urban Principal Arterial 5708500000001__ 5.96 6.90 0.12 2 Urban Principal Arterial 5249700000130__ 68.55 72.07 0.12 2 Urban Principal Arterial 2507600000027__ 21.62 21.86 0.12 2 Urban Principal Arterial 2307400000168__ 0.75 3.07 0.12 3 Urban Principal Arterial 1195100000073__ 27.22 27.68 0.12 3 Urban Principal Arterial 8494500000206__ 103.31 104.54 0.12 2 Urban Principal Arterial 1362300000027__ 1.06 3.04 0.12 2 Urban Principal Arterial 1129600000031__ 42.46 42.84 0.12 4 Urban Principal Arterial 1472700000028__ 23.15 26.44 0.12 2 Urban Principal Arterial 1363500000001__ 14.12 14.57 0.12 2 Urban Principal Arterial 4991400000046__ 70.75 71.01 0.12 2 Urban Principal Arterial 4324300000031__ 23.51 24.39 0.12 3 Urban Principal Arterial 1916500000503__ 11.59 11.85 0.12 4 Urban Principal Arterial 2164300000046__ 46.33 46.48 0.12 3 Urban Principal Arterial 3756300000070__ 3.44 3.66 0.12 3 Urban Principal Arterial 5133900000507__ 27.63 27.94 0.12 3 Urban Principal Arterial 1825400000206__ 87.48 88.31 0.12 3 Urban Principal Arterial 2048300000040__ 33.34 35.05 0.12 2 Urban Principal Arterial 995200000071__ 3.69 5.10 0.12 2 Urban Principal Arterial 806600000063__ 1.92 3.00 0.12 4 Urban Principal Arterial 2116800000009__ 134.82 135.21 0.12 3 Urban Principal Arterial 5931800000206__ 65.11 65.42 0.12 3 Urban Principal Arterial 1882700000022__ 3.03 3.66 0.12 3 Urban Principal Arterial 3709600000129__ 2.14 2.41 0.12 2 Urban Principal Arterial 2173000000009__ 103.48 104.40 0.12 2 Urban Principal Arterial 3190400000017__ 9.20 10.11 0.12 3 Urban Principal Arterial 10984100000508__ 7.95 8.30 0.12 2 Urban Principal Arterial 1681100000031__ 46.88 47.58 0.12 2 Urban Principal Arterial 841400000033__ 14.39 14.77 0.12 2 Urban Principal Arterial 1560500000033B_ 2.44 3.01 0.12 2 Urban Principal Arterial 1041600000035__ 47.43 48.00 0.11 3 Urban Principal Arterial 3136300000130__ 55.46 55.71 0.11 2 Urban Principal Arterial 2394000000028__ 3.80 6.60 0.11 2 Urban Principal Arterial 1498700000018__ 37.14 40.61 0.11 3 Urban Principal Arterial 10716700000031__ 38.11 39.30 0.11 3 Urban Principal Arterial 2018400000001__ 54.61 57.27 0.11 2 Urban Principal Arterial 6107200000040__ 45.40 46.35 0.11 2 Urban Principal Arterial 1900699
Roadside inspection and crash data analysis00000551__ 32.82 33.59 0.11 2 Urban Principal Arterial 782000000017__ 5.80 8.50 0.11 3 Urban Principal Arterial 9457200000040__ 59.51 59.99 0.11 4 Urban Principal Arterial 2534100000322__ 15.26 15.65 0.11 4 Urban Principal Arterial 1562800000139__ 1.35 1.45 0.11 4 Urban Principal Arterial 6096000000001__ 34.65 35.45 0.11 2 Urban Principal Arterial 5345800000530__ 10.87 14.28 0.11 2 Urban Principal Arterial 358400000070__ 38.43 40.20 0.11 2 Urban Principal Arterial 1037400000022__ 47.41 48.40 0.11 2 Urban Principal Arterial 4958600000031__ 25.79 29.93 0.11 2 Urban Principal Arterial 1482600000139U_ 0.14 0.42 0.11 2 Urban Principal Arterial 2194000000501__ 32.84 33.88 0.11 4 Urban Principal Arterial 2955900000088__ 8.92 9.81 0.11 2 Urban Principal Arterial 1382100000001__ 14.57 16.47 0.11 2 Urban Principal Arterial 4858300000130__ 54.90 55.45 0.11 3 Urban Principal Arterial 2241100000009__ 122.00 124.27 0.11 3 Urban Principal Arterial 7059500000130__ 47.11 50.44 0.11 2 Urban Principal Arterial 2599000000030__ 40.46 44.17 0.11 4 Urban Principal Arterial 1834900000022__ 3.66 4.36 0.11 3 Urban Principal Arterial 3539800000130__ 55.87 56.35 0.11 4 Urban Principal Arterial 7763000000506S_ 1.14 1.90 0.11 4 Urban Principal Arterial 2454200000029__ 15.28 16.40 0.11 2 Urban Principal Arterial 1110400000073__ 29.68 31.05 0.11 2 Urban Principal Arterial 3180900000033B_ 3.56 5.03 0.11 2 Urban Principal Arterial 1701200000009__ 134.07 134.26 0.11 3 Urban Principal Arterial 6583300000028__ 12.09 14.66 0.11 2 Urban Principal Arterial 1217700000017__ 4.23 5.80 0.11 3 Urban Principal Arterial 6796100000073__ 31.44 32.16 0.11 2 Urban Principal Arterial 3489700000023__ 39.60 39.95 0.11 2 Urban Principal Arterial 1799700000031__ 16.06 16.36 0.11 2 Urban Principal Arterial 2108100000046__ 69.97 70.41 0.11 4 Urban Principal Arterial 4324300000561__ 41.29 41.85 0.11 4 Urban Principal Arterial 2271200000506__ 0.99 1.29 0.11 2 Urban Principal Arterial 2121000000563__ 5.74 6.00 0.11 3 Urban Principal Arterial 2451100000001__ 63.84 63.97 0.11 2 Urban Principal Arterial 4906800000047__ 17.67 18.46 0.11 2 Urban Principal Arterial 1623800000022__ 41.79 42.16 0.11 2 Urban Principal Arterial 5195400000021__ 2.07 2.55 0.11 6 Urban Principal Arterial 4014300000035__ 21.06 21.41 0.11 3 Urban Principal Arterial 1840800000122__ 1.37 2.42 0.11 2 Urban Principal Arterial 1228300000001__ 8.10 11.27 0.11 3 Urban Principal Arterial 7341000000206__ 62.70 65.11 0.11 2 Urban Principal Arterial 1882700000023__ 2.07 3.98 0.11 4 Urban Principal Arterial 20440100
Roadside inspection and crash data analysis00000001__ 44.30 45.45 0.11 3 Urban Principal Arterial 9067200000206__ 90.17 91.92 0.11 2 Urban Principal Arterial 2234800000064__ 0.00 0.32 0.10 1 Urban Principal Arterial 2042700000046__ 21.70 23.35 0.10 2 Urban Principal Arterial 1192000000508__ 3.08 3.47 0.10 4 Urban Principal Arterial 1681100000022__ 52.63 54.40 0.10 3 Urban Principal Arterial 9264700000009__ 131.36 131.69 0.10 4 Urban Principal Arterial 7982400000166__ 1.97 2.22 0.10 2 Urban Principal Arterial 2644300000040__ 56.83 57.41 0.10 2 Urban Principal Arterial 3421200000046__ 37.72 39.85 0.10 4 Urban Principal Arterial 2174100000563__ 6.00 6.27 0.10 4 Urban Principal Arterial 2451100000440__ 21.16 21.96 0.10 1 Urban Principal Arterial 4967400000073__ 12.67 13.04 0.10 4 Urban Principal Arterial 1796500000206__ 81.31 82.27 0.10 2 Urban Principal Arterial 2081500000563__ 11.53 12.33 0.10 2 Urban Principal Arterial 832800000035__ 44.66 47.43 0.10 2 Urban Principal Arterial 3136300000046__ 37.24 37.66 0.10 2 Urban Principal Arterial 1600300000561__ 39.50 39.89 0.10 4 Urban Principal Arterial 1732000000029__ 10.47 11.97 0.10 2 Urban Principal Arterial 1801300000082__ 2.79 3.83 0.10 4 Urban Principal Arterial 3273100000322__ 11.25 13.53 0.10 2 Urban Principal Arterial 1500600000507__ 15.94 16.69 0.10 2 Urban Principal Arterial 1825400000130__ 35.52 40.86 0.10 3 Urban Principal Arterial 4999800000027__ 0.00 1.06 0.10 2 Urban Principal Arterial 1295100000009W_ 0.76 2.19 0.10 4 Urban Principal Arterial 2402900000028__ 10.55 12.09 0.10 2 Urban Principal Arterial 2237200000001__ 20.73 21.02 0.10 2 Urban Principal Arterial 7133900000033__ 6.59 6.98 0.10 2 Urban Principal Arterial 1769200000563__ 12.91 13.74 0.10 2 Urban Principal Arterial 832800000130__ 60.50 61.03 0.10 3 Urban Principal Arterial 2615400000130__ 34.18 35.52 0.10 3 Urban Principal Arterial 3630100000185__ 0.00 0.65 0.10 2 Urban Principal Arterial 1071600000023__ 39.95 40.92 0.10 2 Urban Principal Arterial 1437700000035__ 12.88 14.22 0.10 2 Urban Principal Arterial 2601900000508__ 6.70 7.95 0.10 4 Urban Principal Arterial 1681100000027__ 37.29 38.26 0.10 4 Urban Principal Arterial 1453100000070__ 58.00 58.29 0.10 4 Urban Principal Arterial 2420200000001__ 29.86 31.96 0.10 3 Urban Principal Arterial 7697000000049__ 25.58 26.07 0.10 2 Urban Principal Arterial 1434700000031__ 40.74 41.19 0.10 2 Urban Principal Arterial 1569600000506__ 1.29 2.29 0.10 5 Urban Principal Arterial 2121000000018__ 30.35 34.41 0.10 2 Urban Principal Arterial 2790000000124__ 7.58 9.89 0.10 2 Urban Principal Arterial 12272101
Roadside inspection and crash data analysis00000031__ 23.14 23.51 0.10 5 Urban Principal Arterial 1916500000001__ 16.47 19.74 0.10 2 Urban Principal Arterial 5423800000001__ 24.15 24.64 0.10 4 Urban Principal Arterial 7240200000033__ 12.42 14.39 0.10 2 Urban Principal Arterial 1810600000072__ 21.16 21.65 0.10 2 Urban Principal Arterial 1456800000022__ 55.36 56.16 0.10 2 Urban Principal Arterial 8944100000070__ 5.33 5.75 0.10 4 Urban Principal Arterial 8527000000009__ 112.84 113.66 0.10 2 Urban Principal Arterial 43723102
Roadside inspection and crash data analysisTable 24. Calculated crash rate in descending order for Urban Minor Arterial.SRIStartMPEndMPCrashRateLanesRoadway function ofclassAADT00000068__ 2.87 2.90 5.47 2 Urban Minor Arterial 417300000537__ 31.23 31.25 4.07 2 Urban Minor Arterial 842300000516__ 9.15 9.22 2.11 4 Urban Minor Arterial 463200000053__ 4.63 4.66 1.65 2 Urban Minor Arterial 1382000000509__ 15.85 15.89 1.56 1 Urban Minor Arterial 2197400000130__ 11.84 12.21 1.29 2 Urban Minor Arterial 574000000546__ 4.60 4.69 1.16 1 Urban Minor Arterial 654100000109__ 1.94 2.31 1.02 2 Urban Minor Arterial 362800000009__ 23.64 23.82 1.02 1 Urban Minor Arterial 1158600000520__ 13.57 13.70 0.90 4 Urban Minor Arterial 1168800000531__ 1.55 1.99 0.88 2 Urban Minor Arterial 1415000000047__ 68.32 68.45 0.82 4 Urban Minor Arterial 1282000000054__ 10.62 10.76 0.69 2 Urban Minor Arterial 709200000555__ 14.83 15.12 0.68 2 Urban Minor Arterial 1397200000567__ 9.42 9.51 0.67 3 Urban Minor Arterial 1138100000047__ 64.11 64.19 0.67 4 Urban Minor Arterial 1282000000181__ 5.43 5.82 0.65 2 Urban Minor Arterial 537300000501__ 30.76 31.15 0.63 4 Urban Minor Arterial 2238300000517__ 32.90 34.05 0.58 3 Urban Minor Arterial 307800000046__ 21.26 21.69 0.57 2 Urban Minor Arterial 1400300000571__ 9.99 10.07 0.57 2 Urban Minor Arterial 1512600000056__ 0.00 0.14 0.56 4 Urban Minor Arterial 869900000047__ 3.33 3.42 0.56 4 Urban Minor Arterial 1433100000501__ 26.90 27.12 0.55 2 Urban Minor Arterial 1132400000514__ 38.21 38.79 0.54 2 Urban Minor Arterial 651600000047__ 68.22 68.32 0.53 1 Urban Minor Arterial 1282000000547__ 1.60 1.70 0.52 4 Urban Minor Arterial 1320100000012__ 11.48 11.69 0.52 2 Urban Minor Arterial 1263700000506__ 7.89 8.15 0.46 2 Urban Minor Arterial 1150600000516__ 6.90 7.19 0.45 2 Urban Minor Arterial 1057200000575__ 9.20 9.33 0.44 2 Urban Minor Arterial 1184900000533__ 8.05 8.41 0.43 2 Urban Minor Arterial 879900000028__ 0.00 0.16 0.42 1 Urban Minor Arterial 2024100000202__ 44.32 44.50 0.41 1 Urban Minor Arterial 919200000561__ 22.25 22.71 0.39 2 Urban Minor Arterial 378900000022__ 33.86 33.88 0.39 3 Urban Minor Arterial 8772900000202__ 53.16 54.24 0.37 2 Urban Minor Arterial 514200000175__ 2.15 2.95 0.36 2 Urban Minor Arterial 236000000553__ 22.97 23.78 0.36 2 Urban Minor Arterial 2350103
Roadside inspection and crash data analysis00000140__ 0.00 0.88 0.35 2 Urban Minor Arterial 660000000077__ 2.79 3.08 0.34 4 Urban Minor Arterial 703200000009__ 89.84 89.94 0.33 2 Urban Minor Arterial 2096200000531__ 0.10 0.69 0.32 2 Urban Minor Arterial 1459800000050__ 17.31 18.50 0.31 2 Urban Minor Arterial 185800000501__ 29.37 30.56 0.31 4 Urban Minor Arterial 2238300000501__ 30.56 30.76 0.31 3 Urban Minor Arterial 2238300000575__ 0.00 3.36 0.30 2 Urban Minor Arterial 67000000535__ 0.60 2.41 0.30 2 Urban Minor Arterial 631400000571__ 4.23 4.32 0.27 3 Urban Minor Arterial 2776700000585__ 3.09 3.35 0.26 2 Urban Minor Arterial 1003700000554__ 0.00 4.65 0.26 2 Urban Minor Arterial 283500000509__ 7.26 7.62 0.26 4 Urban Minor Arterial 2197400000047__ 3.15 3.33 0.26 2 Urban Minor Arterial 1433100000007__ 5.99 8.05 0.26 4 Urban Minor Arterial 1536300000041__ 10.85 10.94 0.26 2 Urban Minor Arterial 2938200000181__ 5.02 5.24 0.26 2 Urban Minor Arterial 1211100000561__ 32.48 34.28 0.26 2 Urban Minor Arterial 444600000035__ 1.38 2.10 0.25 3 Urban Minor Arterial 1158000000553__ 19.35 21.80 0.24 2 Urban Minor Arterial 235000000514__ 39.23 40.29 0.24 2 Urban Minor Arterial 1094500000535__ 17.43 22.76 0.24 2 Urban Minor Arterial 1252600000009__ 12.78 13.03 0.23 3 Urban Minor Arterial 1173500000501__ 27.40 29.37 0.22 4 Urban Minor Arterial 2347000000054__ 8.71 10.11 0.22 2 Urban Minor Arterial 1563800000054__ 6.10 6.67 0.22 2 Urban Minor Arterial 1116100000543__ 0.00 5.30 0.22 2 Urban Minor Arterial 840500000056__ 0.14 1.25 0.21 2 Urban Minor Arterial 869900000569__ 1.24 2.06 0.21 2 Urban Minor Arterial 396000000533__ 1.16 1.41 0.21 4 Urban Minor Arterial 1301500000508__ 12.20 15.81 0.21 2 Urban Minor Arterial 1172100000537__ 55.24 55.44 0.21 4 Urban Minor Arterial 1655500000009__ 13.03 13.40 0.20 3 Urban Minor Arterial 942800000553__ 44.47 44.91 0.19 4 Urban Minor Arterial 801300000077__ 3.08 5.63 0.19 2 Urban Minor Arterial 703200000534__ 3.29 3.83 0.19 2 Urban Minor Arterial 670800000109__ 0.00 1.32 0.19 2 Urban Minor Arterial 550800000068__ 0.00 1.05 0.18 2 Urban Minor Arterial 354500000054__ 0.00 1.10 0.18 2 Urban Minor Arterial 1038900000094__ 32.25 32.90 0.17 2 Urban Minor Arterial 1221700000537__ 28.38 29.34 0.17 2 Urban Minor Arterial 842300000044__ 8.80 9.37 0.17 4 Urban Minor Arterial 713700000567__ 9.55 10.02 0.17 2 Urban Minor Arterial 8758104
Roadside inspection and crash data analysis00000517__ 17.10 17.40 0.16 2 Urban Minor Arterial 1432400000077__ 0.52 1.47 0.16 2 Urban Minor Arterial 1362000000554__ 4.65 6.16 0.16 2 Urban Minor Arterial 1146800000559__ 3.32 5.23 0.16 2 Urban Minor Arterial 227000000047__ 42.58 42.78 0.16 2 Urban Minor Arterial 2182900000130__ 2.70 3.03 0.16 2 Urban Minor Arterial 1324200000571__ 6.19 6.64 0.15 4 Urban Minor Arterial 2013700000540__ 35.82 36.10 0.15 4 Urban Minor Arterial 1619200000202__ 54.24 56.59 0.15 2 Urban Minor Arterial 779000000561__ 48.80 50.46 0.15 2 Urban Minor Arterial 838200000522__ 0.00 1.34 0.15 2 Urban Minor Arterial 700600000173__ 2.27 3.68 0.14 2 Urban Minor Arterial 671300000047__ 74.89 75.19 0.14 4 Urban Minor Arterial 1583100000575__ 11.31 12.61 0.14 2 Urban Minor Arterial 1143000000514__ 40.29 40.71 0.14 2 Urban Minor Arterial 1184300000571__ 6.01 6.19 0.14 3 Urban Minor Arterial 2776700000549__ 14.37 16.45 0.13 2 Urban Minor Arterial 1229100000561__ 5.51 11.00 0.13 2 Urban Minor Arterial 284600000553__ 16.17 18.73 0.13 2 Urban Minor Arterial 206000000047__ 36.08 40.20 0.13 2 Urban Minor Arterial 261000000047__ 40.20 40.66 0.13 2 Urban Minor Arterial 1179600000514__ 40.71 42.86 0.13 2 Urban Minor Arterial 1271800000009__ 78.16 81.74 0.12 2 Urban Minor Arterial 1993000000501__ 23.99 26.90 0.12 4 Urban Minor Arterial 1132400000517__ 31.11 32.90 0.12 2 Urban Minor Arterial 307800000571__ 5.21 6.01 0.12 2 Urban Minor Arterial 2776700000009__ 70.53 71.46 0.12 2 Urban Minor Arterial 1826700000551__ 28.17 29.08 0.12 2 Urban Minor Arterial 628000000524__ 3.39 6.21 0.12 2 Urban Minor Arterial 203800000585__ 3.35 9.57 0.12 2 Urban Minor Arterial 948400000088__ 3.40 5.00 0.12 2 Urban Minor Arterial 1846700000553__ 44.91 46.39 0.12 2 Urban Minor Arterial 801300000056__ 7.82 9.19 0.11 4 Urban Minor Arterial 1749900000045__ 16.01 17.33 0.11 2 Urban Minor Arterial 455500000091__ 0.00 2.26 0.11 2 Urban Minor Arterial 1334000000047__ 42.30 42.58 0.11 4 Urban Minor Arterial 2182900000322__ 34.73 36.93 0.11 4 Urban Minor Arterial 848400000552__ 0.00 2.89 0.11 2 Urban Minor Arterial 656000000047__ 16.82 17.43 0.11 2 Urban Minor Arterial 1044100000555__ 10.50 12.07 0.11 2 Urban Minor Arterial 1221500000546__ 9.28 9.98 0.11 4 Urban Minor Arterial 924100000056__ 6.79 7.69 0.11 2 Urban Minor Arterial 1445800000071__ 13.78 14.77 0.10 2 Urban Minor Arterial 20026105
Roadside inspection and crash data analysis00000531__ 0.69 1.55 0.10 2 Urban Minor Arterial 1540300000514__ 11.50 13.43 0.10 4 Urban Minor Arterial 1029900000088__ 0.00 2.02 0.10 2 Urban Minor Arterial 2307300000056__ 3.79 5.83 0.10 2 Urban Minor Arterial 1326000000077__ 0.00 0.52 0.10 2 Urban Minor Arterial 1303200000555__ 17.08 17.56 0.10 3 Urban Minor Arterial 1434100000046__ 20.54 21.26 0.10 2 Urban Minor Arterial 963100000071__ 7.66 9.37 0.10 4 Urban Minor Arterial 1657400000124__ 1.48 3.27 0.10 2 Urban Minor Arterial 1588200000536__ 24.61 27.15 0.10 2 Urban Minor Arterial 2831106
Roadside inspection and crash data analysisTable 25. Calculated crash rate in descending order for Urban Interstate.SRIStart MPEndMPCrashRate107LanesRoadway functionof classAADT00000095__ 61.48 61.52 3.07 4 Urban Interstate 11150300000295__ 43.09 43.10 0.83 4 Urban Interstate 8254800000287__ 2.24 2.30 0.76 4 Urban Interstate 13569700000295__ 26.59 27.22 0.44 2 Urban Interstate 7143500000095__ 54.01 54.77 0.35 3 Urban Interstate 24766200000287__ 41.89 42.02 0.31 3 Urban Interstate 15258000000287__ 9.95 10.01 0.31 3 Urban Interstate 11092100000078__ 18.46 20.78 0.27 3 Urban Interstate 3773100000078__ 17.87 18.46 0.26 3 Urban Interstate 8506400000080__ 58.22 58.92 0.25 4 Urban Interstate 12402000000076__ 0.00 0.37 0.23 2 Urban Interstate 15846900000095M_ 0.09 0.20 0.22 3 Urban Interstate 5610000000295__ 1.39 1.92 0.21 2 Urban Interstate 2444300000095__ 59.13 59.42 0.21 3 Urban Interstate 22517800000095__ 60.38 61.20 0.19 2 Urban Interstate 11150300000080__ 26.25 27.19 0.19 3 Urban Interstate 6828800000287__ 0.00 0.70 0.19 5 Urban Interstate 10226500000080__ 67.22 68.54 0.18 3 Urban Interstate 11802800000287__ 0.70 0.93 0.17 4 Urban Interstate 10226500000078__ 49.40 49.56 0.17 3 Urban Interstate 7373500000287__ 7.27 8.47 0.17 3 Urban Interstate 4609900000287__ 0.93 2.24 0.17 4 Urban Interstate 11767100000078__ 16.24 17.87 0.17 3 Urban Interstate 8502700000078__ 56.45 57.32 0.17 3 Urban Interstate 12888900000078__ 57.78 58.58 0.17 3 Urban Interstate 11059100000078__ 58.58 62.01 0.17 2 Urban Interstate 8266900000295__ 9.15 10.30 0.16 2 Urban Interstate 2942000000080__ 42.57 42.60 0.16 2 Urban Interstate 14250100000287__ 59.76 59.82 0.16 2 Urban Interstate 7189900000080__ 58.92 59.06 0.16 3 Urban Interstate 12402000000295__ 27.39 28.16 0.15 3 Urban Interstate 10455700000287__ 13.50 14.30 0.15 3 Urban Interstate 10946900000095__ 54.77 56.33 0.15 4 Urban Interstate 24766200000676__ 3.79 3.88 0.15 3 Urban Interstate 10487100000287__ 12.30 13.50 0.14 3 Urban Interstate 9059000000080__ 59.22 60.21 0.14 4 Urban Interstate 11986400000280__ 13.74 14.42 0.14 2 Urban Interstate 7780100000080__ 53.50 53.62 0.14 3 Urban Interstate 12027100000287__ 42.02 44.95 0.14 3 Urban Interstate 64551
Roadside inspection and crash data analysis00000280__ 13.32 13.74 0.14 2 Urban Interstate 9253700000080__ 25.48 25.95 0.14 4 Urban Interstate 5196500000095__ 25.15 28.51 0.14 3 Urban Interstate 14039700000078__ 48.15 49.40 0.13 2 Urban Interstate 7373500000078__ 57.32 57.44 0.13 2 Urban Interstate 12888900000280__ 12.23 12.54 0.13 4 Urban Interstate 10325500000078__ 51.76 53.12 0.13 3 Urban Interstate 12399800000080__ 27.19 28.82 0.12 3 Urban Interstate 9894600000080__ 25.04 25.37 0.12 3 Urban Interstate 5089500000287__ 66.95 67.54 0.12 3 Urban Interstate 10444700000287__ 8.47 9.95 0.12 3 Urban Interstate 9672000000078__ 31.23 33.14 0.12 4 Urban Interstate 7836300000080__ 53.62 53.83 0.12 3 Urban Interstate 13994200000080__ 60.21 60.41 0.11 3 Urban Interstate 11986400000080__ 40.61 42.20 0.11 5 Urban Interstate 14250100000078__ 57.44 57.78 0.11 2 Urban Interstate 11059100000080__ 42.84 43.62 0.11 4 Urban Interstate 12102500000280__ 12.54 13.15 0.11 5 Urban Interstate 10325500000078__ 25.03 25.53 0.11 3 Urban Interstate 10095300000080__ 46.16 46.36 0.11 3 Urban Interstate 15849500000280__ 14.45 16.59 0.11 3 Urban Interstate 7780100000095__ 22.21 23.40 0.11 3 Urban Interstate 14039700000095__ 6.55 7.95 0.10 3 Urban Interstate 11234800000280__ 8.25 9.91 0.10 4 Urban Interstate 8686700000080__ 60.46 62.34 0.10 4 Urban Interstate 10198800000295__ 60.23 61.44 0.10 3 Urban Interstate 3294800000287__ 21.44 22.21 0.10 4 Urban Interstate 9596300000287__ 17.84 18.11 0.10 4 Urban Interstate 12454000000295__ 34.80 36.86 0.10 3 Urban Interstate 9179900000095__ 42.73 45.50 0.10 3 Urban Interstate 19026000000295__ 28.16 30.03 0.10 3 Urban Interstate 11065600000095__ 7.95 15.15 0.10 3 Urban Interstate 12312100000287__ 64.94 65.69 0.10 3 Urban Interstate 5691700000287__ 65.69 66.94 0.10 2 Urban Interstate 5691700000080__ 65.18 65.27 0.10 2 Urban Interstate 15851800000095M_ 8.12 8.77 0.10 3 Urban Interstate 44005108
Roadside inspection and crash data analysisSRITable 26. Calculated crash rate in descending order for Urban Freeway/ Expressway.StartMPEnd MPCrashRate Lanes Roadway function of class AADT00000029__ 4.29 4.34 0.61 2 Urban Freeway/Expressway 4509300000444__ 7.81 8.40 0.51 3 Urban Freeway/Expressway 1590000000495__ 0.78 0.79 0.44 3 Urban Freeway/Expressway 15607400000700__ 1.12 1.88 0.26 2 Urban Freeway/Expressway 5129200000024__ 10.18 10.42 0.24 3 Urban Freeway/Expressway 9346000000001__ 1.28 1.34 0.20 2 Urban Freeway/Expressway 5718300000440__ 0.00 2.01 0.17 3 Urban Freeway/Expressway 8460000000003__ 0.00 0.22 0.17 2 Urban Freeway/Expressway 11219600000138__ 0.33 0.71 0.14 2 Urban Freeway/Expressway 5142100000024__ 6.75 7.11 0.13 3 Urban Freeway/Expressway 7415500000208__ 2.82 2.90 0.12 2 Urban Freeway/Expressway 6928100000021__ 8.00 9.28 0.12 3 Urban Freeway/Expressway 6900400000003__ 4.95 6.39 0.12 3 Urban Freeway/Expressway 10646900000444__ 35.82 36.08 0.12 2 Urban Freeway/Expressway 2269000000001__ 51.43 54.61 0.12 2 Urban Freeway/Expressway 6352300000446__ 43.61 44.19 0.11 4 Urban Freeway/Expressway 4172200000004__ 5.00 5.69 0.10 3 Urban Freeway/Expressway 10587400000001__ 2.87 3.75 0.10 2 Urban Freeway/Expressway 3873800000004__ 10.26 10.68 0.10 2 Urban Freeway/Expressway 8223600000024__ 0.55 1.65 0.10 3 Urban Freeway/Expressway 7538000000024__ 0.00 0.55 0.10 1 Urban Freeway/Expressway 7538000000120__ 0.78 1.34 0.10 2 Urban Freeway/Expressway 3705600000018__ 14.51 19.02 0.10 2 Urban Freeway/Expressway 39546109
Roadside inspection and crash data analysisTable 27. Calculated crash rate in descending order for Urban Collector.SRIStartMPEndMPCrashRateLanesRoadway functionof classAADT00000579__ 36.71 37.24 1.87 2 Urban Collector 207600000156__ 0.00 0.49 0.77 2 Urban Collector 182600000181__ 4.94 5.02 0.71 2 Urban Collector 1211100000173__ 11.55 11.70 0.68 2 Urban Collector 671300000532__ 4.05 5.41 0.58 2 Urban Collector 174700000550__ 15.15 15.92 0.41 2 Urban Collector 435400000561__ 22.71 23.85 0.32 2 Urban Collector 378900000563__ 16.70 18.20 0.29 2 Urban Collector 314200000543__ 19.11 24.80 0.27 2 Urban Collector 265000000522__ 13.00 14.37 0.26 2 Urban Collector 967300000561A_ 12.18 13.13 0.24 2 Urban Collector 303500000561__ 25.76 27.73 0.22 2 Urban Collector 476900000540__ 33.41 34.49 0.22 5 Urban Collector 880600000519__ 41.75 42.04 0.22 2 Urban Collector 1094100000528__ 0.53 1.80 0.19 2 Urban Collector 577000000553__ 27.97 29.29 0.19 2 Urban Collector 555900000523__ 22.09 22.38 0.18 2 Urban Collector 1299600000534__ 21.46 22.21 0.18 2 Urban Collector 514500000525__ 0.00 0.61 0.17 2 Urban Collector 645500000545__ 12.54 13.78 0.14 2 Urban Collector 407900000579__ 0.00 0.95 0.11 2 Urban Collector 1333000000555__ 27.37 29.80 0.10 2 Urban Collector 839800000534__ 2.23 3.29 0.10 2 Urban Collector 670800000181__ 2.84 4.07 0.09 2 Urban Collector 1211100000534__ 20.29 21.46 0.09 2 Urban Collector 6684Table 28. Calculated crash rate in descending order for Rural Minor Collector.SRIStartMPEndMPCrashRateLanesRoadway function ofclass00000173__ 8.28 8.49 0.97 1 Rural Minor Collector 671300000173__ 8.49 11.55 0.20 2 Rural Minor Collector 671300000173__ 3.94 5.89 0.05 2 Rural Minor Collector 6713AADT00000173__ 5.89 8.12 0.05 5 Rural Minor Collector 6713110
Roadside inspection and crash data analysisTable 29. Calculated crash rate in descending order for Rural Principal Arterial.SRIStartMPEndMPCrashRate Lanes Roadway function of class AADT00000070__ 33.31 33.32 6.49 2 Rural Principal Arterial 1054600000040__ 16.50 16.56 2.14 2 Rural Principal Arterial 1065300000070__ 26.39 26.47 1.90 1 Rural Principal Arterial 900100000040__ 16.56 16.60 1.61 1 Rural Principal Arterial 1065300000023__ 52.39 52.53 1.07 2 Rural Principal Arterial 459300000070__ 26.32 26.39 0.93 1 Rural Principal Arterial 1050400000046__ 0.00 0.18 0.84 1 Rural Principal Arterial 902700000040__ 35.13 35.36 0.78 4 Rural Principal Arterial 766100000033__ 35.90 36.03 0.45 4 Rural Principal Arterial 3528400000322__ 2.38 2.60 0.36 4 Rural Principal Arterial 1706000000206__ 31.07 31.30 0.35 2 Rural Principal Arterial 1695200000023__ 47.26 48.99 0.33 2 Rural Principal Arterial 239100000049__ 20.57 20.89 0.32 2 Rural Principal Arterial 673700000049__ 18.67 20.57 0.23 2 Rural Principal Arterial 468500000023__ 48.99 49.76 0.19 2 Rural Principal Arterial 459300000015__ 16.25 16.61 0.19 3 Rural Principal Arterial 2053900000049__ 16.92 18.67 0.18 2 Rural Principal Arterial 433900000030__ 27.16 27.95 0.16 4 Rural Principal Arterial 1077900000322__ 2.60 3.86 0.16 2 Rural Principal Arterial 1706000000322__ 14.86 15.15 0.16 4 Rural Principal Arterial 1500600000015__ 16.70 16.88 0.15 2 Rural Principal Arterial 2552500000206__ 114.14 114.45 0.14 4 Rural Principal Arterial 1535200000046__ 0.18 2.86 0.14 2 Rural Principal Arterial 902700000015__ 16.88 19.52 0.13 2 Rural Principal Arterial 1794200000031__ 13.70 13.97 0.12 3 Rural Principal Arterial 2108100000031__ 8.59 9.66 0.12 2 Rural Principal Arterial 2218000000033__ 35.21 35.90 0.11 2 Rural Principal Arterial 3528400000049__ 6.17 7.03 0.11 2 Rural Principal Arterial 1447500000033__ 31.01 33.40 0.11 2 Rural Principal Arterial 1837700000072__ 0.04 3.48 0.11 2 Rural Principal Arterial 919300000322__ 13.53 14.86 0.10 2 Rural Principal Arterial 1500600000040__ 11.67 16.50 0.10 2 Rural Principal Arterial 13370111
Roadside inspection and crash data analysisTable 30. Calculated crash rate in descending order for Rural Minor Arterial.SRIStartMPEndMPCrashRateLanesRoadway function ofclassAADT00000094__ 0.47 0.61 0.92 2 Rural Minor Arterial 541600000094__ 0.25 0.40 0.74 1 Rural Minor Arterial 609800000517__ 20.39 20.48 0.53 4 Rural Minor Arterial 1432400000510__ 2.79 3.44 0.27 2 Rural Minor Arterial 1159000000541__ 0.00 1.79 0.23 2 Rural Minor Arterial 166500000130__ 7.94 9.42 0.19 2 Rural Minor Arterial 487500000284__ 3.96 6.21 0.18 2 Rural Minor Arterial 170700000130__ 5.17 6.02 0.14 2 Rural Minor Arterial 559900000130__ 6.02 7.94 0.14 2 Rural Minor Arterial 505400000077__ 10.68 14.06 0.13 2 Rural Minor Arterial 460500000050__ 21.24 24.98 0.13 2 Rural Minor Arterial 704700000077__ 5.90 10.68 0.13 2 Rural Minor Arterial 563600000046__ 15.89 17.60 0.12 2 Rural Minor Arterial 963100000540__ 39.38 40.30 0.12 2 Rural Minor Arterial 609200000094__ 11.87 14.08 0.12 2 Rural Minor Arterial 511800000077__ 16.36 20.70 0.12 2 Rural Minor Arterial 545000000068__ 4.84 7.97 0.11 2 Rural Minor Arterial 1147900000537__ 32.75 33.97 0.11 2 Rural Minor Arterial 497800000179__ 1.84 2.83 0.11 2 Rural Minor Arterial 616000000094__ 24.91 27.70 0.11 2 Rural Minor Arterial 875300000094__ 14.08 21.36 0.11 2 Rural Minor Arterial 589400000054__ 1.10 1.73 0.10 2 Rural Minor Arterial 1038900000077__ 14.12 16.36 0.10 2 Rural Minor Arterial 613600000130__ 9.42 11.84 0.10 2 Rural Minor Arterial 574000000054__ 1.73 6.10 0.10 2 Rural Minor Arterial 11161112
Roadside inspection and crash data analysisTable 31. Calculated crash rate in descending order for Rural Major Collector.SRIStartMPEnd MPCrashRate Lanes Roadway function of class AADT00000519__ 42.04 42.05 6.26 2 Rural Major Collector 1094100000550__ 11.98 12.01 4.22 4 Rural Major Collector 541100000540__ 7.41 7.54 0.84 4 Rural Major Collector 626400000557__ 0.00 3.10 0.42 2 Rural Major Collector 53100000581__ 10.62 13.70 0.38 2 Rural Major Collector 58700000521__ 19.79 23.85 0.33 2 Rural Major Collector 50700000565__ 7.20 8.02 0.28 2 Rural Major Collector 296300000539__ 3.49 10.33 0.23 2 Rural Major Collector 129900000553__ 29.72 32.76 0.22 2 Rural Major Collector 414500000526__ 10.64 13.92 0.22 2 Rural Major Collector 192300000519__ 14.86 17.52 0.19 2 Rural Major Collector 265500000540__ 1.53 4.25 0.15 2 Rural Major Collector 694200000521__ 1.12 6.09 0.12 2 Rural Major Collector 351400000550__ 12.08 15.15 0.10 2 Rural Major Collector 435400000545__ 9.15 12.54 0.10 2 Rural Major Collector 4079Table 32. Calculated crash rate in descending order for Rural Interstate.SRIStartMPEndMPCrashRateLanesRoadway function ofclassAADT00000080__ 19.88 22.75 0.15 4 Rural Interstate 5089500000295__ 14.17 14.33 0.15 2 Rural Interstate 5811400000078__ 30.25 30.80 0.14 2 Rural Interstate 9551900000080__ 0.00 0.50 0.13 2 Rural Interstate 5230000000080__ 4.58 5.32 0.12 3 Rural Interstate 4522700000080__ 18.83 19.88 0.12 4 Rural Interstate 4310100000195__ 7.37 8.54 0.10 2 Rural Interstate 2912000000078__ 5.47 7.46 0.10 3 Rural Interstate 8984800000095__ 16.55 19.45 0.10 3 Rural Interstate 135654113
Roadside inspection and crash data analysisSRITable 33. Calculated Critical Crash rate in descending order for Urban Principal Arterial.StartMPEndMPCrashRateCriticalRate114CriticalRateFactor Lane Roadway class AADT00000001T_ 1.05 1.13 1.55 0.43 3.57 3 Urban Principal Arterial 4968900000001__ 61.91 62.08 1.26 0.38 3.36 2 Urban Principal Arterial 2873400000551__ 33.59 34.57 0.88 0.32 2.73 2 Urban Principal Arterial 715000000439__ 0.63 0.75 1.13 0.47 2.39 2 Urban Principal Arterial 2525000000009__ 129.36 129.80 0.51 0.22 2.31 2 Urban Principal Arterial 4570900000001T_ 2.20 2.27 1.15 0.50 2.30 3 Urban Principal Arterial 4268900000206__ 38.71 39.17 0.90 0.42 2.13 2 Urban Principal Arterial 818000000561__ 50.46 50.93 0.87 0.42 2.09 2 Urban Principal Arterial 838200000023__ 5.44 5.50 1.68 0.81 2.06 3 Urban Principal Arterial 2044000000503__ 0.55 0.76 0.84 0.41 2.05 2 Urban Principal Arterial 1951700000021__ 0.89 1.00 0.83 0.41 2.04 2 Urban Principal Arterial 3751800000001__ 60.76 61.91 0.48 0.23 2.04 4 Urban Principal Arterial 2873400000001__ 28.54 29.06 0.36 0.20 1.85 3 Urban Principal Arterial 7996800000030__ 8.06 8.26 0.60 0.32 1.84 2 Urban Principal Arterial 3445700000001__ 38.50 38.85 0.39 0.21 1.83 2 Urban Principal Arterial 6518300000202__ 71.25 71.31 2.67 1.51 1.77 4 Urban Principal Arterial 855600000007__ 0.00 0.55 0.49 0.28 1.73 2 Urban Principal Arterial 1788300000031__ 6.18 6.20 2.47 1.43 1.73 4 Urban Principal Arterial 2218000000009__ 120.97 121.63 0.35 0.21 1.70 3 Urban Principal Arterial 5026100000130__ 45.92 46.45 0.43 0.26 1.66 4 Urban Principal Arterial 4226500000202__ 65.33 65.55 0.73 0.45 1.64 3 Urban Principal Arterial 1698900000045__ 25.83 25.96 1.11 0.69 1.61 4 Urban Principal Arterial 1422200000035__ 29.38 29.47 0.81 0.52 1.56 2 Urban Principal Arterial 2831100000206__ 82.27 82.32 1.40 0.90 1.55 2 Urban Principal Arterial 1951500000124__ 11.17 11.30 1.03 0.66 1.55 4 Urban Principal Arterial 1541700000009W_ 0.65 0.76 0.78 0.51 1.53 2 Urban Principal Arterial 2402900000018__ 35.32 37.14 0.28 0.19 1.51 3 Urban Principal Arterial 2790000000129__ 0.32 0.64 1.66 1.12 1.48 1 Urban Principal Arterial 257300000070__ 54.22 54.35 0.54 0.37 1.46 2 Urban Principal Arterial 3903300000543__ 5.40 5.41 8.15 5.71 1.43 2 Urban Principal Arterial 840500000036__ 1.72 3.26 0.39 0.27 1.42 2 Urban Principal Arterial 683000000001T_ 2.74 3.75 0.25 0.18 1.40 2 Urban Principal Arterial 4268900000035__ 55.08 56.37 0.30 0.21 1.39 5 Urban Principal Arterial 1786900000093__ 0.00 0.61 0.42 0.30 1.39 4 Urban Principal Arterial 2152500000001__ 38.85 43.11 0.20 0.14 1.38 3 Urban Principal Arterial 6623800000023__ 34.36 35.50 0.30 0.22 1.35 2 Urban Principal Arterial 1825700000032__ 0.00 0.90 0.29 0.22 1.34 2 Urban Principal Arterial 2339200000035__ 50.76 50.88 0.76 0.57 1.33 4 Urban Principal Arterial 22592
Roadside inspection and crash data analysis00000440__ 20.88 21.01 0.61 0.46 1.33 1 Urban Principal Arterial 3448900000017__ 8.85 9.20 0.28 0.21 1.32 3 Urban Principal Arterial 8371700000049__ 26.44 26.94 0.45 0.34 1.31 2 Urban Principal Arterial 1223100000017__ 8.55 8.85 0.27 0.21 1.31 2 Urban Principal Arterial 8371700000206__ 34.32 35.17 0.30 0.23 1.31 2 Urban Principal Arterial 2158200000206__ 17.58 17.66 0.89 0.69 1.30 2 Urban Principal Arterial 1919900000018__ 34.41 35.32 0.32 0.25 1.30 4 Urban Principal Arterial 2790000000004__ 3.30 3.45 0.29 0.23 1.29 2 Urban Principal Arterial 12569400000130__ 30.48 34.18 0.20 0.16 1.29 3 Urban Principal Arterial 4063300000508__ 9.94 11.28 0.27 0.21 1.28 2 Urban Principal Arterial 1681100000206__ 41.15 42.74 0.36 0.29 1.27 2 Urban Principal Arterial 594600000001__ 62.09 62.73 0.41 0.33 1.24 4 Urban Principal Arterial 1575600000510__ 27.12 27.49 0.52 0.42 1.24 4 Urban Principal Arterial 1418700000022__ 36.94 37.17 0.32 0.26 1.23 3 Urban Principal Arterial 6579600000028__ 2.27 2.29 3.50 2.86 1.23 2 Urban Principal Arterial 978100000046__ 69.19 69.37 0.35 0.29 1.21 6 Urban Principal Arterial 3305700000440__ 19.94 20.34 0.30 0.25 1.19 2 Urban Principal Arterial 3448900000001__ 57.48 60.64 0.22 0.19 1.19 4 Urban Principal Arterial 3385800000130__ 55.45 55.46 3.06 2.57 1.19 2 Urban Principal Arterial 2241100000046__ 70.50 70.75 0.38 0.32 1.18 4 Urban Principal Arterial 4324300000046__ 69.37 69.97 0.31 0.27 1.17 4 Urban Principal Arterial 3305700000001__ 35.45 35.89 0.26 0.23 1.16 3 Urban Principal Arterial 5345800000168__ 6.58 7.42 0.26 0.23 1.15 3 Urban Principal Arterial 2817100000440__ 18.89 19.76 0.23 0.20 1.15 2 Urban Principal Arterial 3448900000070__ 46.70 47.00 0.48 0.42 1.14 3 Urban Principal Arterial 1438300000001__ 19.74 20.73 0.20 0.17 1.13 2 Urban Principal Arterial 5268600000009__ 132.79 132.85 0.43 0.38 1.13 2 Urban Principal Arterial 7982400000510__ 16.62 16.73 0.64 0.57 1.13 2 Urban Principal Arterial 1935400000109__ 2.31 2.39 2.36 2.11 1.12 2 Urban Principal Arterial 362800000508__ 8.30 9.94 0.27 0.24 1.12 4 Urban Principal Arterial 1681100000501__ 31.15 32.84 0.25 0.23 1.12 4 Urban Principal Arterial 2238300000022__ 56.16 57.05 0.19 0.17 1.10 2 Urban Principal Arterial 6583100000034__ 22.27 22.41 0.78 0.71 1.10 4 Urban Principal Arterial 1254600000001B_ 0.25 0.42 0.78 0.71 1.10 4 Urban Principal Arterial 1035300000046__ 71.74 72.09 0.26 0.24 1.10 2 Urban Principal Arterial 4472400000070__ 48.81 49.90 0.26 0.24 1.10 2 Urban Principal Arterial 1438300000503__ 1.05 1.48 0.33 0.30 1.09 2 Urban Principal Arterial 1951700000507__ 12.65 12.78 0.58 0.54 1.07 2 Urban Principal Arterial 1825400000440__ 20.88 21.01 0.42 0.40 1.07 1 Urban Principal Arterial 4967400000017__ 10.11 11.96 0.15 0.14 1.07 2 Urban Principal Arterial 10984100000440__ 20.34 20.88 0.26 0.24 1.07 3 Urban Principal Arterial 3448900000049__ 24.86 25.58 0.32 0.30 1.06 4 Urban Principal Arterial 1766000000206__ 41.15 42.74 0.26 0.25 1.03 2 Urban Principal Arterial 8180115
Roadside inspection and crash data analysis00000035__ 52.18 53.31 0.21 0.21 1.03 5 Urban Principal Arterial 2259200000124__ 11.00 11.17 0.52 0.51 1.03 2 Urban Principal Arterial 1541700000130__ 72.07 74.51 0.16 0.16 1.02 2 Urban Principal Arterial 3264000000035__ 37.00 37.33 0.28 0.28 1.02 3 Urban Principal Arterial 3659600000001T_ 1.13 2.20 0.19 0.18 1.02 3 Urban Principal Arterial 5118200000202__ 30.51 31.50 0.19 0.19 1.01 2 Urban Principal Arterial 36058116
Roadside inspection and crash data analysisTable 34. Calculated Critical Crash rate in descending order Urban Minor Arterial.SRIStartMPEnd MPCrashRateCriticalRateCriticalRate Factor Lane Roadway class AADT00000531__ 1.55 1.99 0.88 0.31 2.83 2 Urban Minor Arterial 1415000000130__ 11.84 12.21 1.29 0.53 2.41 2 Urban Minor Arterial 574000000501__ 30.76 31.15 0.63 0.30 2.11 4 Urban Minor Arterial 2238300000517__ 32.90 34.05 0.58 0.32 1.81 3 Urban Minor Arterial 307800000046__ 21.26 21.69 0.57 0.32 1.80 2 Urban Minor Arterial 1400300000555__ 14.83 15.12 0.68 0.38 1.78 2 Urban Minor Arterial 1397200000009__ 23.64 23.82 1.02 0.59 1.72 1 Urban Minor Arterial 1158600000535__ 17.43 22.76 0.24 0.15 1.61 2 Urban Minor Arterial 1252600000509__ 15.85 15.89 1.56 0.98 1.60 1 Urban Minor Arterial 2197400000501__ 29.37 30.56 0.31 0.21 1.49 4 Urban Minor Arterial 2238300000109__ 1.94 2.31 1.02 0.70 1.46 2 Urban Minor Arterial 362800000514__ 38.21 38.79 0.54 0.39 1.38 2 Urban Minor Arterial 651600000068__ 2.87 2.90 5.47 3.99 1.37 2 Urban Minor Arterial 417300000543__ 0.00 5.30 0.22 0.16 1.34 2 Urban Minor Arterial 840500000007__ 5.99 8.05 0.26 0.20 1.31 4 Urban Minor Arterial 1536300000537__ 31.23 31.25 4.07 3.12 1.30 2 Urban Minor Arterial 842300000520__ 13.57 13.70 0.90 0.69 1.30 4 Urban Minor Arterial 1168800000508__ 12.20 15.81 0.21 0.16 1.30 2 Urban Minor Arterial 1172100000047__ 68.32 68.45 0.82 0.66 1.25 4 Urban Minor Arterial 1282000000535__ 0.60 2.41 0.30 0.24 1.24 2 Urban Minor Arterial 631400000501__ 27.40 29.37 0.22 0.18 1.23 4 Urban Minor Arterial 2347000000181__ 5.43 5.82 0.65 0.54 1.21 2 Urban Minor Arterial 537300000035__ 1.38 2.10 0.25 0.21 1.20 3 Urban Minor Arterial 1158000000531__ 0.10 0.69 0.32 0.27 1.17 2 Urban Minor Arterial 1459800000202__ 53.16 54.24 0.37 0.33 1.13 2 Urban Minor Arterial 514200000554__ 0.00 4.65 0.26 0.23 1.13 2 Urban Minor Arterial 283500000054__ 8.71 10.11 0.22 0.19 1.13 2 Urban Minor Arterial 1563800000501__ 26.90 27.12 0.55 0.49 1.12 2 Urban Minor Arterial 1132400000140__ 0.00 0.88 0.35 0.32 1.10 2 Urban Minor Arterial 660000000012__ 11.48 11.69 0.52 0.47 1.09 2 Urban Minor Arterial 1263700000501__ 30.56 30.76 0.31 0.28 1.09 3 Urban Minor Arterial 2238300000516__ 9.15 9.22 2.11 1.95 1.08 4 Urban Minor Arterial 463200000053__ 4.63 4.66 1.65 1.56 1.06 2 Urban Minor Arterial 1382000000506__ 7.89 8.15 0.46 0.44 1.03 2 Urban Minor Arterial 1150600000516__ 6.90 7.19 0.45 0.44 1.02 2 Urban Minor Arterial 1057200000533__ 8.05 8.41 0.43 0.43 1.01 2 Urban Minor Arterial 8799117
Roadside inspection and crash data analysisSRITable 35. Calculated Critical Crash rate in descending order for Urban Interstate.StartMPEndMPCrashRateCriticalRateCriticalRateFactor Lane Roadway class AADT00000095__ 61.48 61.52 3.07 0.53 5.79 4 Urban Interstate 11150300000295__ 26.59 27.22 0.44 0.13 3.39 2 Urban Interstate 7143500000095__ 54.01 54.77 0.35 0.11 3.28 3 Urban Interstate 24766200000078__ 18.46 20.78 0.27 0.12 2.23 3 Urban Interstate 3773100000076__ 0.00 0.37 0.23 0.12 1.92 2 Urban Interstate 15846900000078__ 17.87 18.46 0.26 0.14 1.87 3 Urban Interstate 8506400000078__ 58.58 62.01 0.17 0.09 1.82 2 Urban Interstate 8266900000287__ 2.24 2.30 0.76 0.42 1.78 4 Urban Interstate 13569700000095__ 60.38 61.20 0.19 0.11 1.77 2 Urban Interstate 11150300000287__ 41.89 42.02 0.31 0.18 1.72 3 Urban Interstate 15258000000095__ 59.13 59.42 0.21 0.13 1.61 3 Urban Interstate 22517800000080__ 67.22 68.54 0.18 0.11 1.59 3 Urban Interstate 11802800000078__ 16.24 17.87 0.17 0.11 1.53 3 Urban Interstate 8502700000080__ 26.25 27.19 0.19 0.13 1.47 3 Urban Interstate 6828800000078__ 56.45 57.32 0.17 0.12 1.46 3 Urban Interstate 12888900000095__ 25.15 28.51 0.14 0.10 1.42 3 Urban Interstate 14039700000078__ 57.78 58.58 0.17 0.12 1.39 3 Urban Interstate 11059100000287__ 42.02 44.95 0.14 0.11 1.31 3 Urban Interstate 6455100000287__ 7.27 8.47 0.17 0.14 1.28 3 Urban Interstate 4609900000287__ 0.00 0.70 0.19 0.15 1.28 5 Urban Interstate 10226500000287__ 12.30 13.50 0.14 0.12 1.23 3 Urban Interstate 9059000000295__ 27.39 28.16 0.15 0.12 1.23 3 Urban Interstate 10455700000078__ 48.15 49.40 0.13 0.11 1.22 2 Urban Interstate 7373500000287__ 13.50 14.30 0.15 0.12 1.21 3 Urban Interstate 10946900000295__ 9.15 10.30 0.16 0.14 1.15 2 Urban Interstate 2942000000078__ 51.76 53.12 0.13 0.11 1.15 3 Urban Interstate 12399800000280__ 13.74 14.42 0.14 0.12 1.14 2 Urban Interstate 7780100000080__ 27.19 28.82 0.12 0.11 1.12 3 Urban Interstate 9894600000287__ 9.95 10.01 0.31 0.28 1.11 3 Urban Interstate 11092100000295__ 1.39 1.92 0.21 0.19 1.08 2 Urban Interstate 2444300000095__ 7.95 15.15 0.10 0.09 1.08 3 Urban Interstate 12312100000287__ 8.47 9.95 0.12 0.11 1.06 3 Urban Interstate 9672000000095__ 42.73 45.50 0.10 0.10 1.06 3 Urban Interstate 19026000000280__ 13.32 13.74 0.14 0.14 1.04 2 Urban Interstate 9253700000080__ 58.22 58.92 0.25 0.25 1.03 4 Urban Interstate 124020118
Roadside inspection and crash data analysisSRITable 36. Calculated Critical Crash rate in descending order for Urban Freeway/Expressway.StartMPEndMPCrashRateCriticalRateCriticalRateFactor Lane Roadway class AADT00000444__ 7.81 8.40 0.51 0.16 3.11 3 Urban Freeway/Expressway 1590000000700__ 1.12 1.88 0.26 0.09 2.78 2 Urban Freeway/Expressway 5129200000440__ 0.00 2.01 0.17 0.06 2.72 3 Urban Freeway/Expressway 8460000000024__ 10.18 10.42 0.24 0.11 2.18 3 Urban Freeway/Expressway 9346000000001__ 51.43 54.61 0.12 0.06 1.84 2 Urban Freeway/Expressway 6352300000003__ 4.95 6.39 0.12 0.06 1.83 3 Urban Freeway/Expressway 10646900000021__ 8.00 9.28 0.12 0.07 1.61 3 Urban Freeway/Expressway 6900400000029__ 4.29 4.34 0.61 0.38 1.61 2 Urban Freeway/Expressway 4509300000003__ 0.00 0.22 0.17 0.11 1.50 2 Urban Freeway/Expressway 11219600000018__ 14.51 19.02 0.10 0.06 1.50 2 Urban Freeway/Expressway 3954600000042__ 12.80 14.28 0.07 0.05 1.37 4 Urban Freeway/Expressway 14640100000004__ 5.00 5.69 0.10 0.08 1.36 3 Urban Freeway/Expressway 10587400000024__ 0.55 1.65 0.10 0.07 1.35 3 Urban Freeway/Expressway 7538000000700__ 26.32 34.70 0.07 0.05 1.35 2 Urban Freeway/Expressway 6394800000004__ 9.01 10.26 0.09 0.07 1.25 3 Urban Freeway/Expressway 8223600000024__ 6.75 7.11 0.13 0.10 1.23 3 Urban Freeway/Expressway 7415500000444__ 129.50 130.63 0.02 0.02 1.19 5 Urban Freeway/Expressway 8618000000003__ 8.02 9.12 0.07 0.06 1.18 4 Urban Freeway/Expressway 15098700000003__ 6.39 7.39 0.07 0.06 1.17 4 Urban Freeway/Expressway 12854900000003__ 1.44 3.82 0.07 0.06 1.17 3 Urban Freeway/Expressway 12142700000138__ 0.33 0.71 0.14 0.12 1.15 2 Urban Freeway/Expressway 5142100000024__ 9.45 10.18 0.09 0.08 1.14 3 Urban Freeway/Expressway 9630600000446__ 43.61 44.19 0.11 0.10 1.14 4 Urban Freeway/Expressway 4172200000003__ 3.82 4.95 0.07 0.06 1.10 3 Urban Freeway/Expressway 13894100000700__ 34.72 44.36 0.05 0.05 1.08 3 Urban Freeway/Expressway 7799200000055__ 35.01 39.36 0.07 0.07 1.04 2 Urban Freeway/Expressway 3128800000001__ 2.87 3.75 0.10 0.10 1.01 2 Urban Freeway/Expressway 3873800000004__ 10.26 10.68 0.10 0.10 1.01 2 Urban Freeway/Expressway 8223600000444__ 82.35 84.10 0.07 0.07 1.00 3 Urban Freeway/Expressway 55430119
Roadside inspection and crash data analysisTable 37. Calculated Critical Crash rate in descending order for Urban Collector.SRISRIStart MPEndMPCrashRateCriticalRateCritical RateFactor Lane Roadway class AADT00000579__ 36.71 37.24 1.87 0.78 2.39 2 Urban Collector 207600000543__ 19.11 24.80 0.27 0.21 1.28 2 Urban Collector 265000000532__ 4.05 5.41 0.58 0.49 1.17 2 Urban Collector 174700000522__ 13.00 14.37 0.26 0.22 1.16 2 Urban Collector 9673Table 38. Calculated Critical Crash rate in descending order for Rural Principal Arterial.StartMPEndMPCrashRateCriticalRateCritical RateFactor Lane Roadway class AADT00000040__ 16.50 16.56 2.14 1.29 1.66 2 Rural Principal Arterial 1065300000070__ 33.31 33.32 6.49 4.92 1.32 2 Rural Principal Arterial 1054600000015__ 16.25 16.61 0.19 0.18 1.01 3 Rural Principal Arterial 20539SRISRITable 39. Calculated Critical Crash rate in descending order for Rural Minor Collector.StartMPEndMPCrashRateCriticalRateCriticalRate Factor Lane Roadway class AADT00000173__ 8.49 11.55 0.20 0.19 1.06 2 Rural Minor Collector 6713SRITable 40. Calculated Critical Crash rate in descending order for Rural Minor Arterial.StartMPEndMPCrashRateCriticalRateCriticalRateFactor Lane Roadway class AADT00000510__ 2.79 3.44 0.27 0.22 1.22 2 Rural Minor Arterial 1159000000094__ 0.47 0.61 0.92 0.90 1.02 2 Rural Minor Arterial 5416Table 41. Calculated Critical Crash rate in descending order for Rural Major Collector.StartMPEndMPCrashRateCriticalRateCriticalRateFactor Lane Roadway class AADT00000519__ 42.04 42.05 6.26 4.43 1.41 2 Rural Major Collector 10941Table 42. Calculated Critical Crash rate in descending order for Rural Interstate.SRIStartMPEndMPCrashRateCriticalRateCritical RateFactor Lane Roadway class AADT00000080__ 19.88 22.75 0.15 0.10 1.53 4 Rural Interstate 5089500000078__ 30.25 30.80 0.14 0.12 1.23 2 Rural Interstate 95519120
Roadside inspection and crash data analysisSRITable 43. Calculated severity rate in descending order for Urban Principal Arterial.StartMPEndMPSeverityRate Lanes Roadway class AADT00000017__ 23.60 26.81 0.12 3 Urban Principal Arterial 6297200000129__ 0.84 1.08 0.12 2 Urban Principal Arterial 2407600000049__ 5.37 6.17 0.12 2 Urban Principal Arterial 1447500000038__ 4.02 5.29 0.12 2 Urban Principal Arterial 5476000000439__ 3.48 3.94 0.12 2 Urban Principal Arterial 2525000000001B_ 0.48 2.73 0.12 2 Urban Principal Arterial 3361700000042__ 0.00 3.51 0.12 2 Urban Principal Arterial 2820600000072__ 20.57 20.97 0.12 3 Urban Principal Arterial 1456800000035__ 24.86 29.38 0.12 2 Urban Principal Arterial 1677200000206__ 92.16 94.92 0.12 3 Urban Principal Arterial 2113000000030__ 12.07 13.53 0.12 4 Urban Principal Arterial 2798600000045__ 21.63 24.92 0.12 2 Urban Principal Arterial 1598000000046__ 24.76 29.01 0.12 4 Urban Principal Arterial 2887000000154__ 0.00 0.27 0.12 3 Urban Principal Arterial 2168000000035__ 50.88 52.18 0.12 2 Urban Principal Arterial 2259200000508__ 7.95 8.30 0.12 2 Urban Principal Arterial 1681100000147__ 3.54 3.96 0.12 4 Urban Principal Arterial 1410000000030__ 27.95 28.50 0.12 4 Urban Principal Arterial 1077900000033__ 14.39 14.77 0.12 2 Urban Principal Arterial 1560500000040__ 26.71 27.20 0.12 2 Urban Principal Arterial 1211000000073__ 27.08 27.22 0.12 2 Urban Principal Arterial 8494500000034__ 0.15 0.51 0.12 4 Urban Principal Arterial 3297600000047__ 1.16 3.06 0.11 2 Urban Principal Arterial 1881900000503__ 3.26 3.97 0.11 2 Urban Principal Arterial 839400000183__ 0.59 0.99 0.11 2 Urban Principal Arterial 1491200000030__ 4.26 6.98 0.11 2 Urban Principal Arterial 1755000000130__ 55.46 55.71 0.11 2 Urban Principal Arterial 2394000000510__ 20.32 21.60 0.11 4 Urban Principal Arterial 1871300000035__ 12.62 12.88 0.11 2 Urban Principal Arterial 2308400000023__ 3.98 4.57 0.11 2 Urban Principal Arterial 2044000000038__ 6.12 6.66 0.11 3 Urban Principal Arterial 4467800000087__ 0.30 1.70 0.11 1 Urban Principal Arterial 1732200000154__ 0.27 0.55 0.11 2 Urban Principal Arterial 2168000000072__ 23.10 23.25 0.11 2 Urban Principal Arterial 4052600000004__ 4.31 5.00 0.11 3 Urban Principal Arterial 10587400000322__ 15.26 15.65 0.11 4 Urban Principal Arterial 1562800000040__ 61.95 63.57 0.11 2 Urban Principal Arterial 3765100000028__ 8.09 10.55 0.11 4 Urban Principal Arterial 2237200000184__ 1.08 1.37 0.11 2 Urban Principal Arterial 2109600000139U_ 0.14 0.42 0.11 2 Urban Principal Arterial 21940121
Roadside inspection and crash data analysis00000034__ 20.13 20.62 0.11 4 Urban Principal Arterial 1254600000034__ 19.64 20.13 0.11 3 Urban Principal Arterial 1254600000553__ 43.97 44.25 0.11 2 Urban Principal Arterial 2196100000047__ 62.83 63.31 0.11 2 Urban Principal Arterial 1282000000046__ 51.54 52.42 0.11 2 Urban Principal Arterial 3498500000070__ 2.32 2.56 0.11 3 Urban Principal Arterial 5133900000082__ 0.00 1.13 0.11 4 Urban Principal Arterial 2736000000033__ 24.01 24.35 0.11 2 Urban Principal Arterial 1821200000021__ 3.34 3.96 0.11 4 Urban Principal Arterial 6002600000509__ 23.06 24.19 0.11 2 Urban Principal Arterial 2197400000440__ 19.76 19.94 0.11 3 Urban Principal Arterial 3448900000440__ 23.03 23.28 0.11 2 Urban Principal Arterial 4967400000206__ 95.02 95.61 0.11 2 Urban Principal Arterial 2113000000528__ 31.11 34.30 0.11 4 Urban Principal Arterial 1173000000571__ 36.90 40.32 0.11 4 Urban Principal Arterial 1826800000047__ 0.76 1.16 0.11 2 Urban Principal Arterial 1584200000023__ 5.69 5.99 0.11 3 Urban Principal Arterial 8347200000133__ 0.00 0.90 0.11 2 Urban Principal Arterial 696900000033__ 21.10 24.01 0.11 2 Urban Principal Arterial 2378700000042__ 3.51 6.35 0.11 2 Urban Principal Arterial 5991400000040__ 22.92 24.70 0.11 2 Urban Principal Arterial 1067700000023__ 4.57 4.88 0.11 4 Urban Principal Arterial 2044000000036__ 15.39 16.83 0.11 2 Urban Principal Arterial 1763600000206__ 88.31 88.62 0.11 2 Urban Principal Arterial 2048300000206__ 100.33 101.60 0.11 2 Urban Principal Arterial 1501900000029__ 18.87 19.66 0.11 2 Urban Principal Arterial 806200000040__ 51.93 53.08 0.11 2 Urban Principal Arterial 3325300000001__ 63.84 63.97 0.11 2 Urban Principal Arterial 4906800000035__ 43.75 44.66 0.11 2 Urban Principal Arterial 3509700000501__ 0.00 3.36 0.11 2 Urban Principal Arterial 1532200000506__ 2.63 3.26 0.11 4 Urban Principal Arterial 2043200000037__ 6.65 7.35 0.11 3 Urban Principal Arterial 5530800000010__ 14.20 15.72 0.11 2 Urban Principal Arterial 3406600000009__ 107.00 109.85 0.11 2 Urban Principal Arterial 4565000000001__ 27.19 28.54 0.11 3 Urban Principal Arterial 10135700000070__ 55.00 55.13 0.10 3 Urban Principal Arterial 5018200000508__ 3.08 3.47 0.10 4 Urban Principal Arterial 1681100000033B_ 3.01 3.56 0.10 2 Urban Principal Arterial 1197300000073__ 25.75 26.20 0.10 3 Urban Principal Arterial 5856500000166__ 1.97 2.22 0.10 2 Urban Principal Arterial 2644300000093__ 0.64 3.42 0.10 2 Urban Principal Arterial 2381100000005__ 0.48 0.87 0.10 3 Urban Principal Arterial 1700600000018__ 41.96 42.28 0.10 2 Urban Principal Arterial 41947122
Roadside inspection and crash data analysis00000040__ 57.41 59.08 0.10 2 Urban Principal Arterial 2815000000028__ 20.06 21.67 0.10 2 Urban Principal Arterial 1670500000046__ 49.36 50.71 0.10 2 Urban Principal Arterial 4484400000070__ 47.00 48.41 0.10 2 Urban Principal Arterial 1438300000168__ 8.64 8.99 0.10 2 Urban Principal Arterial 1933000000027__ 8.40 8.70 0.10 3 Urban Principal Arterial 2255300000031__ 39.33 40.74 0.10 2 Urban Principal Arterial 1920100000034__ 22.41 23.08 0.10 4 Urban Principal Arterial 2026000000027__ 4.11 6.70 0.10 2 Urban Principal Arterial 1048400000202__ 50.70 51.14 0.10 4 Urban Principal Arterial 1544600000010__ 12.79 13.00 0.10 2 Urban Principal Arterial 6475000000031__ 6.84 7.14 0.10 1 Urban Principal Arterial 2218000000037__ 2.57 2.90 0.10 2 Urban Principal Arterial 2068000000202__ 17.73 19.01 0.10 2 Urban Principal Arterial 4271800000038__ 1.69 2.92 0.10 3 Urban Principal Arterial 5035500000072__ 21.65 21.82 0.10 2 Urban Principal Arterial 4052600000046__ 63.85 68.01 0.10 2 Urban Principal Arterial 5972400000577__ 0.00 0.92 0.10 2 Urban Principal Arterial 1501600000022__ 38.80 39.01 0.10 3 Urban Principal Arterial 6579600000534__ 5.60 6.15 0.10 4 Urban Principal Arterial 2516100000168__ 10.44 10.75 0.10 4 Urban Principal Arterial 2234100000088__ 5.48 8.52 0.10 2 Urban Principal Arterial 1825400000502__ 11.29 12.50 0.10 2 Urban Principal Arterial 1148600000184__ 0.75 1.08 0.10 4 Urban Principal Arterial 2109600000030__ 49.25 51.55 0.10 2 Urban Principal Arterial 3639200000130__ 56.35 56.44 0.10 3 Urban Principal Arterial 7763000000032__ 0.90 1.07 0.10 2 Urban Principal Arterial 4114900000004__ 0.00 2.11 0.10 2 Urban Principal Arterial 10619000000001__ 26.41 27.19 0.10 3 Urban Principal Arterial 11703500000023__ 35.50 35.95 0.10 2 Urban Principal Arterial 1562300000022__ 49.53 50.64 0.10 2 Urban Principal Arterial 5723500000206__ 61.95 62.70 0.10 4 Urban Principal Arterial 1882700000037__ 10.86 13.13 0.10 3 Urban Principal Arterial 3732900000070__ 3.99 5.07 0.10 2 Urban Principal Arterial 5255100000009__ 34.16 34.57 0.10 3 Urban Principal Arterial 1731500000030__ 29.71 32.08 0.10 4 Urban Principal Arterial 1801800000001__ 62.96 63.84 0.10 3 Urban Principal Arterial 4906800000021__ 3.96 4.08 0.10 3 Urban Principal Arterial 6002600000030__ 16.53 17.01 0.10 2 Urban Principal Arterial 15020123
Roadside inspection and crash data analysisSRITable 44. Calculated severity rate in descending order for Urban Minor Arterial.StartMPEndMPSeverityRate Lanes Roadway class AADT00000540__ 36.10 36.20 0.42 2 Urban Minor Arterial 1619200000569__ 1.24 2.06 0.42 2 Urban Minor Arterial 396000000533__ 1.16 1.41 0.42 4 Urban Minor Arterial 1301500000501__ 27.40 29.37 0.41 4 Urban Minor Arterial 2347000000523__ 20.07 20.18 0.41 2 Urban Minor Arterial 1503100000202__ 44.32 44.50 0.41 1 Urban Minor Arterial 919200000537__ 55.24 55.44 0.41 4 Urban Minor Arterial 1655500000514__ 39.23 40.29 0.41 2 Urban Minor Arterial 1094500000524__ 1.91 2.09 0.41 2 Urban Minor Arterial 923200000035__ 1.38 2.10 0.41 3 Urban Minor Arterial 1158000000179__ 0.11 0.32 0.40 2 Urban Minor Arterial 807900000173__ 14.42 14.62 0.40 2 Urban Minor Arterial 856500000543__ 0.00 5.30 0.40 2 Urban Minor Arterial 840500000533__ 27.73 27.85 0.40 2 Urban Minor Arterial 1442700000046__ 20.54 21.26 0.40 2 Urban Minor Arterial 963100000009__ 13.03 13.40 0.39 3 Urban Minor Arterial 942800000553__ 44.25 44.47 0.39 2 Urban Minor Arterial 801300000553__ 44.47 44.91 0.39 4 Urban Minor Arterial 801300000508__ 12.20 15.81 0.39 2 Urban Minor Arterial 1172100000536__ 24.61 27.15 0.38 2 Urban Minor Arterial 283100000534__ 3.29 3.83 0.38 2 Urban Minor Arterial 670800000044__ 0.86 1.71 0.38 2 Urban Minor Arterial 213200000109__ 0.00 1.32 0.38 2 Urban Minor Arterial 550800000159__ 0.45 0.55 0.38 1 Urban Minor Arterial 1819000000094__ 39.30 39.46 0.37 1 Urban Minor Arterial 1153700000068__ 0.00 1.05 0.37 2 Urban Minor Arterial 354500000555__ 9.48 9.70 0.37 2 Urban Minor Arterial 849300000175__ 2.15 2.95 0.36 2 Urban Minor Arterial 236000000579__ 2.99 3.11 0.36 4 Urban Minor Arterial 1579000000054__ 0.00 1.10 0.36 2 Urban Minor Arterial 1038900000056__ 3.79 5.83 0.35 2 Urban Minor Arterial 1326000000527__ 70.05 70.16 0.35 1 Urban Minor Arterial 1757400000516__ 13.74 13.89 0.35 4 Urban Minor Arterial 1299500000555__ 10.05 10.50 0.35 2 Urban Minor Arterial 433200000559__ 27.68 29.15 0.35 2 Urban Minor Arterial 133300000054__ 10.11 10.62 0.35 2 Urban Minor Arterial 1546200000524__ 37.70 37.97 0.34 3 Urban Minor Arterial 737000000077__ 3.08 5.63 0.34 2 Urban Minor Arterial 7032124
Roadside inspection and crash data analysis00000535__ 25.58 25.74 0.34 1 Urban Minor Arterial 1252600000537__ 28.38 29.34 0.34 2 Urban Minor Arterial 842300000571__ 36.48 36.61 0.34 3 Urban Minor Arterial 1563600000044__ 8.80 9.37 0.34 4 Urban Minor Arterial 713700000501__ 23.81 23.99 0.34 2 Urban Minor Arterial 1132400000077__ 2.79 3.08 0.34 4 Urban Minor Arterial 703200000077__ 2.64 2.79 0.33 4 Urban Minor Arterial 1370800000567__ 9.55 10.02 0.33 2 Urban Minor Arterial 875800000514__ 10.87 11.07 0.33 3 Urban Minor Arterial 1029900000553__ 49.20 49.31 0.33 1 Urban Minor Arterial 1813600000513__ 31.18 31.32 0.33 3 Urban Minor Arterial 1489200000517__ 17.10 17.40 0.32 2 Urban Minor Arterial 1432400000077__ 0.52 1.47 0.32 2 Urban Minor Arterial 1362000000559__ 3.32 5.23 0.32 2 Urban Minor Arterial 227000000009__ 48.61 49.09 0.32 2 Urban Minor Arterial 452300000047__ 42.58 42.78 0.31 2 Urban Minor Arterial 2182900000130__ 2.70 3.03 0.31 2 Urban Minor Arterial 1324200000547__ 5.32 5.54 0.31 3 Urban Minor Arterial 1018100000535__ 22.76 22.94 0.30 3 Urban Minor Arterial 1252600000555__ 33.96 34.20 0.30 4 Urban Minor Arterial 941800000571__ 6.19 6.64 0.30 4 Urban Minor Arterial 2013700000540__ 35.82 36.10 0.30 4 Urban Minor Arterial 1619200000056__ 7.69 7.82 0.30 2 Urban Minor Arterial 1749900000181__ 5.24 5.43 0.30 3 Urban Minor Arterial 1211100000007__ 8.05 8.20 0.30 2 Urban Minor Arterial 1536300000071__ 5.49 5.77 0.30 2 Urban Minor Arterial 828100000015__ 2.01 2.05 0.29 2 Urban Minor Arterial 5805800000522__ 0.00 1.34 0.29 2 Urban Minor Arterial 700600000501__ 23.99 26.90 0.29 4 Urban Minor Arterial 1132400000173__ 2.27 3.68 0.29 2 Urban Minor Arterial 671300000555__ 16.93 17.07 0.29 4 Urban Minor Arterial 1693900000047__ 74.89 75.19 0.29 4 Urban Minor Arterial 1583100000514__ 38.99 39.23 0.29 2 Urban Minor Arterial 991600000559A_ 1.43 1.65 0.29 3 Urban Minor Arterial 1085000000047__ 46.44 46.55 0.29 3 Urban Minor Arterial 2182900000284__ 0.00 0.44 0.28 2 Urban Minor Arterial 562100000554__ 4.65 6.16 0.28 2 Urban Minor Arterial 1146800000575__ 11.31 12.61 0.28 2 Urban Minor Arterial 1143000000575__ 6.13 6.35 0.28 2 Urban Minor Arterial 1128800000514__ 40.29 40.71 0.28 2 Urban Minor Arterial 1184300000575__ 8.67 8.88 0.28 3 Urban Minor Arterial 1184900000571__ 6.01 6.19 0.27 3 Urban Minor Arterial 2776700000571__ 4.23 4.32 0.27 3 Urban Minor Arterial 27767125
Roadside inspection and crash data analysis00000567__ 4.71 5.55 0.27 2 Urban Minor Arterial 300500000009__ 7.09 9.62 0.27 2 Urban Minor Arterial 1216400000088__ 5.00 5.14 0.26 3 Urban Minor Arterial 1846700000179__ 1.42 1.84 0.26 2 Urban Minor Arterial 616000000561__ 5.51 11.00 0.26 2 Urban Minor Arterial 284600000575__ 8.98 9.20 0.26 4 Urban Minor Arterial 1184900000579__ 3.11 3.30 0.26 4 Urban Minor Arterial 1373000000553__ 16.17 18.73 0.26 2 Urban Minor Arterial 206000000009__ 48.15 48.61 0.26 2 Urban Minor Arterial 573600000171__ 0.81 1.00 0.26 3 Urban Minor Arterial 1408500000088__ 3.40 5.00 0.25 2 Urban Minor Arterial 1846700000567__ 8.95 9.19 0.25 2 Urban Minor Arterial 1138100000067__ 1.01 1.13 0.25 2 Urban Minor Arterial 2278000000517__ 31.11 32.90 0.25 2 Urban Minor Arterial 307800000524__ 39.51 39.90 0.25 2 Urban Minor Arterial 713500000561__ 48.80 50.46 0.25 2 Urban Minor Arterial 838200000508__ 15.90 16.14 0.24 2 Urban Minor Arterial 1172100000171__ 0.61 0.81 0.24 2 Urban Minor Arterial 1408500000009__ 70.53 71.46 0.24 2 Urban Minor Arterial 1826700000549__ 14.37 16.45 0.24 2 Urban Minor Arterial 1229100000551__ 28.17 29.08 0.24 2 Urban Minor Arterial 628000000047__ 3.42 3.62 0.24 2 Urban Minor Arterial 1433100000524__ 3.39 6.21 0.24 2 Urban Minor Arterial 203800000553__ 46.39 46.75 0.24 3 Urban Minor Arterial 801300000009__ 42.86 43.32 0.23 2 Urban Minor Arterial 639200000585__ 3.35 9.57 0.23 2 Urban Minor Arterial 948400000088__ 3.24 3.40 0.23 4 Urban Minor Arterial 1846700000171__ 0.40 0.61 0.23 4 Urban Minor Arterial 1408500000009__ 78.16 81.74 0.23 2 Urban Minor Arterial 1993000000513__ 64.73 65.24 0.23 4 Urban Minor Arterial 585000000056__ 7.82 9.19 0.23 4 Urban Minor Arterial 1749900000202__ 54.24 56.59 0.22 2 Urban Minor Arterial 779000000026__ 0.00 0.22 0.22 1 Urban Minor Arterial 1387100000543__ 17.95 19.11 0.22 2 Urban Minor Arterial 265000000047__ 42.30 42.58 0.22 4 Urban Minor Arterial 2182900000531__ 10.07 10.28 0.22 1 Urban Minor Arterial 1492800000517__ 16.88 17.10 0.22 3 Urban Minor Arterial 1432400000552__ 0.00 2.89 0.22 2 Urban Minor Arterial 656000000537__ 32.11 32.75 0.21 2 Urban Minor Arterial 497800000539__ 51.51 51.88 0.21 2 Urban Minor Arterial 872800000546__ 9.28 9.98 0.21 4 Urban Minor Arterial 924100000056__ 6.79 7.69 0.21 2 Urban Minor Arterial 1445800000535__ 25.32 25.58 0.21 2 Urban Minor Arterial 12526126
Roadside inspection and crash data analysis00000553__ 21.80 22.97 0.21 2 Urban Minor Arterial 279900000048__ 1.53 2.13 0.21 2 Urban Minor Arterial 548000000509__ 6.94 7.09 0.21 4 Urban Minor Arterial 2197400000071__ 13.78 14.77 0.21 2 Urban Minor Arterial 2002600000514__ 11.50 13.43 0.21 4 Urban Minor Arterial 1029900000088__ 0.00 2.02 0.21 2 Urban Minor Arterial 2307300000571__ 4.32 4.44 0.21 2 Urban Minor Arterial 2776700000091__ 0.00 2.26 0.20 2 Urban Minor Arterial 1334000000512__ 23.70 23.90 0.20 4 Urban Minor Arterial 1677200000044__ 1.71 3.23 0.20 2 Urban Minor Arterial 220800000077__ 0.00 0.52 0.20 2 Urban Minor Arterial 1303200000165__ 0.00 0.26 0.20 4 Urban Minor Arterial 1304500000514__ 40.71 42.86 0.20 2 Urban Minor Arterial 1271800000555__ 17.08 17.56 0.20 3 Urban Minor Arterial 1434100000035__ 2.40 2.70 0.20 3 Urban Minor Arterial 1158000000035__ 2.10 2.40 0.20 4 Urban Minor Arterial 1158000000284__ 0.44 1.35 0.20 2 Urban Minor Arterial 383100000045__ 9.44 9.86 0.20 2 Urban Minor Arterial 834800000124__ 1.48 3.27 0.19 2 Urban Minor Arterial 1588200000502__ 6.92 7.23 0.19 2 Urban Minor Arterial 1148600000047__ 36.08 40.20 0.19 2 Urban Minor Arterial 261000000561__ 11.00 13.62 0.19 2 Urban Minor Arterial 138400000537__ 55.44 55.66 0.19 3 Urban Minor Arterial 1655500000067__ 1.13 1.29 0.19 4 Urban Minor Arterial 2278000000517__ 39.64 39.84 0.19 3 Urban Minor Arterial 1829700000045__ 0.00 0.33 0.18 2 Urban Minor Arterial 1125800000322__ 34.73 36.93 0.18 4 Urban Minor Arterial 848400000509__ 8.02 8.19 0.18 4 Urban Minor Arterial 2197400000509__ 7.09 7.26 0.18 2 Urban Minor Arterial 2197400000504__ 7.51 8.08 0.18 4 Urban Minor Arterial 2653900000179__ 6.41 7.46 0.18 2 Urban Minor Arterial 361800000202__ 62.20 62.65 0.18 2 Urban Minor Arterial 1693200000535__ 24.71 25.32 0.18 1 Urban Minor Arterial 1252600000532__ 0.00 4.05 0.18 2 Urban Minor Arterial 378600000555__ 10.50 12.07 0.18 2 Urban Minor Arterial 1221500000512__ 26.28 26.51 0.18 3 Urban Minor Arterial 1677200000047__ 3.93 4.20 0.18 3 Urban Minor Arterial 1433100000559A_ 1.07 1.43 0.18 2 Urban Minor Arterial 1085000000510__ 2.45 2.79 0.17 2 Urban Minor Arterial 1159000000202__ 51.53 51.82 0.17 4 Urban Minor Arterial 1361000000047__ 71.89 74.89 0.17 2 Urban Minor Arterial 1583100000569__ 3.77 4.12 0.17 2 Urban Minor Arterial 1144700000202__ 57.04 57.24 0.17 2 Urban Minor Arterial 20096127
Roadside inspection and crash data analysis00000009__ 43.32 43.85 0.17 2 Urban Minor Arterial 758400000009__ 43.85 48.15 0.17 2 Urban Minor Arterial 748000000009__ 90.86 91.05 0.17 2 Urban Minor Arterial 2096200000571__ 19.02 19.55 0.17 2 Urban Minor Arterial 1539500000009__ 31.84 32.22 0.17 2 Urban Minor Arterial 1078900000551__ 0.00 2.16 0.17 2 Urban Minor Arterial 761700000506__ 7.24 7.89 0.17 2 Urban Minor Arterial 1275800000322__ 36.93 37.22 0.16 4 Urban Minor Arterial 1432900000551__ 4.37 4.74 0.16 3 Urban Minor Arterial 1123200000540__ 37.42 38.44 0.16 2 Urban Minor Arterial 816700000173__ 0.09 2.27 0.16 2 Urban Minor Arterial 767800000094__ 41.76 43.22 0.16 2 Urban Minor Arterial 585400000045__ 9.86 10.44 0.16 2 Urban Minor Arterial 742800000513__ 10.48 11.45 0.16 2 Urban Minor Arterial 444800000322__ 45.79 46.06 0.16 2 Urban Minor Arterial 1623600000509__ 7.62 8.02 0.16 2 Urban Minor Arterial 2197400000009__ 87.80 88.01 0.16 3 Urban Minor Arterial 2096200000514__ 11.07 11.50 0.15 2 Urban Minor Arterial 1029900000047__ 3.62 3.93 0.15 4 Urban Minor Arterial 1433100000571__ 12.11 16.42 0.15 2 Urban Minor Arterial 1037300000575__ 6.35 6.75 0.15 3 Urban Minor Arterial 1128800000555__ 16.05 16.56 0.15 4 Urban Minor Arterial 1786500000041__ 4.95 7.22 0.15 2 Urban Minor Arterial 1217100000555__ 12.07 13.70 0.15 2 Urban Minor Arterial 1130300000551__ 5.12 6.25 0.15 2 Urban Minor Arterial 408100000047__ 52.99 62.29 0.15 2 Urban Minor Arterial 1145500000513__ 65.24 66.83 0.15 2 Urban Minor Arterial 585000000147__ 0.00 0.33 0.15 2 Urban Minor Arterial 1410000000505__ 3.47 3.64 0.15 4 Urban Minor Arterial 2757100000202__ 31.51 37.10 0.15 2 Urban Minor Arterial 929500000071__ 7.66 9.37 0.15 4 Urban Minor Arterial 1657400000071__ 14.77 15.58 0.14 2 Urban Minor Arterial 1175000000322__ 46.06 48.98 0.14 2 Urban Minor Arterial 1960400000534__ 7.92 9.28 0.14 2 Urban Minor Arterial 2460500000524__ 38.84 39.51 0.14 2 Urban Minor Arterial 713500000551__ 17.01 20.62 0.14 2 Urban Minor Arterial 531000000541__ 8.62 10.51 0.14 2 Urban Minor Arterial 1775200000551S_ 3.12 4.27 0.14 2 Urban Minor Arterial 1254300000575__ 9.33 11.31 0.14 2 Urban Minor Arterial 1224000000547__ 27.11 27.37 0.14 4 Urban Minor Arterial 1872800000130__ 3.66 4.09 0.14 2 Urban Minor Arterial 1132600000571__ 7.40 9.99 0.14 4 Urban Minor Arterial 1512600000546__ 8.75 9.28 0.14 2 Urban Minor Arterial 9241128
Roadside inspection and crash data analysis00000524__ 37.97 38.64 0.14 2 Urban Minor Arterial 737000000575__ 5.69 6.13 0.14 3 Urban Minor Arterial 1128800000050__ 0.00 4.83 0.14 2 Urban Minor Arterial 724400000048__ 0.00 1.53 0.14 2 Urban Minor Arterial 653700000506__ 8.15 10.39 0.14 2 Urban Minor Arterial 1788200000077__ 20.70 22.55 0.14 2 Urban Minor Arterial 545000000514__ 10.38 10.87 0.14 2 Urban Minor Arterial 1029900000509__ 4.03 4.26 0.14 3 Urban Minor Arterial 2197400000552__ 11.87 12.66 0.14 2 Urban Minor Arterial 640000000553__ 49.87 51.22 0.13 2 Urban Minor Arterial 1508300000505__ 3.64 4.01 0.13 2 Urban Minor Arterial 2757100000569__ 0.92 1.24 0.13 2 Urban Minor Arterial 1599800000502__ 2.45 6.00 0.13 2 Urban Minor Arterial 873900000531__ 9.72 10.07 0.13 2 Urban Minor Arterial 1492800000124__ 3.27 3.60 0.13 4 Urban Minor Arterial 1588200000513__ 57.56 64.73 0.13 2 Urban Minor Arterial 585000000202__ 58.46 58.92 0.13 4 Urban Minor Arterial 1142100000571__ 3.33 3.87 0.13 4 Urban Minor Arterial 1960400000013__ 0.00 0.42 0.13 4 Urban Minor Arterial 1270800000077__ 1.47 2.64 0.13 2 Urban Minor Arterial 1370800000009__ 90.60 90.86 0.13 4 Urban Minor Arterial 2096200000540__ 36.79 37.42 0.13 2 Urban Minor Arterial 857300000047__ 40.20 40.66 0.13 2 Urban Minor Arterial 1179600000071__ 15.58 16.78 0.13 2 Urban Minor Arterial 1358000000009__ 90.34 90.60 0.13 3 Urban Minor Arterial 2096200000552__ 9.26 10.42 0.13 2 Urban Minor Arterial 942400000533__ 27.35 27.73 0.12 4 Urban Minor Arterial 1442700000526__ 7.84 9.29 0.12 2 Urban Minor Arterial 757000000130__ 4.09 5.07 0.12 2 Urban Minor Arterial 560600000202__ 40.73 44.32 0.12 2 Urban Minor Arterial 919200000511__ 17.11 17.87 0.12 2 Urban Minor Arterial 729300000535__ 22.94 24.71 0.12 2 Urban Minor Arterial 1252600000504__ 15.73 15.94 0.12 2 Urban Minor Arterial 2653900000523__ 18.40 19.89 0.12 2 Urban Minor Arterial 1503100000202__ 51.82 53.16 0.12 2 Urban Minor Arterial 420200000511__ 18.04 21.13 0.12 2 Urban Minor Arterial 729300000171__ 0.00 0.40 0.12 2 Urban Minor Arterial 1408500000546__ 8.14 8.75 0.12 2 Urban Minor Arterial 924100000542__ 0.00 1.68 0.12 2 Urban Minor Arterial 336500000047__ 43.85 46.44 0.12 2 Urban Minor Arterial 2182900000033__ 41.39 42.03 0.12 2 Urban Minor Arterial 1767500000202__ 37.10 40.73 0.12 2 Urban Minor Arterial 1099800000509__ 4.59 4.85 0.12 2 Urban Minor Arterial 21974129
Roadside inspection and crash data analysis00000540__ 38.44 39.38 0.12 2 Urban Minor Arterial 609200000507__ 0.00 2.21 0.12 2 Urban Minor Arterial 1825400000009__ 82.39 82.74 0.12 3 Urban Minor Arterial 1649000000094__ 21.36 22.34 0.12 2 Urban Minor Arterial 589400000509__ 4.85 5.38 0.12 4 Urban Minor Arterial 2197400000563__ 0.00 0.96 0.12 5 Urban Minor Arterial 1220700000517__ 17.40 17.81 0.12 3 Urban Minor Arterial 1432400000540__ 36.20 36.79 0.12 2 Urban Minor Arterial 998600000571__ 32.65 34.09 0.12 2 Urban Minor Arterial 409600000172__ 0.00 0.81 0.12 2 Urban Minor Arterial 1456700000537__ 57.92 61.75 0.12 2 Urban Minor Arterial 1080100000047__ 40.66 41.93 0.12 2 Urban Minor Arterial 2797000000130__ 1.66 2.22 0.12 2 Urban Minor Arterial 1057500000508__ 6.22 6.58 0.11 2 Urban Minor Arterial 1681100000513__ 31.32 45.15 0.11 2 Urban Minor Arterial 1489200000523__ 9.19 10.44 0.11 2 Urban Minor Arterial 485300000022__ 33.20 33.86 0.11 3 Urban Minor Arterial 3701100000029__ 20.35 22.98 0.11 2 Urban Minor Arterial 232900000509__ 8.19 12.14 0.11 2 Urban Minor Arterial 2197400000571__ 16.42 19.02 0.11 2 Urban Minor Arterial 954100000561__ 3.51 5.51 0.11 2 Urban Minor Arterial 310600000517__ 27.12 29.14 0.11 2 Urban Minor Arterial 307800000517__ 34.68 35.02 0.11 3 Urban Minor Arterial 1829700000537__ 55.66 57.92 0.11 2 Urban Minor Arterial 1655500000571__ 1.45 1.77 0.11 3 Urban Minor Arterial 1960400000056__ 5.83 6.79 0.11 2 Urban Minor Arterial 1324600000047__ 16.82 17.43 0.11 2 Urban Minor Arterial 1044100000571__ 4.44 4.67 0.11 4 Urban Minor Arterial 2776700000541__ 8.26 8.62 0.11 4 Urban Minor Arterial 1775200000009__ 88.01 89.84 0.11 2 Urban Minor Arterial 2096200000513__ 30.32 31.18 0.11 2 Urban Minor Arterial 1489200000532__ 33.04 35.19 0.11 2 Urban Minor Arterial 300300000047__ 64.19 68.22 0.11 2 Urban Minor Arterial 1282000000179__ 0.37 1.42 0.11 4 Urban Minor Arterial 616000000512__ 24.36 24.75 0.10 4 Urban Minor Arterial 1677200000519__ 27.59 28.21 0.10 2 Urban Minor Arterial 1057100000026__ 1.46 1.92 0.10 2 Urban Minor Arterial 1428300000501__ 27.12 27.40 0.10 2 Urban Minor Arterial 2347000000535__ 27.61 31.75 0.10 2 Urban Minor Arterial 1907900000531__ 0.69 1.55 0.10 2 Urban Minor Arterial 1540300000166__ 0.06 1.97 0.10 2 Urban Minor Arterial 2450300000509__ 0.00 2.48 0.10 2 Urban Minor Arterial 2197400000159__ 0.55 1.30 0.10 2 Urban Minor Arterial 18190130
Roadside inspection and crash data analysis00000555__ 29.80 33.06 0.10 2 Urban Minor Arterial 839800000513__ 45.89 46.35 0.10 3 Urban Minor Arterial 1489200000009__ 87.47 87.80 0.10 2 Urban Minor Arterial 2096200000585__ 2.38 3.09 0.10 2 Urban Minor Arterial 976300000130__ 2.22 2.70 0.10 2 Urban Minor Arterial 1448900000535__ 25.82 26.92 0.10 2 Urban Minor Arterial 1907900000202__ 56.69 57.04 0.10 4 Urban Minor Arterial 2009600000512__ 18.56 18.98 0.10 4 Urban Minor Arterial 1677200000028__ 0.16 2.25 0.10 2 Urban Minor Arterial 2024100000571__ 3.87 4.23 0.10 3 Urban Minor Arterial 1960400000551__ 2.16 3.55 0.10 2 Urban Minor Arterial 1030100000071__ 9.37 12.96 0.10 2 Urban Minor Arterial 1203100000552S_ 0.00 1.17 0.10 2 Urban Minor Arterial 6161Table 45. Calculated severity rate in descending order for Urban Local.SRI Start MP End MPSeverityRate Lanes Roadway class AADT00000324__ 0.98 1.51 2.58 2 Urban Local 50000000044__ 0 0.86 0.50 2 Urban Local 158500000175__ 0.27 1.8 0.30 2 Urban Local 1511131
Roadside inspection and crash data analysisSRITable 46. Calculated severity rate in descending order for Urban Interstate.StartMPEnd MPSeverityRate Lanes Roadway class AADT00000095__ 61.48 61.52 4.61 4 Urban Interstate 11150300000295__ 11.92 11.93 1.75 2 Urban Interstate 3914400000295__ 43.09 43.10 1.66 4 Urban Interstate 8254800000287__ 2.24 2.30 1.26 4 Urban Interstate 13569700000295__ 26.59 27.22 0.75 2 Urban Interstate 7143500000095M_ 0.09 0.20 0.67 3 Urban Interstate 5610000000287__ 66.94 66.95 0.66 2 Urban Interstate 10444700000295__ 14.33 14.35 0.59 2 Urban Interstate 5811400000095__ 54.01 54.77 0.57 3 Urban Interstate 24766200000080__ 58.22 58.92 0.47 4 Urban Interstate 12402000000078__ 18.46 20.78 0.46 3 Urban Interstate 3773100000287__ 41.89 42.02 0.45 3 Urban Interstate 15258000000080__ 25.04 25.37 0.45 3 Urban Interstate 5089500000078__ 17.87 18.46 0.42 3 Urban Interstate 8506400000295__ 1.39 1.92 0.42 2 Urban Interstate 2444300000076__ 0.00 0.37 0.42 2 Urban Interstate 15846900000287__ 9.95 10.01 0.41 3 Urban Interstate 11092100000195__ 7.31 7.37 0.39 2 Urban Interstate 2912000000078__ 5.45 5.47 0.38 3 Urban Interstate 8984800000078__ 56.45 57.32 0.37 3 Urban Interstate 12888900000080__ 26.25 27.19 0.36 3 Urban Interstate 6828800000287__ 64.94 65.69 0.35 3 Urban Interstate 5691700000095__ 60.38 61.20 0.35 2 Urban Interstate 11150300000078__ 57.78 58.58 0.35 3 Urban Interstate 11059100000078__ 49.40 49.56 0.35 3 Urban Interstate 7373500000287__ 0.00 0.70 0.34 5 Urban Interstate 10226500000078__ 48.15 49.40 0.33 2 Urban Interstate 7373500000287__ 7.27 8.47 0.33 3 Urban Interstate 4609900000095__ 6.11 6.55 0.33 2 Urban Interstate 3751000000078__ 16.24 17.87 0.33 3 Urban Interstate 8502700000095__ 59.13 59.42 0.33 3 Urban Interstate 22517800000287__ 0.70 0.93 0.32 4 Urban Interstate 10226500000080__ 67.22 68.54 0.32 3 Urban Interstate 11802800000295__ 27.39 28.16 0.31 3 Urban Interstate 10455700000195__ 1.18 1.67 0.30 2 Urban Interstate 4655800000287__ 0.93 2.24 0.30 4 Urban Interstate 11767100000095__ 60.37 60.38 0.30 2 Urban Interstate 23205800000280__ 14.42 14.45 0.29 2 Urban Interstate 7780100000078__ 58.58 62.01 0.29 2 Urban Interstate 8266900000280__ 13.74 14.42 0.28 2 Urban Interstate 77801132
Roadside inspection and crash data analysis00000080__ 53.50 53.62 0.28 3 Urban Interstate 12027100000295__ 9.15 10.30 0.28 2 Urban Interstate 2942000000080__ 58.92 59.06 0.28 3 Urban Interstate 12402000000078__ 51.76 53.12 0.27 3 Urban Interstate 12399800000287__ 42.02 44.95 0.26 3 Urban Interstate 6455100000287__ 13.50 14.30 0.26 3 Urban Interstate 10946900000295__ 60.23 61.44 0.26 3 Urban Interstate 3294800000280__ 12.23 12.54 0.26 4 Urban Interstate 10325500000095__ 54.77 56.33 0.26 4 Urban Interstate 24766200000280__ 13.32 13.74 0.25 2 Urban Interstate 9253700000287__ 12.30 13.50 0.25 3 Urban Interstate 9059000000080__ 27.19 28.82 0.24 3 Urban Interstate 9894600000280__ 14.45 16.59 0.24 3 Urban Interstate 7780100000287__ 66.95 67.54 0.23 3 Urban Interstate 10444700000080__ 59.22 60.21 0.23 4 Urban Interstate 11986400000080__ 42.20 42.57 0.22 3 Urban Interstate 14250100000095__ 25.15 28.51 0.22 3 Urban Interstate 14039700000676__ 3.79 3.88 0.22 3 Urban Interstate 10487100000080__ 53.62 53.83 0.21 3 Urban Interstate 13994200000280__ 12.54 13.15 0.21 5 Urban Interstate 10325500000078__ 31.23 33.14 0.21 4 Urban Interstate 7836300000280__ 0.00 1.55 0.20 2 Urban Interstate 5029500000080__ 60.21 60.41 0.20 3 Urban Interstate 11986400000287__ 8.47 9.95 0.20 3 Urban Interstate 9672000000295__ 25.18 26.45 0.20 3 Urban Interstate 8015900000287__ 21.44 22.21 0.19 4 Urban Interstate 9596300000080__ 46.16 46.36 0.19 3 Urban Interstate 15849500000287__ 65.69 66.94 0.19 2 Urban Interstate 5691700000080__ 65.18 65.27 0.19 2 Urban Interstate 15851800000295__ 28.16 30.03 0.19 3 Urban Interstate 11065600000080__ 42.84 43.62 0.19 4 Urban Interstate 12102500000095__ 22.21 23.40 0.19 3 Urban Interstate 14039700000080__ 38.81 39.57 0.19 4 Urban Interstate 13633100000095__ 42.73 45.50 0.18 3 Urban Interstate 19026000000095__ 7.95 15.15 0.18 3 Urban Interstate 12312100000280__ 8.25 9.91 0.18 4 Urban Interstate 8686700000080__ 60.46 62.34 0.18 4 Urban Interstate 10198800000080__ 40.61 42.20 0.18 5 Urban Interstate 14250100000078__ 57.32 57.44 0.18 2 Urban Interstate 12888900000295__ 34.80 36.86 0.17 3 Urban Interstate 9179900000080__ 65.27 67.22 0.17 3 Urban Interstate 15851800000080__ 25.48 25.95 0.17 4 Urban Interstate 5196500000078__ 51.43 51.76 0.17 3 Urban Interstate 162775133
Roadside inspection and crash data analysis00000080__ 42.60 42.84 0.17 2 Urban Interstate 12102500000287__ 17.84 18.11 0.16 4 Urban Interstate 12454000000078__ 25.03 25.53 0.16 3 Urban Interstate 10095300000095__ 15.15 16.55 0.16 3 Urban Interstate 13565400000287__ 10.01 10.24 0.16 4 Urban Interstate 11092100000080__ 42.57 42.60 0.16 2 Urban Interstate 14250100000078__ 51.76 54.32 0.16 3 Urban Interstate 17627800000287__ 59.76 59.82 0.16 2 Urban Interstate 7189900000676__ 2.27 2.60 0.16 3 Urban Interstate 5279800000095__ 6.55 7.95 0.16 3 Urban Interstate 11234800000295__ 10.30 11.92 0.16 2 Urban Interstate 4049300000080__ 62.58 65.18 0.15 2 Urban Interstate 12176800000280__ 9.91 10.47 0.15 4 Urban Interstate 11164100000295__ 64.15 65.41 0.15 3 Urban Interstate 5711200000076__ 1.25 1.88 0.15 6 Urban Interstate 15846900000095__ 50.53 52.94 0.15 4 Urban Interstate 23413400000295__ 61.44 61.93 0.15 3 Urban Interstate 3764200000095__ 2.27 6.11 0.15 3 Urban Interstate 3751000000280__ 1.55 4.11 0.15 2 Urban Interstate 6972500000287__ 14.30 17.73 0.15 3 Urban Interstate 7534100000078__ 57.44 57.78 0.15 2 Urban Interstate 11059100000080__ 52.87 53.50 0.14 4 Urban Interstate 12027100000080__ 43.62 44.07 0.14 4 Urban Interstate 15849500000287__ 58.89 59.76 0.14 3 Urban Interstate 7189900000287__ 10.24 10.48 0.14 4 Urban Interstate 12115400000195__ 27.17 29.18 0.14 2 Urban Interstate 2944800000295__ 0.00 0.95 0.14 3 Urban Interstate 9394400000080__ 28.82 30.61 0.14 3 Urban Interstate 7527900000080__ 46.36 47.83 0.14 3 Urban Interstate 9176700000078__ 50.61 51.43 0.14 3 Urban Interstate 11578600000287__ 39.55 40.80 0.14 4 Urban Interstate 15258000000078__ 44.01 46.73 0.14 3 Urban Interstate 7390700000287__ 40.80 41.89 0.14 5 Urban Interstate 15258000000095M_ 0.00 0.09 0.14 2 Urban Interstate 5610000000287__ 36.60 38.00 0.13 4 Urban Interstate 13079400000095__ 38.07 42.73 0.13 3 Urban Interstate 20440900000080__ 60.41 60.46 0.13 3 Urban Interstate 10198800000295__ 31.73 34.80 0.13 3 Urban Interstate 10822800000287__ 44.95 47.11 0.13 3 Urban Interstate 8088000000287__ 35.89 36.60 0.13 4 Urban Interstate 9414400000095__ 56.33 59.13 0.13 4 Urban Interstate 22517800000080__ 25.95 26.25 0.13 3 Urban Interstate 5196500000095__ 61.20 61.48 0.13 5 Urban Interstate 111503134
Roadside inspection and crash data analysis00000287__ 4.62 5.88 0.13 3 Urban Interstate 9956000000287__ 5.88 6.41 0.13 3 Urban Interstate 9882700000080__ 53.83 58.22 0.13 4 Urban Interstate 13994200000287__ 3.09 4.62 0.13 3 Urban Interstate 10349500000295__ 30.03 31.73 0.13 3 Urban Interstate 9018400000287__ 21.00 21.17 0.13 3 Urban Interstate 12454000000280__ 6.22 7.72 0.13 3 Urban Interstate 8839900000295__ 43.10 44.80 0.13 4 Urban Interstate 6582500000095__ 52.94 54.01 0.13 3 Urban Interstate 23413400000095__ 0.00 0.66 0.13 2 Urban Interstate 4120800000295__ 44.92 47.52 0.13 3 Urban Interstate 6951700000095__ 59.42 60.37 0.12 3 Urban Interstate 23205800000195__ 1.67 4.90 0.12 2 Urban Interstate 3754700000080__ 25.37 25.48 0.12 4 Urban Interstate 5089500000295__ 0.95 1.39 0.12 2 Urban Interstate 2549300000295__ 26.45 26.59 0.12 2 Urban Interstate 8015900000287__ 35.28 35.89 0.12 4 Urban Interstate 8305500000078__ 55.00 56.45 0.12 3 Urban Interstate 15302500000095M_ 8.12 8.77 0.12 3 Urban Interstate 4400500000080__ 34.65 38.81 0.12 4 Urban Interstate 12276500000078__ 40.98 44.01 0.12 3 Urban Interstate 7969900000095__ 46.23 50.53 0.12 4 Urban Interstate 22362800000295__ 65.41 67.79 0.12 3 Urban Interstate 6300700000287__ 10.48 12.30 0.12 3 Urban Interstate 12115400000287__ 22.21 24.78 0.12 4 Urban Interstate 8680300000676__ 0.00 0.55 0.12 3 Urban Interstate 6469100000080__ 34.02 34.65 0.12 3 Urban Interstate 12276500000078__ 20.78 25.03 0.11 3 Urban Interstate 9688000000095__ 19.45 22.21 0.11 3 Urban Interstate 13565400000287__ 38.33 39.33 0.11 5 Urban Interstate 17224300000287__ 26.48 29.94 0.11 3 Urban Interstate 8247300000078__ 49.56 50.61 0.11 3 Urban Interstate 14827000000287__ 39.33 39.55 0.11 4 Urban Interstate 17224300000295__ 23.68 24.49 0.11 3 Urban Interstate 5458700000078__ 4.16 5.45 0.11 3 Urban Interstate 7479600000287__ 49.24 51.60 0.11 4 Urban Interstate 5220000000080__ 45.91 46.16 0.10 2 Urban Interstate 15849500000287__ 55.35 58.17 0.10 3 Urban Interstate 6342000000080__ 30.61 34.02 0.10 3 Urban Interstate 10543100000078__ 30.80 30.87 0.10 2 Urban Interstate 9551900000095__ 28.51 38.07 0.10 3 Urban Interstate 16381700000280__ 7.72 8.25 0.10 4 Urban Interstate 8839900000280__ 10.47 12.09 0.10 3 Urban Interstate 111641135
Roadside inspection and crash data analysis00000287__ 20.66 21.00 0.10 2 Urban Interstate 12454000000295__ 21.87 23.68 0.10 3 Urban Interstate 6266500000287__ 2.30 3.09 0.10 3 Urban Interstate 13569700000676__ 2.60 3.50 0.10 3 Urban Interstate 47831136
Roadside inspection and crash data analysisTable 47. Calculated severity rate in descending order for Urban Freeway/ Expressway.SRI Start MP End MP Severity Rate Lanes Roadway class AADT00000001__ 5.46 5.47 1.30 3 Urban Freeway/Expressway 5249700000444__ 7.81 8.40 0.95 3 Urban Freeway/Expressway 1590000000029__ 4.29 4.34 0.91 2 Urban Freeway/Expressway 4509300000495__ 0.78 0.79 0.88 3 Urban Freeway/Expressway 15607400000024__ 10.18 10.42 0.61 3 Urban Freeway/Expressway 9346000000081__ 0.51 0.54 0.58 2 Urban Freeway/Expressway 3957100000700__ 1.12 1.88 0.54 2 Urban Freeway/Expressway 5129200000700__ 34.70 34.72 0.54 3 Urban Freeway/Expressway 6394800000033__ 27.54 27.69 0.41 2 Urban Freeway/Expressway 1101200000120__ 0.78 1.34 0.40 2 Urban Freeway/Expressway 3705600000001__ 5.40 5.46 0.37 3 Urban Freeway/Expressway 3095800000081__ 1.11 1.16 0.35 3 Urban Freeway/Expressway 3957100000440__ 0.00 2.01 0.31 3 Urban Freeway/Expressway 8460000000055__ 45.34 45.39 0.30 2 Urban Freeway/Expressway 4591800000446__ 43.61 44.19 0.28 4 Urban Freeway/Expressway 4172200000138__ 0.33 0.71 0.28 2 Urban Freeway/Expressway 5142100000003__ 0.00 0.22 0.28 2 Urban Freeway/Expressway 11219600000202__ 0.35 0.63 0.26 2 Urban Freeway/Expressway 936500000024__ 6.75 7.11 0.26 3 Urban Freeway/Expressway 7415500000208__ 8.50 8.55 0.25 2 Urban Freeway/Expressway 5421000000208__ 2.82 2.90 0.25 2 Urban Freeway/Expressway 6928100000029__ 9.18 9.38 0.24 2 Urban Freeway/Expressway 1404400000018__ 14.51 19.02 0.24 2 Urban Freeway/Expressway 3954600000004__ 9.01 10.26 0.24 3 Urban Freeway/Expressway 8223600000001__ 51.43 54.61 0.24 2 Urban Freeway/Expressway 6352300000015__ 7.48 7.55 0.23 3 Urban Freeway/Expressway 4208300000444__ 35.82 36.08 0.23 2 Urban Freeway/Expressway 2269000000003__ 4.95 6.39 0.22 3 Urban Freeway/Expressway 10646900000021__ 8.00 9.28 0.21 3 Urban Freeway/Expressway 6900400000001__ 2.87 3.75 0.20 2 Urban Freeway/Expressway 3873800000001__ 1.28 1.34 0.20 2 Urban Freeway/Expressway 5718300000081__ 1.02 1.11 0.19 2 Urban Freeway/Expressway 3957100000024__ 7.11 8.02 0.19 3 Urban Freeway/Expressway 7473600000004__ 5.00 5.69 0.19 3 Urban Freeway/Expressway 10587400000444__ 17.22 17.50 0.19 2 Urban Freeway/Expressway 1316000000444__ 82.35 84.10 0.18 3 Urban Freeway/Expressway 5543000000015__ 8.82 8.92 0.18 3 Urban Freeway/Expressway 3892500000024__ 0.55 1.65 0.17 3 Urban Freeway/Expressway 7538000000138__ 1.84 3.52 0.17 2 Urban Freeway/Expressway 1903000000003__ 7.39 7.58 0.17 3 Urban Freeway/Expressway 128549137
Roadside inspection and crash data analysis00000024__ 9.45 10.18 0.17 3 Urban Freeway/Expressway 9630600000700__ 26.32 34.70 0.14 2 Urban Freeway/Expressway 6394800000019__ 1.80 1.91 0.14 3 Urban Freeway/Expressway 4358800000024__ 8.02 9.45 0.14 3 Urban Freeway/Expressway 9729300000042__ 12.80 14.28 0.14 4 Urban Freeway/Expressway 14640100000003__ 3.82 4.95 0.14 3 Urban Freeway/Expressway 13894100000003__ 6.39 7.39 0.14 4 Urban Freeway/Expressway 12854900000003__ 1.44 3.82 0.14 3 Urban Freeway/Expressway 12142700000024__ 0.00 0.55 0.13 1 Urban Freeway/Expressway 7538000000444__ 60.29 64.11 0.13 2 Urban Freeway/Expressway 2629000000138__ 0.71 1.84 0.13 2 Urban Freeway/Expressway 4782600000029__ 1.64 1.77 0.12 3 Urban Freeway/Expressway 4249300000003__ 8.02 9.12 0.12 4 Urban Freeway/Expressway 15098700000090__ 2.68 3.22 0.12 2 Urban Freeway/Expressway 2098400000208__ 2.90 3.55 0.12 2 Urban Freeway/Expressway 7850000000055__ 35.01 39.36 0.12 2 Urban Freeway/Expressway 3128800000446__ 27.80 29.50 0.12 2 Urban Freeway/Expressway 3364200000042__ 6.35 6.48 0.12 2 Urban Freeway/Expressway 8802300000021__ 12.66 13.52 0.12 2 Urban Freeway/Expressway 5990900000004__ 10.26 10.68 0.12 2 Urban Freeway/Expressway 8223600000004__ 5.69 7.63 0.12 3 Urban Freeway/Expressway 10643900000444__ 25.34 28.90 0.12 2 Urban Freeway/Expressway 1996000000003__ 7.58 8.02 0.11 3 Urban Freeway/Expressway 15098700000004__ 10.68 10.83 0.11 3 Urban Freeway/Expressway 8223600000004__ 7.63 9.01 0.11 3 Urban Freeway/Expressway 9403800000444__ 17.50 20.25 0.11 2 Urban Freeway/Expressway 1626000000444__ 36.59 37.23 0.11 2 Urban Freeway/Expressway 3014000000019__ 0.64 1.06 0.11 4 Urban Freeway/Expressway 3087400000055__ 58.90 60.54 0.10 2 Urban Freeway/Expressway 6007700000018__ 42.28 43.86 0.10 2 Urban Freeway/Expressway 4194700000444__ 81.85 82.35 0.10 3 Urban Freeway/Expressway 5306000000444__ 36.08 36.59 0.10 2 Urban Freeway/Expressway 2668000000700__ 34.72 44.36 0.10 3 Urban Freeway/Expressway 7799200000021__ 13.52 14.35 0.10 2 Urban Freeway/Expressway 5014800000444__ 43.98 45.97 0.10 2 Urban Freeway/Expressway 25130138
Roadside inspection and crash data analysisSRITable 48. Calculated severity rate in descending order for Urban Collector.StartMPEndMPSeverityRate Lanes Roadway class AADT00000143__ 2.26 2.27 59.15 4 Urban Collector 115800000575__ 18.45 18.49 27.66 2 Urban Collector 61900000523__ 9.07 9.08 9.43 1 Urban Collector 726400000143__ 2.27 2.35 7.39 2 Urban Collector 115800000529__ 8.58 8.63 4.61 4 Urban Collector 297300000579__ 36.71 37.24 3.11 2 Urban Collector 207600000526__ 10.52 10.64 2.97 2 Urban Collector 192300000571__ 32.55 32.65 1.67 2 Urban Collector 409600000561__ 27.73 27.82 1.60 1 Urban Collector 476900000513__ 12.90 12.98 1.59 1 Urban Collector 539100000156__ 0.00 0.49 1.53 2 Urban Collector 182600000561__ 23.85 23.95 1.44 2 Urban Collector 476900000181__ 4.94 5.02 1.41 2 Urban Collector 1211100000553__ 27.56 27.65 1.37 2 Urban Collector 555900000140__ 0.88 0.96 1.30 2 Urban Collector 660000000540__ 33.31 33.41 1.15 5 Urban Collector 594300000561__ 25.76 27.73 0.95 2 Urban Collector 476900000536__ 37.66 38.52 0.93 2 Urban Collector 85500000532__ 4.05 5.41 0.86 2 Urban Collector 174700000523__ 0.00 0.28 0.85 2 Urban Collector 288600000561A_ 1.47 2.68 0.83 2 Urban Collector 68400000550__ 15.15 15.92 0.82 2 Urban Collector 435400000563__ 18.20 19.76 0.78 2 Urban Collector 56200000526__ 20.01 20.08 0.75 2 Urban Collector 1308800000173__ 11.55 11.70 0.68 2 Urban Collector 671300000181__ 1.45 1.55 0.57 2 Urban Collector 1211100000536__ 33.08 34.38 0.55 2 Urban Collector 96400000543__ 19.11 24.80 0.55 2 Urban Collector 265000000550__ 0.00 2.14 0.53 2 Urban Collector 60600000519__ 64.94 65.09 0.51 4 Urban Collector 895700000523__ 28.83 29.07 0.50 2 Urban Collector 576300000523__ 22.38 22.51 0.48 2 Urban Collector 1089200000561__ 22.71 23.85 0.48 2 Urban Collector 378900000561A_ 12.18 13.13 0.48 2 Urban Collector 303500000522__ 13.00 14.37 0.47 2 Urban Collector 967300000505__ 0.53 0.66 0.46 2 Urban Collector 1139300000559A_ 0.00 0.46 0.46 2 Urban Collector 3233139
Roadside inspection and crash data analysis00000519__ 63.61 64.42 0.45 2 Urban Collector 187000000563__ 16.70 18.20 0.44 2 Urban Collector 314200000540__ 33.41 34.49 0.43 5 Urban Collector 880600000559__ 29.64 30.84 0.41 2 Urban Collector 140100000059__ 0.00 0.15 0.40 2 Urban Collector 1145200000553__ 27.65 27.97 0.39 3 Urban Collector 555900000553__ 29.29 29.72 0.38 2 Urban Collector 414500000156__ 0.49 1.18 0.38 2 Urban Collector 260000000575__ 16.55 18.45 0.38 2 Urban Collector 95000000528__ 0.53 1.80 0.37 2 Urban Collector 577000000538__ 0.00 0.58 0.37 2 Urban Collector 319900000523__ 22.09 22.38 0.36 2 Urban Collector 1299600000534__ 21.46 22.21 0.36 2 Urban Collector 514500000525__ 0.00 0.61 0.35 2 Urban Collector 645500000555__ 5.30 6.44 0.32 2 Urban Collector 190300000545__ 13.78 14.05 0.31 2 Urban Collector 809400000581__ 16.29 17.57 0.31 2 Urban Collector 174000000567__ 3.92 4.71 0.29 2 Urban Collector 300500000553__ 27.97 29.29 0.28 2 Urban Collector 555900000143__ 0.00 2.26 0.26 2 Urban Collector 115800000543__ 27.76 28.77 0.26 2 Urban Collector 265000000567__ 0.00 1.02 0.22 2 Urban Collector 300500000579__ 0.00 0.95 0.22 2 Urban Collector 1333000000519__ 41.75 42.04 0.22 2 Urban Collector 1094100000528__ 8.87 9.87 0.20 2 Urban Collector 337700000555__ 27.37 29.80 0.20 2 Urban Collector 839800000559__ 5.23 6.74 0.20 2 Urban Collector 227000000552__ 18.14 18.84 0.20 2 Urban Collector 489800000534__ 2.23 3.29 0.19 2 Urban Collector 670800000162__ 0.00 0.70 0.19 2 Urban Collector 507900000513__ 30.08 30.32 0.19 4 Urban Collector 1489200000181__ 2.84 4.07 0.18 2 Urban Collector 1211100000534__ 20.29 21.46 0.18 2 Urban Collector 668400000555__ 18.60 21.48 0.17 2 Urban Collector 839800000545__ 14.05 14.76 0.17 2 Urban Collector 577700000559A_ 0.46 0.68 0.17 2 Urban Collector 1868300000513__ 12.13 12.90 0.17 2 Urban Collector 539100000505__ 1.32 1.93 0.16 2 Urban Collector 2757100000540__ 0.92 1.53 0.16 2 Urban Collector 694200000501__ 39.62 40.52 0.15 2 Urban Collector 2955900000545__ 6.94 9.15 0.15 2 Urban Collector 407900000579__ 14.72 16.07 0.14 2 Urban Collector 355900000545__ 12.54 13.78 0.14 2 Urban Collector 4079140
Roadside inspection and crash data analysis00000513__ 15.18 15.54 0.13 3 Urban Collector 1489200000540__ 34.49 35.72 0.13 2 Urban Collector 880600000505__ 0.00 0.48 0.13 1 Urban Collector 1139300000513__ 29.70 30.08 0.12 2 Urban Collector 1489200000528__ 1.80 2.95 0.12 2 Urban Collector 495200000529__ 8.63 10.57 0.12 2 Urban Collector 297300000561A_ 13.13 15.79 0.12 2 Urban Collector 217200000579__ 5.80 6.49 0.11 2 Urban Collector 895400000519__ 65.09 65.78 0.11 3 Urban Collector 895700000513__ 15.54 15.97 0.11 2 Urban Collector 14892141
Roadside inspection and crash data analysisSRITable 49. Calculated severity rate in descending order for Rural Principal Arterial.StartMPEndMPSeverityRate Lanes Roadway class AADT00000070__ 33.31 33.32 51.96 2 Rural Principal Arterial 1054600000040__ 16.50 16.56 4.29 2 Rural Principal Arterial 1065300000322__ 2.37 2.38 4.01 3 Rural Principal Arterial 1706000000070__ 26.39 26.47 3.80 1 Rural Principal Arterial 900100000206__ 11.36 11.38 3.25 2 Rural Principal Arterial 1052400000009__ 18.58 18.61 3.19 2 Rural Principal Arterial 716100000072__ 16.20 16.22 2.35 2 Rural Principal Arterial 1456800000072__ 0.00 0.04 1.86 1 Rural Principal Arterial 919300000040__ 16.56 16.60 1.61 1 Rural Principal Arterial 1065300000047__ 35.05 35.08 1.51 1 Rural Principal Arterial 1749000000138__ 0.32 0.33 1.33 2 Rural Principal Arterial 5142100000049__ 18.67 20.57 1.08 2 Rural Principal Arterial 468500000023__ 52.39 52.53 1.07 2 Rural Principal Arterial 459300000031__ 16.03 16.06 1.02 2 Rural Principal Arterial 2108100000070__ 40.20 40.27 0.94 2 Rural Principal Arterial 1037400000070__ 26.32 26.39 0.93 1 Rural Principal Arterial 1050400000046__ 0.00 0.18 0.84 1 Rural Principal Arterial 902700000206__ 30.39 30.44 0.81 2 Rural Principal Arterial 1695200000206__ 33.59 33.64 0.81 2 Rural Principal Arterial 1695200000040__ 35.13 35.36 0.78 4 Rural Principal Arterial 766100000033__ 35.90 36.03 0.75 4 Rural Principal Arterial 3528400000023__ 47.26 48.99 0.66 2 Rural Principal Arterial 239100000049__ 20.57 20.89 0.64 2 Rural Principal Arterial 673700000015__ 16.25 16.61 0.56 3 Rural Principal Arterial 2053900000322__ 2.38 2.60 0.55 4 Rural Principal Arterial 1706000000206__ 31.07 31.30 0.53 2 Rural Principal Arterial 1695200000202__ 4.98 5.08 0.47 2 Rural Principal Arterial 1455400000023__ 35.95 36.05 0.44 2 Rural Principal Arterial 1562300000023__ 48.99 49.76 0.39 2 Rural Principal Arterial 459300000057__ 14.38 14.51 0.37 2 Rural Principal Arterial 1440600000046__ 6.62 6.86 0.35 4 Rural Principal Arterial 810000000206__ 121.94 122.16 0.34 3 Rural Principal Arterial 911500000030__ 27.16 27.95 0.32 4 Rural Principal Arterial 1077900000023__ 38.52 38.64 0.32 2 Rural Principal Arterial 1799700000322__ 14.86 15.15 0.31 4 Rural Principal Arterial 1500600000047__ 31.95 35.05 0.30 2 Rural Principal Arterial 1749000000015__ 16.61 16.70 0.30 3 Rural Principal Arterial 2552500000015__ 16.70 16.88 0.30 2 Rural Principal Arterial 2552500000033__ 31.01 33.40 0.30 2 Rural Principal Arterial 18377142
Roadside inspection and crash data analysis00000206__ 116.44 116.54 0.29 2 Rural Principal Arterial 2322600000322__ 2.60 3.86 0.29 2 Rural Principal Arterial 1706000000040__ 16.60 21.82 0.28 2 Rural Principal Arterial 1065300000049__ 16.92 18.67 0.27 2 Rural Principal Arterial 433900000046__ 6.86 7.18 0.26 2 Rural Principal Arterial 810000000055__ 21.49 21.75 0.26 2 Rural Principal Arterial 1005800000031__ 8.59 9.66 0.26 2 Rural Principal Arterial 2218000000046__ 0.18 2.86 0.25 2 Rural Principal Arterial 902700000206__ 12.11 12.37 0.25 3 Rural Principal Arterial 1052400000206__ 111.53 114.14 0.25 2 Rural Principal Arterial 1054900000015__ 16.88 19.52 0.25 2 Rural Principal Arterial 1794200000031__ 13.70 13.97 0.24 3 Rural Principal Arterial 2108100000040__ 38.19 44.39 0.23 2 Rural Principal Arterial 764400000033__ 35.21 35.90 0.23 2 Rural Principal Arterial 3528400000049__ 6.17 7.03 0.22 2 Rural Principal Arterial 1447500000033__ 35.04 35.21 0.22 2 Rural Principal Arterial 1837700000206__ 24.30 25.37 0.21 2 Rural Principal Arterial 1845600000322__ 13.53 14.86 0.21 2 Rural Principal Arterial 1500600000206__ 31.30 33.59 0.19 4 Rural Principal Arterial 1695200000023__ 44.00 45.04 0.19 2 Rural Principal Arterial 349700000206__ 117.31 119.60 0.18 2 Rural Principal Arterial 2322600000023__ 45.04 47.26 0.17 2 Rural Principal Arterial 354400000072__ 0.04 3.48 0.17 2 Rural Principal Arterial 919300000206__ 12.37 12.75 0.17 2 Rural Principal Arterial 1052400000040__ 11.67 16.50 0.17 2 Rural Principal Arterial 1337000000040__ 2.66 5.46 0.17 2 Rural Principal Arterial 1298200000023__ 39.13 39.36 0.17 1 Rural Principal Arterial 1799700000206__ 6.28 9.45 0.16 2 Rural Principal Arterial 1454400000072__ 8.21 13.74 0.16 2 Rural Principal Arterial 914000000023__ 41.39 44.00 0.16 2 Rural Principal Arterial 652800000206__ 26.80 30.39 0.16 4 Rural Principal Arterial 1695200000206__ 128.49 129.22 0.16 2 Rural Principal Arterial 598900000023__ 36.53 38.52 0.15 2 Rural Principal Arterial 1562300000206__ 116.54 117.31 0.15 4 Rural Principal Arterial 2322600000206__ 114.14 114.45 0.14 4 Rural Principal Arterial 1535200000057__ 3.03 6.53 0.14 2 Rural Principal Arterial 1158800000206__ 84.87 86.24 0.13 2 Rural Principal Arterial 1951500000015__ 14.41 16.25 0.13 2 Rural Principal Arterial 2053900000322__ 7.85 8.73 0.13 2 Rural Principal Arterial 1245200000023__ 27.30 29.13 0.12 2 Rural Principal Arterial 1815600000700__ 1.88 13.02 0.12 2 Rural Principal Arterial 5129200000070__ 40.27 43.27 0.12 2 Rural Principal Arterial 1886500000049__ 10.08 13.04 0.12 2 Rural Principal Arterial 9737143
Roadside inspection and crash data analysis00000444__ 50.67 52.70 0.12 2 Rural Principal Arterial 2279000000023__ 49.76 52.39 0.11 3 Rural Principal Arterial 459300000057__ 14.51 14.95 0.11 3 Rural Principal Arterial 1440600000033__ 17.05 18.94 0.11 2 Rural Principal Arterial 2739200000033__ 29.35 30.49 0.10 1 Rural Principal Arterial 1187100000040__ 5.46 8.07 0.10 2 Rural Principal Arterial 1579600000206__ 109.98 111.20 0.10 3 Rural Principal Arterial 23600SRITable 50. Calculated severity rate in descending order for Rural Minor Collector.StartMPEnd MPSeverityRate Lanes Roadway class AADT00000173__ 8.28 8.49 1.94 1 Rural Minor Collector 671300000173__ 8.12 8.28 0.64 2 Rural Minor Collector 671300000173__ 8.49 11.55 0.40 2 Rural Minor Collector 671300000173__ 5.89 8.12 0.09 5 Rural Minor Collector 6713144
Roadside inspection and crash data analysisTable 51. Calculated severity rate in descending order for Rural Minor Arterial.SRI Start MP End MPSeverityRate Lanes Roadway class AADT00000047__ 35.08 35.12 6.56 1 Rural Minor Arterial 261000000077__ 14.06 14.09 4.96 1 Rural Minor Arterial 460500000077__ 14.09 14.12 3.72 1 Rural Minor Arterial 613600000009__ 15.10 15.12 3.63 1 Rural Minor Arterial 942800000094__ 0.13 0.17 3.04 1 Rural Minor Arterial 609800000046__ 12.73 12.80 2.38 1 Rural Minor Arterial 411500000094__ 0.47 0.61 1.83 2 Rural Minor Arterial 541600000046__ 12.80 12.88 1.71 1 Rural Minor Arterial 501500000009__ 15.12 15.16 1.67 1 Rural Minor Arterial 1025000000094__ 0.40 0.47 1.60 2 Rural Minor Arterial 609800000094__ 0.25 0.40 1.48 1 Rural Minor Arterial 609800000179__ 5.58 5.78 1.39 2 Rural Minor Arterial 246300000094__ 0.17 0.25 1.39 2 Rural Minor Arterial 609800000094__ 0.61 0.73 1.04 4 Rural Minor Arterial 541600000009__ 52.39 52.58 0.75 1 Rural Minor Arterial 490400000094__ 11.87 14.08 0.61 2 Rural Minor Arterial 511800000077__ 10.68 14.06 0.57 2 Rural Minor Arterial 460500000094__ 28.00 28.10 0.56 1 Rural Minor Arterial 1221700000284__ 6.21 7.03 0.55 2 Rural Minor Arterial 152700000510__ 2.79 3.44 0.55 2 Rural Minor Arterial 1159000000517__ 20.39 20.48 0.53 4 Rural Minor Arterial 1432400000045__ 11.16 15.65 0.46 2 Rural Minor Arterial 331400000541__ 0.00 1.79 0.46 2 Rural Minor Arterial 166500000077__ 5.90 10.68 0.46 2 Rural Minor Arterial 563600000050__ 6.69 6.83 0.45 2 Rural Minor Arterial 1088300000094__ 9.43 11.87 0.42 2 Rural Minor Arterial 533800000045__ 15.65 16.01 0.42 2 Rural Minor Arterial 455500000050__ 21.00 21.24 0.40 3 Rural Minor Arterial 704700000173__ 3.68 3.94 0.39 2 Rural Minor Arterial 671300000045__ 6.70 7.08 0.39 2 Rural Minor Arterial 465800000130__ 7.94 9.42 0.38 2 Rural Minor Arterial 487500000077__ 16.36 20.70 0.38 2 Rural Minor Arterial 545000000068__ 1.10 2.87 0.37 2 Rural Minor Arterial 417300000050__ 21.24 24.98 0.36 2 Rural Minor Arterial 704700000284__ 3.96 6.21 0.36 2 Rural Minor Arterial 170700000045__ 2.00 6.70 0.34 2 Rural Minor Arterial 472500000046__ 15.89 17.60 0.33 2 Rural Minor Arterial 963100000094__ 4.53 7.10 0.33 2 Rural Minor Arterial 646300000130__ 5.17 6.02 0.29 2 Rural Minor Arterial 5599145
Roadside inspection and crash data analysis00000054__ 1.73 6.10 0.28 2 Rural Minor Arterial 1116100000047__ 31.81 31.95 0.28 2 Rural Minor Arterial 1749000000047__ 35.12 36.08 0.27 2 Rural Minor Arterial 261000000541__ 1.79 2.95 0.27 2 Rural Minor Arterial 218300000540__ 39.38 40.30 0.24 2 Rural Minor Arterial 609200000517__ 17.81 18.01 0.24 3 Rural Minor Arterial 1432400000537__ 32.75 33.97 0.23 2 Rural Minor Arterial 497800000179__ 1.84 2.83 0.22 2 Rural Minor Arterial 616000000094__ 24.91 27.70 0.22 2 Rural Minor Arterial 875300000130__ 6.02 7.94 0.21 2 Rural Minor Arterial 505400000513__ 0.00 3.44 0.21 2 Rural Minor Arterial 376300000068__ 4.84 7.97 0.21 2 Rural Minor Arterial 1147900000054__ 1.10 1.73 0.21 2 Rural Minor Arterial 1038900000049__ 40.89 41.42 0.21 2 Rural Minor Arterial 622800000009__ 49.09 49.83 0.20 2 Rural Minor Arterial 452300000077__ 14.12 16.36 0.20 2 Rural Minor Arterial 613600000130__ 9.42 11.84 0.20 2 Rural Minor Arterial 574000000034__ 8.95 11.56 0.20 2 Rural Minor Arterial 2126500000034__ 8.78 8.95 0.19 1 Rural Minor Arterial 2126500000553__ 0.00 4.68 0.19 2 Rural Minor Arterial 78000000049__ 52.31 53.76 0.18 2 Rural Minor Arterial 516600000009__ 54.85 55.26 0.16 1 Rural Minor Arterial 1020200000094__ 14.08 21.36 0.16 2 Rural Minor Arterial 589400000012__ 7.48 9.41 0.15 2 Rural Minor Arterial 970600000047__ 6.62 8.62 0.14 2 Rural Minor Arterial 1433100000537__ 35.76 40.21 0.14 2 Rural Minor Arterial 1100900000094__ 28.10 32.25 0.14 2 Rural Minor Arterial 1221700000050__ 6.83 10.03 0.13 2 Rural Minor Arterial 667000000045__ 10.44 11.16 0.13 2 Rural Minor Arterial 742800000034__ 3.52 6.37 0.13 2 Rural Minor Arterial 2657000000046__ 17.60 18.18 0.12 3 Rural Minor Arterial 963100000034__ 6.37 7.72 0.12 2 Rural Minor Arterial 2942500000049__ 44.22 50.31 0.11 2 Rural Minor Arterial 491800000012__ 2.18 3.23 0.11 2 Rural Minor Arterial 575200000517__ 29.14 31.11 0.11 2 Rural Minor Arterial 307800000047__ 29.53 31.95 0.11 2 Rural Minor Arterial 255400000047__ 23.40 25.99 0.10 2 Rural Minor Arterial 255400000012__ 0.95 2.18 0.10 3 Rural Minor Arterial 5752146
Roadside inspection and crash data analysisSRITable 52. Calculated severity rate in descending order for Rural Major Collector.StartMPEnd MPSeverityRate Lanes Roadway class AADT00000519__ 42.04 42.05 12.52 2 Rural Major Collector 1094100000559__ 20.27 20.29 11.25 1 Rural Major Collector 304500000550__ 11.98 12.01 8.44 4 Rural Major Collector 541100000532__ 33.00 33.04 5.70 2 Rural Major Collector 300300000539__ 49.36 49.38 3.92 2 Rural Major Collector 872800000559__ 20.29 20.36 2.80 1 Rural Major Collector 349800000048__ 4.17 4.26 2.48 1 Rural Major Collector 306800000532__ 15.27 15.36 2.39 2 Rural Major Collector 318900000550__ 12.01 12.08 2.25 4 Rural Major Collector 435400000540__ 7.41 7.54 1.68 4 Rural Major Collector 626400000536__ 37.15 37.66 1.57 2 Rural Major Collector 85500000519__ 65.78 65.84 1.27 3 Rural Major Collector 895700000540__ 4.36 4.45 1.21 1 Rural Major Collector 626400000540__ 4.25 4.36 0.90 1 Rural Major Collector 694200000557__ 0.00 3.10 0.83 2 Rural Major Collector 53100000542__ 4.08 4.32 0.75 2 Rural Major Collector 379400000048__ 3.87 4.17 0.74 2 Rural Major Collector 306800000550__ 5.37 5.83 0.69 2 Rural Major Collector 216200000561A_ 0.00 1.47 0.68 2 Rural Major Collector 68400000581__ 15.69 16.29 0.66 2 Rural Major Collector 174000000048__ 2.13 2.40 0.61 2 Rural Major Collector 416700000565__ 7.20 8.02 0.56 2 Rural Major Collector 296300000540__ 1.53 4.25 0.51 2 Rural Major Collector 694200000548__ 0.00 5.21 0.50 2 Rural Major Collector 26200000548__ 5.21 9.18 0.48 2 Rural Major Collector 36000000575__ 18.49 20.96 0.45 2 Rural Major Collector 61900000521__ 12.19 13.82 0.44 2 Rural Major Collector 95800000519__ 14.86 17.52 0.39 2 Rural Major Collector 265500000539__ 3.49 10.33 0.39 2 Rural Major Collector 129900000515__ 10.76 13.06 0.38 2 Rural Major Collector 77900000581__ 10.62 13.70 0.38 2 Rural Major Collector 58700000521__ 19.79 23.85 0.33 2 Rural Major Collector 50700000581__ 13.70 15.69 0.29 2 Rural Major Collector 119900000567__ 1.02 1.85 0.27 2 Rural Major Collector 300500000553__ 29.72 32.76 0.27 2 Rural Major Collector 414500000550__ 9.18 9.59 0.27 2 Rural Major Collector 619800000565__ 10.07 10.74 0.26 2 Rural Major Collector 390200000536__ 34.38 37.15 0.26 2 Rural Major Collector 964147
Roadside inspection and crash data analysis00000571__ 31.87 32.55 0.25 2 Rural Major Collector 409600000563__ 19.76 24.73 0.25 2 Rural Major Collector 56200000521__ 23.85 27.06 0.23 2 Rural Major Collector 92400000563__ 24.86 30.24 0.23 2 Rural Major Collector 56200000526__ 10.64 13.92 0.22 2 Rural Major Collector 192300000550__ 12.08 15.15 0.20 2 Rural Major Collector 435400000521__ 1.12 6.09 0.20 2 Rural Major Collector 351400000551__ 7.83 9.82 0.19 2 Rural Major Collector 180100000565__ 8.02 9.40 0.19 2 Rural Major Collector 264900000532__ 15.36 19.43 0.17 2 Rural Major Collector 99100000519__ 12.60 14.86 0.16 2 Rural Major Collector 193700000557__ 21.54 24.97 0.15 2 Rural Major Collector 261500000518__ 7.21 10.04 0.15 2 Rural Major Collector 634800000521__ 6.35 12.19 0.15 2 Rural Major Collector 155000000519__ 0.00 8.81 0.15 2 Rural Major Collector 258600000563__ 40.07 43.87 0.15 2 Rural Major Collector 120400000519__ 32.27 38.63 0.15 2 Rural Major Collector 1094100000521__ 0.00 1.12 0.15 2 Rural Major Collector 837000000048__ 2.40 3.87 0.14 2 Rural Major Collector 342200000555__ 0.00 5.30 0.14 2 Rural Major Collector 190300000532__ 27.09 33.00 0.13 2 Rural Major Collector 86900000579__ 16.07 19.22 0.12 2 Rural Major Collector 355900000571__ 29.07 31.87 0.12 2 Rural Major Collector 407500000581__ 0.00 2.92 0.12 2 Rural Major Collector 197200000571__ 26.83 29.07 0.11 2 Rural Major Collector 267600000521__ 36.71 43.71 0.11 2 Rural Major Collector 88300000555__ 21.48 27.37 0.11 2 Rural Major Collector 839800000567__ 1.85 3.92 0.11 2 Rural Major Collector 300500000523__ 25.06 27.36 0.10 2 Rural Major Collector 586400000579__ 33.43 36.71 0.10 2 Rural Major Collector 207600000579__ 10.32 12.05 0.10 2 Rural Major Collector 396000000545__ 9.15 12.54 0.10 2 Rural Major Collector 4079148
Roadside inspection and crash data analysisTable 53. Calculated severity rate in descending order for Rural Interstate.SRI Start MP End MPSeverityRate Lanes Roadway class AADT00000195__ 16.71 16.76 0.40 2 Rural Interstate 3425500000080__ 19.88 22.75 0.38 4 Rural Interstate 5089500000078__ 30.25 30.80 0.30 2 Rural Interstate 9551900000295__ 14.17 14.33 0.29 2 Rural Interstate 5811400000080__ 3.59 4.58 0.28 3 Rural Interstate 3992600000080__ 0.00 0.50 0.26 2 Rural Interstate 5230000000080__ 12.82 13.16 0.23 3 Rural Interstate 4310100000078__ 25.53 27.11 0.21 3 Rural Interstate 10095300000080__ 18.83 19.88 0.20 4 Rural Interstate 4310100000078__ 27.11 30.25 0.20 3 Rural Interstate 9551900000095__ 16.55 19.45 0.19 3 Rural Interstate 13565400000078__ 5.47 7.46 0.18 3 Rural Interstate 8984800000080__ 22.75 24.36 0.18 3 Rural Interstate 5089500000095__ 23.40 25.15 0.17 3 Rural Interstate 14039700000080__ 4.58 5.32 0.16 3 Rural Interstate 4522700000078__ 7.46 14.87 0.15 3 Rural Interstate 7962100000080__ 13.16 15.87 0.14 4 Rural Interstate 4310100000195__ 7.37 8.54 0.14 2 Rural Interstate 2912000000080__ 15.87 18.83 0.13 3 Rural Interstate 4310100000080__ 0.50 3.59 0.12 2 Rural Interstate 3992600000080__ 5.32 10.74 0.11 4 Rural Interstate 4522700000080__ 10.74 12.03 0.11 3 Rural Interstate 4522700000295__ 11.93 14.17 0.10 2 Rural Interstate 3914400000080__ 24.77 25.04 0.10 3 Rural Interstate 5089500000295__ 5.35 7.15 0.10 2 Rural Interstate 28004149
Roadside inspection and crash data analysisSRITable 54. Calculated critical severity rate in descending order for Urban Principal.StartMPEnd MPSeverityRateCriticalRateCriticalRateFactor Lane Roadway Class AADT00000001T_ 2.20 2.27 3.67 0.87 4.20 3 Urban Principal Arterial 4268900000001__ 61.91 62.08 3.08 0.76 4.04 2 Urban Principal Arterial 2873400000001T_ 1.05 1.13 2.93 0.79 3.73 3 Urban Principal Arterial 4968900000551__ 33.59 34.57 1.95 0.68 2.86 2 Urban Principal Arterial 715000000129__ 0.32 0.64 8.32 2.93 2.84 1 Urban Principal Arterial 257300000023__ 5.44 5.50 3.35 1.29 2.60 3 Urban Principal Arterial 2044000000543__ 5.40 5.41 16.30 7.13 2.28 2 Urban Principal Arterial 840500000439__ 0.63 0.75 1.81 0.90 2.00 2 Urban Principal Arterial 2525000000206__ 38.71 39.17 1.63 0.83 1.96 2 Urban Principal Arterial 818000000031__ 6.18 6.20 4.94 2.61 1.89 4 Urban Principal Arterial 2218000000503__ 0.55 0.76 1.50 0.81 1.86 2 Urban Principal Arterial 1951700000021__ 0.89 1.00 1.49 0.81 1.85 2 Urban Principal Arterial 3751800000030__ 48.93 49.25 1.36 0.76 1.80 2 Urban Principal Arterial 1576100000015__ 14.20 14.41 1.43 0.80 1.80 2 Urban Principal Arterial 2053900000007__ 0.00 0.55 1.11 0.62 1.79 2 Urban Principal Arterial 1788300000130__ 55.45 55.46 6.11 3.53 1.73 2 Urban Principal Arterial 2241100000009__ 129.3 129.80 0.89 0.53 1.67 2 Urban Principal Arterial 4570900000022__ 36.94 37.17 0.86 0.54 1.61 3 Urban Principal Arterial 6579600000202__ 65.33 65.55 1.28 0.80 1.60 3 Urban Principal Arterial 1698900000030__ 8.06 8.26 1.09 0.69 1.59 2 Urban Principal Arterial 3445700000109__ 2.31 2.39 4.72 2.98 1.58 2 Urban Principal Arterial 362800000001__ 28.54 29.06 0.69 0.44 1.56 3 Urban Principal Arterial 7996800000028__ 6.73 6.94 1.75 1.15 1.52 4 Urban Principal Arterial 2237200000029__ 15.28 16.40 0.88 0.59 1.50 2 Urban Principal Arterial 1110400000206__ 17.58 17.66 1.78 1.20 1.49 2 Urban Principal Arterial 1919900000009__ 120.97 121.63 0.68 0.46 1.48 3 Urban Principal Arterial 5026100000561__ 50.46 50.93 1.22 0.82 1.48 2 Urban Principal Arterial 838200000202__ 71.25 71.31 4.00 2.72 1.47 4 Urban Principal Arterial 855600000045__ 25.83 25.96 2.22 1.55 1.44 4 Urban Principal Arterial 1422200000070__ 54.22 54.35 1.08 0.75 1.43 2 Urban Principal Arterial 3903300000206__ 82.27 82.32 2.11 1.49 1.42 2 Urban Principal Arterial 1951500000052__ 2.16 2.16 41.34 29.39 1.41 4 Urban Principal Arterial 1657000000206__ 17.69 17.72 3.17 2.27 1.39 3 Urban Principal Arterial 1442600000035__ 29.38 29.47 1.34 0.97 1.39 2 Urban Principal Arterial 2831100000206__ 41.15 42.74 0.87 0.63 1.38 2 Urban Principal Arterial 594600000124__ 11.17 11.30 2.05 1.50 1.37 4 Urban Principal Arterial 1541700000440__ 20.34 20.88 0.70 0.51 1.37 3 Urban Principal Arterial 3448900000031__ 42.84 43.14 1.68 1.23 1.37 4 Urban Principal Arterial 12223150
Roadside inspection and crash data analysis00000032__ 0.00 0.90 0.72 0.52 1.36 2 Urban Principal Arterial 2339200000009W_ 0.65 0.76 1.30 0.95 1.36 2 Urban Principal Arterial 2402900000018__ 30.30 30.35 1.39 1.07 1.29 2 Urban Principal Arterial 3952400000018__ 35.32 37.14 0.54 0.43 1.25 3 Urban Principal Arterial 2790000000168__ 6.58 7.42 0.61 0.49 1.25 3 Urban Principal Arterial 2817100000001__ 60.76 61.91 0.97 0.78 1.24 4 Urban Principal Arterial 2873400000510__ 16.62 16.73 1.29 1.04 1.24 2 Urban Principal Arterial 1935400000035__ 55.08 56.37 0.59 0.49 1.21 5 Urban Principal Arterial 1786900000036__ 1.72 3.26 0.72 0.61 1.17 2 Urban Principal Arterial 683000000507__ 12.65 12.78 1.15 0.99 1.16 2 Urban Principal Arterial 1825400000001__ 38.50 38.85 0.60 0.52 1.16 2 Urban Principal Arterial 6518300000185__ 0.00 0.65 0.79 0.68 1.15 2 Urban Principal Arterial 1071600000524__ 1.32 1.91 0.72 0.63 1.14 2 Urban Principal Arterial 1622700000031__ 40.74 41.19 0.78 0.68 1.14 2 Urban Principal Arterial 1569600000001T_ 1.13 2.20 0.48 0.43 1.12 3 Urban Principal Arterial 5118200000202__ 31.50 31.51 7.37 6.61 1.11 2 Urban Principal Arterial 929500000070__ 43.67 44.79 0.57 0.51 1.11 2 Urban Principal Arterial 2161700000206__ 21.90 23.48 0.57 0.52 1.11 2 Urban Principal Arterial 1442600000049__ 26.44 26.94 0.78 0.71 1.10 2 Urban Principal Arterial 1223100000124__ 11.00 11.17 1.05 0.95 1.10 2 Urban Principal Arterial 1541700000206__ 41.15 42.74 0.63 0.58 1.09 2 Urban Principal Arterial 818000000004__ 3.30 3.45 0.58 0.54 1.08 2 Urban Principal Arterial 12569400000009__ 104.4 104.49 0.95 0.89 1.08 3 Urban Principal Arterial 3190400000017__ 8.55 8.85 0.55 0.51 1.07 2 Urban Principal Arterial 8371700000023__ 34.36 35.50 0.56 0.53 1.06 2 Urban Principal Arterial 1825700000001__ 21.94 22.44 0.48 0.45 1.06 3 Urban Principal Arterial 7133900000508__ 9.94 11.28 0.55 0.52 1.06 2 Urban Principal Arterial 1681100000503__ 7.43 7.71 1.13 1.07 1.05 4 Urban Principal Arterial 2164300000206__ 42.74 42.88 1.65 1.57 1.05 3 Urban Principal Arterial 594600000130__ 30.48 34.18 0.40 0.38 1.04 3 Urban Principal Arterial 4063300000070__ 46.70 47.00 0.79 0.76 1.04 3 Urban Principal Arterial 1438300000033__ 0.11 0.18 1.57 1.53 1.03 3 Urban Principal Arterial 1247900000001__ 38.85 43.11 0.37 0.36 1.01 3 Urban Principal Arterial 66238151
Roadside inspection and crash data analysisTable 55. Calculated critical severity rate in descending order for Urban Minor Arterial.SRIStartMPEnd MPSeverityRateCriticalRateCriticalRate Factor Lane Roadway class AADT00000130__ 11.84 12.21 4.52 1.07 4.23 2 Urban Minor Arterial 574000000068__ 2.87 2.90 10.94 5.37 2.04 2 Urban Minor Arterial 417300000537__ 31.23 31.25 8.13 4.35 1.87 2 Urban Minor Arterial 842300000555__ 14.83 15.12 1.35 0.84 1.62 2 Urban Minor Arterial 1397200000553__ 19.35 21.80 1.07 0.75 1.43 2 Urban Minor Arterial 235000000046__ 21.26 21.69 1.02 0.74 1.39 2 Urban Minor Arterial 1400300000053__ 4.63 4.66 3.30 2.43 1.36 2 Urban Minor Arterial 1382000000531__ 1.55 1.99 0.99 0.73 1.36 2 Urban Minor Arterial 1415000000554__ 0.00 4.65 0.78 0.60 1.30 2 Urban Minor Arterial 283500000514__ 38.21 38.79 1.09 0.86 1.27 2 Urban Minor Arterial 651600000517__ 32.90 34.05 1.16 0.92 1.26 3 Urban Minor Arterial 307800000181__ 5.43 5.82 1.31 1.07 1.22 2 Urban Minor Arterial 537300000109__ 1.94 2.31 1.53 1.30 1.17 2 Urban Minor Arterial 362800000516__ 9.15 9.22 4.22 3.70 1.14 4 Urban Minor Arterial 463200000009__ 23.64 23.82 2.72 2.56 1.06 1 Urban Minor Arterial 1158600000012__ 11.48 11.69 1.03 0.98 1.06 2 Urban Minor Arterial 1263700000528__ 30.24 30.25 5.84 5.63 1.04 2 Urban Minor Arterial 1173000000535__ 17.43 22.76 0.46 0.46 1.01 2 Urban Minor Arterial 1252600000501__ 30.76 31.15 1.10 1.10 1.00 4 Urban Minor Arterial 22383152
Roadside inspection and crash data analysisSRITable 56. Calculated critical severity rate in descending order for Urban Interstate.StartMPEnd MPSeverityRateCriticalRateCriticalRate Factor Lane Roadway class AADT00000095__ 61.48 61.52 4.61 0.74 6.22 4 Urban Interstate 11150300000095__ 54.01 54.77 0.57 0.19 2.97 3 Urban Interstate 24766200000295__ 26.59 27.22 0.75 0.31 2.38 2 Urban Interstate 7143500000078__ 18.46 20.78 0.46 0.21 2.18 3 Urban Interstate 3773100000287__ 2.24 2.30 1.26 0.61 2.06 4 Urban Interstate 13569700000078__ 56.45 57.32 0.37 0.20 1.83 3 Urban Interstate 12888900000078__ 17.87 18.46 0.42 0.23 1.82 3 Urban Interstate 8506400000078__ 57.78 58.58 0.35 0.21 1.65 3 Urban Interstate 11059100000078__ 16.24 17.87 0.33 0.20 1.64 3 Urban Interstate 8502700000080__ 26.25 27.19 0.36 0.22 1.63 3 Urban Interstate 6828800000080__ 67.22 68.54 0.32 0.20 1.62 3 Urban Interstate 11802800000095M_ 0.09 0.20 0.67 0.42 1.59 3 Urban Interstate 5610000000287__ 41.89 42.02 0.45 0.29 1.56 3 Urban Interstate 15258000000080__ 25.04 25.37 0.45 0.30 1.49 3 Urban Interstate 5089500000287__ 64.94 65.69 0.35 0.24 1.47 3 Urban Interstate 5691700000095__ 59.13 59.42 0.33 0.22 1.47 3 Urban Interstate 22517800000287__ 7.27 8.47 0.33 0.23 1.46 3 Urban Interstate 4609900000295__ 27.39 28.16 0.31 0.21 1.43 3 Urban Interstate 10455700000287__ 0.00 0.70 0.34 0.24 1.43 5 Urban Interstate 10226500000076__ 0.00 0.37 0.42 0.30 1.40 2 Urban Interstate 15846900000078__ 51.76 53.12 0.27 0.19 1.38 3 Urban Interstate 12399800000287__ 42.02 44.95 0.26 0.19 1.36 3 Urban Interstate 6455100000095__ 25.15 28.51 0.22 0.18 1.25 3 Urban Interstate 14039700000095__ 60.38 61.20 0.35 0.28 1.25 2 Urban Interstate 11150300000080__ 27.19 28.82 0.24 0.19 1.24 3 Urban Interstate 9894600000280__ 14.45 16.59 0.24 0.19 1.23 3 Urban Interstate 7780100000287__ 13.50 14.30 0.26 0.21 1.22 3 Urban Interstate 10946900000287__ 12.30 13.50 0.25 0.20 1.20 3 Urban Interstate 9059000000080__ 58.22 58.92 0.47 0.39 1.19 4 Urban Interstate 12402000000078__ 48.15 49.40 0.33 0.28 1.19 2 Urban Interstate 7373500000078__ 58.58 62.01 0.29 0.25 1.14 2 Urban Interstate 8266900000295__ 43.09 43.10 1.66 1.55 1.07 4 Urban Interstate 8254800000095__ 7.95 15.15 0.18 0.17 1.07 3 Urban Interstate 12312100000295__ 60.23 61.44 0.26 0.24 1.06 3 Urban Interstate 3294800000095__ 42.73 45.50 0.18 0.17 1.05 3 Urban Interstate 19026000000078__ 49.40 49.56 0.35 0.33 1.04 3 Urban Interstate 7373500000287__ 66.95 67.54 0.23 0.22 1.04 3 Urban Interstate 10444700000295__ 1.39 1.92 0.42 0.41 1.02 2 Urban Interstate 24443153
Roadside inspection and crash data analysis00000295__ 28.16 30.03 0.19 0.19 1.01 3 Urban Interstate 11065600000287__ 9.95 10.01 0.41 0.41 1.01 3 Urban Interstate 110921Table 57. Calculated critical severity rate in descending order for Urban Freeway/Expressway.SRIStartMPEndMPSeverityRateCriticalRateCriticalRate Factor Lane Roadway class AADT00000444__ 7.81 8.40 0.95 0.31 3.05 3 Urban Freeway/Expressway 1590000000700__ 1.12 1.88 0.54 0.18 2.99 2 Urban Freeway/Expressway 5129200000024__ 10.18 10.42 0.61 0.24 2.59 3 Urban Freeway/Expressway 9346000000440__ 0.00 2.01 0.31 0.16 1.98 3 Urban Freeway/Expressway 8460000000120__ 0.78 1.34 0.40 0.22 1.83 2 Urban Freeway/Expressway 3705600000018__ 14.51 19.02 0.24 0.14 1.75 2 Urban Freeway/Expressway 3954600000001__ 51.43 54.61 0.24 0.14 1.75 2 Urban Freeway/Expressway 6352300000029__ 4.29 4.34 0.91 0.55 1.67 2 Urban Freeway/Expressway 4509300000446__ 43.61 44.19 0.28 0.18 1.55 4 Urban Freeway/Expressway 4172200000004__ 9.01 10.26 0.24 0.17 1.41 3 Urban Freeway/Expressway 8223600000003__ 4.95 6.39 0.22 0.16 1.36 3 Urban Freeway/Expressway 10646900000003__ 0.00 0.22 0.28 0.21 1.35 2 Urban Freeway/Expressway 11219600000138__ 0.33 0.71 0.28 0.22 1.27 2 Urban Freeway/Expressway 5142100000042__ 12.80 14.28 0.14 0.12 1.23 4 Urban Freeway/Expressway 14640100000495__ 0.78 0.79 0.88 0.72 1.22 3 Urban Freeway/Expressway 15607400000021__ 8.00 9.28 0.21 0.17 1.20 3 Urban Freeway/Expressway 6900400000700__ 26.32 34.70 0.14 0.12 1.17 2 Urban Freeway/Expressway 6394800000024__ 6.75 7.11 0.26 0.23 1.14 3 Urban Freeway/Expressway 7415500000003__ 6.39 7.39 0.14 0.13 1.11 4 Urban Freeway/Expressway 12854900000444__ 82.35 84.10 0.18 0.17 1.07 3 Urban Freeway/Expressway 5543000000001__ 2.87 3.75 0.20 0.19 1.07 2 Urban Freeway/Expressway 3873800000024__ 7.11 8.02 0.19 0.18 1.05 3 Urban Freeway/Expressway 7473600000004__ 5.00 5.69 0.19 0.18 1.04 3 Urban Freeway/Expressway 10587400000003__ 8.02 9.12 0.12 0.12 1.03 4 Urban Freeway/Expressway 15098700000444__ 129.50 130.63 0.04 0.04 1.00 5 Urban Freeway/Expressway 86180SRITable 58. Calculated critical severity rate in descending order for Urban Collector.StartMPEnd MPSeverityRateCriticalRateCriticalRateFactor Lane Roadway class AADT00000579__ 36.71 37.24 3.11 2.15 1.45 2 Urban Collector 207600000575__ 18.45 18.49 27.66 21.94 1.26 2 Urban Collector 619154
Roadside inspection and crash data analysisSRITable 59. Calculated critical severity rate in descending order for Rural Principal Arterial.StartMPEndMPSeverityRateCriticalRateCriticalRate Factor Lane Roadway class AADT00000070__ 33.31 33.32 51.96 7.70 6.75 2 Rural Principal Arterial 1054600000040__ 16.50 16.56 4.29 2.80 1.53 2 Rural Principal Arterial 1065300000070__ 26.39 26.47 3.80 3.45 1.10 1 Rural Principal Arterial 900100000033__ 35.90 36.03 0.75 0.72 1.03 4 Rural Principal Arterial 35284SRITable 60. Calculated critical severity rate in descending order for Rural Minor Arterial.StartMPEnd MPSeverityRateCriticalRateCriticalRateFactor Lane Roadway class AADT00000077__ 10.68 14.06 0.57 0.44 1.31 2 Rural Minor Arterial 460500000094__ 11.87 14.08 0.61 0.47 1.28 2 Rural Minor Arterial 511800000094__ 0.47 0.61 1.83 1.48 1.24 2 Rural Minor Arterial 541600000077__ 5.90 10.68 0.46 0.39 1.19 2 Rural Minor Arterial 563600000045__ 11.16 15.65 0.46 0.44 1.04 2 Rural Minor Arterial 331400000510__ 2.79 3.44 0.55 0.53 1.02 2 Rural Minor Arterial 11590SRITable 61. Calculated critical severity rate in descending order for Rural Major Collector.StartMPEndMPSeverityRateCriticalRateCritical RateFactor Lane Roadway class AADT00000519__ 42.04 42.05 12.52 6.07 2.06 2 Rural Major Collector 1094100000532__ 33.00 33.04 5.70 5.67 1.01 2 Rural Major Collector 3003Table 62. Calculated critical severity rate in descending order for Rural Interstate.SRIStartMPEndMPSeverityRateCriticalRateCriticalRate Factor Lane Roadway class AADT00000080__ 19.88 22.75 0.38 0.19 1.92 4 Rural Interstate 5089500000078__ 30.25 30.80 0.30 0.23 1.28 2 Rural Interstate 9551900000080__ 3.59 4.58 0.28 0.27 1.04 3 Rural Interstate 39926155
Roadside inspection and crash data analysisTable 63. Predefined reports requested by the BTS.1. A report of the most commercial vehicle crashes by Municipality, County, etc… What type offormat?2. A report listing crashes by cause for commercial vehicles (shifting or falling cargo, driverfatigue, equipment failure, etc.)3. A report listing all Commercial vehicle crashes involving all injuries and fatalities andassociated cause (seatbelt compliance?)4. A report of the overall number and severity of all crashes especially single unit truck crashesin the seven Northern counties. (e.g. Middlesex, Bergen, and Union).5. A report showing all fatal bus crashes, including Motor coach (9-15 including Bus Driver) and(> 15 people including Bus Driver) listed by County, Municipality….6. Comparison Reports for crashes and safety inspections on a Quarterly and Annual basis.7. Reports by Violations (Overweight, Drunk driving, Hours of Service) listed by Facility and byCounty.8. Reports by Vehicle Classification - to be done for SAFETYNET and all crash data.9. Report summarize – why it is Federally reported?%-Tow- away- due to disabled Vehicles% - Fatality% Injury- taken away by Ambulance10. Commercial Vehicle Accident rate – # of Accidents per million vehicle miles (or commercialvehicle miles) traveled by facility type.11. Reports showing the number of Hazmat inspections by vehicle category that are completedmonthto month, quarterly, and annually.12. Report showing bus/motor coach inspections, 9-15 passenger vehicles, and smaller busvehicles (15-24) passengers.13. Report showing the correctly identified number of violations discovered during trafficenforcement detail. Instead of listing them all as 392.2- .2S, .2F , .2LC - which is a generalviolation. ( 392.2 is the correct number) Please ask Sgt. Kasper for the list…14. Report showing the total number of compliance reviews by quarter and annually. (CR is anaudit done on a carrier conducted in New Jersey.) (This is for Inspections only)156