Morphology and Gas Adsorption Properties of ... - ResearchGate
Morphology and Gas Adsorption Properties of ... - ResearchGate
Morphology and Gas Adsorption Properties of ... - ResearchGate

Create successful ePaper yourself
Turn your PDF publications into a flip-book with our unique Google optimized e-Paper software.
<strong>Morphology</strong> <strong>of</strong> Palladium-Cobalt-Based Cyanogels Chem. Mater., Vol. 15, No. 22, 2003 4241Figure 1. Carbon dioxide-argon recycling data for the 60 mMxerogel system illustrating the complete reversibility <strong>and</strong>reproducibility <strong>of</strong> CO 2 adsorption. Although the figure showsonly three CO 2-Ar cycles, this cycling was carried out 10 timeswith almost no change, indicating the reproducibility <strong>and</strong> thecomplete reversibility <strong>of</strong> CO 2 adsorption.The Pd-Co aerogels show a similar adsorption pr<strong>of</strong>ile;however, they take up about 9% by mass <strong>of</strong> CO 2 . Theadsorption <strong>of</strong> N 2 O by the gels is identical to that <strong>of</strong> CO 2in terms <strong>of</strong> the amount <strong>of</strong> the gas adsorbed. Theincreased gas adsorption by the aerogels is in line withtheir larger mean pore size 7 <strong>and</strong> exp<strong>and</strong>ed structure visà-visthe xerogels. Another indication <strong>of</strong> the smaller poredimensions <strong>of</strong> the xerogels is provided by the fact thatno detectable SF 6 adsorption is observed on the xerogels;the aerogels, in contrast, take up 11% <strong>of</strong> SF 6 by mass.Neither <strong>of</strong> the gels adsorbs Ar, N 2 ,O 2 ,orCH 4 underambient conditions: these gases, therefore, are suitablec<strong>and</strong>idates for desorbing the adsorbed gases <strong>of</strong>f the gels.Porosity <strong>of</strong> the Cyanogels. Microporosity <strong>of</strong> thePd-Co Xerogels. Figure 2 shows the N 2 <strong>and</strong> CO 2adsorption isotherms measured at -196 °C <strong>and</strong> 0 °C,respectively, for both the 0.4 M aero- <strong>and</strong> xerogels. Thexerogel isotherm is shown in Figure 2(a) <strong>and</strong> Figure 2(b)depicts that for the aerogel. The xerogel shows a distinctType I isotherm 15 indicating that it is almost purelymicroporous. The aerogel, on the other h<strong>and</strong>, yields aType IV isotherm, 15 characteristic <strong>of</strong> a mesoporous solid.The pore size distribution (PSD) in the cyanogels isshown in Figure 3. Figure 3(a) depicts the PSD plot forthe 0.4 M Pd-Co xerogel obtained by applying the SaitoFoley-extended Horvath Kawazoe (HK) model to thenitrogen adsorption data for the xerogel. As can beobserved, the pore diameters in the xerogel lie in thesub-2 nm range with a peak at 0.9 nm indicative <strong>of</strong> itsmicroporous nature.Figure 4(a) <strong>and</strong> (b) clearly illustrate the N 2 <strong>and</strong> theCO 2 adsorption isotherms, respectively, for both the 0.4M Pd-Co aerogel <strong>and</strong> xerogel in the low relativepressure regime. As can be seen, in this region the N 2<strong>and</strong> the CO 2 adsorption isotherms for both the gels arecurved. It has been shown 16 that curved isotherms inthe low relative pressure region are obtained frommaterials consisting <strong>of</strong> narrow microporessi.e., possessinga narrow microporosityswhereas wide microporosityleads to more linear isotherms in the low relativepressure region. Curved isotherms are associated with(16) Martin-Martinez, J. M.; Mittelmeijer-Hazeleger, M. C. Langmuir1993, 9, 3317.Figure 2. (a) Nitrogen adsorption isotherm at 77 K for the0.4MPd-Co xerogel. The classic Type I isotherm indicatesthat the xerogel is almost predominantly microporous. (b)Nitrogen adsorption <strong>and</strong> desorption isotherms obtained at 77K for the 0.4 M aerogel <strong>and</strong> xerogel. The volume adsorbed bythe aerogel is an order <strong>of</strong> magnitude greater than that for thexerogel.enhanced adsorption potential in micropores smallerthan two molecular diameters <strong>of</strong> CO 2 . 16 In such narrowpores, the potential fields from the neighboring wallsoverlap significantly, thereby enhancing the interactionpotential between the pore walls <strong>and</strong> the adsorbatemolecules. 17-19 This enhanced interaction leads to acurvature <strong>of</strong> the adsorption isotherm as a large amount<strong>of</strong> the adsorbate is adsorbed at very low relative pressures.The steep initial part <strong>of</strong> the xerogel isotherm,indicating that >75% <strong>of</strong> the pore volume is filled at p
4242 Chem. Mater., Vol. 15, No. 22, 2003 Deshp<strong>and</strong>e et al.Figure 3. (a) Pore size distribution plot for the 0.4 M Pd-Coxerogel indicative <strong>of</strong> its microporous nature. The plot has beenmade using the Saito-Foley extended Horvath Kawazoemodel. (b) BJH plot for the 0.4 M Pd-Co aerogel showing thepresence <strong>of</strong> mesopores.obtained on the application <strong>of</strong> the Brunauer, Emmett,<strong>and</strong> Teller 13 (BET) model to the adsorption data for the0.4 M Pd-Co xerogel. In systems with narrow microporosity,the diffusion <strong>of</strong> N 2 molecules in narrowmicropores at -196 °C is kinetically restricted. No suchbarrier exists for CO 2 molecules, as the adsorption takesplaces at 0 °C. 21 Hence, in microporous materials, theapplication <strong>of</strong> the DR equation to the CO 2 adsorptiondata leads to a larger pore volume vis-à-vis thatobtained from the N 2 adsorption data. Both theseobservationssthe curved adsorption isotherms in thelow relative pressure regime <strong>and</strong> the difference in themicropore volumes obtained from the N 2 <strong>and</strong> CO 2adsorption datasclearly indicate that the pores in thexerogel are exceedingly narrow, i.e., the xerogel possessesa narrow microporosity. Transmission electronmicroscope imaging <strong>of</strong> the Pd-Co xerogels, Figure 5,leads to the conclusion that the average particle size inthe xerogels is ∼10 nm.(21) Garrido, J.; Linares-Solano, A.; Martin-Martinez, J. M.; Molina-Sabio, M.; Rodriguez-Reinoso, F.; Torregrosa, R. Langmuir 1987, 3,76.Figure 4. (a) Close-up <strong>of</strong> the N 2 adsorption isotherm in thelow partial pressure region illustrating the curved isothermsindicative <strong>of</strong> narrow microporosity for both the 0.4 M aero<strong>and</strong>xerogel. (b) CO 2 adsorption isotherms obtained at 273 Kfor both the 0.4 M aero- <strong>and</strong> xerogel in the low partial pressureregion. The curvature <strong>of</strong> the isotherms is characteristic <strong>of</strong>narrow microporosity in these gels.Dual Porosity <strong>of</strong> the Aerogels. Unlike the predominantlymicroporous xerogel, the aerogel possesses bothmicro- <strong>and</strong> mesoporosity. Figure 3(b) displays the PSDplot for the 0.4 M Pd-Co aerogel obtained by theapplication <strong>of</strong> the BJH model to the desorption branch<strong>of</strong> the nitrogen isotherm on the aerogel. It indicates thatthe pore diameters in the aerogels range from 3 to 40nm implying that the Pd-Co aerogel is primarilymesoporous. A pronounced uptake in the low relativepressure regionsas Figure 4(a) <strong>and</strong> (b) showssimpliesthe existence <strong>of</strong> micropores in the aerogel. The curvednature <strong>of</strong> the isotherms in this pressure region, togetherwith the difference in the pore volume values calculatedfrom the DR equation applied to the N 2 <strong>and</strong> CO 2adsorption data, as shown in Table 1, point to theexistence <strong>of</strong> narrow microporosity within the aerogel.Table 1 lists the adsorption data for the 0.4 M Pd-Coaerogel primarily because the adsorption data for otheraerogels studied in this paper are similar. Additionally,in our earlier studies, 6 it has been observed that
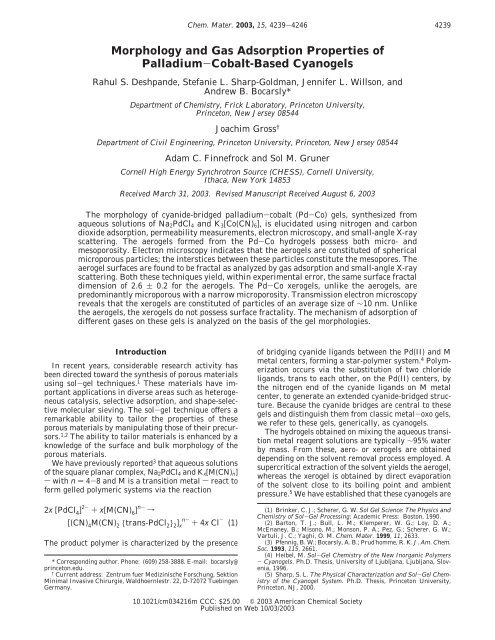
<strong>Morphology</strong> <strong>of</strong> Palladium-Cobalt-Based Cyanogels Chem. Mater., Vol. 15, No. 22, 2003 4243sampleTable 1. Surface Areas <strong>and</strong> Micropore Volumes <strong>of</strong> the 0.4 M Pd-Co CyanogelsN 2-S BETa(m 2 /g)N 2-S DRb(m 2 /g)CO 2-S DRb(m 2 /g)N 2-V pc(cm 3 /g)N 2-V DRd(cm 3 /g)CO 2-V DRd(cm 3 /g)0.4 M aerogel 730.71 ( 3.29 450.62 ( 3.17 822.82 ( 5.14 2.37 ( 0.17 0.23 ( 0.05 0.26 ( 0.050.4 M xerogel 439.36 ( 4.17 491.78 ( 3.84 705.11 ( 4.93 0.22 ( 0.07 0.19 ( 0.04 0.28 ( 0.06a N 2-S BET. Total surface area determined by applying the Brunauer-Emmett-Teller (BET) equation to the nitrogen adsorption data.b N 2-S DR <strong>and</strong> CO 2-S DR. Surface area <strong>of</strong> the micropore region determined by applying the Dubinin-Radushkevich equation to the nitrogen<strong>and</strong> carbon dioxide adsorption data. c N 2-V p. Total pore volume determined by measuring the volume <strong>of</strong> nitrogen absorbed at the saturationpressure <strong>of</strong> N 2. d N 2-V DR <strong>and</strong> CO 2-V DR. Micropore pore volume determined by applying the Dubinin-Radushkevich equation to thenitrogen <strong>and</strong> carbon dioxide adsorption data.Figure 5. Transmission electron microscope image <strong>of</strong> a 0.4MPd-Co xerogel. The particle size averages ∼10 nm.Figure 6. t-Plot for the 0.4 M Pd-Co aerogel showing boththe mesoporosity <strong>and</strong> the microporosity (inset). The pronouncedcurvature in the low-t region (inset) is indicative <strong>of</strong>microporosity in the aerogel.although the mean pore radius in the Pd-Co cyanogelsis highly sensitive to the gel concentration, the porosityis very weakly dependent on gel concentration: it variesby less than 5% when the concentration is varied by afactor <strong>of</strong> 5. The final evidence for microporosity in Pd-Co aerogels is provided by the t-plot analysis <strong>of</strong> theaerogel isotherm. Figure 6 shows the t-plot for the 0.4MPd-Co aerogel. The curvature in the t-plot in theregion <strong>of</strong> low t values clearly attests to the presence <strong>of</strong>microporosity in the Pd-Co aerogels.Unlike the N 2 adsorption isotherm for the xerogel,which is <strong>of</strong> Type I, the N 2 adsorption isotherm for the0.4MPd-Co aerogel is a type IV isotherm, 15 characteristic<strong>of</strong> a mesoporous solid (cf. Figure 2(b)). Theisotherm displays hysteresis: the H1 hysteresis loop isFigure 7. Scanning electron micrograph <strong>of</strong> a 0.4 M Pd-Coaerogel illustrating the “packed cotton ball” model. The“packed cotton ball” refers to the micropore-containing aerogelparticles that, on average, are ∼40 nm in diameter. Theinterstitial voids that arise from packing <strong>of</strong> these aerogelparticles constitute the mesopores.Table 2. Comparison <strong>of</strong> Sorption Data, Beam BendingData, <strong>and</strong> Calculated Estimatestype <strong>of</strong>measurementperformedon aerogelpermeabilitymeasurementnitrogen sorptionexperimentcalculatedvalues due to N 2sorption shrinkagedensity <strong>of</strong>aerogel(g/cm 3 )mean poreradius awithinaerogel (nm)total porevolume <strong>of</strong>aerogel(cm 3 /g)0.10 ( 0.02 17.1 ( 1.8 9.36 ( 1.836.48 ( 1.28 2.37 ( 0.460.28 ( 0.05 5.98 ( 1.17 3.08 ( 0.55a Mean pore radius found from the nitrogen sorption experimentwas determined by (2 × volume <strong>of</strong> N 2 adsorbed)/(BET surfacearea).characteristic <strong>of</strong> capillary condensation in mesopores.Such a loop is <strong>of</strong>ten obtained with agglomerates orcompacts <strong>of</strong> spherical particles <strong>of</strong> fairly uniform size <strong>and</strong>is typical <strong>of</strong> aerogels. 15Scanning electron microscope images <strong>of</strong> the 0.4 Maerogel, Figure 7, indicate that it is composed <strong>of</strong>spherical particles <strong>of</strong> 40 ( 3 nm in diameter. The meanpore radius calculated from the three-point beam bendingmeasurements 6 is 17.1 ( 1.8 nm. This value is insharp contradiction with the mean pore radius calculatedfrom the N 2 desorption which yields a significantlysmaller pore radius <strong>of</strong> 6.48 ( 1.28 nm. Table 2 lists thevalues <strong>of</strong> mean pore radius <strong>and</strong> pore volume obtainedthrough different techniques. The discrepancy betweenthe pore values obtained from the N 2 adsorption <strong>and</strong>from beam-bending measurements is not surprisingbecause gas adsorption is expected to significantlydeform the shape <strong>and</strong> size <strong>of</strong> pores in these compliantaerogels. As the liquid adsorbate begins to desorb fromthe pores, high capillary pressure gradients 22 that are
4244 Chem. Mater., Vol. 15, No. 22, 2003 Deshp<strong>and</strong>e et al.strong enough to cause a substantial contraction <strong>of</strong> amaterial as fragile <strong>and</strong> compliant as an aerogel, 23 aregenerated in the pores. These deformations are especiallypronounced during desorption <strong>of</strong> the capillarycondensate from the mesopores <strong>of</strong> the aerogels. Hence,the data obtained from the gas adsorption relate to thepore sizes in the deformed aerogels, whereas thoseobtained from the three-point beam-bending measurementspertain to the pore sizes in pristine hydrogels.The beam bending measurements lead, inter alia, to thevalues <strong>of</strong> the elastic modulus <strong>and</strong> permeability <strong>of</strong> thehydrogel network. It has been shown 22 that in the case<strong>of</strong> fragile <strong>and</strong> compliant aerogels, the true pore size <strong>and</strong>pore volume can be estimated from knowledge <strong>of</strong> theelastic modulus <strong>of</strong> the gel network.As a result <strong>of</strong> the probable shrinkage incurred duringadsorption, the pore volume determined can be seriouslyunderestimated. However, even though there is somecontraction in the pore volume at low relative pressures,the surface area is probably not seriously affected. Forinstance, it has been demonstrated 24 that a silica aerogelhas a comparable surface area before <strong>and</strong> after beingwetted <strong>and</strong> dried, even though there has been a largechange in pore volume. Mercury porosimetry will notgive a true pore size either. The aerogels are so compliantthat mercury does not enter the pores <strong>of</strong> the aerogel;instead it compresses the gels. 23To have an underst<strong>and</strong>ing <strong>of</strong> the N 2 adsorption data,the maximum shrinkage during desorption (when almostall <strong>of</strong> the pores are full <strong>of</strong> liquid) can be determined.The capillary pressure, P c , exerted on the gelduring the measurement can be found from the partialpressure <strong>of</strong> nitrogen, p/p o ,as 25P c ) (RT/V m ) ln(p/p o ) (2)where V m is the molar volume <strong>of</strong> liquid nitrogen, T isthe absolute temperature, <strong>and</strong> R is the gas constant.The capillary pressure P c <strong>and</strong> the pore radius, r, arerelated by 26r ) (-b H RT/P c V m ) 1/3 - 2γ/P c (3)where γ is the liquid/vapor interfacial energy <strong>and</strong> b H isa constant. For N 2 , V m ) 34.6 cm 3 /g, b H ) 0.221, <strong>and</strong> γ) 8.85 ergs/cm 2 at T ) 77 K. Using these parameters(22) Scherer, G. W. J. Non-Cryst. Solids 1997, 215, 155.(23) Scherer, G. W.; Smith, D. M.; Stein, D. J. J. Non-Cryst. Solids1995, 186, 309.(24) Johnson, M. F. L.; Ries, H. E., Jr. J. Am. Chem. Soc. 1950, 72,4289.(25) Lowell, S.; Shields, J. E. Powder Surface Area <strong>and</strong> Porosity;Chapman <strong>and</strong> Hall: New York, 1984.(26) P c is related to the pore radius, r, by Laplace’s equation:P c ) - 2γ cos θ/(r - t) (1a)where γ is the liquid/vapor interfacial energy, t is the thickness <strong>of</strong> theadsorbed layer <strong>of</strong> nitrogen on the pore walls, <strong>and</strong> θ is the contact angle,generally taken to be zero. The layer thickness can be calculated fromthe Halsey equation:t ) ( - b H /ln(p/p o )) 1/3(2a)As ln(p/p o) ) P cV m/RT (cf. Equation 2 in the main text), the thicknesst is related to the critical pressure P c by:t ) ( - b H RT/P c V m ) 1/3(3a)Substituting this value <strong>of</strong> t in eq 1a, eq 3 in the main text follows.eq 3 can be solved. The result can be closely approximatedby 22P c ≈ -(30/r 1.18 ) (4)During desorption, as the relative pressure <strong>of</strong> nitrogenvapor decreases, the capillary pressure increases inmagnitude. The gel network is consequently compressed<strong>and</strong> it contracts. This contraction leads to an increasein its bulk modulus. The network will stop contractingwhen the following condition is satisfied: 22(K o /m) (F b /F o ) m ≈ -[1 - (F b /F s )]P c ≈[1 - (F b /F s )](30/ r 1.18 ) (5)where K o is the bulk modulus <strong>of</strong> the gel network, m isa constant related to the power law dependence <strong>of</strong> thebulk modulus to density, F s is the skeletal density <strong>of</strong>the gel, F o is the original bulk density, <strong>and</strong> F b is the finalbulk density <strong>of</strong> the gel at the point when the gelshrinkage stops.It has been shown that in such gels the pore sizevaries approximately in proportion to the pore volume 22r(F b ) ≈ r(F o )[((1/F b ) - (1/F s ))/((1/F o ) - (1/F s ))] (6)The values r(F b ) <strong>and</strong> r(F o ) are, respectively, the pore sizeat maximum compression <strong>and</strong> the original pore size.The permeability <strong>and</strong> moduli <strong>of</strong> a series <strong>of</strong> cyanogelswere determined previously using a three-point beambending apparatus. 6 Data obtained through this methodon aerogels made from 0.4 M solutions are the following:K o ) 1.01 MPa, m ) 2.9, F o ) 0.102 g/cm 3 , F s )2.26 g/cm 3 , <strong>and</strong> r ) 17.1 nm. Applying this informationto eq 5, it is possible to obtain an estimate <strong>of</strong> the amount<strong>of</strong> contraction that the gel system will undergo duringadsorption. Equation 5 leads to the solution F b ) 0.269g/cm 3 ; the corresponding pore radius from eq 6 is r )5.98 nm. This compares favorably with the pore radius<strong>of</strong> 6.48 nm obtained from N 2 desorption.This indicates that any aerogel with a density lessthan 0.269 g/cm 3 will contract during nitrogen desorptionuntil its density reaches that value <strong>and</strong> its poreradius is reduced to ∼6 nm. This contraction occursexclusively during desorption <strong>of</strong> the capillary condensate,i.e., when the mesopores are being emptied. Themicropore volume values, consequently, can be assumedto be accurate. The density predicted for maximumshrinkage is less than that <strong>of</strong> the xerogel density (1.78g/cm 3 vs 0.269 g/cm 3 ), so no contraction is expected inthe xerogel system <strong>and</strong> the gas adsorption values forthe xerogel system are valid.The nitrogen sorption data in conjunction with theprevious permeability experiments, 6 lead to the conclusionthat there are two levels <strong>of</strong> porosity in the aerogelsystem: micropores that can be characterized by nitrogensorption <strong>and</strong> mesopores whose true size can bedetermined by permeability measurements. Scanningelectron microscope imaging <strong>of</strong> the fractured surface <strong>of</strong>the aerogel reveals globular particles whose packingresults in the mesoporous structure <strong>of</strong> the aerogelsystem as seen in Figure 7. We propose that thestructure <strong>of</strong> the Pd-Co aerogel can be described as“packed cotton balls”. The cotton ball represents themicropore-possessing aerogel particle. For the 0.4 M
4246 Chem. Mater., Vol. 15, No. 22, 2003 Deshp<strong>and</strong>e et al.Table 3. Surface Fractal Dimension, D, <strong>of</strong>Pd-CoAerogels by <strong>Gas</strong> <strong>Adsorption</strong> <strong>and</strong> Small-Angle X-rayScattering (SAXS): A Comparisonaerogel conc. (M) D from gas adsorption D from SAXS0.175 2.70 ( 0.15 2.72 ( 0.140.4 2.67 ( 0.20 2.65 ( 0.140.5 2.66 ( 0.13 2.71 ( 0.120.8 2.62 ( 0.17 2.67 ( 0.15dent techniques compare favorably, unambiguouslydemonstrating the fractal nature <strong>of</strong> the aerogel surface.For the xerogel surfaces, the plots <strong>of</strong> log V vs log(log-(p o /p)) (cf. eq 7) are nonlinear indicating that thexerogels possess nonfractal surfaces. We hypothesizethat the difference in the fractal nature <strong>of</strong> the aerogel<strong>and</strong> xerogel surfaces may be due to the disparate dryingprocesses used to generate them from the parent hydrogels.High capillary pressure gradients that areencountered in obtaining the xerogels from the hydrogelswould be expected to significantly affect theirsurface properties. Such gradients are absent in aerogelformation. Additionally, it may be anticipated that theprolonged interaction <strong>of</strong> the hydrogel beams with acetone,that are subsequently used to obtain the aerogels,may have an effect on their surface characteristics. Boththese factors would contribute to bringing about adifference in the surface characteristics <strong>of</strong> the aero- <strong>and</strong>xerogels that manifests itself in the surface fractalnature <strong>of</strong> the aerogels.ConclusionsThe palladium-cobalt (Pd-Co) xerogels are predominantlymicroporous as indicated by both the pore sizedistribution <strong>and</strong> the classic Type I isotherm with bothN 2 <strong>and</strong> CO 2 . Further, the curved adsorption isothermsin the low relative pressure region with these adsorptives,in conjunction with the disparate pore volumevalues obtained with N 2 <strong>and</strong> CO 2 adsorption, point tothe narrow microporosity in the Pd-Co xerogel system.The Pd-Co aerogels on the other h<strong>and</strong>, have a dualporosity. <strong>Gas</strong> adsorption indicates that they possessmicroporess<strong>and</strong> akin to the xerogels, a narrow microporosityswhereaspermeability measurements togetherwith the Type IV adsorption isotherm with an H1hysteresis loop, enable the conclusion that they are alsomesoporous. These data, along with the SEM <strong>and</strong> SAXSresults, lead to the structure <strong>of</strong> the Pd-Co aerogels as“packed cotton balls”. The cotton ball represents themicropore-possessing, surface-fractal aerogel particle.For a 0.4 M aerogel, these particles have an averagediameter <strong>of</strong> 40 ( 3 nm, <strong>and</strong> the voids between theseparticles constitute the mesopores <strong>of</strong> average radius <strong>of</strong>17.1 ( 1.8 nm. The adsorption <strong>of</strong> carbon dioxide <strong>and</strong>nitrous oxide occurs due to the microporous nature <strong>of</strong>both the xerogel <strong>and</strong> the aerogel, whereas SF 6 isadsorbed only in the mesopores <strong>of</strong> the aerogel.These surface fractal gels appear to be promising fora variety <strong>of</strong> applications. From the st<strong>and</strong>point <strong>of</strong> heterogeneouscatalysis, as the catalytic activity <strong>and</strong>transport efficiency are <strong>of</strong>ten dependent on surface selfsimilarity,33 these gels could find use as efficientheterogeneous catalysts. The presence <strong>of</strong> palladium <strong>and</strong>cobalt metal centers in these gels strengthens theirc<strong>and</strong>idacy as catalysts. The porosity <strong>of</strong> these gels canbe exploited to make gel-embedded filters to separatemixtures <strong>of</strong> gases based on the their differential adsorptionpropensities. The reversible adsorption <strong>of</strong> CO 2 canbe harnessed practically by using these gels as CO 2storage reservoirs.Acknowledgment. Financial support for this researchfrom NSF Grant CHE-0079169 is gratefullyacknowledged. Pr<strong>of</strong>essor George Scherer is thanked forinsightful discussions <strong>and</strong> his generosity in making hislaboratory equipment available to us.CM034216M(33) Kukovecz, A.; Konya, Z.; Palinko, I.; Monter, D.; Reschetilowski,W.; Kiricsi, I. Chem. Mater. 2001, 13, 345.