Measurement and use of scattering coefficients in room acoustic ...
Measurement and use of scattering coefficients in room acoustic ...
Measurement and use of scattering coefficients in room acoustic ...
- No tags were found...

You also want an ePaper? Increase the reach of your titles
YUMPU automatically turns print PDFs into web optimized ePapers that Google loves.
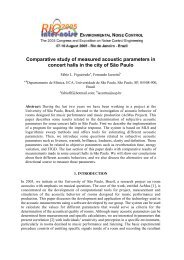
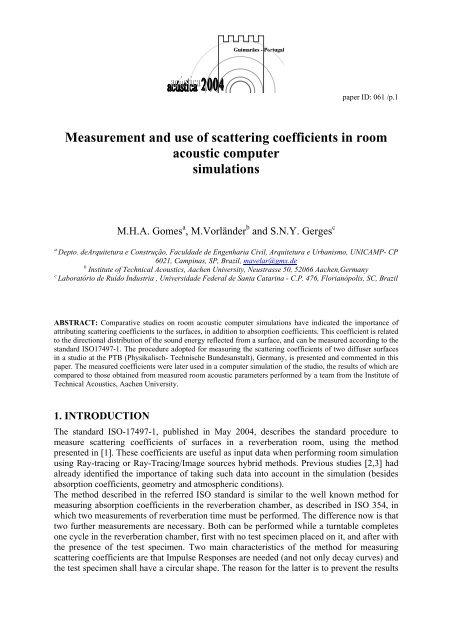
Guimarães - Portugalpaper ID: 061 /p.1<strong>Measurement</strong> <strong>and</strong> <strong>use</strong> <strong>of</strong> <strong>scatter<strong>in</strong>g</strong> <strong>coefficients</strong> <strong>in</strong> <strong>room</strong><strong>acoustic</strong> computersimulationsM.H.A. Gomes a , M.Vorländer b <strong>and</strong> S.N.Y. Gerges caDepto. deArquitetura e Construção, Faculdade de Engenharia Civil, Arquitetura e Urbanismo, UNICAMP- CP6021, Camp<strong>in</strong>as, SP, Brazil, mavelar@gmx.deb Institute <strong>of</strong> Technical Acoustics, Aachen University, Neustrasse 50, 52066 Aachen,GermanycLaboratório de Ruído Industria , Universidade Federal de Santa Catar<strong>in</strong>a - C.P. 476, Florianópolis, SC, BrazilABSTRACT: Comparative studies on <strong>room</strong> <strong>acoustic</strong> computer simulations have <strong>in</strong>dicated the importance <strong>of</strong>attribut<strong>in</strong>g <strong>scatter<strong>in</strong>g</strong> <strong>coefficients</strong> to the surfaces, <strong>in</strong> addition to absorption <strong>coefficients</strong>. This coefficient is relatedto the directional distribution <strong>of</strong> the sound energy reflected from a surface, <strong>and</strong> can be measured accord<strong>in</strong>g to thest<strong>and</strong>ard ISO17497-1. The procedure adopted for measur<strong>in</strong>g the <strong>scatter<strong>in</strong>g</strong> <strong>coefficients</strong> <strong>of</strong> two diff<strong>use</strong>r surfaces<strong>in</strong> a studio at the PTB (Physikalisch- Technische Bundesanstalt), Germany, is presented <strong>and</strong> commented <strong>in</strong> thispaper. The measured <strong>coefficients</strong> were later <strong>use</strong>d <strong>in</strong> a computer simulation <strong>of</strong> the studio, the results <strong>of</strong> which arecompared to those obta<strong>in</strong>ed from measured <strong>room</strong> <strong>acoustic</strong> parameters performed by a team from the Institute <strong>of</strong>Technical Acoustics, Aachen University.1. INTRODUCTIONThe st<strong>and</strong>ard ISO-17497-1, published <strong>in</strong> May 2004, describes the st<strong>and</strong>ard procedure tomeasure <strong>scatter<strong>in</strong>g</strong> <strong>coefficients</strong> <strong>of</strong> surfaces <strong>in</strong> a reverberation <strong>room</strong>, us<strong>in</strong>g the methodpresented <strong>in</strong> [1]. These <strong>coefficients</strong> are <strong>use</strong>ful as <strong>in</strong>put data when perform<strong>in</strong>g <strong>room</strong> simulationus<strong>in</strong>g Ray-trac<strong>in</strong>g or Ray-Trac<strong>in</strong>g/Image sources hybrid methods. Previous studies [2,3] hadalready identified the importance <strong>of</strong> tak<strong>in</strong>g such data <strong>in</strong>to account <strong>in</strong> the simulation (besidesabsorption <strong>coefficients</strong>, geometry <strong>and</strong> atmospheric conditions).The method described <strong>in</strong> the referred ISO st<strong>and</strong>ard is similar to the well known method formeasur<strong>in</strong>g absorption <strong>coefficients</strong> <strong>in</strong> the reverberation chamber, as described <strong>in</strong> ISO 354, <strong>in</strong>which two measurements <strong>of</strong> reverberation time must be performed. The difference now is thattwo further measurements are necessary. Both can be performed while a turntable completesone cycle <strong>in</strong> the reverberation chamber, first with no test specimen placed on it, <strong>and</strong> after withthe presence <strong>of</strong> the test specimen. Two ma<strong>in</strong> characteristics <strong>of</strong> the method for measur<strong>in</strong>g<strong>scatter<strong>in</strong>g</strong> <strong>coefficients</strong> are that Impulse Responses are needed (<strong>and</strong> not only decay curves) <strong>and</strong>the test specimen shall have a circular shape. The reason for the latter is to prevent the results
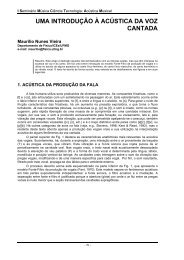
Guimarães - Portugalpaper ID: 061 /p.2from be<strong>in</strong>g affected by <strong>scatter<strong>in</strong>g</strong> ca<strong>use</strong>d by reflection from the edges (<strong>and</strong> not by the roughsurface).The question about the reliability <strong>of</strong> computer simulations is still not completely answered. Inorder to def<strong>in</strong>e more precisely the conditions under which the <strong>acoustic</strong> computer simulationgives reliable results, some works, reported <strong>in</strong> references [2,3,4], were performed <strong>in</strong> the past10 years. These studies dealt with large amount <strong>of</strong> data, us<strong>in</strong>g results obta<strong>in</strong>ed fromsimulation <strong>and</strong> measurements performed by different groups. The present paper describes thecontribution from the team <strong>of</strong> the Institute <strong>of</strong> Technical Acoustics (ITA), Aachen TechnicalUniversity, for the most recent <strong>of</strong> these studies (Round Rob<strong>in</strong> III).In Round Rob<strong>in</strong> III, a studio located at the Physikalisch-Technische Bundesanstalt (PTB),Braunschweig, Germany, was the test subject. The geometry <strong>of</strong> the studio, the atmosphericconditions, the absorption <strong>and</strong> <strong>scatter<strong>in</strong>g</strong> <strong>coefficients</strong> <strong>of</strong> the surfaces were distributed to allparticipants. They calculated several <strong>acoustic</strong> parameters (Reverberation Time, Early DecayTime, Clarity, Def<strong>in</strong>ition, Lateral Fraction <strong>and</strong> Inter Aural Cross Correlation Coefficient) withtheir own simulation programmes. The results were collected <strong>and</strong> compared with each other<strong>and</strong> with measurements performed by different teams. The ITA team participated measur<strong>in</strong>gthe <strong>scatter<strong>in</strong>g</strong> <strong>coefficients</strong> for the ceil<strong>in</strong>g <strong>and</strong> wall diff<strong>use</strong>r (which were later distributed to theparticipants), perform<strong>in</strong>g <strong>acoustic</strong> simulation with its own simulation program (CAESAR,Computer Aided Evaluation Simulation <strong>and</strong> Auralization <strong>of</strong> Rooms, version 0.21,programmed by Oliver Schmitz) <strong>and</strong> perform<strong>in</strong>g measurements <strong>of</strong> the <strong>acoustic</strong> parameters <strong>in</strong>the studio. Next, some <strong>of</strong> these contributions are described, as well as a comparison betweensimulated <strong>and</strong> measured <strong>acoustic</strong> parameters. Some conclusions <strong>and</strong> comments are presented,but one should notice that these are only a partial view <strong>of</strong> the study. A much more completeanalysis is to be published by the coord<strong>in</strong>ator <strong>of</strong> Round Rob<strong>in</strong> III (Dr.Ingolf Bork, atwww.ptb.de/en/org/1/14/1401/_<strong>in</strong>dex.htm).2. MEASUREMENT OF SCATTERING COEFFICIENTSThe measurements were performed at ITA <strong>in</strong> a scale model reverberation chamber with avolume <strong>of</strong> approximately 1 m 3 . S<strong>in</strong>ce this reverberation chamber did not have means tosubstitute the air by another gas, measurements performed only up to 12.5 kHz wereconsidered reliable. The experimental set-up is shown <strong>in</strong> [5].2.1 Measur<strong>in</strong>g samples with a non-circular shapeAs noted <strong>in</strong> the <strong>in</strong>troduction, the method for measur<strong>in</strong>g r<strong>and</strong>om-<strong>in</strong>cidence <strong>scatter<strong>in</strong>g</strong><strong>coefficients</strong>, as described <strong>in</strong> ISO 17497-1, specifies that the samples shall have a circularshape. By the time the samples <strong>of</strong> the ceil<strong>in</strong>g <strong>and</strong> wall diff<strong>use</strong>rs were sent from the PTB to bemeasured at ITA (see Figure 1), this necessity was not clear, nor well understood. Beca<strong>use</strong> <strong>of</strong>that, or for practical reasons, the samples were constructed with a square <strong>and</strong> a rectangularshape (wall <strong>and</strong> ceil<strong>in</strong>g diff<strong>use</strong>r, respectively). The problem <strong>of</strong> measur<strong>in</strong>g samples with a noncircularshape is addressed to <strong>in</strong> [5, 6]. Accord<strong>in</strong>g to these references, one way to m<strong>in</strong>imizethe problem is to “hide” the edges, for <strong>in</strong>stance, mount<strong>in</strong>g the squared sample <strong>in</strong> a square
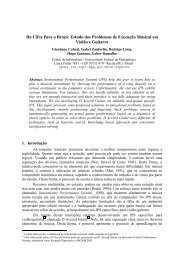
Guimarães - Portugalpaper ID: 061 /p.3recess <strong>of</strong> a base plate. The top plane <strong>of</strong> the sample placed flushes with the base plate. Thiswas the solution found for measur<strong>in</strong>g the samples sent by the PTB.2.2 Results for the ceil<strong>in</strong>g <strong>and</strong> wall diff<strong>use</strong>rs <strong>of</strong> the studio at the PTBThe samples from the wall <strong>and</strong> ceil<strong>in</strong>g diff<strong>use</strong>rs <strong>of</strong> the studio at the PTB are shown <strong>in</strong> Figure1. They were constructed with 1/50 <strong>and</strong> 1/10 scale factors, respectively.Figure 1 – Samples from the wall (left) <strong>and</strong> ceil<strong>in</strong>g diff<strong>use</strong>r (right) <strong>of</strong> the studio at the PTB.Picture at the right taken from www.ptb.de/en/org/1/17/173/roundrob3_2.htm.Studio wallScatter<strong>in</strong>g coefficient10,90,80,70,60,50,40,30,20,1016 20 25 32 40 50 63 80 100 126 160 200 250Frequency (Hz)Figure 2 – Measured r<strong>and</strong>om-<strong>in</strong>cidence <strong>scatter<strong>in</strong>g</strong> <strong>coefficients</strong> <strong>of</strong> the diff<strong>use</strong>r on the wall <strong>of</strong>the studio at the PTB. The results are shown as a function <strong>of</strong> the full-scale frequency.
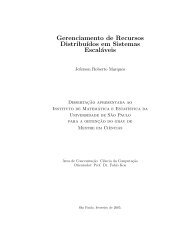
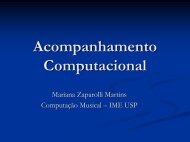
Guimarães - Portugalpaper ID: 061 /p.4Diff<strong>use</strong>r ceil<strong>in</strong>gScatter<strong>in</strong>g coefficient1,11,00,90,80,70,60,50,40,30,20,10,080 100 125 160 200 250 315 400 500 630Frequency (Hz)Figure 3 – Measured r<strong>and</strong>om-<strong>in</strong>cidence <strong>scatter<strong>in</strong>g</strong> <strong>coefficients</strong> <strong>of</strong> the diff<strong>use</strong>r on the ceil<strong>in</strong>g <strong>of</strong>the studio at the PTB. The results are shown as a function <strong>of</strong> the full-scale frequency.Results for <strong>scatter<strong>in</strong>g</strong> <strong>coefficients</strong> measured for these samples as a function <strong>of</strong> the full-scalefrequency are presented <strong>in</strong> Figure 2 <strong>and</strong> Figure 3. Beca<strong>use</strong> <strong>of</strong> the different scale factors <strong>of</strong> thesamples, the results have different frequency ranges when transformed to full-scale frequency.The r<strong>and</strong>om-<strong>in</strong>cidence <strong>scatter<strong>in</strong>g</strong> <strong>coefficients</strong> were obta<strong>in</strong>ed after filter<strong>in</strong>g the impulseresponses <strong>in</strong> 1/3 octave b<strong>and</strong>s. Previous <strong>in</strong>vestigations have shown that the results obta<strong>in</strong>edwhen filter<strong>in</strong>g the impulse responses <strong>in</strong> 1/1 octave b<strong>and</strong>s are approximately the same for thecentral frequencies. For the wall diff<strong>use</strong>r, beca<strong>use</strong> the <strong>scatter<strong>in</strong>g</strong> coefficient measured for thehighest frequency b<strong>and</strong> already shows a high value (0,9), the suggested <strong>scatter<strong>in</strong>g</strong> coefficientfor the subsequent frequency b<strong>and</strong>s is 1 for the computer simulations.Values higher than 1 for the <strong>scatter<strong>in</strong>g</strong> coefficient were measured for the ceil<strong>in</strong>g diff<strong>use</strong>r. Thiserror may be attributed to reflections from the edges that could not be completely hidden, <strong>in</strong>this case, beca<strong>use</strong> <strong>of</strong> an imperfection <strong>of</strong> the <strong>use</strong>d base plate.3. COMPUTER SIMULATION3.1 The test <strong>room</strong> (PTB studio)The test <strong>room</strong> is a studio at the PTB, with a volume <strong>of</strong> approximately 360 m 3 (see Figure 4).The larger wall on the left side <strong>of</strong> the figure (the one with no w<strong>in</strong>dows) has a sound diff<strong>use</strong>rcover<strong>in</strong>g it completely. Another sound diff<strong>use</strong>r covers the elevated area on the ceil<strong>in</strong>g.
Guimarães - Portugalpaper ID: 061 /p.5The sound diff<strong>use</strong>r on the wall also acts as a low-frequency sound absorber, given itsconstruction (large wood-panelled boxes). On the back <strong>and</strong> right side wall (the one with threew<strong>in</strong>dows) there are curta<strong>in</strong>s which may be closed <strong>and</strong> opened, <strong>in</strong> order to create two<strong>acoustic</strong>al situations. The representation <strong>of</strong> the <strong>room</strong> shown <strong>in</strong> Figure 4 does not show thedetails <strong>of</strong> the sound diff<strong>use</strong>rs <strong>and</strong> this is actually the model <strong>use</strong>d <strong>in</strong> the simulations, which didnot consider these details. This fact was compensated, <strong>in</strong> these cases, through the <strong>use</strong> <strong>of</strong> themeasured r<strong>and</strong>om-<strong>in</strong>cidence <strong>scatter<strong>in</strong>g</strong> <strong>coefficients</strong> <strong>of</strong> these diff<strong>use</strong>rs. One importantcharacteristic <strong>of</strong> this studio is that there are no significant areas which provide diffraction <strong>of</strong>the sound, such as seat<strong>in</strong>g areas. Its dimensions, however, can present difficulties for thecomputer simulations at lower frequencies.Figure 4 – Representation <strong>of</strong> the studio at the PTB, <strong>use</strong>d for measurements <strong>and</strong> simulationsfor the third round rob<strong>in</strong> on <strong>room</strong> <strong>acoustic</strong>al computer simulations.3.2 Conditions <strong>of</strong> simulations <strong>and</strong> comparison <strong>of</strong> parameters obta<strong>in</strong>ed throughmeasurements <strong>and</strong> simulationsThe simulations were performed with CAESAR. The geometrical model <strong>use</strong>d <strong>in</strong> thesimulations corresponds to the one shown <strong>in</strong> Figure 4 <strong>and</strong> the <strong>use</strong>d material properties werethose given by the PTB for the second phase Round Rob<strong>in</strong> III. Most <strong>of</strong> the given absorption<strong>coefficients</strong> were taken from a database <strong>of</strong> measured absorption <strong>coefficients</strong>, but some <strong>of</strong>them were estimated by the coord<strong>in</strong>ator <strong>of</strong> the project (seewww.ptb.de/en/org/1/17/173/roundrob3_1.htm). The <strong>scatter<strong>in</strong>g</strong> <strong>coefficients</strong> for all surfaceswere also estimated, except for the elevated area on the ceil<strong>in</strong>g <strong>and</strong> for the left wall <strong>in</strong> Figure4. These were measured as described <strong>in</strong> section 2.In the program it is possible to set the environmental conditions, number <strong>of</strong> rays, order <strong>of</strong>reflections, diameter <strong>of</strong> the receiver cell, time resolution <strong>of</strong> the echogram, length <strong>of</strong> theechogram <strong>and</strong> directional characteristics <strong>of</strong> source <strong>and</strong> receiver. The directionalcharacteristics were left to be omni-directional <strong>and</strong> the other parameters were set as presented<strong>in</strong> Table 1.
Guimarães - Portugalpaper ID: 061 /p.6Table 1 – Sett<strong>in</strong>gs <strong>of</strong> parameters for the computer simulations <strong>of</strong> the <strong>room</strong> at the PTB.ParameterSett<strong>in</strong>gSpeed <strong>of</strong> sound (m/s) 343Relative air humidity (%) 50Number <strong>of</strong> rays 10000Order <strong>of</strong> reflectionsDiameter <strong>of</strong> the receiver (m) 0,5Time resolution (1/s) 500Length <strong>of</strong> the echogram (s) 1AutomaticThe simulations were performed for the two source <strong>and</strong> three receiver positions, as predeterm<strong>in</strong>edby the coord<strong>in</strong>ator <strong>of</strong> the project, for the curta<strong>in</strong>s opened <strong>and</strong> closed. With theequipment <strong>use</strong>d, a PC Pentium III, 650 MHz, 128 RAM, they lasted approximately fiftym<strong>in</strong>utes for each source position.4. COMPARISON WITH MEASURED RESULTS<strong>Measurement</strong>s <strong>of</strong> <strong>acoustic</strong> parameters were performed by the ITA team led by Dr.GottfriedBehler. These were performed us<strong>in</strong>g the loudspeaker system described <strong>in</strong> [7]. The resultsobta<strong>in</strong>ed from simulations were compared to the measurements <strong>of</strong> EDT, T30, C80, D50 <strong>and</strong>LF, for a certa<strong>in</strong> source <strong>and</strong> receiver comb<strong>in</strong>ation. Figure 5 presents results for T30 as afunction <strong>of</strong> frequency. Although many comb<strong>in</strong>ations <strong>of</strong> source a receiver positions weretaken, the results plotted <strong>in</strong> Figure 5 are typical.In the figure, the error bars do not <strong>in</strong>dicate the measurement uncerta<strong>in</strong>ties, but the subjectivelimens (or noticeable difference) for the <strong>room</strong> <strong>acoustic</strong>al parameter <strong>in</strong> question. So, eventhough calculated values do not fall with<strong>in</strong> the <strong>in</strong>terval <strong>in</strong>dicated by the error bar, the resultstill may be considered to be reasonable. Noticeable is the fact that large deviations almostalways occur at the frequency b<strong>and</strong> <strong>of</strong> 125 Hz, a tendency which is also observed for thefrequency b<strong>and</strong> <strong>of</strong> 250 Hz. For frequencies equal or larger than 1000 Hz, the differencesbetween measured <strong>and</strong> calculated values are smaller <strong>and</strong> the values fall <strong>of</strong>ten with<strong>in</strong> the<strong>in</strong>terval <strong>in</strong>dicat<strong>in</strong>g the subjective limens (error bars). The differences at lower frequencies canbe expla<strong>in</strong>ed by the fact that the uncerta<strong>in</strong>ties <strong>in</strong> the measurements are larger <strong>in</strong> thesefrequencies. Also, specially for <strong>room</strong>s <strong>of</strong> this size, the geometrical <strong>acoustic</strong>s theory, which isthe basis for the ray-trac<strong>in</strong>g <strong>and</strong> image-source methods, is not able to represent the physicalphenomena.
Guimarães - Portugalpaper ID: 061 /p.7S2R2 - Curta<strong>in</strong>s closed10,90,80,70,6T30 (s)0,50,40,30,20,10T30 - calculatedT30 - measured125 250 500 1000 2000 4000Frequency (Hz)Figure 5 – Reverberation Time measured <strong>and</strong> simulated at position S2R2, with curta<strong>in</strong>sclosed. The error bars <strong>in</strong>dicate the <strong>room</strong> <strong>acoustic</strong>al subjective limens for this parameter.T30 - curta<strong>in</strong>s closed - 1000 Hz0,90,850,80,75T30 (s)0,70,650,60,550,5MeasuredCalculatedS1R1 S1R2 S1R3 S2R1 S2R2 S2R3Source-receiver comb<strong>in</strong>ationFigure 6 – Reverberation time (T30), measured <strong>and</strong> calculated for all source-positioncomb<strong>in</strong>ations at 1000 Hz, with the curta<strong>in</strong>s closed. The error bars <strong>in</strong>dicate the <strong>room</strong><strong>acoustic</strong>al subjective limens for this parameter.
Guimarães - Portugalpaper ID: 061 /p.8Figure 6 presents the parameters T30 at 1000 Hz, for all source-position comb<strong>in</strong>ations. If oneobserves the spatial distribution <strong>of</strong> the results, measured <strong>and</strong> calculated parameters comparevery well. A tendency <strong>of</strong> the differences between measured <strong>and</strong> calculated parameters to besmaller for the situation when the curta<strong>in</strong>s are closed was also noticeable. No directexplanation, however, can be given for this fact.From the case studied <strong>in</strong> this paper, one can have an idea about the ability <strong>of</strong> a computerprogram to give coherent results with measured <strong>room</strong> <strong>acoustic</strong>al parameters. Weaknesses <strong>of</strong>the measurement technique <strong>and</strong> <strong>of</strong> the geometrical <strong>acoustic</strong>s theory can be observed <strong>in</strong> thelower frequency b<strong>and</strong>s. At higher frequencies, the agreement between measured <strong>and</strong>calculated results can be considered very good. This good agreement show that thesimulations can be effective, provided the <strong>in</strong>put data regard<strong>in</strong>g the <strong>acoustic</strong>al characteristics <strong>of</strong>the surface materials (absorption <strong>and</strong> <strong>scatter<strong>in</strong>g</strong> <strong>coefficients</strong>) are properly given (measured).ACKNOWLEDGEMENTSThe <strong>in</strong>stitutions DAAD (Germany), CAPES, CNPq <strong>and</strong> FAPESP (Brazil) are acknowledgedfor support<strong>in</strong>g the work presented here.REFERENCES[1] M. Vorländer, E. Mommertz; Def<strong>in</strong>ition <strong>and</strong> <strong>Measurement</strong> <strong>of</strong> R<strong>and</strong>om-<strong>in</strong>cidenceScatter<strong>in</strong>g Coefficients. Applied Acoustics, 60(2), p.187-199, 2000.[2] M. Vorländer; International Round Rob<strong>in</strong> on <strong>room</strong> <strong>acoustic</strong>s computer simulations. In15 th International Congress on Acoustics, Trondheim, Norway, p.577-580, 1995.[3] I. Bork; A Comparison <strong>of</strong> Room Simulation S<strong>of</strong>tware - The 2nd Round Rob<strong>in</strong> on RoomAcoustical Computer Simulation. ACUSTICA united with ACTA ACUSTICA, v.86, No6, p.943-956, 2000.[4] I. Bork; Simulation <strong>and</strong> <strong>Measurement</strong> <strong>of</strong> Auditorium Acoustics – The Round Rob<strong>in</strong>s onRoom Acoustical Simulation. In Proceed<strong>in</strong>gs <strong>of</strong> the Institute <strong>of</strong> <strong>acoustic</strong>s, London, 2003.[5] M. Vorländer, J.J. Embrechts, L. De Geetere, G. Vermeir, M.H.A. Gomes; Case studies<strong>in</strong> measurement <strong>of</strong> r<strong>and</strong>om <strong>in</strong>cidence <strong>scatter<strong>in</strong>g</strong> <strong>coefficients</strong>. To be published <strong>in</strong>ACUSTICA united with ACTA ACUSTICA.[6] M.H.A. Gomes, M. Vorländer, S.N.Y. Gerges; Aspects <strong>of</strong> the sample geometry <strong>in</strong> themeasurement <strong>of</strong> the r<strong>and</strong>om-<strong>in</strong>cidence <strong>scatter<strong>in</strong>g</strong> coefficient. In Proceed<strong>in</strong>gs <strong>of</strong> ForumAcusticum Sevilla, 2002.[7] G. Behler, S. Müller; Technique for the Derivation <strong>of</strong> Wide B<strong>and</strong> Room ImpulseResponse. In 2 nd meet<strong>in</strong>g <strong>of</strong> the Ibero-American Federation <strong>of</strong> Acoustics (FIA), Madrid,Spa<strong>in</strong>, 2000.