Comparative study of measured acoustic parameters in concert halls ...
Comparative study of measured acoustic parameters in concert halls ...
Comparative study of measured acoustic parameters in concert halls ...

You also want an ePaper? Increase the reach of your titles
YUMPU automatically turns print PDFs into web optimized ePapers that Google loves.
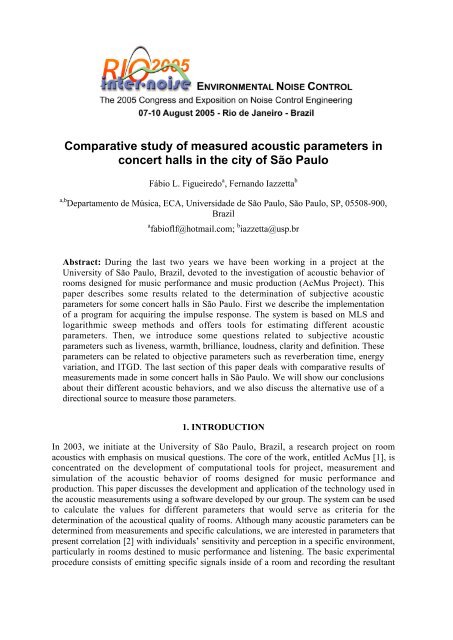
<strong>Comparative</strong> <strong>study</strong> <strong>of</strong> <strong>measured</strong> <strong>acoustic</strong> <strong>parameters</strong> <strong>in</strong><br />
<strong>concert</strong> <strong>halls</strong> <strong>in</strong> the city <strong>of</strong> São Paulo<br />
Fábio L. Figueiredo a , Fernando Iazzetta b<br />
a,b Departamento de Música, ECA, Universidade de São Paulo, São Paulo, SP, 05508-900,<br />
Brazil<br />
a fabi<strong>of</strong>lf@hotmail.com; b iazzetta@usp.br<br />
Abstract: Dur<strong>in</strong>g the last two years we have been work<strong>in</strong>g <strong>in</strong> a project at the<br />
University <strong>of</strong> São Paulo, Brazil, devoted to the <strong>in</strong>vestigation <strong>of</strong> <strong>acoustic</strong> behavior <strong>of</strong><br />
rooms designed for music performance and music production (AcMus Project). This<br />
paper describes some results related to the determ<strong>in</strong>ation <strong>of</strong> subjective <strong>acoustic</strong><br />
<strong>parameters</strong> for some <strong>concert</strong> <strong>halls</strong> <strong>in</strong> São Paulo. First we describe the implementation<br />
<strong>of</strong> a program for acquir<strong>in</strong>g the impulse response. The system is based on MLS and<br />
logarithmic sweep methods and <strong>of</strong>fers tools for estimat<strong>in</strong>g different <strong>acoustic</strong><br />
<strong>parameters</strong>. Then, we <strong>in</strong>troduce some questions related to subjective <strong>acoustic</strong><br />
<strong>parameters</strong> such as liveness, warmth, brilliance, loudness, clarity and def<strong>in</strong>ition. These<br />
<strong>parameters</strong> can be related to objective <strong>parameters</strong> such as reverberation time, energy<br />
variation, and ITGD. The last section <strong>of</strong> this paper deals with comparative results <strong>of</strong><br />
measurements made <strong>in</strong> some <strong>concert</strong> <strong>halls</strong> <strong>in</strong> São Paulo. We will show our conclusions<br />
about their different <strong>acoustic</strong> behaviors, and we also discuss the alternative use <strong>of</strong> a<br />
directional source to measure those <strong>parameters</strong>.<br />
1. INTRODUCTION<br />
In 2003, we <strong>in</strong>itiate at the University <strong>of</strong> São Paulo, Brazil, a research project on room<br />
<strong>acoustic</strong>s with emphasis on musical questions. The core <strong>of</strong> the work, entitled AcMus [1], is<br />
concentrated on the development <strong>of</strong> computational tools for project, measurement and<br />
simulation <strong>of</strong> the <strong>acoustic</strong> behavior <strong>of</strong> rooms designed for music performance and<br />
production. This paper discusses the development and application <strong>of</strong> the technology used <strong>in</strong><br />
the <strong>acoustic</strong> measurements us<strong>in</strong>g a s<strong>of</strong>tware developed by our group. The system can be used<br />
to calculate the values for different <strong>parameters</strong> that would serve as criteria for the<br />
determ<strong>in</strong>ation <strong>of</strong> the <strong>acoustic</strong>al quality <strong>of</strong> rooms. Although many <strong>acoustic</strong> <strong>parameters</strong> can be<br />
determ<strong>in</strong>ed from measurements and specific calculations, we are <strong>in</strong>terested <strong>in</strong> <strong>parameters</strong> that<br />
present correlation [2] with <strong>in</strong>dividuals’ sensitivity and perception <strong>in</strong> a specific environment,<br />
particularly <strong>in</strong> rooms dest<strong>in</strong>ed to music performance and listen<strong>in</strong>g. The basic experimental<br />
procedure consists <strong>of</strong> emitt<strong>in</strong>g specific signals <strong>in</strong>side <strong>of</strong> a room and record<strong>in</strong>g the resultant
signals at different po<strong>in</strong>ts.<br />
To obta<strong>in</strong> the impulse response <strong>of</strong> the room the recorded signal is mathematically compared<br />
with the generated signal. Then, we extract the necessary <strong>acoustic</strong> <strong>parameters</strong> from a series <strong>of</strong><br />
computational process<strong>in</strong>g. We have made measurements <strong>in</strong> different <strong>concert</strong> <strong>halls</strong> <strong>in</strong> São<br />
Paulo that carry regular performances <strong>of</strong> chamber and symphonic ensembles and compared<br />
the results. For the same positions where the measurements have been done, we have also<br />
recorded anechoic samples <strong>of</strong> music for future subjective evaluations. S<strong>in</strong>ce our analysis<br />
aims at <strong>in</strong>vestigat<strong>in</strong>g rooms projected for musical performance, we have decided to take <strong>in</strong>to<br />
consideration the fact <strong>of</strong> that musical <strong>in</strong>struments project the sound <strong>in</strong> a directional way. For<br />
this reason the measurements were carried out with the use <strong>of</strong> a directional source to<br />
stimulate the room. Although the directivity <strong>of</strong> the source is not properly the same one could<br />
observe <strong>in</strong> a real <strong>in</strong>strument or <strong>in</strong> a <strong>in</strong>strumental ensemble, we had the chance <strong>in</strong>vestigate<br />
how much this option have <strong>in</strong>tervened with the results <strong>in</strong> comparison with the use <strong>of</strong> a<br />
omnidirecional source as <strong>in</strong>dicated <strong>in</strong> the ISO 3382 [3]. For this purpose, we have compared<br />
the results we have obta<strong>in</strong>ed with the results <strong>of</strong> other measurements achieved by us<strong>in</strong>g<br />
om<strong>in</strong>idirectional sources as extensively published <strong>in</strong> a recent work [4].<br />
2. CHARACTERIZATION OF ACOUSTIC PARAMETERS<br />
We call <strong>acoustic</strong> subjective <strong>parameters</strong> the values established accord<strong>in</strong>g to the<br />
psycho<strong>acoustic</strong> sensitivity <strong>of</strong> listeners. Such <strong>parameters</strong> play a dist<strong>in</strong>ctive role <strong>in</strong> the artistic<br />
quality <strong>of</strong> a musical event. Each <strong>of</strong> them is related the specific physical phenomena that<br />
provoke the <strong>acoustic</strong> impressions that def<strong>in</strong>e the characteristics <strong>of</strong> a music room. The most<br />
important <strong>parameters</strong> are represented by mathematical expressions that generate objective<br />
values. They represent measurable physical values, as shown <strong>in</strong> Table 1, and can be def<strong>in</strong>ed<br />
as follow:<br />
€<br />
• RT 60 is the Reverberation Time. RT 125<br />
, RT<br />
250<br />
, RT<br />
500<br />
are the reverberation time for<br />
the frequency bands <strong>of</strong> 125Hz, 250Hz 500HZ and so on. Another parameter related to<br />
the reverberation is the Early Decay Time (EDT).<br />
• BR is the bass ratio and TR the treble ratio.<br />
€<br />
• t d<br />
is the <strong>in</strong>stant that direct sound arrives at the record<strong>in</strong>g device and t<br />
r<br />
is the <strong>in</strong>stant<br />
at which the first reflection arrives. The difference between these two moments is the<br />
Initial Time Delay Gap (ITDG).<br />
• Ed and Er are the total energy <strong>of</strong> direct and reverberant sound, respectively.<br />
• p(t) is the <strong>in</strong>stantaneous value <strong>of</strong> the <strong>acoustic</strong> pressure. The physical expression<br />
Clarity (C 80 ) is the logarithmic ratio between the energy that arrives <strong>in</strong> first the 80<br />
milliseconds and the rema<strong>in</strong><strong>in</strong>g energy. This ratio can also be taken for first the 50<br />
milliseconds (C 50 ). The expression for Def<strong>in</strong>ition (D 50 ) is the l<strong>in</strong>ear ratio between the<br />
energy that arrives <strong>in</strong> first the 50 milliseconds and the total energy. This ratio can also<br />
be taken for the first the 80 milliseconds (D 80 ).<br />
• Interaural Cross Correlation (IACC) is the maximum value <strong>of</strong> the coefficient <strong>of</strong><br />
correlation between the signals at left and right ears. Lateral Fraction (LF) is the ratio<br />
between the energy captured <strong>in</strong> a lateral plane and the omnidirecional energy at the<br />
same po<strong>in</strong>t.
Table 1: Acoustic Parameters<br />
Subjective Parameter Objective Index Physical Expression<br />
Liveness RT 60 Schroeder (1965)<br />
Warmth<br />
Brilliance<br />
BR<br />
TR<br />
€<br />
RT 125<br />
+ RT 250<br />
RT 500<br />
+ RT 1000<br />
RT + RT<br />
RT<br />
2000<br />
500<br />
+ RT<br />
Ratio D/R RDR 10 log [ Ed / Er ]<br />
Intimacy<br />
Clarity<br />
Def<strong>in</strong>ition<br />
Spatial Impression<br />
ITDG<br />
C80<br />
D50 €<br />
IACC<br />
LF<br />
max<br />
⎡<br />
⎢<br />
€<br />
10log<br />
⎢<br />
⎢<br />
⎢<br />
⎣<br />
80ms<br />
∫<br />
0<br />
t f<br />
∫<br />
4000<br />
1000<br />
t d<br />
− t r<br />
⎤<br />
p 2 (t)dt⎥<br />
⎥<br />
⎥<br />
p 2 (t)dt⎥<br />
⎦<br />
80ms<br />
50ms<br />
∫<br />
0<br />
t<br />
f<br />
∫<br />
0<br />
2<br />
p ( t)<br />
dt<br />
2<br />
p ( t)<br />
dt<br />
−<br />
2<br />
2<br />
[ p ( t)<br />
p ( t + ) dt][ ⋅ p ( t)<br />
dt p ( t)<br />
dt] 1/ 2<br />
e d<br />
α<br />
e<br />
d<br />
∫<br />
80ms<br />
2<br />
∫ plat<br />
5ms<br />
80ms<br />
2<br />
∫ pomni<br />
0<br />
∫<br />
( t)<br />
dt<br />
( t)<br />
dt<br />
∫<br />
3. THEORY AND PROCEDURES FOR OBTAINING ACOUSTICAL PARAMETERS<br />
In terms <strong>of</strong> <strong>acoustic</strong>s, a room designed for musical purposes can be seen as a l<strong>in</strong>ear system.<br />
One <strong>of</strong> the ma<strong>in</strong> characteristics <strong>of</strong> a l<strong>in</strong>ear system is its impulse response (IR), that is, the<br />
reaction <strong>of</strong> the system to an impulsive signal. The IR can be understood as the "<strong>acoustic</strong>al<br />
signature " <strong>of</strong> a room, and all the <strong>acoustic</strong> <strong>parameters</strong> can be extracted from it. The Fourier<br />
Transform <strong>of</strong> the IR h (t) is the frequency response H (w), also called Transfer Function.<br />
From the signal theory we know that the output y (t) <strong>of</strong> the l<strong>in</strong>ear time <strong>in</strong>variant system is the<br />
convolution between the <strong>in</strong>put x (t) with the impulse response h (t). In the frequency doma<strong>in</strong><br />
it is equivalent to the multiplication <strong>of</strong> both X (w) and H (w) transfer functions:<br />
Y(w) = X(x) . H(w) (1)<br />
3.1 Obta<strong>in</strong><strong>in</strong>g the IR<br />
The literature <strong>in</strong>dicates two ways for obta<strong>in</strong><strong>in</strong>g the IR. The first one is known as MLS
(Maximum Length Sequences) a periodic sequence <strong>of</strong> unitary pulses (positive and negative)<br />
systematically constructed to satisfy some mathematical properties [5]. Although its<br />
determ<strong>in</strong>istic characteristics, the MLS signal sounds as a white noise, be<strong>in</strong>g classified a<br />
pseudo-random signal.<br />
Figure 1: representation <strong>of</strong> a MLS sequence<br />
Accord<strong>in</strong>g to the signal theory, we can say that the cross-correlation between the <strong>in</strong>put x (t)<br />
and the output y (t) is related to the auto-correlation <strong>of</strong> the <strong>in</strong>put by a convolution with the<br />
impulse response:<br />
∞<br />
Rxy<br />
( t)<br />
= ∫ h(<br />
τ ) Rxx<br />
( τ + t)<br />
dτ<br />
= h(<br />
t)<br />
∗ Rxx<br />
( t)<br />
(2)<br />
0<br />
The MLS presents two important properties: its Fourier Transform has the same magnitude<br />
for all frequency components, so its auto-correlation function is a Dirac delta function.<br />
R xx<br />
(t) = δ(t)<br />
(3)<br />
€<br />
Figure 2: auto-correlation <strong>of</strong> a MLS sequence<br />
The graphic at Fig. 3 was obta<strong>in</strong>ed <strong>in</strong> program implemented <strong>in</strong> MatLab by our colleagues <strong>in</strong><br />
the AcMus Project. The result <strong>of</strong> convolv<strong>in</strong>g h (t) with a Dirac delta function is the impulse<br />
response h (t) itself. Thus, the impulse response can be found by cross-correlat<strong>in</strong>g the MLS<br />
<strong>in</strong>put x (t) with the registered output y (t):<br />
R xy<br />
(t) =<br />
∞<br />
∫ h(τ)δ(τ + t)dτ = h(t) (4)<br />
0<br />
This calculation is made by us<strong>in</strong>g the Fast Hadamard Transform, that optimizes the<br />
process<strong>in</strong>g <strong>of</strong> the matrices generated by cross-correlation [6].<br />
€<br />
Another way <strong>of</strong> obta<strong>in</strong><strong>in</strong>g the IR is by us<strong>in</strong>g s<strong>in</strong>e sweeps [7]. The s<strong>in</strong>e sweeps are s<strong>in</strong>usoids<br />
that have their <strong>in</strong>stantaneous frequency vary<strong>in</strong>g <strong>in</strong> the time. Sweeps can be l<strong>in</strong>ear or<br />
logarithmic. In our case, we use a logarithmic sweep that exhibits a p<strong>in</strong>k spectrum, that is, its<br />
amplitude decays at a rate <strong>of</strong> 3dB/octave. It means that the signal has the same energy per<br />
octave. The frequency values double <strong>in</strong> time <strong>in</strong> a fixed rate.
⎛<br />
log f ⎞<br />
⎜ 2 ⎟<br />
⎝ f1 ⎠<br />
= cte<br />
T 2<br />
− T 1<br />
(5)<br />
€<br />
Figure 3: Representation <strong>of</strong> a log sweep <strong>in</strong> time (left) and a real spectrogram <strong>of</strong> a log sweep (right)<br />
Be N the number <strong>of</strong> samples, the multiply<strong>in</strong>g factor is given as follow:<br />
Mulϕ = 2<br />
( )<br />
N<br />
(6)<br />
log 2 f f<strong>in</strong>al −f <strong>in</strong>icial<br />
To obta<strong>in</strong> the IR one should apply the IR as follow:<br />
€<br />
Y (w) = X (w). [G (w). L (w)] (7)<br />
In the equation above, Y (w) is the transfer function <strong>of</strong> the signal recorded <strong>in</strong> the room, X (w)<br />
is the transfer function <strong>of</strong> the emitted signal (log sweep), G (w) and L (w) are the transfer<br />
functions <strong>of</strong> the room and the loudspeaker respectively. The sweep technique shows the<br />
advantage <strong>of</strong> elim<strong>in</strong>at<strong>in</strong>g the <strong>in</strong>fluence <strong>of</strong> the loudspeaker (L) <strong>in</strong> the response <strong>of</strong> the room<br />
(G), which is atta<strong>in</strong>ed by means <strong>of</strong> a simple operation <strong>of</strong> division <strong>in</strong> the frequency doma<strong>in</strong><br />
(deconvolution):<br />
Y ( w)<br />
G ( w)<br />
=<br />
X ( w).<br />
L(<br />
w)<br />
(8)<br />
The deconvolv<strong>in</strong>g function was implemented <strong>in</strong> MatLab as follow:<br />
function ir = dechirp(rec,B,A,n)<br />
load ir_loudspeaker<br />
ir = real(ifft(fft(rec(:,1),n)./fft(rec(:,2),n)./fft(ir_loudspeaker)));<br />
ir = filter(B,A,ir);<br />
where ‘rec 1’ and ‘rec 2’ are the recorded and emitted signals respectively. The<br />
‘ir_loudspeaker’ is the IR for the loudspeaker obta<strong>in</strong>ed from the process<strong>in</strong>g <strong>of</strong><br />
measurements done <strong>in</strong> free field. The ‘filter’ function [6] generates octave band filters<br />
accord<strong>in</strong>g to the IEC 1260.<br />
3.2 Process<strong>in</strong>g the IR<br />
The energy decay curve is obta<strong>in</strong>ed from the room’s IR by us<strong>in</strong>g Schroeder Integration
method [3]:<br />
where ‘p’ is the IR.<br />
∞<br />
E(t) = ∫ p 2 (τ)dτ = ∫ p 2 (τ)dτ − ∫ p 2 (τ)dτ<br />
t<br />
∞<br />
0<br />
t<br />
0<br />
(9)<br />
By process<strong>in</strong>g this <strong>in</strong>tegral, one can calculate all the <strong>parameters</strong> shown on Table 1. In the<br />
graphics below € we show some examples <strong>of</strong> this process<strong>in</strong>g <strong>in</strong> MatLab, for some<br />
measurements made <strong>in</strong> music <strong>halls</strong> <strong>in</strong> São Paulo. The yellow po<strong>in</strong>t <strong>in</strong> the graphic shows the<br />
truncation po<strong>in</strong>t obta<strong>in</strong>ed by Lundeby’s method [6].<br />
Figure 4: Schroeder Integration (left) and respective dB decay curve (right)<br />
4. MEASUREMENTS<br />
4.1 Measurement setup<br />
Fig 6 shows the signal’s flowchart dur<strong>in</strong>g the measurements.<br />
Figure 5: measurement scheme<br />
For the measurements we have used a PC laptop computer, an Edirol FA-101 digital audio<br />
<strong>in</strong>terface, Behr<strong>in</strong>ger ECM 8000 and Neumann U-87 microphones, and Electro-Voice EV<br />
Sx200a active loudspeakers. The audio <strong>in</strong>terface is connected to the computer by a firewire<br />
connection. The signal is sent through one <strong>of</strong> the <strong>in</strong>terface’s output channels to the<br />
loudspeaker. Another channel sends the signal back to one <strong>of</strong> the <strong>in</strong>terface’s <strong>in</strong>put. This<br />
signal is taken as a reference to sync the signal that is recorded by the microphones. An<br />
example <strong>of</strong> acquired and emitted signals is shown bellow:
Figure 6: log sweep (left) and MLS (right), orig<strong>in</strong>al signal (bottom) and registered room signal (top)<br />
After record<strong>in</strong>g the signals we apply a cross-correlation (MLS) or deconvolution (log sweep)<br />
between the registered and orig<strong>in</strong>al signals to obta<strong>in</strong> the IR. Then we process the Schroeder’s<br />
<strong>in</strong>tegral to extract the <strong>acoustic</strong> <strong>parameters</strong> us<strong>in</strong>g functions created <strong>in</strong> MatLab [6].<br />
4.2 Results and Conclusions<br />
We have carried out measurements <strong>in</strong> some <strong>of</strong> <strong>halls</strong> <strong>of</strong> the city <strong>of</strong> São Paulo. Here we are<br />
go<strong>in</strong>g to analyze three <strong>of</strong> them: the Teatro Municipal de São Paulo, which hosts the Orquestra<br />
S<strong>in</strong>fônica Municipal, the Teatro São Pedro, former headquarters <strong>of</strong> the Orquestra S<strong>in</strong>fônica<br />
Estadual, and the Anfiteatro Camargo Guarnieri, which hosts the Orquestra S<strong>in</strong>fônica da<br />
USP. All the measurements were made without audience. Some <strong>of</strong> the prelim<strong>in</strong>ary results are<br />
shown below:<br />
Figure 7: lateral ma<strong>in</strong> floor IR Municipal<br />
Figure 8: central ma<strong>in</strong> floor IR Municipal<br />
Figure 9: balcony IR São Pedro<br />
Figure 10: stage IR Guarnieri<br />
We have made many measurements for each position, and calculated both the <strong>parameters</strong> for<br />
the average IR and the average <strong>of</strong> these <strong>parameters</strong> for every IR (Fig. 18). The results for all<br />
the <strong>parameters</strong> are close enough with a maximum standard deviation <strong>of</strong> 4.2% above 125 Hz.
The log sweep and MLS techniques have presented very similar IR and practically the same<br />
values for the calculated <strong>parameters</strong> (Fig. 12).<br />
In comparison with the results gotten from similar rooms, one can observe that the use <strong>of</strong> the<br />
directional source produces differences for some <strong>parameters</strong>, specially for the Clarity, a<br />
problem already detected <strong>in</strong> the measurements <strong>of</strong> lecture <strong>halls</strong> [8]. For the low (diffuse)<br />
frequencies, the loudspeakers behave almost as an omnidirectional source, but as the<br />
frequency <strong>in</strong>creases they become more directional. This can expla<strong>in</strong> the relative high values<br />
<strong>of</strong> Clarity <strong>in</strong> the high frequencies (specular), s<strong>in</strong>ce <strong>in</strong> this frequency band the room as a<br />
whole is less excited than when it is exposed to the diffusion <strong>of</strong> an omnidirecional source.<br />
Thus, one can expect that <strong>in</strong> this case the microphone captures less reverberant energy <strong>in</strong> the<br />
high frequencies. The values <strong>of</strong> RT 60 had presented less sensitivity to the directivity <strong>of</strong> the<br />
source.<br />
Figure 11: IR Guarnieri detail (first 100 ms) Figure 12: compar<strong>in</strong>g MLS with sweep<br />
dB<br />
14,000<br />
12,000<br />
10,000<br />
8,000<br />
6,000<br />
4,000<br />
2,000<br />
0,000<br />
-2,000<br />
-4,000<br />
-6,000<br />
-8,000<br />
C 80 - center<br />
Guarnieri<br />
São Pedro<br />
Municipal<br />
125 250 500 1000 2000 4000<br />
Hz<br />
Figure 13: ma<strong>in</strong> floor RT60 Figure 14: ma<strong>in</strong> floor C 80
C 80 - rear<br />
Guarnieri<br />
São Pedro<br />
dB<br />
14<br />
12<br />
10<br />
8<br />
6<br />
4<br />
2<br />
0<br />
-2<br />
-4<br />
Municipal<br />
125 250 500 1000 2000 4000<br />
Hz<br />
Figure 15: rear audience RT 60 Figure 16: rear audience C 80<br />
C80 Guarnieri ma<strong>in</strong> floor<br />
10<br />
mean IR<br />
<strong>parameters</strong><br />
IRs <strong>parameters</strong><br />
average<br />
8<br />
dB<br />
6<br />
4<br />
2<br />
0<br />
125 250 500 1000 2000 4000<br />
Hz<br />
Figure 17: bass ratios and treble ratios<br />
Figure 18: compar<strong>in</strong>g statistics ways<br />
We have noticed that the patterns <strong>of</strong> the IRs have changed considerably for the different<br />
positions <strong>of</strong> measurement. Generally we have got short and dry IRs for stage measurements<br />
(<strong>in</strong> part because <strong>of</strong> the directivity <strong>of</strong> the source) when compared with the measurements made<br />
<strong>in</strong> the center <strong>of</strong> the audience, partly due to the higher amount <strong>of</strong> reflection. It was observed –<br />
and it is a desirable characteristic <strong>in</strong> the work <strong>of</strong> the conductor – that the values <strong>of</strong> Clarity and<br />
def<strong>in</strong>ition <strong>in</strong> the stage are bigger than those for the rest <strong>of</strong> the theater. The ITDG values, as<br />
one should expect, are lower <strong>in</strong> the stage (average <strong>of</strong> 4 ms) than <strong>in</strong> the audience (average <strong>of</strong><br />
13 ms). The measurements <strong>in</strong> the back <strong>of</strong> the audience, the IRs <strong>in</strong>dicate a higher diffusion<br />
and lower values for the direct/reverberant energy ratio. We could also notice dist<strong>in</strong>ct timber<br />
colorations, but we will return to that later <strong>in</strong> this text. As we changed the measurement<br />
positions we could clearly perceive a “natural equalization” <strong>of</strong> the sounds, both <strong>in</strong> the<br />
calculated <strong>parameters</strong> and <strong>in</strong> the listen<strong>in</strong>g <strong>of</strong> the anechoic samples.<br />
The architectural characteristic <strong>of</strong> the theaters can help to understand the graphs above. The<br />
Teatro Municipal holds 1500 people <strong>in</strong> a Italian shaped audience, has a significant part <strong>of</strong> the<br />
floor covered by carpets, and <strong>of</strong>fers 4 floors for the audience, hav<strong>in</strong>g therefore a much higher<br />
ceil<strong>in</strong>g than the others. The Teatro São Pedro, as well as the Anfiteatro Camargo Guarnieri,<br />
holds about 700 people and both <strong>of</strong> them are also used for dramatic arts. The São Pedro has a<br />
shell shaped audience while de Guarnieri is basically rectangular. The superficies are<br />
significantly different: predom<strong>in</strong>antly masonry <strong>in</strong> the São Pedro, and wood <strong>in</strong> the Camargo
Guarnieri. Consequently, both the Teatro Municipal and The Teatro São Pedro presented a<br />
higher reverberation time for the lower frequencies <strong>in</strong> the audience (Figs. 13 and 17) – and<br />
consequently less Clarity (Fig. 14) – than the Anfiteatro Camargo Guarnieri (<strong>in</strong> which the<br />
wooden walls help <strong>in</strong> the sound diffusion). For higher frequencies the values <strong>of</strong> RT60 tend to<br />
converge (Figs. 13 and 15), as if the rooms played a less important role <strong>in</strong> the <strong>acoustic</strong><br />
behavior <strong>of</strong> the sounds (aga<strong>in</strong>, probably due to directivity <strong>of</strong> the source for higher<br />
frequencies). The large carpet surfaces <strong>in</strong> the Teatro Municipal collaborate <strong>in</strong> the reduction <strong>of</strong><br />
the brightness (Fig. 17) and <strong>in</strong> the descend<strong>in</strong>g curve <strong>of</strong> reverberation (Figs. 13 and 15). In<br />
terms <strong>of</strong> frequency ratios, the Camargo Guarnieri showed to be more balanced (Fig. 17). Also<br />
we can observe an <strong>in</strong>terest<strong>in</strong>g fact when we compare the values <strong>of</strong> Clarity <strong>in</strong> the center and<br />
the back <strong>of</strong> the <strong>halls</strong>. In the center, the Camargo Guarnieri presents greater Clarity for the<br />
majority <strong>of</strong> the frequencies (Fig. 14), but <strong>in</strong> back it shows lower values <strong>of</strong> Clarity for all<br />
frequency ranges (Fig. 16). It is not by chance: the <strong>measured</strong> back seats <strong>of</strong> the Teatro<br />
Municipal and the Teatro São Pedro are balconies, while <strong>in</strong> the Camargo Guarnieri, which<br />
does not have balconies, the back seats are part <strong>of</strong> the ma<strong>in</strong> floor. As Beranek observes [4],<br />
depend<strong>in</strong>g on the height and the depth <strong>of</strong> the balcony, it can act as a barrier, specially for the<br />
reflections com<strong>in</strong>g from above, and <strong>in</strong> this case it can generat<strong>in</strong>g higher values <strong>of</strong> Clarity.<br />
The values <strong>of</strong> RT60 <strong>of</strong> the Teatro Municipal, as well as its architectural design, would<br />
characterize it more as an Opera House than a symphonic Concert Hall. By analyz<strong>in</strong>g the<br />
values <strong>measured</strong> for the Anfiteatro Camargo Guarnieri and the Teatro São Pedro, specially if<br />
we consider their size and <strong>acoustic</strong> treatment, we can conclude that they present a series <strong>of</strong><br />
<strong>acoustic</strong> characteristics that are far from <strong>in</strong>ternational standards for Concert <strong>halls</strong>, specially if<br />
we compare with values obta<strong>in</strong>ed from the measurements done on acknowledge great <strong>concert</strong><br />
<strong>halls</strong>.<br />
5. ACKNOWLEDGEMENTS<br />
This research is f<strong>in</strong>ancially supported by Fapesp, the São Paulo State Research Agency, proc.<br />
# 02/02678-0. The AcMus project is also supported by Roland do Brazil. We would like to<br />
thank the adm<strong>in</strong>istration <strong>of</strong> Teatro Municipal de São Paulo, Teatro São Pedro and Anfiteatro<br />
Camargo Guarnieri.<br />
6. REFERENCES<br />
[1] F. Iazzetta, F. Kon and F. Silva, AcMus: Design and Simulation <strong>of</strong> Music Listen<strong>in</strong>g Enviroments, Anais<br />
do XXI Congresso da Sociedade Brasileira de Computação, Fortaleza, Brazil, 2001<br />
[2] A. Far<strong>in</strong>a, Acoustic Quality <strong>of</strong> Theaters: Correlation Between Experimental Measures and Subjective<br />
Evaluation, Applied Acoustics 62 , 889 – 916, 2001<br />
[3] ISO 3382 Acoustics – Measurement <strong>of</strong> the reverberation time <strong>of</strong> rooms with reference to other<br />
<strong>acoustic</strong>al <strong>parameters</strong>, 1997<br />
[4] L. Beranek, Concert <strong>halls</strong> and opera houses: music, <strong>acoustic</strong>s, and architecture, Spr<strong>in</strong>ger-Verlag, New<br />
York, 2004<br />
[5] H. Kuttruff, Room Acoustics, Elsevier Applied Science, London, 1991<br />
[6] B. Masiero, Estudo e Implementação de Métodos de Medição e Resposta Impulsiva em Salas de Pequeno<br />
Porte, Relatório Técnico - Fapesp, at http://gsd.ime.usp.br/acmus/public.html , 2004<br />
[7] S. Müller and P. Massarani, Transfer Function Measurements with Sweeps, JAES 49(6), 443, 2001<br />
[8] F. Arruda, R. Guedes et al. A <strong>in</strong>fluência da direcionalidade de fontes sonoras na avaliação experimental<br />
da qualidade acústica de salas, XIX Meet<strong>in</strong>g <strong>of</strong> the Brazilian Society <strong>of</strong> Acoustics, Belo Horizonte, 2000