Comparative study of measured acoustic parameters in concert halls ...
Comparative study of measured acoustic parameters in concert halls ...
Comparative study of measured acoustic parameters in concert halls ...

You also want an ePaper? Increase the reach of your titles
YUMPU automatically turns print PDFs into web optimized ePapers that Google loves.
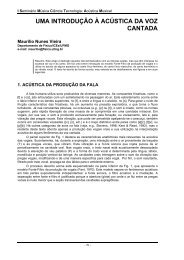
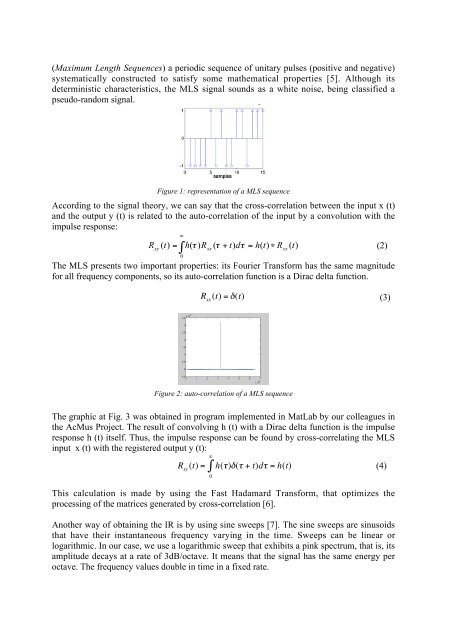
(Maximum Length Sequences) a periodic sequence <strong>of</strong> unitary pulses (positive and negative)<br />
systematically constructed to satisfy some mathematical properties [5]. Although its<br />
determ<strong>in</strong>istic characteristics, the MLS signal sounds as a white noise, be<strong>in</strong>g classified a<br />
pseudo-random signal.<br />
Figure 1: representation <strong>of</strong> a MLS sequence<br />
Accord<strong>in</strong>g to the signal theory, we can say that the cross-correlation between the <strong>in</strong>put x (t)<br />
and the output y (t) is related to the auto-correlation <strong>of</strong> the <strong>in</strong>put by a convolution with the<br />
impulse response:<br />
∞<br />
Rxy<br />
( t)<br />
= ∫ h(<br />
τ ) Rxx<br />
( τ + t)<br />
dτ<br />
= h(<br />
t)<br />
∗ Rxx<br />
( t)<br />
(2)<br />
0<br />
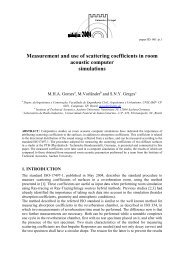
The MLS presents two important properties: its Fourier Transform has the same magnitude<br />
for all frequency components, so its auto-correlation function is a Dirac delta function.<br />
R xx<br />
(t) = δ(t)<br />
(3)<br />
€<br />
Figure 2: auto-correlation <strong>of</strong> a MLS sequence<br />
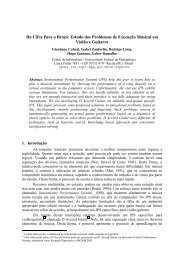
The graphic at Fig. 3 was obta<strong>in</strong>ed <strong>in</strong> program implemented <strong>in</strong> MatLab by our colleagues <strong>in</strong><br />
the AcMus Project. The result <strong>of</strong> convolv<strong>in</strong>g h (t) with a Dirac delta function is the impulse<br />
response h (t) itself. Thus, the impulse response can be found by cross-correlat<strong>in</strong>g the MLS<br />
<strong>in</strong>put x (t) with the registered output y (t):<br />
R xy<br />
(t) =<br />
∞<br />
∫ h(τ)δ(τ + t)dτ = h(t) (4)<br />
0<br />
This calculation is made by us<strong>in</strong>g the Fast Hadamard Transform, that optimizes the<br />
process<strong>in</strong>g <strong>of</strong> the matrices generated by cross-correlation [6].<br />
€<br />
Another way <strong>of</strong> obta<strong>in</strong><strong>in</strong>g the IR is by us<strong>in</strong>g s<strong>in</strong>e sweeps [7]. The s<strong>in</strong>e sweeps are s<strong>in</strong>usoids<br />
that have their <strong>in</strong>stantaneous frequency vary<strong>in</strong>g <strong>in</strong> the time. Sweeps can be l<strong>in</strong>ear or<br />
logarithmic. In our case, we use a logarithmic sweep that exhibits a p<strong>in</strong>k spectrum, that is, its<br />
amplitude decays at a rate <strong>of</strong> 3dB/octave. It means that the signal has the same energy per<br />
octave. The frequency values double <strong>in</strong> time <strong>in</strong> a fixed rate.