Comparative study of measured acoustic parameters in concert halls ...
Comparative study of measured acoustic parameters in concert halls ...
Comparative study of measured acoustic parameters in concert halls ...

You also want an ePaper? Increase the reach of your titles
YUMPU automatically turns print PDFs into web optimized ePapers that Google loves.
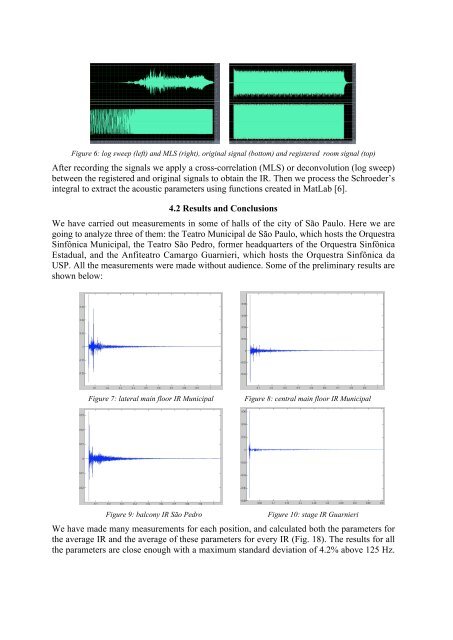
Figure 6: log sweep (left) and MLS (right), orig<strong>in</strong>al signal (bottom) and registered room signal (top)<br />
After record<strong>in</strong>g the signals we apply a cross-correlation (MLS) or deconvolution (log sweep)<br />
between the registered and orig<strong>in</strong>al signals to obta<strong>in</strong> the IR. Then we process the Schroeder’s<br />
<strong>in</strong>tegral to extract the <strong>acoustic</strong> <strong>parameters</strong> us<strong>in</strong>g functions created <strong>in</strong> MatLab [6].<br />
4.2 Results and Conclusions<br />
We have carried out measurements <strong>in</strong> some <strong>of</strong> <strong>halls</strong> <strong>of</strong> the city <strong>of</strong> São Paulo. Here we are<br />
go<strong>in</strong>g to analyze three <strong>of</strong> them: the Teatro Municipal de São Paulo, which hosts the Orquestra<br />
S<strong>in</strong>fônica Municipal, the Teatro São Pedro, former headquarters <strong>of</strong> the Orquestra S<strong>in</strong>fônica<br />
Estadual, and the Anfiteatro Camargo Guarnieri, which hosts the Orquestra S<strong>in</strong>fônica da<br />
USP. All the measurements were made without audience. Some <strong>of</strong> the prelim<strong>in</strong>ary results are<br />
shown below:<br />
Figure 7: lateral ma<strong>in</strong> floor IR Municipal<br />
Figure 8: central ma<strong>in</strong> floor IR Municipal<br />
Figure 9: balcony IR São Pedro<br />
Figure 10: stage IR Guarnieri<br />
We have made many measurements for each position, and calculated both the <strong>parameters</strong> for<br />
the average IR and the average <strong>of</strong> these <strong>parameters</strong> for every IR (Fig. 18). The results for all<br />
the <strong>parameters</strong> are close enough with a maximum standard deviation <strong>of</strong> 4.2% above 125 Hz.