Ecological Evaluation Technical Guidance - State of New Jersey
Ecological Evaluation Technical Guidance - State of New Jersey
Ecological Evaluation Technical Guidance - State of New Jersey
- No tags were found...

You also want an ePaper? Increase the reach of your titles
YUMPU automatically turns print PDFs into web optimized ePapers that Google loves.
<strong>Ecological</strong> <strong>Evaluation</strong><strong>Technical</strong> <strong>Guidance</strong><strong>New</strong> <strong>Jersey</strong> Department <strong>of</strong>Environmental ProtectionAugust 2012Version 1.2 8/29/12
<strong>Ecological</strong> <strong>Evaluation</strong> <strong>Guidance</strong>Table <strong>of</strong> ContentsAcronyms and Abbreviations ..............................................................................................4Executive Summary.............................................................................................................61.0 Intended Use <strong>of</strong> <strong>Guidance</strong> Document......................................................................... 72.0 Purpose........................................................................................................................ 73.0 Document Overview ................................................................................................... 84.0 Definitions................................................................................................................. 115.0 <strong>Technical</strong> <strong>Guidance</strong> for Preparing <strong>Ecological</strong> <strong>Evaluation</strong>s ...................................... 175.1 <strong>Ecological</strong> <strong>Evaluation</strong> Pursuant to N.J.A.C. 7:26E-1.16 ...................................175.2 <strong>Ecological</strong> <strong>Evaluation</strong> Pursuant to N.J.A.C. 7:26E-4.8 .....................................175.2.1 Environmentally Sensitive Natural Resources......................................185.2.2 Contaminants <strong>of</strong> Potential <strong>Ecological</strong> Concern.....................................195.2.3 Contaminant Migration Pathways.........................................................195.3 Recommended Sample Collection in Support <strong>of</strong> <strong>Ecological</strong> <strong>Evaluation</strong>s.........205.3.1 When to Collect Samples ......................................................................215.3.2 Where to Collect Samples .....................................................................215.3.2.1 Potential Contaminant Migration Pathways ......................................... 225.3.2.2 Environmentally Sensitive Natural Resources...................................... 225.3.3 How to Collect Samples........................................................................255.3.3.1 Soils and Sediments .............................................................................. 255.3.3.2 Surface Water........................................................................................ 255.3.4 Background Considerations ..................................................................265.4 Comparison <strong>of</strong> Sample Data with <strong>Ecological</strong> Screening Criteria......................275.4.1 Potential Migration Pathways ...............................................................275.4.2 Surface Water Bodies............................................................................285.4.3 Wetlands................................................................................................295.4.4 Uplands..................................................................................................295.5 <strong>Ecological</strong> <strong>Evaluation</strong> Report ............................................................................306.0 <strong>Technical</strong> <strong>Guidance</strong> for Preparing <strong>Ecological</strong> Risk Assessments ............................ 316.1 <strong>Ecological</strong> Risk Assessment Process Pursuant to N.J.A.C. 7:26E-4.8..............316.1.1 Problem Formulation.............................................................................326.1.1.1 Assessment and Measurement Endpoints............................................. 326.1.1.2 <strong>Ecological</strong> Conceptual Site Model........................................................ 346.1.2 Analysis.................................................................................................376.1.3 Risk Characterization ............................................................................376.1.3.1 Food Chain Modeling ........................................................................... 376.1.3.2 Bioaccumulation ................................................................................... 416.1.3.3 Toxicity Reference Values.................................................................... 466.1.3.4 Weight-<strong>of</strong>-Evidence.............................................................................. 476.2 ERA Data Development ....................................................................................476.2.1 Surface Water........................................................................................486.2.1.1 Sampling Plan Design for Study and Reference Areas ........................ 486.2.1.2 Surface Water Habitat Assessments and Community Surveys............. 49<strong>Ecological</strong> <strong>Evaluation</strong> <strong>Technical</strong> <strong>Guidance</strong> Document 1Version 1.2 8/29/12
6.2.1.3 Biological Sampling <strong>of</strong> Fish and Other Aquatic Organisms ................ 516.2.1.4 Surface Water Toxicity Tests................................................................ 536.2.2 Sediments ..............................................................................................546.2.2.1 Sampling Plan Design for Study and Reference Areas ........................ 546.2.2.2 Sediment Habitat Assessments and Community Surveys .................... 576.2.2.3 Sediment Pore Water Sampling............................................................ 586.2.2.4 Benthic Macroinvertebrate Sampling ................................................... 606.2.2.5 Sediment Toxicity Tests ....................................................................... 616.2.2.6 Toxicity Testing for Sediment Pore Water and Elutriate...................... 616.2.3 Soil.........................................................................................................626.2.3.1 Sampling Plan Design for Study and Reference Areas ........................ 626.2.3.2 Terrestrial Habitat Assessments and Community Surveys................... 646.2.3.3 Surface Soil Sampling........................................................................... 656.2.3.4 Biological Sampling <strong>of</strong> Soil Invertebrates, Plants and Wildlife........... 656.2.3.5 Surface Soil Toxicity Tests................................................................... 676.3 <strong>Ecological</strong> Risk Assessment Report ..................................................................676.4 Special Circumstances .......................................................................................686.4.1 Wetlands................................................................................................686.4.1.1 Wetland Permit Considerations ............................................................ 706.4.1.2 Wetland Backfill Considerations .......................................................... 716.4.2 Estuaries ................................................................................................716.4.3 Urban Areas...........................................................................................726.4.4 Hot Spots ...............................................................................................726.4.5 Extractable Petroleum Hydrocarbons....................................................736.4.6 Polycyclic Aromatic Hydrocarbons ......................................................736.4.7 Polychlorinated Biphenyls (Aroclor vs. Congener) ..............................756.4.8 Chlorinated Dioxin, Furans, and Dioxin-like PolychlorinatedBiphenyls .............................................................................................766.4.9 Historic Fill Material and Dredged Material.........................................786.4.10 Acid-Volatile Sulfides/Simultaneously Extracted Metals.....................787.0 Determination <strong>of</strong> <strong>Ecological</strong> Risk-Based Remediation Goals.................................. 807.1 Use <strong>of</strong> Food Chain Models and Tissue Residue Data to DetermineRemediation Goals...........................................................................................807.2 Use <strong>of</strong> Soil and Sediment Toxicity Test Results to Determine RemediationGoals ................................................................................................................807.2.1 Apparent Effects Threshold Approach..................................................827.2.2 Sediment/Soil Effects Concentration Approach....................................828.0 Uncertainty................................................................................................................ 829.0 Risk Management Considerations ............................................................................ 849.1 Soil Remediation Standards and Deed Notices .................................................849.2 Risk Management Decisions..............................................................................8410.0 Quality Assurance/Quality Control and Data Usability............................................ 8611.0 References................................................................................................................. 87<strong>Ecological</strong> <strong>Evaluation</strong> <strong>Technical</strong> <strong>Guidance</strong> Document 2Version 1.2 8/29/12
AppendiciesAppendix A - Habitat Survey Forms ...............................................................................100Appendix B - Sampling Procedures for Benthic Algae and Plankton.............................104Appendix C - Surface Water Toxicity Testing ................................................................106Appendix D - Sediment Toxicity Testing........................................................................110Appendix E - Sediment Pore Water and Elutriate Toxicity Testing................................114Appendix F - Sediment Pore Water Sampling Techniques .............................................117Appendix G - Invertebrate Sampling Methods................................................................119Appendix H - Soil Toxicity Testing.................................................................................122Appendix I - Using the Toxic Equivalency (TEQ) Approach to Evaluate Dioxin,Furan, and Dioxin-like PCB Results........................................................125Tables and FiguresFigure 3-1: Flow diagram to describe the EE process during the Site Investigation.......10Figure 3-2: Flow diagram to describe the EE and ERA process in the RemedialInvestigation..................................................................................................10Figure 5-1: Sketch map <strong>of</strong> river showing stratified regions and sampling points ...........24Table 6-1: Assessment and Measurement Endpoints.....................................................35Figure 6-2: <strong>Ecological</strong> Conceptual Site Model................................................................36Figure 6-3: Example <strong>of</strong> an <strong>Ecological</strong> Conceptual Site Model as a Chart ......................36Figure 6-4: Conceptual Model for Applying Various Sediment AssessmentApproaches in a Tiered System to Determine the Risk <strong>of</strong> AdverseEffects Due to PAHs in Sediments ...............................................................74Figure 7-1: Hypothetical Example <strong>of</strong> Media Concentrations to Consider forSelection <strong>of</strong> <strong>Ecological</strong> Risk-Based Remediation Goals..............................81Figure 7-2: Simplified Example <strong>of</strong> Determining a Remediation Goal Using aStandard Food Chain Model and Site-Specific Tissue Residue Data...........81Figure 7-3: Simplified Example <strong>of</strong> Determining a Remediation Goal Using theApparent Effects Threshold (AET) Approach..............................................82Figure 9-1: Plot <strong>of</strong> Exposure Risk Reduction vs. Acres <strong>of</strong> Habitat Destroyed ...............86<strong>Ecological</strong> <strong>Evaluation</strong> <strong>Technical</strong> <strong>Guidance</strong> Document 3Version 1.2 8/29/12
Acronyms and AbbreviationsADDAETAFAFDWASTMAVSBERABAFBSAFsBWCERCLACMCOPECCRCSMDDTDGTDODQOEcoSSLsECSMEEEqPERAERAGSER-LER-MESCESNRFIFSPMGISHOCHQICITRCLELLOAELLOECLOILSRPMDLAverage Daily Dose (mg/kg-day)Apparent Effects ThresholdAbsorption FractionAsh-Free Dry WeightAmerican Society for Testing and MaterialsAcid Volatile SulfideBaseline <strong>Ecological</strong> Risk AssessmentBioaccumulation FactorSediment/Soil-to-Biota Bioaccumulation FactorsBody weightComprehensive Environmental Response, Compensation, and Liability ActConcentration <strong>of</strong> COPECs in media <strong>of</strong> concernContaminants <strong>of</strong> Potential <strong>Ecological</strong> ConcernContact Rates (kg/day or L/day)Conceptual Site ModelDichloro-Diphenyl, Tri-ChloroethaneDiffusive Gradient in Thin FilmsDissolved OxygenData Quality Objectives<strong>Ecological</strong> Soil Screening Levels<strong>Ecological</strong> Conceptual Site Model<strong>Ecological</strong> <strong>Evaluation</strong>Equilibrium Partitioning<strong>Ecological</strong> Risk Assessments<strong>Ecological</strong> Risk Assessment <strong>Guidance</strong> for Superfund: Process forDesigning and Conducting <strong>Ecological</strong> Risk Assessments (EPA 540-R-97-006, June 1997)Effects Range-LowEffects Range-Median<strong>Ecological</strong> Screening CriteriaEnvironmentally Sensitive Natural ResourceFractional IntakeField Sampling Procedures ManualGeographic Information SystemHydrophobic Organic ChemicalHazard QuotientInhibitory ConcentrationInterstate Technology & Regulatory CouncilLowest Effects LevelLowest Observed Adverse Effect LevelLowest Observed Effect ConcentrationLetter <strong>of</strong> InterpretationLicensed Site Remediation Pr<strong>of</strong>essionalMethod Detection Limit<strong>Ecological</strong> <strong>Evaluation</strong> <strong>Technical</strong> <strong>Guidance</strong> Document 4Version 1.2 8/29/12
mg/l CaCO3 Milligrams Per Liter <strong>of</strong> Calcium Carbonate (Hardness)NELAP National Environmental Laboratory Accreditation ProgramN.J.A.C. <strong>New</strong> <strong>Jersey</strong> Administrative CodeNJDEP <strong>New</strong> <strong>Jersey</strong> Department <strong>of</strong> Environmental ProtectionNJPDES <strong>New</strong> <strong>Jersey</strong> Pollutant Discharge Elimination SystemNOAEL No Observed Adverse Effect LevelNOEC No Observed Effect ConcentrationOSWER Office <strong>of</strong> Solid Waste and Emergency ResponsePAH Polycyclic Aromatic HydrocarbonPCB Polychlorinated BiphenylsPCDD Polychlorinated Dibenzo-P-DioxinsPCDF Polychlorinated Dibenz<strong>of</strong>uranPE Polyethylenepg/ml Picogram/MilliliterPOM Polyoxymethyleneppm Part Per Millionppt Part Per Trillion or Part Per Thousand for salinityQA/QC Quality Assurance and Quality ControlQAPP Quality Assurance Project PlanRBP Rapid Bioassessment ProtocolsRMD Risk Management DecisionROI Receptors <strong>of</strong> InterestSEC Sediment/Soil Effects ConcentrationSEL Severe Effects LevelSEM Simultaneously Extracted MetalsSISite InvestigationSLERA Screening Level <strong>Ecological</strong> Risk AssessmentSMDP Scientific/Management Decision PointSPMD Semi-Permeable Membrane DeviceSPME Solid Phase Microextraction DevicesSRS Soil Remediation StandardsSRT Standard Reference ToxicantSWQS Surface Water Quality Standards (N.J.A.C. 7:9B)TEC Toxicity Equivalence ConcentrationTEF Toxic Equivalency FactorTEQ Toxic EquivalencyTIC Tentatively Identified ContaminantTOC Total Organic CarbonTRV Toxicity Reference ValueUCL Upper Confidence LimitU.S.C. United <strong>State</strong>s CodeUSEPA United <strong>State</strong>s Environmental Protection AgencyUSGS United <strong>State</strong>s Geological SurveyVOC Volatile Organic CompoundsWET Whole Effluent ToxicityWHO World Health Organization<strong>Ecological</strong> <strong>Evaluation</strong> <strong>Technical</strong> <strong>Guidance</strong> Document 5Version 1.2 8/29/12
Executive SummaryThis document provides technical guidance on how to conduct an <strong>Ecological</strong> <strong>Evaluation</strong>(EE) and an <strong>Ecological</strong> Risk Assessment (ERA) pursuant to N.J.A.C. 7:26E-1.16andN.J.A.C. 7:26E-4.8 for environmentally sensitive natural resources (ESNR) associatedwith contaminated sites. <strong>Guidance</strong> is also provided for the derivation <strong>of</strong> site-specificecological risk-based remediation goals and Risk Management Decisions (RMD).Although the Licensed Site Remediation Pr<strong>of</strong>essionals (LSRP) should understand thepurpose and intent <strong>of</strong> this guidance, the investigator performing the EE and ERA must beexperienced in the use <strong>of</strong> techniques and methodologies for conducting ERAs (C.58:10C-16 (c))and must be able to comply with appropriate guidance including, but not limitedto, USEPA’s <strong>Ecological</strong> Risk Assessment <strong>Guidance</strong> for Superfund, Process for Designingand Conducting <strong>Ecological</strong> Risk Assessments, EPA 540-R-97-006, Office <strong>of</strong> Solid Wasteand Emergency Response, Washington, DC (ERAGS - USEPA, 1997a) (N.J.S.A.58:10B-12). If the LSRP does not possess the necessary qualifications, subcontracting toqualified investigators is appropriate. This guidance was prepared in accordance with the<strong>Technical</strong> Requirements for Site Remediation, N.J.A.C. 7:26E, the Site RemediationReform Act, N.J.S.A. 58:C-1 et seq. and the Administrative Requirements for theRemediation <strong>of</strong> Contaminated Sites, N.J.A.C. 7:26C.The EE is conducted to examine the site for the co-occurrence <strong>of</strong> the following:(1) ESNRs on, adjacent to, or potentially impacted by the site,(2) the presence <strong>of</strong> Contaminants <strong>of</strong> Potential <strong>Ecological</strong> Concern (COPEC) at thesite or Area <strong>of</strong> Concern (AOC) and in the ESNRs, and(3) the presence <strong>of</strong> a contaminant migration pathway (historic or current) from thesite to the ESNR or evidence <strong>of</strong> contaminated material having been placeddirectly into an ESNR.The outcome <strong>of</strong> the EE will be a recommendation either to conduct an ERA or no furtherecological evaluation.The ERA is a quantitative assessment <strong>of</strong> the actual or potential impacts <strong>of</strong> COPECs froma contaminated site on wildlife and plants. The ERA consists <strong>of</strong> the following:(1) rigorous site-specific biological tests, determining whether actual or potentialecological risks exist at a site,(2) identifying whether remediation is necessary for constituents posing ecologicalrisks, and(3) generating data needed to determine site-specific risk-based remediation goals andRMDs.<strong>Technical</strong> consultation sessions with <strong>New</strong> <strong>Jersey</strong> Department <strong>of</strong> EnvironmentalProtection (NJDEP) staff are available to the LSRP to discuss specific technical issuesrelated to site remediation. These consultations will assist compliance with the NJDEP’sapplicable Site Remediation Program rule requirements and technical guidance. Forfurther information, please refer tohttp://www.nj.gov/dep/srp/srra/technical_consultation/.<strong>Ecological</strong> <strong>Evaluation</strong> <strong>Technical</strong> <strong>Guidance</strong> Document 6Version 1.2 8/29/12
1.0 Intended Use <strong>of</strong> <strong>Guidance</strong> DocumentThis guidance document is designed to help the person responsible for conductingremediation comply with the <strong>New</strong> <strong>Jersey</strong> Department <strong>of</strong> Environmental Protection’srequirements established by the <strong>Technical</strong> Requirements for Site Remediation (<strong>Technical</strong>Rules), N.J.A.C. 7:26E. This guidance will be used by many people involved in theremediation <strong>of</strong> a contaminated site including Licensed Site Remediation Pr<strong>of</strong>essionals(LSRP), environmental consultants, and other environmental pr<strong>of</strong>essionals. Because therewill be many users, the generic term “investigator” will be used to refer to anyremediating party or person who uses this guidance to remediate a contaminated site onbehalf <strong>of</strong> a remediating party.The procedures for a person to vary from the technical requirements in regulations areoutlined in the <strong>Technical</strong> Rules at N.J.A.C. 7:26E-1.7. Variances from a technicalrequirement or deviation from guidance must be documented and adequately supportedwith data or other information. In applying technical guidance, the NJDEP recognizesthat pr<strong>of</strong>essional judgment may result in a range <strong>of</strong> interpretations on the application <strong>of</strong>the guidance to site conditions. This guidance was prepared in accordance with the<strong>Technical</strong> Requirements for Site Remediation, N.J.A.C. 7:26E, the Site RemediationReform Act, N.J.S.A. 58:C-1 et seq. and the Administrative Requirements for theRemediation <strong>of</strong> Contaminated Sites, N.J.A.C. 7:26C.This guidance supersedes all previous NJDEP guidance issued on this topic.This guidance was prepared with stakeholder input. The committee responsible for thepreparation <strong>of</strong> this document was composed <strong>of</strong> the following people: Nancy Hamill,Chair (NJDEP), Greg Neumann (NJDEP), Allan S. Motter (NJDEP), Charles Harman(AMEC Earth & Environmental), Ralph Stahl (E.I. duPont and Company), and KariAnneCzajkowski (Langan Engineering & Environmental Services). The committee wishes toacknowledge the contributions <strong>of</strong> the following individuals: Daniel Cooke (AMEC Earth& Environmental), Christina Faust (SAIC), and Steven Byrnes (NJDEP).2.0 PurposeThe purpose <strong>of</strong> this document is to provide efficient and streamlined tiered guidance forthe evaluation <strong>of</strong> ecological risk in aquatic and terrestrial habitats associated withcontaminated sites. As per N.J.S.A 58:10 B-12 (Brownfields and Contaminated SiteRemediation Act), the guidance will enable users to determine remediation standardsprotective <strong>of</strong> the environment on a case-by-case basis in accordance with guidance andregulations <strong>of</strong> the United <strong>State</strong>s Environmental Protection Agency (USEPA). Thisguidance supplements and provides details for the implementation <strong>of</strong> N.J.A.C. 7:26E andis in accordance with USEPA (1997a), <strong>Ecological</strong> Risk Assessment <strong>Guidance</strong> forSuperfund, Process for Designing and Conducting <strong>Ecological</strong> Risk Assessments, EPA540-R-97-006, Office <strong>of</strong> Solid Waste and Emergency Response, Washington, DC(ERAGS), available at http://www.epa.gov/oswer/riskassessment/ecorisk/ecorisk.htm.<strong>Ecological</strong> <strong>Evaluation</strong>s (EE) and <strong>Ecological</strong> Risk Assessments (ERA) are conducted todetermine whether remedial actions are required in environmentally sensitive naturalresources (ESNR) associated with contaminated sites and to provide the means todetermine ecological risk-based remediation goals. ESNRs are defined as<strong>Ecological</strong> <strong>Evaluation</strong> <strong>Technical</strong> <strong>Guidance</strong> Document 7Version 1.2 8/29/12
environmentally sensitive areas pursuant to the Discharge <strong>of</strong> Petroleum and OtherHazardous Substances, N.J.A.C. 7:1E-1.8, available athttp://www.nj.gov/dep/rpp/brp/dp/downloads/NJAC_7_1E.pdf, and Pinelands pursuantto N.J.S.A.13:18A-1 et seq. and N.J.A.C. 7:50, available athttp://www.state.nj.us/pinelands/images/pdf%20files/pinelandsprotectionact1.pdf.EEs are required for all contaminated sites pursuant to N.J.A.C.7:26E 1.16 Receptor<strong>Evaluation</strong> and N.J.A.C. 7:26E-4.8(a) and 4.8(b) Remedial Investigation <strong>of</strong> <strong>Ecological</strong>Receptors. If the EE indicates that additional ecological investigation is necessary, thenan ERA is required pursuant to N.J.A.C. 7:26E-4.8(c), Remedial Investigation <strong>of</strong><strong>Ecological</strong> Receptors. EEs must be conducted by a person experienced in the use <strong>of</strong>techniques and methodologies for conducting ERAs (C.58:10C-16 (c)). For new cases(initiated remediation after November 4, 2009) or existing cases (initiated remediationbefore November 4, 2009) that have opted into the LSRP program, or after May 2012, theinvestigator may either: (1) be an LSRP, (2) be directly overseen and supervised by anLSRP, or (3) have the EE reviewed and accepted by an LSRP.3.0 Document OverviewThis document provides technical guidance on how to conduct an <strong>Ecological</strong> <strong>Evaluation</strong>(EE) and an <strong>Ecological</strong> Risk Assessment (ERA) pursuant to N.J.A.C. 7:26E-1.16andN.J.A.C. 7:26E-4.8 in environmentally sensitive natural resources (ESNR) associatedwith contaminated sites. <strong>Guidance</strong> is also provided for the derivation <strong>of</strong> site-specificecological risk-based remediation goals, determination <strong>of</strong> Risk Management Decisions(RMD), preparation <strong>of</strong> the EE and ERA reports, management <strong>of</strong> special circumstances,and implementation <strong>of</strong> required data quality assurance and quality control (QA/QC)measures as per N.J.A.C. 7:26E-2.The guidance first describes how to conduct an EE, which is initiated during the SiteInvestigation (SI) pursuant to N.J.A.C. 7:26E-1.16. The EE is conducted to examine thesite for the co-occurrence <strong>of</strong> the following:(1) ESNRs on, adjacent to, or potentially impacted by the site;(2) the presence <strong>of</strong> Contaminants <strong>of</strong> Potential <strong>Ecological</strong> Concern (COPEC) at thesite or area <strong>of</strong> concern (AOC) and in the ESNRs (e.g., contaminants withconcentrations in excess <strong>of</strong> aquatic Surface Water Quality Standards (SWQS) orecological screening criteria (ESC)); and(3) the presence <strong>of</strong> a contaminant migration pathway (historic or current) from thesite to the ESNR or evidence <strong>of</strong> contaminated material having been placeddirectly into an ESNR. As part <strong>of</strong> the SI, an EE must be performed within theregulatory time frame <strong>of</strong> one year from the initiation <strong>of</strong> remediation (N.J.A.C.7:26C-3.2). The mandatory time frame associated with this requirement is twoyears from the initiation <strong>of</strong> remediation (N.J.A.C. 7:26C-3.3). The outcome <strong>of</strong>the EE will be a recommendation either to conduct an ERA or to not conduct anyfurther ecological evaluation.<strong>Guidance</strong> is then provided on how to conduct the ERA, a component <strong>of</strong> the RemedialInvestigation (RI) pursuant to N.J.A.C. 7:26E-4.8. The ERA is a quantitative assessment<strong>of</strong> the actual or potential impacts <strong>of</strong> COPECs from a contaminated site on ecological<strong>Ecological</strong> <strong>Evaluation</strong> <strong>Technical</strong> <strong>Guidance</strong> Document 8Version 1.2 8/29/12
eceptors associated with ESNRs on, adjacent to or potentially impacted by the site. TheERA will do the following:(1) determine whether actual or potential ecological risks exist at a site based onrigorous site-specific biological tests;(2) identify whether remediation is necessary for those constituents posing ecologicalrisks; and(3) generate data needed to determine site-specific ecological risk-based remediationgoals and RMDs.An overview <strong>of</strong> the EE and ERA process is provided in Figure 3-1 below.While conducting an EE and ERA, the numeric criteria potentially used to evaluatecontaminant levels associated with ESNRs include ESC, calculated ecological risk-basedremediation goals, and RMD goals. ESC are literature values for individual contaminantsthat are conservative screening values intended to be protective <strong>of</strong> the target organismsbased on direct exposure. The ESC are used in the initial stages <strong>of</strong> the EE to determinewhether there is potential for site contaminants to impact ESNRs (Section 5.4). If sitecontaminant levels are less than or equal to the ESC for all samples, then no furtherecological evaluation may be appropriate; however, if any <strong>of</strong> the site contaminants areabove the ESC, then further evaluation will be required (Section 5.5). Contaminantswithout ESCs must be evaluated in the risk assessment process (N.J.S.A. 58:10B-12).<strong>Ecological</strong> risk-based remediation goals are numeric criteria that are calculated based onsite conditions and ecological receptors observed or expected to be present at the site(Section 7.0). <strong>Ecological</strong> risk-based remediation goals are the preliminary standardsdeveloped once it is determined that remediation is required within an ESNR. It may beappropriate to remediate to either the ESC (Section 6.4.4) or the ecological risk-basedremediation goal; however, sometimes remediation to these levels may result inunacceptable destruction <strong>of</strong> habitat or technical impracticability. In these circumstances,an RMD may be made to take into account risk reduction and habitat destruction,preservation and restoration, as well as technical impracticability (Section 9.0). An RMDmay result in remediation to a higher numeric level, which may not be protective <strong>of</strong> allreceptors, to preserve certain habitats that are hard to restore, but ultimately results insignificant risk reduction. Final remediation resulting from an RMD may apply differentnumeric criteria to various ESNRs or even subsets <strong>of</strong> a single ESNR. Remediation toeither a risk-based remediation goal or an RMD goal will require NJDEP review andconcurrence (N.J.S.A. 58:10B-12 and N.J.A.C. 7:26E-4.8(c)3). Remediation to the SoilRemediation Standards (SRS), found at N.J.A.C. 7:26D, is not appropriate in ESNRsbecause the SRS are human health-based and assume human exposure in a residential orindustrial setting. Human exposure to contaminated media within an ESNR would not beexpected to be the same as exposure in a residential or industrial setting. Furtherexplanation <strong>of</strong> the ESC, remediation goals, and an RMD is provided in the followingsections. Further information regarding SRS in relation to ESNRs is found in Section9.1.<strong>Ecological</strong> <strong>Evaluation</strong> <strong>Technical</strong> <strong>Guidance</strong> Document 9Version 1.2 8/29/12
Figure 3-1: Flow diagram to describe the EE process during the Site Investigation.Figure 3-2: Flow diagram to describe the EE and ERA process in the Remedial Investigation.<strong>Ecological</strong> <strong>Evaluation</strong> <strong>Technical</strong> <strong>Guidance</strong> Document 10Version 1.2 8/29/12
4.0 Definitions"Area <strong>of</strong> concern" or “AOC” means any existing or former location where hazardoussubstances, hazardous wastes, or pollutants are or were known or suspected to have beendischarged, generated, manufactured, refined, transported, stored, handled, treated,disposed, or where hazardous substances, hazardous wastes, or pollutants have or mayhave migrated (N.J.A.C. 7:26E-1.8).“Assessment endpoints” means the explicit expressions <strong>of</strong> the environmental value to beprotected.“Background Area” means a habitat similar to the habitat being assessed, but one that isoutside <strong>of</strong> the influence <strong>of</strong> the site discharge.“Background Contamination” means the contaminant levels in the immediate area <strong>of</strong> thesite that are not attributable to the site discharge itself and that originated from eithernatural sources (not man-made) or <strong>of</strong>fsite discharges (man-made, discharges not relatedto the site). These background contaminant concentrations are generally derived bycollecting samples in the background area.“Benthic community” means organisms that live in and on the bottom substrate <strong>of</strong> asurface water body.“Benthic macroinvertebrate survey” means the use <strong>of</strong> macroinvertebrate collection,organism identification, and data analysis to assess various metrics including community,population, and functional parameters such as species richness and tolerance indices.“Bioaccumulation” means the accumulation <strong>of</strong> contaminants in the tissue <strong>of</strong> organismsthrough any route, including respiration, ingestion, or direct contact with contaminatedmedia (USEPA 2000c).“Bioavailability” means the individual physical, chemical, and biological interactions thatdetermine the exposure <strong>of</strong> plants and animals to chemicals associated with soils andsediments (ITRC 2011).“Biomagnification” means the process <strong>of</strong> bioconcentration and bioaccumulation bywhich tissue concentrations <strong>of</strong> bioaccumulated chemicals increase as the chemical passesup through two or more trophic levels. The term implies an efficient transfer <strong>of</strong> chemicalfrom food to consumer, so that residue concentrations increase systematically from onetrophic level to the next (USEPA 2000c).“Breeding season” means the most suitable season, usually with favorable conditions andabundant food and water, for breeding among some wild animals and birds (wildlife).“Chlorotic vegetation” means the abnormally yellowing or whitening <strong>of</strong> normally greenplant tissue, resulting from partial failure to develop chlorophyll or decreased production<strong>of</strong> chlorophyll.“Comingled contamination” means unrelated contaminants that are mixed in an area ormedia.“Community assessment” means the evaluation <strong>of</strong> community structure by measuringbiotic characteristics (e.g., species abundance, diversity, and composition); community<strong>Ecological</strong> <strong>Evaluation</strong> <strong>Technical</strong> <strong>Guidance</strong> Document 11Version 1.2 8/29/12
assessment may also include evaluating community function by measuring rate processes(e.g., species colonization rates).“Congener” means any <strong>of</strong> the 75 isomers <strong>of</strong> dioxin, 135 isomers <strong>of</strong> furans and 209isomers <strong>of</strong> PCBs that differ in the number and position <strong>of</strong> chlorine atoms attached to thebase structure <strong>of</strong> the molecule. There are 7 dioxin congeners, 10 furan congeners and 12PCB congeners that the World Health Organization (WHO) has identified as havingdioxin-like properties.“Contaminant delineation” means the determination <strong>of</strong> the vertical and horizontal extent<strong>of</strong> contamination in all surface water, sediment, and soils within environmentallysensitive natural resources to the higher <strong>of</strong> the ecological screening criteria or backgroundcontaminant levels.“Contaminant migration pathway” means the potential conduit for movement <strong>of</strong>contaminants from one area or media to another via a route or way <strong>of</strong> access.“Contaminant <strong>of</strong> Potential <strong>Ecological</strong> Concern” or “COPEC” means a substance detectedat a contaminated site that has the potential to adversely affect ecological receptorsbecause <strong>of</strong> its concentration, distribution, and mode <strong>of</strong> toxicity; contaminants withconcentrations above their respective <strong>New</strong> <strong>Jersey</strong> Surface Water Quality Standards orecological screening criteria are identified as contaminants <strong>of</strong> potential ecologicalconcern."Contaminated site" means all portions <strong>of</strong> environmental media at a site and any locationwhere contamination is emanating, or which has emanated, therefrom, that contain one ormore contaminants at a concentration which fails to satisfy any applicable remediationstandard (N.J.A.C. 7:26E-1.8)."Contamination" or "contaminant" means any discharged hazardous substance as definedpursuant to N.J.S.A. 58:10-23.11b, hazardous waste as defined pursuant to N.J.S.A.13:1E-38, or pollutant as defined pursuant to N.J.S.A. 58:10A-3 (N.J.A.C. 7:26E-1.8).“Data quality objectives” means performance and acceptance criteria that clarify studyobjectives, define the appropriate type <strong>of</strong> data, and specify tolerable levels <strong>of</strong> potentialdecision errors that will be used as the basis for establishing the quality and quantity <strong>of</strong>data needed to support decisions.“Dredged materials” means subaqueous media moved within or removed from a givenwater body by deliberate action via mechanical or hydraulic means.“<strong>Ecological</strong> Conceptual Site Model” or “ECSM” means the conceptual projection <strong>of</strong>possible source-to-pathway-to-receptor scenarios for the COPECs identified at a site.“<strong>Ecological</strong> <strong>Evaluation</strong>” means the process by which each contaminated site or AOC isinvestigated for the co-occurrence <strong>of</strong> ESNRs, COPECs, and contaminant migrationpathways from the source area to the ESNR.“<strong>Ecological</strong> Risk Assessment” means a qualitative or quantitative appraisal <strong>of</strong> the actualor potential impacts <strong>of</strong> contaminants from a contaminated site on plants and animalsother than humans and domesticated species.<strong>Ecological</strong> <strong>Evaluation</strong> <strong>Technical</strong> <strong>Guidance</strong> Document 12Version 1.2 8/29/12
“<strong>Ecological</strong> risk-based remediation goal” means risk-based numeric criteria that arecalculated based on site conditions and ecological receptors observed or expected to bepresent at the site. Remediation goals are the preliminary standards developed once it isdetermined that remediation is required within an ESNR.“<strong>Ecological</strong> screening criteria” or “ESC” means literature values for individualcontaminants that were usually derived by dosing experiments and that are mainly basedon the no observed adverse effect level (NOAEL) or lowest observed adverse effect level(LOAEL). The ESC are generally conservative levels designed to protect the targetorganisms based on direct exposure.“Ecotoxicological effect” means any adverse acute or chronic effect from contaminantson invertebrate, plant, fish or wildlife individual, population, or community.“Endangered Species” means a plant or animal species whose prospects for survivalwithin the state are in immediate danger because <strong>of</strong> one or several factors such as loss ordegradation <strong>of</strong> habitat, overexploitation, predation, competition, disease or environmentalpollution, etc. An endangered species likely requires immediate action to avoid extinctionwithin <strong>New</strong> <strong>Jersey</strong>."Environmental medium" means any component such as soil, air, sediment, structures,ground water or surface water (N.J.A.C. 7:26E-1.8)."Environmentally sensitive natural resources" means all areas defined at N.J.A.C. 7:1E-1.8(a), ground water, and areas and/or resources that are protected or managed pursuantto the Pinelands Protection Act, N.J.S.A. 13:18A-1 et seq. and the PinelandsComprehensive Management Plan, N.J.A.C. 7:50 (N.J.A.C. 7:26E-1.8).“Epibenthic” means living and feeding on top <strong>of</strong> the sediment, but may be hidden byleaves and organic detritus.“Estuary” means a tidally influenced area where freshwater inputs from rivers, streams orother conveyances enter coastal marine environments.“Fecundity” means the capacity, especially in female animals, <strong>of</strong> producing young inabundance.“Feeding guild” means a group <strong>of</strong> unrelated species that feed on similar foods (e.g.,benthivore, detritivore, herbivore, insectivore, omnivore, planktivore, piscivore), or thetypes <strong>of</strong> food that an individual organism feeds upon.“Fresh water(s)” means all nontidal and tidal waters generally having a salinity, due tonatural sources, <strong>of</strong> less than or equal to 3.5 parts per thousand at mean high tide (N.J.A.C.7:9B-1.4).“Geographic Information System” means a computer system for capturing, storing,checking, integrating, manipulating, analyzing, and displaying data related to positions onthe earth's surface."Ground water" means the portion <strong>of</strong> the water beneath the land surface that is within thezone <strong>of</strong> saturation where all pore spaces <strong>of</strong> the geologic formation are filled with water(N.J.A.C. 7:26E-1.8).<strong>Ecological</strong> <strong>Evaluation</strong> <strong>Technical</strong> <strong>Guidance</strong> Document 13Version 1.2 8/29/12
“Hazard quotient” or “HQ” means the ratio <strong>of</strong> the results <strong>of</strong> the measured or modeleddietary contaminant doses to receptors <strong>of</strong> concern to the toxicity reference value."Historic fill material" means non-indigenous material, deposited to raise the topographicelevation <strong>of</strong> the site, which was contaminated prior to emplacement, and is in no wayconnected with the operations at the location <strong>of</strong> emplacement and which includes,without limitation, construction debris, dredge materials, incinerator residue, demolitiondebris, fly ash, or non-hazardous solid waste. Historic fill material does not include anymaterial which is substantially chromate chemical production waste or any otherchemical production waste or waste from processing <strong>of</strong> metal or mineral ores, residues,slag or tailings. In addition, historic fill material does not include a municipal solid wastelandfill site (N.J.A.C. 7:26E-1.8).“Homolog” means one <strong>of</strong> a series <strong>of</strong> congeners with the same number <strong>of</strong> chlorine atoms.“Inhibitory concentration” or “IC” means the test concentration that yielded an inhibitoryeffect on a given percentage <strong>of</strong> the exposed organisms.“Lentic” means the ecosystem <strong>of</strong> a lake, pond or swamp.“Lotic” means the ecosystem <strong>of</strong> a river, stream or spring.“Lowest observed adverse effects level” or “LOAEL” means the lowest level <strong>of</strong> exposure<strong>of</strong> an organism, found by experiment or observation, at which there is a biologically orstatistically significant increase in the frequency or severity <strong>of</strong> any adverse effects in theexposed population when compared to its appropriate control.“Lowest observed effect concentration” or “LOEC” means the lowest test concentrationat which a significant reduction in survival, growth, or reproduction/fecundity ascompared to the laboratory control or reference sample was observed.“Measurement endpoint” means a measureable response to a stressor that is related to thevalued characteristic chosen as the assessment endpoint.“Method detections limit” or "MDL" means the minimum concentration <strong>of</strong> a substancethat can be measured and reported with a 99 percent confidence that the analyteconcentration is greater than zero and is determined from the analysis <strong>of</strong> a sample in agiven matrix containing the analyte (N.J.A.C. 7:26E-1.8).“Mixing zone” means the area <strong>of</strong> a tidal water body <strong>of</strong> a site or contaminant source wherethe tidal action is capable <strong>of</strong> transporting sediment or contaminants within that reach.“No observed adverse effect level” or “NOAEL” means the level <strong>of</strong> exposure <strong>of</strong> anorganism, found by experiment or observation, at which there is no biologically orstatistically significant increase in the frequency or severity <strong>of</strong> any adverse effects in theexposed population when compared to its appropriate control.“No observed effect concentration” or “NOEC” means the highest test concentration atwhich there is no statistically significant reduction in survival, growth, orreproduction/fecundity as compared to the laboratory control or reference sample.“Non-targeted compound" means a compound detected in a sample using a specificanalytical method that is not a targeted compound, a surrogate compound, a systemmonitoring compound or an internal standard compound (N.J.A.C. 7:26E-1.8).<strong>Ecological</strong> <strong>Evaluation</strong> <strong>Technical</strong> <strong>Guidance</strong> Document 14Version 1.2 8/29/12
“Parthenogenic” means that the unfertilized egg <strong>of</strong> a female <strong>of</strong> a given species developsinto a new individual <strong>of</strong> that species and does not require a male to fertilize the eggs forreproduction.“Pinelands” means any area consistent with the provisions <strong>of</strong> the Pinelands ProtectionAct, N.J.S.A. 13:18A-1 et seq. and any rules promulgated pursuant thereto, and withsection 502 <strong>of</strong> the National Parks and Recreation Act <strong>of</strong> 1978, 16 U.S.C. §4711.“Rare Species” means a group <strong>of</strong> organisms that is very uncommon or scarce. Thisdesignation may be applied to either a plant or animal taxon, and may be distinct from theterm “endangered" or “threatened species.""Receptor" means any human or other ecological component that is or may be affected bya contaminant from a contaminated site (N.J.A.C. 7:26E-1.8).“Receptor <strong>Evaluation</strong>” means the general and reporting requirements specified inN.J.A.C.7:26E -1.12 through 1.16.“Receptor <strong>Evaluation</strong> form” means the form required by the NJDEP pursuant toN.J.A.C.7:26E -1.12 (c) and (e).“Reference Area” means a habitat similar to the habitat being assessed but which is notcontaminated. The reference area may or may not be within the background area."Remediation standards" means the combination <strong>of</strong> numeric standards that establish alevel or concentration, and narrative standards, to which contaminants must be treated,removed or otherwise cleaned for soil, ground water or surface water, as provided by theDepartment pursuant to N.J.S.A. 58:10B-12, in order to meet the health risk orenvironmental standards (N.J.A.C. 7:26E-1.8).“Riparian” means <strong>of</strong>, pertaining to, or situated or dwelling on the bank <strong>of</strong> a river or otherbody <strong>of</strong> water.“Risk management strategy” or “risk management decision” or “RMD” means a decisionto remediate an ESNR to a level other than the calculated ecological risk-basedremediation goal by taking into account risk reduction, habitat destruction, preservationand restoration, and technical impracticability. A risk management decision may result inremediation to a higher numeric level, which may not be protective <strong>of</strong> all receptors, topreserve certain habitats that are hard to restore but ultimately results in significant riskreduction.“Saline waters” means waters having salinities generally greater than 3.5 parts perthousand at mean high tide (N.J.A.C. 7:9B-1.4).“Sediment” means unconsolidated material that has been deposited from water and settlesto the bottom <strong>of</strong> a surface water body or within a wetland.“Sediment pore water” means the water located in the interstitial space between thesediment solid-phase particles.“Sediment quality triad approach” means the use <strong>of</strong> benthic macroinvertebrate surveys,sediment chemistry and sediment toxicity tests to provide a measure <strong>of</strong> ecosystem health.<strong>Ecological</strong> <strong>Evaluation</strong> <strong>Technical</strong> <strong>Guidance</strong> Document 15Version 1.2 8/29/12
“Site investigation” means the collection and evaluation <strong>of</strong> data adequate to determinewhether or not discharged contaminants exist at a site or have migrated or are migratingfrom the site at levels in excess <strong>of</strong> the applicable remediation standards. A siteinvestigation shall be developed based upon the information collected pursuant to thepreliminary assessment. The requirements <strong>of</strong> a site investigation are set forth at N.J.A.C.7:26E-3 (N.J.A.C. 7:26E-1.8)."Surface water" means water defined as surface water pursuant to the Surface WaterQuality Regulations, N.J.A.C. 7:9B (N.J.A.C. 7:26E-1.8).“Taxonomic class” means the group an organism is placed into by the orderlyclassification <strong>of</strong> plants and animals according to their presumed natural relationshipsbased on similarities <strong>of</strong> structure, origin, etc.“<strong>Technical</strong> Impracticability” means a condition where remediation to the applicableNJDEP standards is not feasible from an engineering perspective if: current engineeringmethods or best available technologies designed to meet the applicable standards cannotbe reasonably implemented. TI determinations can be applied to an entire site or a portionthere<strong>of</strong>. The TI determination does not relieve the responsible party <strong>of</strong> their ultimateresponsibility <strong>of</strong> achieving applicable NJDEP standards. If such a determination is made,but subsequent advances in remedial technologies or changes in site conditions makeachievement <strong>of</strong> the standards practicable, NJDEP reserves the authority to modify the TIdetermination, as appropriate. Impracticability does not equate to “no action.” When aremedial action is deemed impractical, the remediating party must put in place othermeasures to safeguard potential receptors in accordance with N.J.A.C. 7:26E-5.1(e).(NJDEP <strong>Technical</strong> Impracticability <strong>Guidance</strong> for Groundwater Document)."Tentatively identified compound" or "TIC" means a non-targeted compound detected ina sample using a GC/MS analytical method which has been tentatively identified using amass spectral library search. An estimated concentration <strong>of</strong> the TIC is also determined(N.J.A.C. 7:26E-1.8).“Threatened species” means a species that may become endangered if conditionssurrounding it begin to or continue to deteriorate. Thus, a threatened species is one that isalready vulnerable as a result <strong>of</strong>, for example, small population size, restricted range,narrow habitat affinities, significant population decline, etc.“Toxicity reference value” or “TRV” means a dose above which ecologically relevanteffects might occur to wildlife species following chronic dietary exposure and belowwhich it is reasonably expected that such effects will not occur.“Wetlands” means those areas that are inundated or saturated by surface or groundwaterat a frequency or duration sufficient to support, and that under normal circumstances doessupport, a prevalence <strong>of</strong> vegetation typically adapted for life in saturated soil conditions.Wetlands generally include swamps, marshes, bogs, and similar areas (40 CFR 230.3).<strong>Ecological</strong> <strong>Evaluation</strong> <strong>Technical</strong> <strong>Guidance</strong> Document 16Version 1.2 8/29/12
5.0 <strong>Technical</strong> <strong>Guidance</strong> for Preparing <strong>Ecological</strong> <strong>Evaluation</strong>sThe purpose <strong>of</strong> the EE is to assess actual or potential adverse ecological effects onwildlife and plants in ESNRs resulting from site-related contamination and in certaincircumstances other contamination not related to the site such as historic fill material anddredged materials (Section 6.4.8). During the EE, the site is examined for the cooccurrence<strong>of</strong> the following:(1) ESNRs on, adjacent to, or potentially impacted by the site;(2) the presence <strong>of</strong> COPECs at the site or AOC and in the ESNRs; and(3) the presence <strong>of</strong> a contaminant migration pathway from the site to the ESNR, orevidence <strong>of</strong> contaminated material having been placed directly into an ESNR.The outcome <strong>of</strong> the EE will be a recommendation either to conduct an ERA or to notconduct further ecological evaluation. The investigator must be experienced in the use <strong>of</strong>techniques and methodologies for conducting ERAs in accordance with appropriateUSEPA guidance, which includes, but is not limited to ERAGS (C.58:10C-16 (c)).The EE is an iterative process beginning with the EE that is conducted pursuant toN.J.A.C. 7:26E-1.16, and finishing with conclusions regarding the need for an ERAconducted pursuant to N.J.A.C. 7:26E.4.8.5.1 <strong>Ecological</strong> <strong>Evaluation</strong> Pursuant to N.J.A.C. 7:26E-1.16Pursuant to N.J.A.C. 7:26E-1.16 and in accordance with Section 5.2, an EE must beinitiated in the SI phase with the initial results <strong>of</strong> the EE submitted as part <strong>of</strong> theReceptor <strong>Evaluation</strong> Form and supporting documentation pursuant to N.J.A.C. 7:26E-1.16. The EE documents the following:(1) whether ESNRs are present on or adjacent to the site or are in locationsreceiving discharges from the site;(2) a preliminary identification <strong>of</strong> whether the site contains any contaminantsabove ESCs (based upon existing data if available); and(3) an initial assessment <strong>of</strong> possible contaminant migration pathways.Much <strong>of</strong> this stage <strong>of</strong> the EE process can be completed using desk-top information,although a qualitative field survey should be conducted to verify the presence <strong>of</strong>ESNRs.5.2 <strong>Ecological</strong> <strong>Evaluation</strong> Pursuant to N.J.A.C. 7:26E-4.8Under N.J.A.C. 7:26E-1.16, the first two steps <strong>of</strong> the <strong>Ecological</strong> <strong>Evaluation</strong> (EE) areconducted to verify the presence <strong>of</strong> ESNRs and COPECs (above ESCs at the AOC orESNR). After this stage, if ESNRs and COPECs are present, then pursuant toN.J.A.C. 7:26E-4.8(a) and 4.8(b) sampling within the potential migration pathwayand ESNR to support the EE may be conducted during the RI. At a minimum, theinvestigator must determine whether contaminant concentrations are present at theAOC in excess <strong>of</strong> ESCs or SWQS (N.J.A.C. 7:26E-1.16). Supplemental samplingspecific to that ESNR may be warranted to determine whether COPECs in excess <strong>of</strong>ESCs are present in the ESNR. The investigator may decide that food chainmodeling is appropriate as part <strong>of</strong> the completion <strong>of</strong> the EE. If food chain modelingwill be conducted as part <strong>of</strong> the EE, the modeling should use conservative input<strong>Ecological</strong> <strong>Evaluation</strong> <strong>Technical</strong> <strong>Guidance</strong> Document 17Version 1.2 8/29/12
parameters as specified in ERAGS (i.e., area use factor <strong>of</strong> 1 and maximumsoil/sediment concentration). Detailed procedures for conducting food chain analysiscan be found in Section 6.1.3.1.<strong>Guidance</strong> for the identification and sampling <strong>of</strong> ESNRs, COPECs, and contaminantmigration pathways is provided below.5.2.1 Environmentally Sensitive Natural ResourcesPursuant to N.J.A.C. 7:26E-1.16, the investigator must identify whether ESNRsare present on the site or area <strong>of</strong> concern, adjacent to the site or area <strong>of</strong> concern,or may be, have been, or are impacted by contamination from the site or area <strong>of</strong>Concern. ESNRs are habitats where concern for plant and wildlife exposure tosite COPECs is paramount. Man-made features, such as ditches, waste lagoons,and impoundments should be evaluated to determine whether they function asESNRs or they discharge to an ESNR. Use the following information sources toidentify ESNRs: NJDEP’s i-Map NJ DEP, available with user guidance athttp://njgin.state.nj.us/dep/DEP_iMapNJDEP/viewer.htm with links toInternet mapping applications; NJDEP’s “Landscape Project” with data downloads available athttp://www.state.nj.us/dep/fgw/ensp/landscape;NJ Natural Heritage Program, information on rare, threatened and endangeredspecies, http://www.state.nj.us/dep/parksandforests/natural/heritageA qualitative habitat or vegetative community survey should be performed toprovide a general description <strong>of</strong> land use, to identify the ESNRs present at thesite, and to confirm the information obtained from the NJDEP’s GeographicInformation System (GIS). The investigator should be familiar with state andfederal guidance and literature references for plant community assessment, suchas the Federal Manual for Identifying and Delineating Jurisdictional Wetlands(Federal Interagency Committee for Wetland Delineation, 1989). The dominantplant species for each vegetative stratum (e.g., canopy, shrub, vine, andherbaceous layer) should be visually estimated as per standard procedure. Thequalitative survey should be conducted during the prime growing season ifpossible (May to September) to assess indicators <strong>of</strong> stressed vegetation, such asstunted growth, chlorosis, brown or drying leaf tips, barren soil. Absence <strong>of</strong>stressed vegetation does not mean absence <strong>of</strong> contamination or impact.The investigator should document biota observed or expected to use or inhabiteach ESNR for any period <strong>of</strong> time, whether year-round or during the breeding,foraging, resting, migration or wintering seasons. Wildlife should be identified bytaxonomic class, common and scientific names, feeding guild, and location <strong>of</strong>residence among the habitat types. Wildlife should be identified based on actualsightings or evidence (e.g., tracks, scat, nests, song, and call). Expected wildlifeshould be based on literature reviews or pr<strong>of</strong>essional judgment.<strong>Ecological</strong> <strong>Evaluation</strong> <strong>Technical</strong> <strong>Guidance</strong> Document 18Version 1.2 8/29/12
A formal wetland delineation or functional assessment may be appropriate on asite-specific basis in accordance with the <strong>New</strong> <strong>Jersey</strong> Freshwater Protection ActRules, N.J.A.C.7:26A. See Section 6.4.1 for additional information.If ESNRs do not exist, it is not necessary to complete the requirements <strong>of</strong>Sections 5.2 through 5.4, and documentation <strong>of</strong> the lack <strong>of</strong> ESNRs shouldcomprise the EE report. If ESNRs exist, complete Sections 5.2 through 5.5.The EE submitted as part <strong>of</strong> the Receptor <strong>Evaluation</strong> should document thepresence <strong>of</strong> ESNRs on-site, adjacent to the site, or in areas potentially receivingcontaminants from the site. The location <strong>of</strong> ESNRs should be presenteddiagrammatically using maps and figures showing the site.5.2.2 Contaminants <strong>of</strong> Potential <strong>Ecological</strong> ConcernPursuant to N.J.A.C. 7:26E-1.16(b) and 4.8(c), the investigator must identify thepresence <strong>of</strong> Contaminants <strong>of</strong> Potential Environmental Concern (COPEC).Compare all surface water, sediment, soil, and groundwater (from monitoringwells or piezometers proximal to ESNRs) data collected from contaminantmigration pathways and ESNRs to ESCs and standards in the most recent version<strong>of</strong> the NJDEP <strong>Ecological</strong> Screening Criteria Table, available athttp://www.nj.gov/dep/srp/guidance/ecoscreening/ (Section 5.4). At a minimum,those contaminants that exceed the ESC or standards or do not have an ESCshould be considered COPECs.If all ESNR contaminant concentrations are less than the ecological screeningcriteria, and contaminants without ecological screening criteria are not present,then further ecological investigation is not required.If any ESNR contaminant concentrations exceed ecological screening criteria, orcontaminants without ecological screening criteria are present, then furtherecological investigation is required. Tentatively identified compounds (TICs)must be addressed pursuant to N.J.A.C. 7:26E-2.1(e). Further investigation <strong>of</strong>TICs may include a statistical summary (i.e. frequency <strong>of</strong> detection, range <strong>of</strong>detection, etc.), comparison with background data, use <strong>of</strong> specialty analyticalservices, or site-specific testing such as toxicity testing to determine whether theTIC constitutes a COPEC. TICs which are frequently detected or are detected athigh concentrations should be carried forward in the ERA process.The investigator should ensure that the laboratory meets the method detectionlimits (MDL) as specified by the analytical method and should highlight wherethe sample analytical detection limits exceed the ESC and standards for the siteCOPECs. For the initial screening, it is standard practice for the investigator touse one half <strong>of</strong> the MDL for comparison to ESCs in those circumstances wherethe detection limit exceeds the ESC and the analytical result is nondetect.5.2.3 Contaminant Migration PathwaysPursuant to N.J.A.C. 7:26E-4.8(a) and 4.8(b), the investigator must identifycurrent and historic actual and potential contaminant migration pathways toESNRs, including the possibility that direct dumping or discharge may beoccurring or may have occurred historically (possibly before site records<strong>Ecological</strong> <strong>Evaluation</strong> <strong>Technical</strong> <strong>Guidance</strong> Document 19Version 1.2 8/29/12
document otherwise). The investigator should evaluate site topography,contaminant chemical characteristics, fate and transport mechanisms, and sitefeatures or practices that may facilitate or have facilitated contaminant migration.Current and historic presence <strong>of</strong> surface or subsurface piping beds, drains, ditches,lagoons, and locations where current or historic direct discharges could haveoccurred, such as from over-water or over-shoreline product transfers, dumpingfrom trucks, etc., should be considered.The investigator should identify direct evidence <strong>of</strong> contaminant migration byvisual indicators. Examples <strong>of</strong> direct observations <strong>of</strong> contaminant migrationinclude, but are not limited to, stressed, stunted, chlorotic, and dead vegetation,discolored soil, sediment, or water, acute effects on biota, absence <strong>of</strong> biota (plantsand animals) in a specified area <strong>of</strong> the ESNR that would be expected as comparedto a similar unimpacted ESNR, presence <strong>of</strong> seeps, sheens, discharges, andevidence <strong>of</strong> surface erosion.The investigator should identify potential contaminant migration pathways. Suchpathways may include, but are not limited to, contaminant migration during stormevents, tidal reversals, discharge <strong>of</strong> contaminated groundwater to surface water,food chain transfer, and the potential for direct disposal or discharge <strong>of</strong> siteCOPECs to ESNRs. An example <strong>of</strong> potential migration is where a riparian area orfloodplain surrounding a contaminated surface water body may becomecontaminated during flood events.The investigator should ensure that all contaminant migration pathways have beenconsidered in the sampling plan design and data have been collected inappropriate ESNRs. Data gaps should be identified in the EE report (Section5.5(b)ii).5.3 Recommended Sample Collection in Support <strong>of</strong> <strong>Ecological</strong> <strong>Evaluation</strong>sGenerally, the goals <strong>of</strong> a surface water, sediment or soil sampling program includepreliminary and definitive determination <strong>of</strong> the nature and areal extent <strong>of</strong>contamination and identification <strong>of</strong> areas <strong>of</strong> highest contamination. Data are also tobe gathered in support <strong>of</strong> ERAs, long-term monitoring, or for sediment transport anddeposition modeling or contaminant migration or natural attenuation. The surfacewater, sediment or soil sampling plan must be a component <strong>of</strong> the SI or RI WorkPlan, and must be prepared pursuant to N.J.A.C. 7:26E and the NJDEP FieldSampling Procedures Manual (FSPM) (NJDEP, August 2005 or most recent versionat http://www.nj.gov/dep/srp/guidance/fspm/). Site-specific details regarding thestudy objectives, data quality objectives (DQO), sampling methodology, location, anddepth <strong>of</strong> samples must be specified, as well as field and laboratory quality assuranceand quality control (QA/QC) procedures (N.J.A.C. 7:26E). <strong>Guidance</strong> and specialconsiderations for designing a surface water, sediment, and soil sampling scheme areprovided herein to supplement and highlight the regulatory requirements and FSPMguidance; the reader is referred to these documents for a comprehensive treatment <strong>of</strong>the subject. The reader is referred to USEPA’s Sediment Sampling Quality AssuranceUser’s Guide (USEPA, 1985a), Methods for Collection, Storage and Manipulation <strong>of</strong>Sediments for Chemical and Toxicological Analyses: <strong>Technical</strong> Manual (USEPA,<strong>Ecological</strong> <strong>Evaluation</strong> <strong>Technical</strong> <strong>Guidance</strong> Document 20Version 1.2 8/29/12
2001) and the FSPM (NJDEP, 2005) for guidance on statistically determining theappropriate number <strong>of</strong> samples.5.3.1 When to Collect SamplesWhen contaminants are found in on-site media in excess <strong>of</strong> the ESC and ESNRsare on, adjacent to or potentially impacted by the site, as defined at N.J.A.C.7:26E-1.8, environmental samples are to be collected in the potential migrationpathways and in the ESNRs, as appropriate. N.J.A.C. 7:26E-1.8 definescontaminated sites as all portions <strong>of</strong> environmental media at a site and anylocation where contamination is emanating, or which has emanated, therefrom,that contain one or more contaminants at a concentration which fails to satisfy anyapplicable remediation standard. If the investigator can provide documentationthat site-related contamination in surface water, sediment, wetlands, or soil inESNRs is unlikely, based on site-specific conditions, site history, etc., thenadditional sampling <strong>of</strong> ESNR or contaminant migration pathways may not berequired, refer to Figure 3-1.Samples should be collected in ESNRs and contaminant migration pathwaysunder any <strong>of</strong> the following conditions:(1) if known historical discharges have occurred or on-going dischargesare occurring, as determined pursuant to Section 5.2.3;(2) if there is a presence <strong>of</strong> stressed vegetation, sheens, seeps, discoloredsoil or sediment along the shoreline or on the surface water body orwetland;(3) if there is evidence <strong>of</strong> stream impacts from historical dischargesincluding historical ecological studies documenting differences inorganism population density and diversity in areas potentiallyimpacted by the site relative to areas not impacted by the site; or(4) if there is a groundwater discharge to surface water or a wetland, withcontaminants originating on site above the applicable SWQS or ESC.Sampling must be designed to account for seasonal or short-term flow and waterquality fluctuations caused by dry- versus wet-weather flow, system hydraulics(obtaining flow-proportioned samples where applicable), and potentialcontaminant characteristics (e.g., density and solubility) (N.J.A.C. 7:26E-3.6(b)).In addition to other required analyses, sediments must also be analyzed for totalorganic carbon (TOC), pH, and particle size (N.J.A.C. 7:26E-3.6(b)). These dataare required to develop appropriate remediation standards. Depending on the type<strong>of</strong> contaminant, type <strong>of</strong> discharge (e.g., surficial and subsurface), and mediapotentially impacted, the sampling methods and depth will vary as indicatedbelow.5.3.2 Where to Collect SamplesThe following sections provide general and media-specific guidance for theselection <strong>of</strong> sampling locations.<strong>Ecological</strong> <strong>Evaluation</strong> <strong>Technical</strong> <strong>Guidance</strong> Document 21Version 1.2 8/29/12
5.3.2.1 Potential Contaminant Migration PathwaysI. Ditches and SwalesDitches and swales that do not contain standing or flowing water should besampled as indicated in Section 5.3.2.2 II or III. Ditches and swales thatcontain standing water should be sampled as indicated in Section 5.3.2.2 I. A.Ditches and swales that contain flowing water should be sampled as indicatedin Section 5.3.2.2 I. B.II. Overland FlowWhen the potential migration pathway consists <strong>of</strong> general overland flow withno discernable ditches or swales, samples should be collected as indicated inSection 5.3.2.2 III.III. GroundwaterWhen the potential migration pathway consists <strong>of</strong> groundwater, samplesshould be collected in accordance with N.J.A.C. 7:26E-3.5, Site investigationgroundwater,and the relevant technical guidance. Samples from the mostdowngradient monitoring wells or piezometers, or samples in the closestproximity to ESNRs will be considered indicative <strong>of</strong> the migration pathway.5.3.2.2 Environmentally Sensitive Natural ResourcesI. Aquatic SystemsIn aquatic systems, the areas <strong>of</strong> greatest contamination will generally occur indepositional areas, thus these should be specifically targeted by the samplingplan. Such depositional areas are generally characterized by slow-movingwater where fine sediments tend to accumulate (e.g., pool areas, river bends).Sediment samples collected for chemical analysis, toxicity testing, and benthiccommunity surveys should be spatially and temporally collocated. Sedimentsamples should be collected in a manner to avoid the loss <strong>of</strong> fine-grainedsediments. Surface water and sediment samples should be spatially andtemporally collocated. Surface water samples should be collected beforesediment samples to avoid suspended sediments in surface-water samples.Samples should be collected in downstream areas first, and then successivelyat upstream sampling locations.A. Standing water areas (e.g., ponds, lakes, wetlands, surface impoundments,lagoons, storm water detention ponds, fire ponds, and excavations, naturaldepressions and diked areas that can accumulate water) should be sampledas follows:1. Collect a minimum <strong>of</strong> three surface water samples and three sedimentsamples in each area where there is evidence <strong>of</strong> a historical or ongoingdischarge, including but not limited to, stressed vegetation, sheens,seeps, discolored soil or sediment along the shoreline or in a wetland, orother evidence <strong>of</strong> a discharge;<strong>Ecological</strong> <strong>Evaluation</strong> <strong>Technical</strong> <strong>Guidance</strong> Document 22Version 1.2 8/29/12
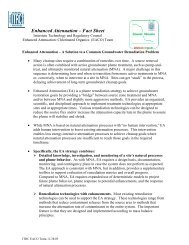
2. Collect a minimum <strong>of</strong> one surface water and sediment sample at eachinflow and outflow area; and3. Collect a minimum <strong>of</strong> one surface water and sediment sample at eachdepositional area where sediments may be expected to accumulate.B. Flowing water areas (e.g., rivers, streams, creeks, wetlands, culverts, andswales) should be sampled as follows: Collect a minimum <strong>of</strong> onesediment sample where sediments are expected to accumulate and aminimum <strong>of</strong> one surface-water sample under low flow (base flow) andhigh flow conditions as follows:1. Collect a minimum <strong>of</strong> one surface-water and one sediment sample upstream <strong>of</strong> the point or area <strong>of</strong> discharge;2. Collect a minimum <strong>of</strong> one surface-water and one sediment sample downstream <strong>of</strong> the point or area <strong>of</strong> discharge; and3. Collect a minimum <strong>of</strong> one surface-water and one sediment sample at thepoint or area <strong>of</strong> discharge.A commonly used approach to locating sediment samples is as follows: Thestream location adjacent to the contaminated site most likely to receivecontaminant input via the contaminant migration pathway is considered theinitial sample point. The study region is divided into linear segments andsample transects are located systematically within each segment; the length<strong>of</strong> the segments and distance between transects increases with increasingdistance downstream. This approach is depicted in Figure 5-1, a diagram <strong>of</strong>a sampling plan indicating 15 sediment samples per segment region. In thisexample, the first segment is from zero to one km, the second from one tothree km, and third from three to seven km. The sampling transects(indicated by dashed lines) are located at 1/4, 1/2, and 3/4 the distance alongeach segment. Sample points (indicated by five dots) are located along thetransects at 1/6, 1/3, 1/2, 2/3, and 5/6 the distance bank to bank (USEPA,1985a). The distance from bank to bank is measured from the mean highwatermark.If a potential for sediment deposition exists, then samples should also becollected from the surrounding floodplain. The actual number and location<strong>of</strong> sample points will be decided on a case-by-case basis, based on the studyobjectives, water-body dimensions, flow conditions, substrate conditions,availability <strong>of</strong> previous data, etc.<strong>Ecological</strong> <strong>Evaluation</strong> <strong>Technical</strong> <strong>Guidance</strong> Document 23Version 1.2 8/29/12
71 0Sampling pointsSampling transectsFigure 5-1: Sketch map <strong>of</strong> river showing stratified regions and sampling points.C. Tidal water areas (e.g., rivers, streams, creeks, wetlands, culverts, andswales) should be sampled as follows. Collect a minimum <strong>of</strong> onesediment sample where sediments are expected to accumulate and aminimum <strong>of</strong> one surface water sample under low and high tideconditions as follows:1. Collect a minimum <strong>of</strong> one surface-water and one sediment sample upstream <strong>of</strong> the point or area <strong>of</strong> discharge;2. Collect a minimum <strong>of</strong> one surface-water and one sediment sample downstream <strong>of</strong> the point or area <strong>of</strong> discharge;3. Collect a minimum <strong>of</strong> one surface-water and one sediment sample at thepoint or area <strong>of</strong> discharge; and4. If a potential for sediment deposition exists, then samples should also becollected from the surrounding floodplain.II. WetlandsWetlands (e.g., emergent, shrub-scrub and forested) should be sampled asfollows:A. Collect a minimum <strong>of</strong> one surface-water (if present) and one sedimentsample at the point or area <strong>of</strong> discharge;B. Collect a minimum <strong>of</strong> one surface-water and one sediment sampledowngradient <strong>of</strong> the point or area <strong>of</strong> discharge; andC. Collect a minimum <strong>of</strong> one surface-water and one sediment sample at adepression or depositional area within the wetland.III. UplandsUpland areas containing ESNRs should be sampled as follows:A. Collect a minimum <strong>of</strong> one soil sample at the point or area <strong>of</strong> discharge;<strong>Ecological</strong> <strong>Evaluation</strong> <strong>Technical</strong> <strong>Guidance</strong> Document 24Version 1.2 8/29/12
B. Collect a minimum <strong>of</strong> one soil sample topographically downgradient <strong>of</strong>the point or area <strong>of</strong> discharge; andC. Collect a minimum <strong>of</strong> one soil sample at a depression, if present.5.3.3 How to Collect SamplesThe following sections review the methodologies to be employed in collectingenvironmental samples to be used in the preparation <strong>of</strong> EEs. Also see Section5.5(a)iii and (a)iv for additional parameters required to be reported.5.3.3.1 Soils and SedimentsWhen COPECs are potentially present because <strong>of</strong> a surface discharge,samples should be collected from the zero to six inch interval, except forvolatile organic compounds (VOC), which should be collected from the six totwelve inch interval. When COPECs are potentially present because <strong>of</strong> asubsurface discharge or groundwater migration pathway or the accretion <strong>of</strong>cleaner sediments over contaminated sediments may have occurred, samplesshould be collected from the point <strong>of</strong> discharge in soils or sediment and fromboth the zero to six inch and six to twelve inch interval in sediments,respectively. If historical evidence indicates the potential for contamination tobe present at intervals greater than six inches, sampling at depth also shouldbe considered to evaluate potential future risks from the sediments,particularly if future dredging or scouring is likely to occur. All soil andsediment must be collected as discrete rather than composite samples toascertain a more representative contaminant pr<strong>of</strong>ile (N.J.A.C. 7:26E-3.4(a)2).If contaminants are found above the ESC, then delineation must be performedin accordance with N.J.A.C. 7:26E-4.8(c)1.5.3.3.2 Surface WaterSurface water samples should be collected in the following manner:(1) When COPECs are potentially present because <strong>of</strong> a seep or surfacedischarge, samples should consist <strong>of</strong> a seep/discharge sample and agrab surface water sample adjacent to the point <strong>of</strong> discharge;(2) When COPECs are potentially present because <strong>of</strong> sedimentcontamination or groundwater migration pathway, samples should becollected from the zero to six inch interval directly above thesediments; and(3) For general water contamination with no obvious discharge source,samples should be collected from the mid-column <strong>of</strong> water. Forcertain metals, the ESC are based on either total or dissolvedconcentration. For EE purposes, both dissolved and totalconcentrations provide useful information regardless <strong>of</strong> what the ESCis based on. Therefore, both filtered and non-filtered samples shouldbe collected for metals analysis.<strong>Ecological</strong> <strong>Evaluation</strong> <strong>Technical</strong> <strong>Guidance</strong> Document 25Version 1.2 8/29/12
5.3.4 Background ConsiderationsIt is important to establish background contaminant levels in sediment, surfacewater, and soil on or near the site, but not influenced by the site to:(1) refine the COPEC list;(2) help determine if the contaminants are site-related;(3) aid in the assessment <strong>of</strong> the site’s contaminant levels relative to theregional contaminant levels; and(4) develop RMD goals for ESNRs.Many <strong>of</strong> the state’s soils, water bodies, and wetlands, especially in urban andindustrial settings, have become contaminated by historic point and non-pointdischarges (diffuse anthropogenic pollution), making it difficult to distinguishbetween contaminants from the site and <strong>of</strong>f-site sources. Additionally, in tidalwater bodies, upgradient and downgradient sediments and surface water can becontaminated by the site because <strong>of</strong> tidal influences, which can add to thecomplexity <strong>of</strong> determining background contaminant concentrations. However, itis paramount that the investigator attempt to distinguish between site-related anddiffuse anthropogenic contamination or contamination from <strong>of</strong>fsite sources. Ifpotential sources <strong>of</strong> contamination are present upgradient <strong>of</strong> the site, and it isbelieved that these sources have contributed to the contamination detected on-site,these upgradient areas should be sampled, and pr<strong>of</strong>essional judgment shoulddictate how these data are to be interpreted and used. The investigator maychoose to supplement data collected from background locations with data fromrelevant and appropriate regional databases. In circumstances where backgrounddata cannot be collected, these databases may serve as the source <strong>of</strong> backgrounddata.For the determination <strong>of</strong> background contaminant levels in sediment and surfacewater, samples should be collected from a minimum <strong>of</strong> three to five sedimentlocations (the larger number <strong>of</strong> samples is recommended because <strong>of</strong> sedimentheterogeneity) from the zero to six inch interval, and other intervals as appropriateto correspond to site-related samples. For tidal water bodies, upstream areasinfluenced by tides should be sampled at locations upstream <strong>of</strong> any mixing zoneto assess background contaminant levels.For the determination <strong>of</strong> background contaminant levels in soils, the investigatorshould collect a minimum <strong>of</strong> three to five soil samples from the zero to six inchdepth interval and other six inch intervals as appropriate.All background area samples should be collected from areas outside the site’spotential influence. The samples should not be collected from locations directlyinfluenced by or in proximity to other obvious sources <strong>of</strong> contamination (e.g.,other contaminated sites, sewer and storm-water outfalls, tributaries, and otherpoint and nonpoint source discharges). Background area locations should be <strong>of</strong>similar physical, chemical, and biological structure (e.g., similar TOC, grain size,etc.), and at a minimum should receive the same chemical analyses as site-relatedsamples. For a relatively small background area sample size, the mean and range<strong>of</strong> background contaminant concentrations should be used for comparison with<strong>Ecological</strong> <strong>Evaluation</strong> <strong>Technical</strong> <strong>Guidance</strong> Document 26Version 1.2 8/29/12
individual sample points from site data, based on pr<strong>of</strong>essional judgment. Forlarger background area sample sizes, the investigator is referred to USEPA(1995a, 2002a, 2009a, and 2009b) for guidance on statistical treatment <strong>of</strong> the data.5.4 Comparison <strong>of</strong> Sample Data with <strong>Ecological</strong> Screening CriteriaPursuant to Sections 3.1 and 5.3, et seq., all individual sample data should becompared to the ecological screening criteria (ESC) found in the NJDEP <strong>Ecological</strong>Screening Criteria Table (March 10, 2009 or most current version) athttp://www.nj.gov/dep/srp/guidance/ecoscreening/. With the exception <strong>of</strong> the surfacewater quality standards (SWQS) (N.J.A.C. 7:9B), the ESC are not promulgatedstandards but are to be used as screening values in ecological assessments. Whenmultiple ESCs are provided for the same contaminant and media, generally the mostconservative criterion is used; however, the investigator may choose to use a differentvalue based on site conditions (e.g. study is based on a receptor not expected to befound at the site). A rationale should be provided for using ESCs other than the mostconservative value presented. This table does not preclude the investigator fromdeveloping or proposing alternate ESC for contaminants with ESCs on the NJDEPtable, or from proposing an ESC for contaminants without an ESC on the NJDEPtable. The most recent version <strong>of</strong> the cited ESC should be used. In the EE, all data,along with the maximum and mean concentrations <strong>of</strong> site-related and backgroundcontaminant sample data, are compared to ESCs. No contaminants can be excludedfrom the evaluation without adequate justification, which will be presented in the EEconclusions. Until EE conclusions are presented, contaminants may not be excludedfrom consideration based on comparison with background contaminant data becausean evaluation <strong>of</strong> all risk associated with the site is appropriate at this stage. The ESCwere developed based on benthic community studies and, while intentionallyconservative, do not directly address bioaccumulation, biomagnification, and foodchain toxicity to fish, birds, and mammals. When concentrations <strong>of</strong> knownbiomagnifying contaminants, including but not limited to, dioxins, furans, PCBs,organochlorine pesticides, mercury, and selenium are present at or below criteria, theinvestigator is given the flexibility based on pr<strong>of</strong>essional judgment to carrybioaccumulative constituents into the ERA for further evaluation.5.4.1 Potential Migration PathwaysI. Ditches and SwalesAnalytical data from ditches and swales that do not contain standing or flowingwater should be compared to ESC as indicated in Section 5.4.4 (upland), andanalytical data from ditches and swales that contain standing or flowing watershould be compared to ESC as indicated in Section 5.4.2 (surface water bodies).Analytical data from ditches and swales that are periodically or seasonallyflooded should be compared to ESC as indicated in Section 5.4.3 (wetlands).II. Overland FlowAnalytical data from areas <strong>of</strong> general overland flow with no discernable ditches orswales should be compared to ESC as indicated in Section 5.4.4 (upland).<strong>Ecological</strong> <strong>Evaluation</strong> <strong>Technical</strong> <strong>Guidance</strong> Document 27Version 1.2 8/29/12
III. GroundwaterAnalytical data from groundwater that could potentially flow into a surface waterbody or wetland should be compared to ESC as indicated in Section 5.4.2 (surfacewater bodies). If the most recent data from the most downgradient groundwatermonitoring well or piezometer are below the SWQS or ESC, then a surface waterinvestigation will not be required for this potential migration pathway.5.4.2 Surface Water BodiesI. FreshwaterA. Surface WaterAnalytical data from freshwater surface water, whether standing or flowing,should be compared to the SWQS freshwater chronic standards. Where SWQSdo not exist for a contaminant, the analytical data should be compared to ESC forfreshwater on the NJDEP ESC Table referenced above. If the SWQS and theESC Table do not contain ESC for a contaminant, then the investigator shouldpropose an alternate ESC based on peer reviewed literature or develop a sitespecificESC.B. SedimentAnalytical data from freshwater sediment should be compared to the sedimentESC for freshwater sediment on the NJDEP ESC Table referenced above. Whereboth an LEL (Lowest Effects Level) and SEL (Severe Effects Level) areprovided, the LEL is to be used for screening purposes in the EE. If the NJDEPESC Table does not contain ESC for a contaminant, then the investigator shouldpropose an alternate ESC based on peer reviewed literature or develop a sitespecificESC.II. Saline WatersA. Surface WaterAnalytical data from saline surface water, whether standing or flowing, should becompared to the SWQS saline water aquatic chronic standards. Where SWQS donot exist for a contaminant, the analytical data should be compared to ESC forsaline water on the NJDEP ESC Table referenced above. If the SWQS and theNJDEP ESC Table do not contain ESC for a contaminant, then the investigatorshould propose an alternate ESC based on peer reviewed literature or develop asite-specific ESC.B. SedimentAnalytical data from saline sediment should be compared to the sediment ESC formarine/estuarine sediment on the NJDEP ESC Table referenced above. Whereboth an ER-L (Effects Range-Low) and ER-M (Effects Range-Median) areprovided, the ER-L is to be used for screening purposes in the EE. If the NJDEPESC Table does not contain ESC for a contaminant, then the investigator shouldpropose an alternate ESC based on peer reviewed literature or develop a sitespecificESC.<strong>Ecological</strong> <strong>Evaluation</strong> <strong>Technical</strong> <strong>Guidance</strong> Document 28Version 1.2 8/29/12
5.4.3 WetlandsMedia in a wetland can sometimes act as a soil or sediment. In an area wherethere is constant standing or flowing water, the medium should be consideredsediment; therefore, sediment ESC would apply. In a wetland where the mediumis not covered with standing or flowing water, the medium should be consideredsoil; therefore, soil ESC would apply. In an area that is periodically or seasonallyflooded, the medium can be considered soil or sediment. If an area supportsbenthos for part <strong>of</strong> the year or acts as a vernal pool, or if it is adjacent to a surfacewater body and can support aquatic organisms that move into the area duringflooding episodes, then the medium should be considered sediment. As a result,some areas will be considered sediment for part <strong>of</strong> the year and soil for theremainder <strong>of</strong> the year; therefore, both the sediment and soil ESC would apply.I. FreshwaterA. Surface WaterAnalytical data from surface water within a freshwater wetland should becompared to ESC as indicated in Section 5.4.2 I. A.B. Sediment and SoilAnalytical data from sediment within a freshwater wetland should be compared toESC as indicated in Section 5.4.2 I.B. Analytical data from soil within afreshwater wetland should be compared to ESC as indicated in Section 5.4.4.Substrate that acts as sediment during a portion <strong>of</strong> the year and soil during aportion <strong>of</strong> the year should be compared to ESC for both sediment and soil inSection 5.4.2 I.B., and Section 5.4.4.II. Saline WatersA. Surface WaterAnalytical data from surface water within a marine/estuarine wetland should becompared to ESC as indicated in Section 5.4.2 II. A.B. Sediment and SoilAnalytical data from sediment within a marine/estuarine wetland should becompared to ESC as indicated in Section 5.4.2 II.B. Analytical data from soilwithin a marine/estuarine wetland should be compared to ESC as indicated inSection 5.4.4. Substrate that acts as sediment during part <strong>of</strong> the year and soilduring part <strong>of</strong> the year, should be compared to ESC for both sediment and soil asindicated in Sections 5.4.2 II. B. and 5.4.4.5.4.4 UplandsAnalytical data from upland soil should be compared to the ESC for soil on theNJDEP ESC Table referenced above. If the NJDEP ESC Table does not containESC for a contaminant, then the investigator should develop or proposealternative ESC. Methods for developing ESC for soils can be found in USEPA2011 (EcoSSLs http://www.epa.gov/ecotox/ecossl/).<strong>Ecological</strong> <strong>Evaluation</strong> <strong>Technical</strong> <strong>Guidance</strong> Document 29Version 1.2 8/29/12
5.5 <strong>Ecological</strong> <strong>Evaluation</strong> ReportThe EE must be submitted with the Site Investigation Report (N.J.A.C. 7:26E-1.16).The EE must document the presence or absence <strong>of</strong> ESNRs, COPECs, andcontaminant migration pathways (N.J.A.C. 7:26E-4.8(a) and 4.8(b)). The report mustconform to N.J.A.C.7:26E-1.6(b), 1.16, 3.13, and 4.8. Additionally, the report must:(a) Present all data and highlight exceedances <strong>of</strong> the ESC from ESNRs orcontaminant migration pathways in chemical data boxes on a figure showing theESNRs. Map and label the locations and boundaries <strong>of</strong> the ESNRs to estimatetheir size and location with respect to each contaminated site or AOC. Asappropriate, habitat or vegetative cover-type maps should be used. The datashould also be presented in tabular format, according to medium and chemicalfraction, and include TICs and contaminants without ESC (N.J.A.C. 7:26E-1.6(b)8).i. Other basic information to be illustrated on figures includes sample date, depth,and ESC. Other physical characteristics <strong>of</strong> the ESNRs that should be noted (asavailable) in text or figures include morphology, areal extent, flow, and tidalinformation, depth, discharge points, etc.ii. MDLs must be included for all analytical data (N.J.A.C. 7:26E-1.6(b)6).Statistics at a minimum should also include mean, maximum, 95 percent UpperConfidence Limit (UCL) (if appropriate based on number <strong>of</strong> samples),concentration range, and frequency <strong>of</strong> detection on an ESNR basis; qualified orrejected data must be clearly noted pursuant to N.J.A.C.7:26E-2.1.iii. For surface water data, both filtered (dissolved) and unfiltered (total) metalsresults should be reported. Hardness as mg/l CaCO 3 and pH must be reportedbecause the standards for metals are calculated using these parameters (SWQSN.J.A.C. 7:9B). Salinity, temperature, Eh and dissolved oxygen (DO) should bereported, when collected.iv. For sediment data, TOC, particle grain size, Eh, and pH should be measuredand reported because these measurements are critical to determinebioavailability and habitat availability, depositional areas, etc.v. Food chain modeling results, if conducted in the EE.(b) Based on Section 5.5(a), the conclusions <strong>of</strong> the EE can include the followingdeterminations.i. No further ecological evaluation is appropriate. In cases where there areexceedances <strong>of</strong> ESC, spatial distribution <strong>of</strong> contaminants, de minimis quantitiesand background contamination could be considered as part <strong>of</strong> this determination.ii Further ecological evaluation pursuant to N.J.A.C. 7:26E-4.8 is required.Identify data gaps and propose how they will be addressed, including additionalsample collection to determine whether a contaminant migration pathway iscomplete to an ESNR. The additional sample collection results may be reportedin an EE addendum or an ERA, as appropriate.iii. A remedial action is appropriate at this time. In lieu <strong>of</strong> performing an ERA,<strong>Ecological</strong> <strong>Evaluation</strong> <strong>Technical</strong> <strong>Guidance</strong> Document 30Version 1.2 8/29/12
the person responsible for conducting remediation may choose to remediate to thehigher <strong>of</strong> the ESC or background, particularly when the exceedence constitutes ahot spot (Section 6.4.4).6.0 <strong>Technical</strong> <strong>Guidance</strong> for Preparing <strong>Ecological</strong> Risk AssessmentsIf the findings <strong>of</strong> the EE indicate that further ecological evaluation pursuant to N.J.A.C.7:26E-4.8 is warranted, additional ecological evaluation is required in the form <strong>of</strong> anERA. The ERA must be conducted in accordance with steps 3 through 8 <strong>of</strong> ERAGS(Section 6.1, below) (N.J.S.A. 58:10B-12). The ERA is a quantitative assessment <strong>of</strong> theactual or potential impacts <strong>of</strong> COPECs from a contaminated site on plants and animals.The ERA will (1) determine whether actual or potential ecological risks exist at a site; (2)identify those constituents that pose the adverse ecological risks; and (3) generate data forrisk-based remediation goal determinations and for RMDs. Contaminants exceedingESC should be delineated to the greater <strong>of</strong> background or the ESC. Additionally,treatment and removal should be considered for sites where ecological risk is determinedto be negligible if persistent, biomagnifying, toxic are present.The following sections outline the components <strong>of</strong> the ERA and provide guidance on howto conduct and document the ERA.6.1 <strong>Ecological</strong> Risk Assessment Process Pursuant to N.J.A.C. 7:26E-4.8ERAs were first defined by USEPA through the Framework for <strong>Ecological</strong> RiskAssessment (USEPA, 1992a). The intent <strong>of</strong> USEPA’s framework document was todevelop a simple and flexible structure for evaluating the potential for ecologicalrisks. This framework outlines the completion <strong>of</strong> an ERA in three phases:(1) Problem Formulation - definition and articulation <strong>of</strong> the goals, breadth, andfocus <strong>of</strong> the assessment;(2) Analysis - the technical evaluation <strong>of</strong> data including characterization <strong>of</strong>exposures and ecological effects; and(3) Risk Characterization - evaluation <strong>of</strong> the adverse effects resulting from theexposure <strong>of</strong> a receptor to a stressor.This framework approach was further defined in the Guidelines for <strong>Ecological</strong> RiskAssessment USEPA 1998a. This document placed new emphasis on ensuring that theresults <strong>of</strong> the assessment can be used to support RMDs.<strong>Ecological</strong> Risk Assessment <strong>Guidance</strong> for Superfund, Process for Designing andConducting <strong>Ecological</strong> Risk Assessments, EPA 540-R-97-006, Office <strong>of</strong> Solid Wasteand Emergency Response, Washington, DC (ERAGS - USEPA, 1997a) placed thethree phases <strong>of</strong> the ERA process into a more structured eight-step process for thedevelopment <strong>of</strong> ERAs specifically at Comprehensive Environmental Response,Compensation, and Liability Act (CERCLA) sites. This eight-step process includesmultiple Scientific/Management Decision Points (SMDP). SMDPs are checkpointsin the ERA process to (1) verify that the work conducted at each step is complete; (2)determine whether the risk assessment is proceeding in a direction that will supportdecision making; and (3) determine the need, if any, for proceeding to the next step.This process allows for a more proactive mechanism for measuring the progress andorganization <strong>of</strong> the ERA. The eight steps outlined in ERAGS are as follows:<strong>Ecological</strong> <strong>Evaluation</strong> <strong>Technical</strong> <strong>Guidance</strong> Document 31Version 1.2 8/29/12
Step 1 – Preliminary Screening Level. Formulate a preliminary problemstatement and preliminary toxicity evaluation.Step 2 – Screening Level <strong>Ecological</strong> Risk Assessment (SLERA). Developexposure estimates and preliminary risk calculations. This step also includes anSMDP.Step 3 – Baseline <strong>Ecological</strong> Risk Assessment (BERA) Problem Formulation.Evaluate toxicity, and develop a preliminary ecological conceptual site model(ECSM), exposure pathways, and assessment endpoints. This step also includesan SMDP.Step 4 – Study Design and Data Quality Objectives (DQO) Development.Establish measurement endpoints and develop the Field Sampling and AnalysisWork Plan based upon results <strong>of</strong> the previous three steps. This step also includesan SMDP.Step 5 – Verification <strong>of</strong> Field Sampling Design. Determine the feasibility <strong>of</strong> thefield program as outlined in Step 4. Include a site visit as part <strong>of</strong> thatdetermination. This step also includes an SMDP.Step 6 – Site Investigation and Data Analysis. Implement the Field Sampling andAnalysis Work Plan. This step includes an SMDP.Step 7 – Risk Characterization. Quantify potential site risks. This is generally amore realistic evaluation <strong>of</strong> risks than was performed in Step 2.Step 8 – Risk Management. Select alternatives in the Record <strong>of</strong> Decision as anSMDP.Steps 1 and 2 define the development <strong>of</strong> the SLERA within USEPA guidance and theEE within N.J.A.C. 7:26E-1.16 and the migration pathway step in 4.8(a) and 4.8(b),while Steps 3 through 7 define the development <strong>of</strong> the BERA within USEPAguidance and the ERA within the N.J.A.C. 7:26E-4.8(c).The following sections outline the ERA process in terms <strong>of</strong> the three phases (ProblemFormulation, Analysis and Risk Characterization).6.1.1 Problem FormulationThe problem formulation stage is the first phase <strong>of</strong> the ERA, during which thegoals, breadth, and focus <strong>of</strong> the assessment are articulated. The problemformulation section consists <strong>of</strong> the description <strong>of</strong> the relevant site features andcurrent condition <strong>of</strong> the environment, a description <strong>of</strong> the potential ongoing orhistoric contaminant sources, identification <strong>of</strong> ecological receptors at the site andsurrounding area, and development <strong>of</strong> the ECSM. The ECSM is a conceptualprojection <strong>of</strong> possible source-to-pathway-to-receptor scenarios for the COPECsidentified at the site.6.1.1.1 Assessment and Measurement EndpointsAssessment endpoints are defined as explicit expressions <strong>of</strong> the environmentalvalues to be protected (USEPA, 1992a, 1997a, and 1998a). Selection <strong>of</strong>assessment endpoints should occur in the problem formulation phase and<strong>Ecological</strong> <strong>Evaluation</strong> <strong>Technical</strong> <strong>Guidance</strong> Document 32Version 1.2 8/29/12
should consider the significance <strong>of</strong> adverse toxicological, biological, andecological effects on receptors groups identified in the ECSM (Section6.1.1.2).Assessment endpoints can be identified at the individual, population orcommunity level <strong>of</strong> biological organization (USEPA, 1997a).Individual level endpoints include individual, specific parameters, and areimportant particularly where health consequences <strong>of</strong> individuals may haveor are suspected <strong>of</strong> having pr<strong>of</strong>ound ecological influences. Examplesinclude threatened and endangered species known to be present at or neara site, and changes in top predator activity (see NJ Natural HeritageProgram, information on rare, threatened and endangered species,http://www.state.nj.us/dep/parksandforests/natural/heritage).Population level endpoints influence the abundance or density <strong>of</strong> a singlespecies within a specific area. Examples include survival andreproduction <strong>of</strong> sensitive fish, bird or small mammal populations.Population level impacts are typically inferred from data based on impactson individuals (USEPA, 1999a).Community level endpoints include factors that affect the number <strong>of</strong>species or composition within a habitat, or measures that may relate tohow these species interact. Examples may include the distribution andabundance <strong>of</strong> sediment benthic and soil invertebrate communities.Clearly defined assessment endpoints provide direction and boundaries for therisk assessment by minimizing miscommunications and reducing theuncertainty in the ERA. The selection <strong>of</strong> assessment endpoints is based on theecological relevance <strong>of</strong> the proposed endpoint, susceptibility to known orsuspected constituents <strong>of</strong> concern, and relevance to management goals. Sitemanagement goals and objectives will guide and influence assessmentendpoints and need to be identified or developed before assessment endpointsare selected. Factors that are considered in management objectives are thecurrent and future site land use, and identified valuable biological resources.It is important to understand how exposure to contaminants may influencethese biological levels <strong>of</strong> organization and their ecological components.Specific or clearly defined assessment endpoints provide sufficient directionand details for determining the answers for specific risk questions. Effects onassessment endpoints generally cannot be measured directly; therefore, eachassessment endpoint is evaluated using a corresponding measurementendpoint. Measurement endpoints are measureable responses to a stressorthat are related to the valued characteristics chosen as the assessment endpoint(USEPA, 1992a). Properly selected measurement endpoints are used to infera measure <strong>of</strong> protection on evaluation <strong>of</strong> risk to the assessment endpoint.Measurement endpoints are the results <strong>of</strong> tests or observational studies that areused to estimate the exposure, effects, and ecosystem and receptorcharacteristics, for an assessment endpoint. Measurement endpoints include<strong>Ecological</strong> <strong>Evaluation</strong> <strong>Technical</strong> <strong>Guidance</strong> Document 33Version 1.2 8/29/12
specific measurements <strong>of</strong> receptor health, population indices, measurement <strong>of</strong>exposure, or direct measures <strong>of</strong> ecotoxicological effects. Exposure measures the existence and movement <strong>of</strong> stressors in theenvironment and their co-occurrence with the assessment endpoints or itssurrogate such as chemical-specific concentrations in abiotic and bioticmedia that are directly based on media or on food intake.Effects measure changes in an attribute <strong>of</strong> an assessment endpoint or itssurrogate in response to a stressor to which it is exposed, such as directtoxicity.Ecosystem and receptor characteristics measure variables that influencethe behavior, life history, and distribution <strong>of</strong> populations or individuals ina community that may be adversely affected by contaminant exposure.Examples <strong>of</strong> measurable variables include population density, changes inspecies composition over time, or change in relative biomass.The tools used to evaluate the measurement endpoints are as varied as themedia present at an individual site and can include such activities as chemicalsampling, toxicity tests, bioaccumulation studies, biological inventories, andhabitat assessments. The determination <strong>of</strong> adverse ecological impacts isusually dependent on the comparison <strong>of</strong> the results <strong>of</strong> these measurements toeither baseline or reference conditions and comparison to known benchmarkconditions established as safe levels. Examples <strong>of</strong> Assessment andcorresponding Measurement Endpoints are presented in Table 6-1.6.1.1.2 <strong>Ecological</strong> Conceptual Site ModelAn ecological conceptual site model (ECSM) organizes the informationknown about a site into a clear overview that can be used to identify data gapsand needs, remedial strategies, and source control needs. The model can helpin developing decision criteria. Information that should be included in theECSM includes (1) how site-related COPECs enter a system, (2) howCOPECs move in that system (including fate and partitioning), and (3) themechanisms for exposure and uptake in ecological receptors.The model can be simple to very complex depending on the depth <strong>of</strong> existingknowledge about the site and the complexity <strong>of</strong> the ecological question beingasked. Often the ECSM evolves as the investigation proceeds from the EEthrough the ERA. At the EE stage <strong>of</strong> the process the ECSM provides anoverview <strong>of</strong> contaminated media, pathways, and exposure scenarios based onreasonable assumptions and uncertainties. In the ERA stage, this ECSM maybecome more refined as additional site-specific data are compiled and the siteis better understood.The ECSM is generally graphic, usually in the form <strong>of</strong> either a chart or othergraphic, but it can also be merely descriptive. Graphic ECSMs should besupported by a brief and concise text component. Two examples <strong>of</strong> ECSMsthat can be used to support the EE documentation are shown below (Figures6.1 and 6.2). The ECSM should be incorporated into the development <strong>of</strong> an<strong>Ecological</strong> <strong>Evaluation</strong> <strong>Technical</strong> <strong>Guidance</strong> Document 34Version 1.2 8/29/12
overall conceptual site model (CSM) for the site or AOC, as described in theNJDEP CSM <strong>Guidance</strong>.Table 6-1: Examples <strong>of</strong> Assessment and Measurement Endpoints<strong>Ecological</strong> <strong>Evaluation</strong> <strong>Technical</strong> <strong>Guidance</strong> Document 35Version 1.2 8/29/12
Figure 6-2: <strong>Ecological</strong> Conceptual Site Model (USEPA, 2008)Sample <strong>Ecological</strong> Conceptual Site Model (CSM)<strong>Ecological</strong> ReceptorsContaminantSourceRelease / TransportMechanismSurface Erosionand Run<strong>of</strong>fPotentially ImpactedMediaDrainageFeaturesSurfaceWaterSedimentTerrestrial PlantsAquatic PlantsTerrestrial InvertebratesBenthic InvertebratesReptiles and AmphibiansHerbivorous MammalsHerbivorous BirdsOmnivorous MammalsOmnivorous BirdsInvertivorous MammalsInvertivorous BirdsPiscivorous MammalsPiscivorous BirdsCarnivorous MammalsCarnivorous BirdsContaminationfrom Site XLeaching andPercolationGroundWaterSeeps andWetlandsErosion andDispersionAirDirect ContactSoilKey:Potentially complete pathwayPotentially complete pathway but insignificantIncomplete pathwayFigure 6-3: Example <strong>of</strong> an <strong>Ecological</strong> Conceptual Site Model as a Chart<strong>Ecological</strong> <strong>Evaluation</strong> <strong>Technical</strong> <strong>Guidance</strong> Document 36Version 1.2 8/29/12
6.1.2 AnalysisThe analysis phase consists <strong>of</strong> the technical evaluation <strong>of</strong> data. This phase <strong>of</strong> theERA includes estimating potential exposures <strong>of</strong> biological receptors to site-relatedCOPECS and determining the potential effects associated with those exposures.The assessment <strong>of</strong> effects is the determination <strong>of</strong> the relationship between theconcentrations <strong>of</strong> COPECs identified in various environmental media and theresponses <strong>of</strong> ecological receptors to those concentrations. Exposure routes toecological receptors will occur either directly through ingestion, incidental contactor inhalation, or indirectly through the consumption <strong>of</strong> prey containing COPECs.Indirect or food chain exposure can potentially result in unacceptable risks tohigher trophic level organisms that are not in proximity to the site.6.1.3 Risk CharacterizationRisk characterization involves combining potential site-related exposures and thepotential for ecotoxicological effects to estimate the likelihood <strong>of</strong> ecological risks.Risk characterization is conducted for each line <strong>of</strong> evidence and then a weight-<strong>of</strong>evidenceapproach is used to evaluate potential effects for each assessmentendpoint. The ideal ERA includes a minimum <strong>of</strong> three lines <strong>of</strong> evidence:(1) literature-derived single chemical toxicity data that indicate the potentialeffects <strong>of</strong> the COPEC concentrations measured in site media;(2) biological surveys <strong>of</strong> the potentially affected system that indicate theactual state <strong>of</strong> the potentially affected environment; and(3) toxicity tests with ambient media, which indicate the potential effects <strong>of</strong>COPEC concentrations measured in site media, if warranted or conducted.Procedurally, the risk characterization is performed for each assessment endpointby:(1) comparing all measured COPECs against toxicological benchmarks(where possible, exposure-response gradients will be developed to helpascertain a more precise understanding <strong>of</strong> the potential for impacts onreceptors);(2) estimating the potential effects <strong>of</strong> the COPECs identified at the site;(3) estimating the effects <strong>of</strong> ambient media, based on the media toxicity testresults;(4) logically integrating the lines <strong>of</strong> evidence to characterize risks to theendpoint; and(5) listing and discussing the uncertainties in the assessment.6.1.3.1 Food Chain ModelingFood chain modeling, also known as dietary consumption modeling, dosemodeling or wildlife exposure modeling, <strong>of</strong> contaminant uptake by wildlifespecies represents an important component <strong>of</strong> an ERA. Food chain modelingcan be used to predict concentrations <strong>of</strong> contaminants in variousenvironmental abiotic and biotic media. Potential dose is the primary metricused to quantify exposures to ecological receptors <strong>of</strong> interest (ROI) tochemical constituents. The amount <strong>of</strong> chemical present in food or water<strong>Ecological</strong> <strong>Evaluation</strong> <strong>Technical</strong> <strong>Guidance</strong> Document 37Version 1.2 8/29/12
ingested, air inhaled, or material applied to the skin is known as the potentialdose. A critical aspect <strong>of</strong> food chain modeling is the identification and use <strong>of</strong>exposure factors. These factors represent species-specific parameters relatedto food and water ingestion, body weight, home range, foraging range, anddiet composition.Exposure pathways that generally are <strong>of</strong> concern for ROI when conductingfood chain modeling for an ERA include the following: Ingestion <strong>of</strong> contaminated food (plants or prey), particularly forcontaminants with potential to bioaccumulate or biomagnify; Ingestion <strong>of</strong> contaminated water; and Ingestion <strong>of</strong> contaminated soil or sediment.Although not frequently assessed, inhalation <strong>of</strong> contaminated airborneparticles and vapors, and dermal absorption can also be considered, but aregenerally considered to be negligible. The majority <strong>of</strong> exposure is typicallycalculated using the oral exposure pathway. A series <strong>of</strong> equations are used toquantify the uptake by this pathway. The total exposure experienced by aparticular ROI is the sum <strong>of</strong> the exposures to these pathways for each sourceand is generally described as the following:E total = E food + E water + E incidental soil/sediment ingestionWhere:E total = total exposure from all pathwaysE food = exposure from food consumptionE water = exposure from water consumptionE incidental soil/sediment ingestion = exposure from soil or sediment consumptionLiterature reference values for the independent parameters in each exposuremodel equation should always be supported by literature citations or sitespecificinformation. Useful sources <strong>of</strong> exposure factors and information fordeveloping soil, sediment, food, and water ingestion pathways are the WildlifeExposure Factors Handbook (USEPA, 1993a) and Estimating Exposures <strong>of</strong>Terrestrial Wildlife to Contaminants (Sample, et al, 1994).For exposure estimates to be useful in the assessment <strong>of</strong> risk to wildlife, theestimates should be expressed in terms <strong>of</strong> a body weight-normalized dailydose (e.g., milligrams <strong>of</strong> contaminant per kilogram <strong>of</strong> body weight per day(mg/kg/day)). Exposure estimates expressed in these units are then comparedto toxicological benchmarks for wildlife or to doses reported in the scientificliterature. Estimation <strong>of</strong> the daily contaminant dose to a particular species foreach exposure pathway can be calculated by the general intake equationdefined as:ADD = CM*IR*FI*AF*BW -1Where:ADD = Average Daily Dose (mg/kgBW-day)<strong>Ecological</strong> <strong>Evaluation</strong> <strong>Technical</strong> <strong>Guidance</strong> Document 38Version 1.2 8/29/12
CM = Concentration <strong>of</strong> COPECs in media <strong>of</strong> concern (e.g., exposurepoint concentrations in sediment, soil, surface water, or biota (mg/kg))Media concentrations are typically determined by a combination <strong>of</strong>measurements and modeling. A source is generally characterized byanalysis, whereas movement into other media might be measured ormodeled. In either case, spatial and temporal variations are importantparameters that warrant consideration.IR = Ingestion Rates (kg/day or L/day)IRs may be determined or estimated for each medium and pathway <strong>of</strong>concern for each representative species. IRs are expressed in terms <strong>of</strong>quantity <strong>of</strong> the medium (weight or volume) per day. When IRs for therepresentative species are not available, they may be estimated using datafrom surrogate species. In selecting surrogate data, taxonomic, anatomic,physiologic, and behavioral relationships and the quality <strong>of</strong> the studies aregenerally considered. A discussion <strong>of</strong> the scientific basis and rationale forthe data set selection should be included in the ERA report.FI = Fractional Intake (Exposure Frequency (day/year) * exposureduration (years)The fraction <strong>of</strong> time spent in contact with contaminated media is generallydefined as the time and area use factors. This may generally beapproximated as the ratio <strong>of</strong> the area <strong>of</strong> the site-specific appropriatehabitat to the foraging or home range area as appropriate (area use factor)and the amount <strong>of</strong> time per year a species spent in the habitat associatedwith the site (e.g., migratory considerations) (seasonal use factor).Consistent with ERAGS, when food chain modeling is conducted as part<strong>of</strong> the EE, and dietary concentrations are modeled from mediaconcentrations, an FI equal to one is appropriate. When conducting a sitespecificERA that includes measured dietary concentrations (e.g. plant oranimal tissue), using an FI that is less than one may be appropriate.Depending on site-specific circumstances, it may be appropriate tocalculate a dose using both an FI <strong>of</strong> one and a less conservative FI tobound the range <strong>of</strong> potential ecological risk.AF = Absorption Fraction (unitless)The AF is used if there are data to show that absorption by the exposureroute in question is a fraction <strong>of</strong> the exposure route for which the literaturereference dose was determined.BW = Body weight <strong>of</strong> the ROI or representative surrogate (kg)Although useful, modeling usually involves some range <strong>of</strong> uncertainty.Toxicity criteria may be pre-existing or derived and is expressed as referencedosages for terrestrial receptors or reference concentrations for aquaticreceptors. Bioaccumulation in representative species that use both aquatic andterrestrial habitats, such as shorebirds or waterfowl, may be addressed as part<strong>of</strong> an aquatic or terrestrial assessment as appropriate.<strong>Ecological</strong> <strong>Evaluation</strong> <strong>Technical</strong> <strong>Guidance</strong> Document 39Version 1.2 8/29/12
Fugacity, which is described as the escaping tendency <strong>of</strong> a chemical speciesfrom a particular environmental compartment (e.g., air, water, sediment soil)is sometimes used to estimate tissue concentrations in biota to account forintermedia transfer; however, the results <strong>of</strong> these types <strong>of</strong> modeling effortsare <strong>of</strong>ten uncertain. It is recommended that predicted tissue residue levelsonly be used in a screening evaluation and that these values be verified withsite-specific measurements to provide scientific validity to the process (e.g.,bioaccumulation and field tissue residue studies).The most common type <strong>of</strong> study reported in the literature is a contaminantbioaccumulation (uptake) study (Section 6.1.3.2). Where the potential foroverestimating bioaccumulation by using conservative literature values torepresent the site is substantial, additional evaluation <strong>of</strong> the literature forvalues more likely to apply to the site or a site-specific tissue residue studymight be advisable. Bioaccumulation and field tissue residue studies typicallyare conducted at sites where contaminants are likely to accumulate in foodchains and help to evaluate the degree to which a contaminant is transferredthrough a food chain.A tissue residue study generally is conducted on organisms that are in theexposure pathway (e.g., food chain) associated with the assessment endpoint.Limited data are available to link tissue residue levels in the sampledorganisms to adverse effects on those organisms. Literature toxicity studiesusually associate effects with an administered dose (or data that can beconverted to an administered dose), not a tissue residue level. Thus, thepurpose <strong>of</strong> a field tissue residue study usually is to measure contaminantconcentrations in foods consumed by the species associated with theassessment endpoint. This measurement minimizes the uncertainty associatedwith estimating a dose (or intake) to that species, particularly in situations inwhich several media and trophic levels are in the exposure pathway.The concentration <strong>of</strong> a contaminant in the primary food (plant and prey)should also be linked to an exposure concentration from a contaminatedmedium (e.g., soil, sediment, water), because it is the medium, not the foodchain, that will be remediated. Thus, contaminant concentrations should bemeasured in environmental media at the same locations at which theorganisms are collected along contaminant gradients and at reference arealocations. Temporally and spatially collocated samples <strong>of</strong> the contaminatedmedia and tissue are needed to establish a correlation between the tissueresidue levels and contaminant levels under evaluation.Even if a complex dietary composition for each ecological receptor areavailable and evaluated, only those elements <strong>of</strong> the diet that have beenanalyzed for site-related contaminants, should be included as part <strong>of</strong> the dietin dose equations. The dietary composition, including exact percentages andelements <strong>of</strong> the diet, should be determined prior to initiating the riskassessment.<strong>Ecological</strong> <strong>Evaluation</strong> <strong>Technical</strong> <strong>Guidance</strong> Document 40Version 1.2 8/29/12
6.1.3.2 BioaccumulationIn calculating levels <strong>of</strong> exposure, either direct toxicity to plants and wildlife orsecondary toxicity to animals feeding on contaminated plants and animals,one issue that the investigator should be aware <strong>of</strong> is bioaccumulation.Bioaccumulation is the net extent to which a substance may be accumulatedby an organism because <strong>of</strong> uptake from various media, including food. A list<strong>of</strong> contaminants considered to be bioaccumulative can be found in Table 4-2<strong>of</strong> USEPA (2000c) Bioaccumulation Testing and Interpretation for thePurpose <strong>of</strong> Sediment Quality Assessment, Status and Needs. A similarconcept is bioavailability, which is the net extent to which the form <strong>of</strong> achemical occurring in a medium is susceptible to being taken up by anorganism. Bioavailability is (1) the cumulative expression <strong>of</strong> physical,chemical, and biological processes evident in air, water, soil, and sediment,and (2) biological factors present in the bodies, organs, tissues, or cells <strong>of</strong>exposed organisms that act to change that organism's rate <strong>of</strong> COPEC exposure(Suter et al., 2000).To be consistent with the first two steps <strong>of</strong> ERAGS, the EE must assume that100 percent <strong>of</strong> a particular COPEC that is identified in a particular media isavailable to the representative receptors being evaluated (N.J.S.A. 58:10B-12). While this is generally considered to be an overestimation <strong>of</strong> ecologicalrisk, it provides a level <strong>of</strong> certainty if the conclusion <strong>of</strong> the EE is that noecological risks are evident. However, in the ERA, the investigator shouldconsider bioaccumulation when calculating the levels <strong>of</strong> exposure to beevaluated in the risk assessments, particularly in calculations <strong>of</strong> impacts tohigher trophic level organisms through food chain transfer <strong>of</strong> a COPEC.When sediment and soil chemistry data are available, but tissue chemistry isnot, Sediment/Soil-to-Biota Bioaccumulation Factors (BSAFs) andBioaccumulation Factors (BAFs), respectively, can be estimated for selectcompounds using published accumulation factors(http://el.erdc.usace.army.mil/bsafnew/,andhttp://www.epa.gov/med/Prods_Pubs/bsaf.htm). Such data should be usedwith caution because it is not site specific and could overestimate orunderestimate accumulation.The BSAFs and BAFs are the ratios <strong>of</strong> tissue concentrations to the sedimentandsoil-associated concentrations <strong>of</strong> organic compounds or metals. A sitespecificBSAF or BAF can be empirically determined through collection andchemical analysis <strong>of</strong> collocated sediment or soil, respectively, and organismtissue. Because some contaminants bind to organic matter in sediment andsoil or to lipids in the tissue <strong>of</strong> exposed organisms, site-wide BSAF and BAFvalues need to be normalized for TOC and for lipid content (USEPA, 2009c).In ERAs for complex situations, studies to more accurately predictbioaccumulation and the movement <strong>of</strong> a COPEC through the environmentshould be considered. Generally, these studies will consist <strong>of</strong> field-collectedtissue samples (both plant and animal) at different trophic levels <strong>of</strong> the<strong>Ecological</strong> <strong>Evaluation</strong> <strong>Technical</strong> <strong>Guidance</strong> Document 41Version 1.2 8/29/12
environment. As noted in ERAGS, the purpose <strong>of</strong> a field-collected tissueresidue study usually is to measure contaminant concentrations in foodsconsumed by the species associated with the assessment endpoint.The primary purpose <strong>of</strong> tissue residue analysis for ERA is to determine wholebody contaminant concentrations in prey consumed by the receptor <strong>of</strong> interest.This analysis provides an estimate <strong>of</strong> the contaminant dose to the receptor <strong>of</strong>interest, which can be compared to literature-based tissue residue effectslevels (toxicity reference values (TRV)) for the purpose <strong>of</strong> estimating risk.Tissue residue data can play an important role at different stages in theprocess <strong>of</strong> evaluating hazardous waste sites, including ecological riskassessment, modeling conducted to evaluate different remedial alternatives,and monitoring necessary to determine the effectiveness <strong>of</strong> remediation (Field,1998; Canadian Council <strong>of</strong> Ministers <strong>of</strong> the Environment, 1999; Jarvinen andAnkley, 1999). <strong>Evaluation</strong> <strong>of</strong> tissue residue effects relies on the identification<strong>of</strong> whole body concentrations <strong>of</strong> a chemical that has been demonstrated to beassociated with adverse effects on a target organ or system in a variety <strong>of</strong>aquatic organisms or phylogenetic groups. Tissue residue effects arecontaminant and taxon specific threshold concentrations measured inbiological tissue above which adverse effects <strong>of</strong> ecological relevance wouldbe anticipated to occur based on field or laboratory studies. Data may be usedfrom a surrogate species when studies for a particular species cannot be found.Tissue residue effects are generally based on mortality, reproductive orgrowth endpoints, which are most relevant for estimating the potential foradverse population level effects. Databases for tissue residue effect levelsinclude the ERED database (Environmental Residue Effects Database,http://el.erdc.usace.army.mil/ered/).Prerequisites for BioaccumulationStudiesIn the event field tissue collection is not feasible, the investigator may chooseto conduct field or laboratory bioaccumulation studies using laboratorycultured organisms. Bioaccumulation studies can be expensive and timeconsuming.Before conducting a bioaccumulation study, the toxicity <strong>of</strong> thesoil or sediment should be assessed either through historical toxicity data orthrough screening toxicity studies (exposing toxicity test organisms for one toten days to determine toxic effect). Field reference locations should also bescreened to ensure that they are appropriate for inclusion in testing. The effortand expense <strong>of</strong> a bioaccumulation study are unnecessary if site soil orsediment is determined to negatively impact organism survival, based ontoxicity tests or field evaluations. If survival is significantly reduced,bioaccumulation is not the primary concern.Bioaccumulation Study Design ConsiderationsBioaccumulation studies require careful consideration <strong>of</strong> many variablesincluding physical and chemical conditions <strong>of</strong> the matrices being tested,sample selection, sample volume (i.e., tissue mass requirements), laboratoryQA/QC (e.g., replicates, tissue preparation and processing). When<strong>Ecological</strong> <strong>Evaluation</strong> <strong>Technical</strong> <strong>Guidance</strong> Document 42Version 1.2 8/29/12
considering the selection <strong>of</strong> test organisms, the investigator is advised thatthere is currently a ban on placing any commercially viable shellfish speciesinto any prohibited water body for in situ bioaccumulation studies(http://www.state.nj.us/dep/wms/bmw/waterclass.htm).Physicochemical Data NeedsBioaccumulation studies can be laboratory-based (e.g., ASTM, 2010; USEPA,2000a), or performed in situ (e.g., Burton et al., 2004; ASTM, 2007a).Bioaccumulation in sediment and soil is controlled by many physicochemicalfactors including TOC, pH, redox potential, salinity, temperature, grain size,sulfides, the types <strong>of</strong> contaminants and their concentrations, and the lipidcontent <strong>of</strong> receptor organisms. Additional variables, including contaminantsoil sorption coefficients, water solubility, hydrolysis, photolysis, nutrientconcentrations (Ca, Fe, Mg, P, K, Na, sulfate, ash content, cation exchangecapacity, and Kjeldahl nitrogen), further control bioaccumulation in soil. Testorganism selection should take these physiochemical factors into accountwhen selecting a study organism to avoid stressing the study organisms.Salinity is an important example <strong>of</strong> a study design consideration. Salinity cancause osmotic stress on test organisms and can impact the bioavailability <strong>of</strong>sediment contaminants. If marine sediment is laboratory-tested at lowsalinity, some contaminants may become more bioavailable than they wouldbe under higher salinity conditions. This would potentially yield artificiallyhigh BAFs and produce results that are not representative <strong>of</strong> site conditions.Some coastal, estuarine, and tidal sites can pose significant salinitychallenges, with upstream samples in freshwater or low salinity conditionsand downstream samples in higher salinity or marine conditions. It isdesirable to perform a single bioaccumulation study using the same testorganism for all samples. However, it is usually not feasible to acclimate asingle batch <strong>of</strong> test organisms to a wide range <strong>of</strong> salinities, and changing thesalinity <strong>of</strong> the samples to suit the test organism could potentially alter thebioavailability <strong>of</strong> COPECs and yield results that are not representative <strong>of</strong> siteconditions. Several species could be used, but different species mayaccumulate COPECs in widely varying rates and the results may not becomparable. Issues with acclimating a single species or using more than onespecies should be considered during study design.In the aquatic environment, adjustments may be considered to account forbioavailability in surface water calculations such as water hardness and pH,particularly with soluble metals.Other examples <strong>of</strong> nonchemical stressors in soil bioaccumulation studies aresoil nutrients and moisture. When testing plants, it is important to know thenutrient content <strong>of</strong> the soil to differentiate between effects caused by chemicaltoxicity and effects caused by lack <strong>of</strong> nutrients. Most soil-dwelling organismsthrive in a relatively narrow range <strong>of</strong> soil moisture percentage. Too muchmoisture will potentially drown invertebrates or plants, while too littlemoisture will desiccate them.<strong>Ecological</strong> <strong>Evaluation</strong> <strong>Technical</strong> <strong>Guidance</strong> Document 43Version 1.2 8/29/12
Sample SelectionAfter completing the toxicity test phase <strong>of</strong> the bioaccumulation study,investigators should determine whether the tissue samples should besubmitted for COPEC analysis. When choosing test tissue samples to submitfor analysis, it is important to select only tissue from those soil or sedimentsamples that showed no significant reduction in organism survival, ascompared to the laboratory control or reference sample. If survival issignificantly reduced, bioaccumulation is not the primary concern. If asignificant percentage <strong>of</strong> the organisms exposed to a soil or sediment sampledid not survive the test period, it is highly likely that the tissue COPEC burdenaccumulated by the surviving organisms would not be representative andcould be misleading. It is also important to include only those test organismsthat survived the entire test period for tissue analysis. All dead organismsshould be recorded and discarded. Inclusion <strong>of</strong> dead organisms in tissueanalysis would not be representative and could bias the study.Tissue Mass RequirementsDepending on the list <strong>of</strong> COPECs, the analytical tissue mass requirement maybe quite high (50 to 70 grams per sample for a full suite <strong>of</strong> organic andinorganic analytes).Marine/estuarine bioaccumulation studies with oligochaete worms (e.g.,Nereis virens or Neanthes arenacoedentata) or bivalves (e.g., clams, musselsor oysters) can easily be designed to yield sufficient tissue mass because thetest organisms are relatively large. This allows analysis <strong>of</strong> tissue samplesfrom individual test replicates, allowing robust statistical comparison <strong>of</strong> eachsediment sample. However, freshwater bioaccumulation studies are typicallyperformed with much smaller polychaete worms (e.g., Lumbriculusvariegatus) or bivalves (e.g., fingernail clams, Corbicula fluminea).Individual L. variegatus weigh approximately 0.015 grams, requiringthousands <strong>of</strong> worms to make up a 50-gram tissue mass requirement. Becauseit is not feasible to set up multiple replicate samples with thousands <strong>of</strong> worms,it is best to limit use <strong>of</strong> L. variegatus to sediment samples with COPEC listswith a small analytical tissue mass requirement.Some bioaccumulation studies with soil organisms (e.g., earthworms orplants) can easily be designed to yield sufficient tissue mass because the testorganisms can be relatively large. Testing can be initiated with worm speciesthat are large enough to yield sufficient tissue at test termination. Plantbioaccumulation studies can be performed using species that will growsufficiently by test termination to yield the desired tissue mass. This allowsanalysis <strong>of</strong> tissue samples from individual test replicates, allowing robuststatistical comparison <strong>of</strong> each soil sample. The portion <strong>of</strong> plant to be assayedneeds to be determined on a case by case basis. For example, if data are to beused for dietary exposure modeling, Arrow arum fruit is a preferred food <strong>of</strong>wood ducks, and all portions <strong>of</strong> aquatic plants (e.g., roots, basal portions,stems, leaves) and basal portions <strong>of</strong> Phragmites can be consumed by<strong>Ecological</strong> <strong>Evaluation</strong> <strong>Technical</strong> <strong>Guidance</strong> Document 44Version 1.2 8/29/12
muskrats. Also, roots and leaves <strong>of</strong> aquatic plants can be consumed bybenthic omnivorous fish, such as common carp, catfish, white perch, etc.However, some bioaccumulation studies can be performed with much smallerorganisms (e.g., springtails or potworms), depending on study objectives.Individual springtails or potworms are very small, requiring hundreds <strong>of</strong>organisms to make up a 50-gram tissue mass requirement. Because it isusually not feasible to set up multiple replicate samples with hundreds <strong>of</strong>organisms, it is best to limit use <strong>of</strong> smaller invertebrates to soil samples withCOPEC lists with a small analytical tissue requirement.Laboratory QA/QC ObjectivesReplicatesAs is required with any toxicity study, appropriate replication is necessary toensure comparability between soil or sediment samples and laboratory controlor reference samples. Bioaccumulation studies should be designed to producethe required analytical tissue mass from each test replicate. If sufficient tissuemass is not possible from each replicate, compositing between replicates isacceptable. However, compositing reduces the statistical power <strong>of</strong> the study.If all test replicates have to be composited to a single sample, statisticalcomparisons are not appropriate and the study may not meet the data qualityobjectives for inclusion in a risk assessment. Where sufficient historical dataare available, a power analysis (Zar, 1984) is <strong>of</strong>ten useful to determine howmany test replicates may be necessary to ascertain differences between soil orsediment sampling locations or reference area soils.Tissue Preparation and ProcessingBecause even a small amount <strong>of</strong> potentially contaminated soil or sediment cansignificantly bias any tissue analysis, it is critical to remove all traces <strong>of</strong> soilor sediment from the test organisms before submitting the tissue for COPECanalysis. For example, plant roots should be thoroughly rinsed and carefullyexamined to ensure that all soil is removed. Earthworms and other organismsthat ingest and process soil should be depurated for a time sufficient to ensurethat the digestive tract is empty. While 24 hours is an acceptable depurationperiod (ASTM, 2004), studies have indicated that different species mayrequire 48 hours for sufficient depuration, and some other species may requiredissection and rinsing <strong>of</strong> the digestive tract (Arnold and Hodson, 2007).All tissue samples should be analyzed for COPECs, percent moisture andpercent lipids (as appropriate). In addition to the analysis <strong>of</strong> tissue samples,bioaccumulation studies should include analysis <strong>of</strong> all site soil and/orsediment samples, reference samples and laboratory control samples forCOPECs, grain size, TOC and pH. Soils used for plant toxicity orbioaccumulation studies should also be analyzed for soil nutrientconcentrations.<strong>Ecological</strong> <strong>Evaluation</strong> <strong>Technical</strong> <strong>Guidance</strong> Document 45Version 1.2 8/29/12
While there are many laboratories that can produce acceptable analyticalresults for soil and sediment samples, not all laboratories are capable <strong>of</strong> tissueanalysis. Tissue processing requires specialized equipment in addition to thestandard analytical instrumentation, and some laboratories cannot work withsmall samples. Tissue samples, particularly samples with high lipid content,may also present analytical interference that can yield excessively highanalytical detection limits for insufficiently experienced laboratories.It is critical to discuss bioaccumulation study objectives with both the toxicitytesting laboratory and the analytical laboratory, to ensure that data qualityobjectives are met.6.1.3.3 Toxicity Reference ValuesToxicity reference values (TRV) are literature-based levels defined as a doseabove which ecologically relevant effects might occur in wildlife speciesfollowing chronic dietary exposure and below which it is reasonably expectedthat such effects will not occur (USEPA, 2005a). TRVs provide a basis forestimating whether the exposure to COPECs at a site is likely to result inadverse ecological effects (e.g., survival, growth, and reproduction <strong>of</strong> wildlifespecies). The TRVs selected in the ERA are based on LOAELs and/orNOAELs from laboratory and/or field-based studies reported in the scientificliterature (USEPA, 2005a and Sample et al., 1996).Risks are estimated for appropriate feeding guilds by comparing the results <strong>of</strong>the measured or modeled dietary contaminant doses to receptors <strong>of</strong> concern tothe TRVs. The ratio <strong>of</strong> these two numbers is called a Hazard Quotient (HQ).HQs equal to or greater than one (HQ ≥ 1) are typically considered to indicatepotential risk to ecological receptors. If an HQ suggests that effects are notexpected to occur for the average individual, then the effects are likely to beinsignificant at the population level; however, if an HQ indicates risks arepresent for the average individual, then risks may be present for the localpopulation.The basic equation used for calculation <strong>of</strong> an HQ value for exposure <strong>of</strong> awildlife receptor to a chemical by ingestion <strong>of</strong> an environmental medium is:HQi, j, r = ADDoTRVi,rwhere:HQi,j,r = HQ for exposure <strong>of</strong> receptor “r” to COPEC “i” in medium “j”ADD = Average Daily Dose (mg/kgBW-day)oTRVi,r = Oral TRV for COPEC “i” in receptor “r” (mg/kg-day)Because all receptors are exposed to more than one environmental medium,the total hazard to a receptor from a specific COPEC is calculated as the sum<strong>of</strong> HQs for that COPEC across all media:HQi, r = Σ HQi, j, r<strong>Ecological</strong> <strong>Evaluation</strong> <strong>Technical</strong> <strong>Guidance</strong> Document 46Version 1.2 8/29/12
6.1.3.4 Weight-<strong>of</strong>-EvidenceIn the risk characterization phase, a weight-<strong>of</strong>-evidence approach is used tobalance the results <strong>of</strong> more than one type <strong>of</strong> study (or lines <strong>of</strong> evidence) foreach endpoint. The weight-<strong>of</strong>-evidence approach is used to integrate multipletypes <strong>of</strong> data to support a conclusion. In EEs where there may only be one ortwo lines <strong>of</strong> evidence (e.g., COPECs and ESNRs), a weight-<strong>of</strong>-evidenceapproach may either be unnecessary or simplistic. However, in more complexERAs, multiple studies or lines <strong>of</strong> evidence may need to be evaluated for eachendpoint to reach a conclusion regarding the level <strong>of</strong> risk.The weight-<strong>of</strong>-evidence begins by summarizing the findings <strong>of</strong> each line <strong>of</strong>evidence for each assessment endpoint. If the endpoint is associated with theexceedance <strong>of</strong> some threshold, then the weight-<strong>of</strong>-evidence evaluation willfirst evaluate each line <strong>of</strong> evidence to determine whether (1) the findings <strong>of</strong>the study can be definitively identified as an exceedance <strong>of</strong> the threshold, (2)whether it can be definitively identified as not exceeding the threshold, or (3)the findings are ambiguous. Then, the findings <strong>of</strong> all lines <strong>of</strong> evidence foreach assessment endpoint should be summarized to reach a decision as towhether it is likely or unlikely that the threshold was exceeded.If all lines <strong>of</strong> evidence support a conclusion, then the process <strong>of</strong> determiningrisk has been completed with a high degree <strong>of</strong> confidence. However, if thereis bias or uncertainty in the various lines <strong>of</strong> evidence, then a true weighing <strong>of</strong>evidence should occur. As noted in Suter et al. (2000), the lines <strong>of</strong> evidencewithin each assessment endpoint should be evaluated as per the followingparameters: Relevance –greater weight is given if the measure <strong>of</strong> effect is moredirectly related to the assessment endpoint; Exposure and Response –greater weight is given to those studies that showa correlation between the magnitude <strong>of</strong> the response to the magnitude <strong>of</strong>the exposure; Temporal Scope –greater weight is given to those results that relate to thetime constraints and variations <strong>of</strong> the assessment endpoint; Spatial Scope – greater weight is given to those results that accuratelyreflect the location <strong>of</strong> the site being assessed; Data Quality – greater weight is given to data that meet appropriateDQOs; Data Quantity – greater weight is given to those studies that have anadequate amount <strong>of</strong> data to meet statistical confidence; and Uncertainties – greater weight is given to those studies that have the leastuncertainties.6.2 ERA Data DevelopmentThis section describes the various tools and methods that may be employed to moreaccurately characterize ecological risk. Many <strong>of</strong> the tools identified (e.g. sedimenttoxicity test, tissue sampling) are designed to take into account site-specific<strong>Ecological</strong> <strong>Evaluation</strong> <strong>Technical</strong> <strong>Guidance</strong> Document 47Version 1.2 8/29/12
ioavailability, and by doing so, <strong>of</strong>fer a more refined measure <strong>of</strong> toxicity than simplycomparing bulk sediment chemistry results to generic screening values.The subsections that follow are organized by media (surface water, sediment, andsoil) and include a description <strong>of</strong> some <strong>of</strong> the tools and methods commonly used toevaluate ecological risk. The selection <strong>of</strong> the tools and methods to employ at aparticular site will be dependent upon site-specific factors such as habitat type,ecological receptors present, type <strong>of</strong> COPECS, ability <strong>of</strong> the contaminant tobioaccumulate or biomagnify, and complexity <strong>of</strong> the site under investigation(multiple media contamination).6.2.1 Surface WaterBasic surface water sampling guidance is provided in Section 5.3.3.2. Thefollowing sections describe data development issues and the suggested protocolsto be used in more comprehensive surface water sampling programs.6.2.1.1 Sampling Plan Design for Study and Reference AreasThe investigator is referred to N.J.A.C. 7:26E-2.1 for appropriate analyticalprotocol and quality assurance requirements. The investigator is also referredto Section 10.0 <strong>of</strong> this document for additional guidance on QA/QC and thepreparation <strong>of</strong> quality assurance plans.If a discharge is observed or the preliminary surface water results, collectedduring the EE phase (Sections 5.3.2.2 and 5.3.3.2), reveal the presence <strong>of</strong>contaminants at concentrations above their respective aquatic chronic SWQSor appropriate ESC, then additional investigations are required to support theERA. Per N.J.A.C. 7:26E-4.8(c)1, it is imperative that the area <strong>of</strong> impact beaccurately delineated to the appropriate SWQS or ESC. Pr<strong>of</strong>essionaljudgment is required to develop an appropriate sampling strategy, which willbe determined by the size and characteristics <strong>of</strong> the surface water body beinginvestigated. Smaller water bodies may be investigated with the collection <strong>of</strong>additional grab samples. The sampling <strong>of</strong> larger water bodies can beaccomplished with additional sampling along transects that typically runperpendicular to the banks <strong>of</strong> the water feature under investigation. Thenumber <strong>of</strong> samples, number <strong>of</strong> transects, number <strong>of</strong> samples per transect, anddepth <strong>of</strong> the sample in the water column are site-specific and depend onfactors such as magnitude <strong>of</strong> discharge, size <strong>of</strong> water feature, water depth, etc.Surface water in tidally influenced water bodies should be sampled at bothlow and high tides at several locations to better define the area <strong>of</strong> impact as itrelates to the tidal cycle. Corresponding background area samples should alsobe collected with each tidal cycle and should be located upgradient <strong>of</strong> themixing zone to ensure they are located outside the realm <strong>of</strong> potential siteimpacts.The decision to collect additional background area locations should consider:(1) the relationship <strong>of</strong> the existing background area locations to the sitelocation; (2) the complexities <strong>of</strong> the water body; and (3) the need for increasedstatistical significance in the relationship between the site and background<strong>Ecological</strong> <strong>Evaluation</strong> <strong>Technical</strong> <strong>Guidance</strong> Document 48Version 1.2 8/29/12
area samples. The decision may also be based on a need to add samples atvarious depths, to obtain information on different habitats, or to account fortemporal changes in discharges or in water level.If the surface water contamination is attributed to an ongoing groundwaterdischarge, then an evaluation <strong>of</strong> sediment pore water concentrations toevaluate potential impacts to the benthic community should be conducted.Additional guidance on the evaluation <strong>of</strong> this ground water discharge pathwaycan be found in Section 6.2.2.3.In some instances, contaminants detected in surface water may not have acorresponding aquatic chronic SWQS. The investigator may choose todevelop a site-specific standard. In lieu <strong>of</strong> developing a site-specific standard,the investigator may provide an alternate ESC from literature sources, or maychoose to complete a surface water toxicity test to determine potential adverseimpacts to aquatic receptors. The SWQS provide guidance on how to developan aquatic chronic surface water standard at N.J.A.C. 7:9B-1.14(f) based ontwo USEPA documents:• Guidelines for Deriving Numerical National Water Quality Criteria for theProtection <strong>of</strong> Aquatic Organisms and Their Uses (USEPA, 1985b)http://water.epa.gov/scitech/swguidance/standards/criteria/aqlife/upload/85guidelines.pdf• (USEPA, 1995b) Updates: Water Quality Criteria Documents for theProtection <strong>of</strong> Aquatic Life in Ambient Water (EPA-820-B-96-001) (1995Updates)http://yosemite.epa.gov/water/owrccatalog.nsf/0/0b272603b228926785256d83004fd9ee?OpenDocumentAquatic chronic surface water standards developed using the abovemethodologies must be approved by the NJDEP prior to use (N.J.A.C. 7:9B-1.14(f)).6.2.1.2 Surface Water Habitat Assessments and Community SurveysHabitat surveys and community surveys can serve to support the ERAprocess. Although a habitat survey has some credible value without acommunity survey and can enhance the qualitative aspects <strong>of</strong> the riskassessment, a community survey should not be conducted without a habitatsurvey. These assessments and surveys are generally conducted at both thesite <strong>of</strong> concern and a reference area.Habitat AssessmentHabitat is a key component <strong>of</strong> the ecosystem and an integral part <strong>of</strong> a siteassessment. Without an understanding <strong>of</strong> the habitat characteristics <strong>of</strong> asurface water body, any survey <strong>of</strong> fish, invertebrates, plants, etc., will be out<strong>of</strong> context because no assumption <strong>of</strong> a “healthy population” can beascertained. Additionally, the habitat assessment incorporates the potentiallimitations on a community that may not be attributable to the COPECS underinvestigation.<strong>Ecological</strong> <strong>Evaluation</strong> <strong>Technical</strong> <strong>Guidance</strong> Document 49Version 1.2 8/29/12
For the purposes <strong>of</strong> surface water, habitat is considered to be both aquatic andriparian because this is the habitat that most directly influences the aquaticcommunity.Although numerous habitat assessment protocols are available and may beacceptable, the visual-based habitat assessment described in RapidBioassessment Protocols for Use in Streams and Wadeable Rivers (USEPA,1999b) is recommended along with the habitat assessment protocol includedin Field and Laboratory Methods for Macroinvertebrate and HabitatAssessment <strong>of</strong> Low Gradient, Nontidal Streams (USEPA, 1997b) for habitatthat is more lentic. These protocols, when used correctly, provide a highqualityassessment in a short time with minimal cost.When planning a habitat assessment, the area to be assessed should be thesame as the area planned for a community survey (if one is planned) althoughfor certain parameters a “wider” view <strong>of</strong> the site may be necessary. If thecommunity survey is conducted on the same day, care should be taken not todisturb the sampling habitat. Spring and summer are ideal for a habitatassessment.These habitat assessments provide field-ready worksheets (Appendix A) forgrading, on a scale <strong>of</strong> 0-20, a select set <strong>of</strong> habitat characteristics that can besummed to a final score that can help characterize the degradation <strong>of</strong> aparticular area. These assessments can then be included in the lines <strong>of</strong>evidence used during different stages <strong>of</strong> the risk assessment. Three sets <strong>of</strong>worksheets based on gradient are included. It is important to use theworksheets that best fit the site being assessed.The habitat assessment should be conducted by a biologist or ecologistfamiliar with the protocols in the above documents and with theenvironmental qualities in the area to be assessed. It is recommended that atleast two <strong>of</strong> these qualified personnel conduct the habitat assessment at thesame time, but separately, so that any discrepancies in the qualitativeevaluations can be discussed and agreed upon before finalizing scores. Duringthe collection <strong>of</strong> habitat data, basic physicochemical data on the surface water(e.g., pH, DO, conductivity, salinity, temperature, and turbidity) should alsobe collected.Community SurveysCommunity surveys measure current biological conditions. These surveys arethe only way to directly measure the structure and function <strong>of</strong> a community.Combined with the habitat assessment, this information complements and canenhance the contaminant information collected at a site and can provideadditional lines <strong>of</strong> evidence to support conclusions and management decisionsat various stages <strong>of</strong> the risk assessment process.There are two basic survey types: community structure surveys andcommunity function surveys. Community structure is the measurement <strong>of</strong>biotic characteristics (e.g., species abundance, diversity, and composition) at a<strong>Ecological</strong> <strong>Evaluation</strong> <strong>Technical</strong> <strong>Guidance</strong> Document 50Version 1.2 8/29/12
point in time. Community function is the measurement <strong>of</strong> rate processes (e.g.species colonization rates) <strong>of</strong> the ecosystem. Although both surveys canprovide value depending on the biological questions being asked in the riskassessment, most <strong>of</strong>ten, structural surveys are conducted because they aregenerally less resource-intensive in terms <strong>of</strong> time and cost.In surface water environments, a variety <strong>of</strong> community surveys can beconducted and these data can be used in various ways. Most commonlyaccepted and <strong>of</strong>ten the easiest to conduct and evaluate are statistically basedindices that have been developed by numerous states for a range <strong>of</strong> ecosystemcomponents. However, other surveys may be applicable based on seasonalvariation, natural characteristics <strong>of</strong> the site, or other project demands.What is important is that the parameters <strong>of</strong> the survey accurately reflect thedata acquisition needs <strong>of</strong> the ERA, including the community selected,sampling methods, and spatial and temporal planning. Surveys that use morethan one taxonomic group and more than one trophic and tolerance level ineach group tend to be more robust. Additionally, sampling protocols thataccount for subhabitats and seasonal life-cycle changes will yield a morerepresentative data set.Generally accepted aquatic community surveys include fish,macroinvertebrates, algae, and zooplankton. Fish and macroinvertebrates aretypically used in lotic environments, plants are generally used in wetlandenvironments, and algae are <strong>of</strong>ten used in lentic environments. Samplingmethods for these groups are discussed in Sections 6.2.1.3, 6.2.2.4, and 6.4.1.6.2.1.3 Biological Sampling <strong>of</strong> Fish and Other Aquatic OrganismsAs part <strong>of</strong> the completion <strong>of</strong> an ERA, the investigator may choose to collectaquatic biota for either fish tissue analysis or community survey purposes.When fish are collected for chemical analysis <strong>of</strong> tissue, whole body analysis isrequired to evaluate the representative dose to predator species. Species basedon feeding guilds and habitats present in the ESNR should be targeted forcollection. For example, it may be appropriate to target water column feeders(e.g. white perch), bottom dwellers (e.g. brown bullhead, channel catfish,white catfish, eel), and large forage range fish (largemouth bass, smallmouthbass, striped bass, rock bass). The analysis <strong>of</strong> individual fish is paramount,with compositing recommended only when necessary to achieve the minimumtissue mass for chemical analysis. If compositing is used, it is recommendedthat only fish from one habitat or feeding area be combined. Cross-speciescompositing should not be performed.Pr<strong>of</strong>essional judgment may be needed to decide whether to composite for fullscan analysis versus analysis <strong>of</strong> individual fish in accordance with a sitespecificanalytical hierarchy. For composite samples, it is recommended thatthe length <strong>of</strong> the smallest fish in a sample should be > 75% <strong>of</strong> the largest; thesex, weight, and length <strong>of</strong> each fish used for each sample should be recorded.Fish tissue data should be reported on a wet-weight basis becauserepresentative contaminant concentrations are needed for dietary modeling to<strong>Ecological</strong> <strong>Evaluation</strong> <strong>Technical</strong> <strong>Guidance</strong> Document 51Version 1.2 8/29/12
higher trophic level receptors. Lipids and percent moisture should beanalyzed in each sample.Generally, when fish are selected for community survey purposes, the goal isto collect all species in a defined area. Two common fish collection methodsfor biological survey purposes are seining, which has a limited efficacydepending on habitat, and electr<strong>of</strong>ishing, which, when used appropriately,greatly increases the number <strong>of</strong> available individuals captured. Often a seine isset on the downstream end <strong>of</strong> the selected survey reach to ensure capture <strong>of</strong> allstunned individuals including those not captured by the personnel at theelectr<strong>of</strong>ishing location itself. In most cases, a pulsed DC current is usedbecause this keeps mortality low. An AC current may be needed in streamswith low conductivity. Other methods, such as gill nets and minnow traps,can be used.The type <strong>of</strong> electr<strong>of</strong>ishing gear used (e.g., backpack, boat, barge) is dependenton the stream characteristics. The selection <strong>of</strong> the reach used should bereflective <strong>of</strong> the data needs for the risk assessment and should include allmajor subhabitats characteristic <strong>of</strong> the area. Sampling should be conducted inJune through early October during normal flow conditions. Sampling duringthe winter, at night, and during atypical flow conditions will not produce arepresentative data set.Electr<strong>of</strong>ishing should only be performed by trained personnel. Proper permitsmust be obtained (http://www.nj.gov/dep/fgw/scicolperm.htm). Detailedprocedures are given in the Rapid Assessment Protocols for use in WadeableStreams and Rivers (USEPA, 1999b) including QA/QC and important safetyprecautions.The method used most <strong>of</strong>ten to collect individual fish is to work slowlyupstream capturing all stunned fish as they drift. These fish are then placed inlive wells (situated outside <strong>of</strong> the current impact area) to reduce mortality.Once the fish in the selected reach have been collected, the specimens areidentified in the field to species level, and all data are recorded on data sheets.Fish less than 20 mm long are not included in tallies because <strong>of</strong> theirseasonality and limited response to the sampling method. Other data may becollected depending on the specific study design. Identification should bemade by an experienced biologist or ecologist familiar with <strong>New</strong> <strong>Jersey</strong>fishes. Once all organisms have been identified, the fish are released back intothe stream. Voucher specimens may be collected as the needs <strong>of</strong> the projectdictate.Physicochemical and habitat data should be conducted on the same day as thesurvey is conducted. If the data collection requires disturbing targeted habitat,it should be conducted either after the survey is complete or just outside thesurvey area.During collection <strong>of</strong> fish, sampling personnel should record observations suchas species identification, number <strong>of</strong> species, sex, age, length, weight, disease,and presence <strong>of</strong> gross histopathological anomalies that may be present in such<strong>Ecological</strong> <strong>Evaluation</strong> <strong>Technical</strong> <strong>Guidance</strong> Document 52Version 1.2 8/29/12
areas as the gills, fins, and eyes. Other observations <strong>of</strong> the general physicalhealth <strong>of</strong> the specimens may be made as necessary (removal <strong>of</strong> a scale orspine for aging, determination <strong>of</strong> sex, and observations <strong>of</strong> overall health suchas parasites, fin erosion, skin lesions). If field dissections <strong>of</strong> captured fish areconducted, observations <strong>of</strong> the internal organs, such as liver, muscles, andurogenital organs, should be made to assess the presence <strong>of</strong> any grossabnormalities. Additionally, field observations <strong>of</strong> behavioral changes (e.g.,twitching, gasping, long-axis whirling, and convulsions) should be made.If site COPECs are known to be associated with histopathological effects onfish, a subset <strong>of</strong> the fish collected should be subjected to internalhistopathological analysis (e.g., this analysis serves as a measurementendpoint associated with the assessment endpoints <strong>of</strong> survival, growth,development, reproduction, and maintenance <strong>of</strong> healthy fish populations).Laboratory methods for histopathological evaluation can be found in EPA(1995c) and Schmitt and Dethl<strong>of</strong>f (2000).Biological sampling for primary producers, such as benthic algae andplankton, may be needed for specialized evaluations such as a food web study.Refer to Appendix B for detailed procedures.6.2.1.4 Surface Water Toxicity TestsWhen surface water analytical data exceed the fresh water or saline watercriteria listed in the SWQS (N.J.A.C. 7:9-B) or the NJDEP ESC Table,surface water toxicity tests can provide an indication <strong>of</strong> potential effects onaquatic biota.Populations <strong>of</strong> aquatic organisms (e.g., fish, invertebrates, and plants) can beimpacted when the quality <strong>of</strong> the water in which they live is changed. Themagnitude <strong>of</strong> the impact depends on the magnitude <strong>of</strong> the change to eitherphysical parameters (e.g., temperature, DO, pH, suspended solids, andsalinity) or chemical parameters (e.g., concentrations <strong>of</strong> salts, nutrients, orchemicals). Aquatic toxicity testing is used to measure the effects <strong>of</strong> thesechanges on aquatic organism survival, growth, or reproduction using astandardized suite <strong>of</strong> laboratory organisms (e.g., fathead minnows or daphniafor freshwater; sheepshead minnows or mysid shrimp for saline water),following standardized testing protocols.Surface water toxicity tests should follow established USEPA guidance foraqueous toxicity tests. Acute toxicity studies should be performed inaccordance with Methods for Measuring the Acute Toxicity <strong>of</strong> Effluents andReceiving Waters to Freshwater and Marine Organisms (USEPA, 2002b).Short-term chronic toxicity studies should be performed in accordance withShort-Term Methods for Estimating the Chronic Toxicity <strong>of</strong> Effluents andReceiving Waters to Freshwater Organisms (USEPA, 2002c).Laboratories conducting surface water toxicity tests are required via N.J.A.C.7:26E-2.1(a)1i to be certified for "Category WPP08 Toxicity Testing" underN.J.A.C. 7:18.<strong>Ecological</strong> <strong>Evaluation</strong> <strong>Technical</strong> <strong>Guidance</strong> Document 53Version 1.2 8/29/12
Details regarding surface water toxicity test procedures can be found inAppendix C.6.2.2 SedimentsBasic sediment sampling guidance is provided in Section 5.3. The followingsections describe data development issues and the suggested protocols to be usedin more comprehensive sediment sampling programs.6.2.2.1 Sampling Plan Design for Study and Reference AreasThe investigator is referred to N.J.A.C. 7:26E-2.1 for appropriate analyticalprotocol and quality assurance requirements. The investigator is also referredto Section 10.0 for additional guidance on QA/QC and the preparation <strong>of</strong>quality assurance plans.Developing an appropriate sediment sampling plan is a critical step insediment assessment and monitoring studies. Sample location selection andsampling methods will result from the study design. A properly designedstudy will control extraneous sources <strong>of</strong> variability or error and allow for datathat are representative <strong>of</strong> the sediment and fulfill the study objectives.A primary goal <strong>of</strong> a sediment investigation is to determine whether thepresence <strong>of</strong> COPECs in sediment is adversely affecting sediment-dwellingorganisms. In the case <strong>of</strong> bioaccumulative compounds or constituents, theprimary goal is to determine whether these constituents are accumulating inthe tissues <strong>of</strong> aquatic organisms to such an extent that they pose a hazard tosediment-dwelling organisms and aquatic-dependent wildlife.A comprehensive sediment investigation should result in the following:Identification and quantification <strong>of</strong> the contaminants present in sediment;Understanding <strong>of</strong> the vertical and horizontal distribution <strong>of</strong> the COPECs inthe sediment relative to the appropriate ESCs or background contaminantlevels;Understanding <strong>of</strong> the physical, chemical, and biological processes andtemporal trends affecting the fate and bioavailability <strong>of</strong> the sedimentCOPECs at the site;Identification <strong>of</strong> the complete exposure pathways for sedimentcontamination;Identification <strong>of</strong> current potential ecological risks posed by the sedimentcontamination;Identification <strong>of</strong> potential bioaccumulation risks; andUnderstanding <strong>of</strong> the impact <strong>of</strong> disturbance <strong>of</strong> impacted sediment on thespecies in and around the site that are dependent on the aquatic system.I. <strong>Evaluation</strong> <strong>of</strong> Existing Site Investigation DataThe first step in designing a sediment investigation involves evaluating thedata and site-specific information collected as part <strong>of</strong> the site characterizationduring the SI. For sediment investigations, the following information shouldbe evaluated before developing a sediment study design:<strong>Ecological</strong> <strong>Evaluation</strong> <strong>Technical</strong> <strong>Guidance</strong> Document 54Version 1.2 8/29/12
Site history;Results <strong>of</strong> previous investigations (e.g., the EE);Locations and characteristics <strong>of</strong> historic and current COPEC sources, andcontaminant migration pathways in the vicinity <strong>of</strong> the site (e.g.,stormwater discharges, wastewater discharges, hazardous waste storage ordisposal, and hazardous material spills);Locations <strong>of</strong> depositional areas; andDesignated water uses.This information will provide a basis for identifying sediment quality issuesand concerns at the site, and support the design <strong>of</strong> a sampling program thatcharacterizes the nature, extent, and severity <strong>of</strong> sediment contamination. Inaddition, information regarding the physical and environmental conditions <strong>of</strong>the sediment-containing feature should be evaluated to identify relevantaquatic habitats and possible uses by ecological ROIs, including:Types <strong>of</strong> water bodies (e.g., freshwater or marine; river, estuary or bay);Presence <strong>of</strong> tides, waves or currents;Potential groundwater-surface water interactions;Bathymetry and sediment substrate;Presence or absence <strong>of</strong> exposed sediments;Shoreline features (e.g., bulkheads, emergent vegetation, beaches,terrestrial habitats);Potential presence <strong>of</strong> endangered species; andExtent and nature <strong>of</strong> surrounding land use (e.g., undeveloped, residential,industrial).All <strong>of</strong> these features can influence the use <strong>of</strong> the site by ecologicalcommunities and may help to identify complete exposure pathways requiringfurther assessment.II. Field VerificationAn inspection <strong>of</strong> the site is recommended when developing a sediment studyplan to assess the completeness and validity <strong>of</strong> the collected historic data andto identify any significant changes that might have occurred at the site sincethe collection <strong>of</strong> the historical data (e.g., SI data). If the study design is toinclude reference area locations, a reconnaissance sampling focused onparticle grain size distribution, TOC, or some other suitable indicators <strong>of</strong>chemical contamination may be worthwhile to refine the sampling design(Section 6.2.2.1 II. A. 3.).A. Sample Design Considerations based on Sampling Objectives1. Sampling DepthEEs typically focus on surface sediment (the biologically active zone,usually defined as approximately the top zero to six inches) becausebenthic communities are not significantly exposed to sediments at depth.However, if historical evidence indicates the potential for contamination to<strong>Ecological</strong> <strong>Evaluation</strong> <strong>Technical</strong> <strong>Guidance</strong> Document 55Version 1.2 8/29/12
e present at intervals greater than six inches, sampling at depth alsoshould be considered to evaluate potential future risks from the sediments,particularly if future dredging or scouring is likely to occur. To enhancecomparability <strong>of</strong> the resulting data, the same sediment sampling methodshould be used to collect samples from all <strong>of</strong> the sampling locations withinthe assessment area, whenever practicable. However, the need to collectboth surficial and deeper sediments may preclude this possibility in certaincircumstances.2. Sample VolumesA key factor <strong>of</strong> a given sediment study is the types <strong>of</strong> analyses requiredbecause the analyses will determine the sample mass required and howsamples are processed. The sediment samples that are collected in thefield are likely to be subjected to physical, chemical, and/or biologicaltesting to support the overall sediment assessment program. Therefore,the collection <strong>of</strong> sufficient volumes <strong>of</strong> sediment at each sample location t<strong>of</strong>acilitate the preparation <strong>of</strong> subsamples for toxicity testing and subsamplesfor chemical analysis from a single, homogenized sediment sample needsto be given consideration prior to field implementation when dealing witha study design that includes multiple indicators <strong>of</strong> sediment quality.3. Other Typical ParametersIt is important that conventional parameters receive as much carefulattention, in terms <strong>of</strong> sampling and sample processing procedures, as dothe COPECs or parameters <strong>of</strong> direct interest. Other parameters to considerfor analysis as a means to help interpret chemical, biological, andtoxicological data collected in an ERA at a sediment site include TOC,acid volatile sulfide (AVS), sediment grain size, total solids, ammonia,and total sulfides.4. Sample SizeThe number <strong>of</strong> samples collected directly affects the representativenessand completeness <strong>of</strong> the data for purposes <strong>of</strong> addressing project goals. Ageneral rule <strong>of</strong> thumb is that a greater number <strong>of</strong> samples will yield betterdefinition <strong>of</strong> the areal extent <strong>of</strong> the contamination or toxicity. Theappropriate number <strong>of</strong> samples is generally determined by the size <strong>of</strong> thestudy site, type, and distribution <strong>of</strong> the COPECs being measured,characteristics and homogeneity <strong>of</strong> the sediment, concentrations <strong>of</strong>COPECs likely to be found in the sediments, sample volume requirementsand desired level <strong>of</strong> statistical resolution or precision.B. Reference Area SamplingBasic guidance for background area sampling is provided in Section 5.3.4.This section describes the suggested reference area sampling to be used inmore comprehensive sediment sampling programs. Given that sedimentinvestigations typically include community surveys, toxicity tests, tissueresidue sampling, and bioaccumulation studies, the identification and selection<strong>Ecological</strong> <strong>Evaluation</strong> <strong>Technical</strong> <strong>Guidance</strong> Document 56Version 1.2 8/29/12
<strong>of</strong> appropriate reference area samples is a key component to consider in thedevelopment <strong>of</strong> a sediment study design. Comparison <strong>of</strong> site sediments tomultiple reference area sediments representative <strong>of</strong> the physical characteristics<strong>of</strong> the site sediment will facilitate interpretation <strong>of</strong> the resultant data. Furtherguidance on the use <strong>of</strong> reference area samples for sediment and sediment porewater toxicity tests are provided in Appendices D and E, respectively.To ensure meaningful comparison <strong>of</strong> sediment chemistry and toxicity testresults, it is important that physical and chemical factors at the reference areaaffecting the site chemistry and bioavailability (e.g., grain size, TOC, Eh, pH,concentrations <strong>of</strong> salts, nutrients, chemicals, and AVS) are similar to theconditions at the site. In addition, habitat conditions at reference arealocations should be as similar as possible to ensure that receptors identified asappropriate for site conditions also might be exposed to reference areas. Ifsite conditions are heterogeneous, it may be necessary to select more than onereference area for evaluation to ensure that all possible variations areaddressed.If an <strong>of</strong>f-site reference area is selected, it should be located within the samewatershed and should be <strong>of</strong> a similar habitat type. Any differences inmorphology between the reference area and the site should be documented.Contaminant levels in the reference area should also be characterized anddocumented. In addition, established regional background contaminant levels,reflecting ambient sediment or tissue concentrations based on monitoring datacollected from throughout a specified area over a given period, might beuseful in select cases if reference area locations are not able to be established.6.2.2.2 Sediment Habitat Assessments and Community SurveysBenthic macroinvertebrate surveys have been performed historically byUSEPA and state regulatory agencies to evaluate the ecological integrity <strong>of</strong>aquatic systems as mandated by the Clean Water Act. More recently, theyhave been used in conjunction with other analyses such as sediment chemistryand sediment toxicity tests to provide a measure <strong>of</strong> ecosystem health. Thistype <strong>of</strong> integrated approach, where sediment chemistry, sediment toxicity, andcommunity assessments are evaluated simultaneously, has been termed theSediment Quality Triad approach (Long and Chapman, 1985).Typically, benthic macroinvertebrate surveys are conducted to determinewhether the sediments at a given location are impaired (benthic communityshift) in comparison to a reference area. The survey consists <strong>of</strong> benthicmacroinvertebrate collection, organism identification, and data analysis. Dataanalysis <strong>of</strong>ten involves generating various metrics associated with community,population, and functional parameters such as species richness and toleranceindices (USEPA, 1990a).The benthic macroinvertebrate community is considered an important bioticcomponent <strong>of</strong> most aquatic systems and plays a significant role in thestructure and function <strong>of</strong> ecosystems, including the processing and transfer <strong>of</strong>organic material and nutrient cycling. Benthic macroinvertebrates are<strong>Ecological</strong> <strong>Evaluation</strong> <strong>Technical</strong> <strong>Guidance</strong> Document 57Version 1.2 8/29/12
elatively sedentary organisms that inhabit or depend upon the sedimentenvironment for their various life functions. They are sensitive to both longtermand short-term changes in sediment and water quality and are frequentlyused as environmental indicators <strong>of</strong> biological integrity because they arefound in most aquatic habitats, are <strong>of</strong> a size permitting ease <strong>of</strong> collection, canbe used to describe water-quality conditions or health <strong>of</strong> ecosystemcomponents, and can identify causes <strong>of</strong> impaired conditions (USEPA, 1990a).Benthic macroinvertebrate surveys are advantageous in that they integrate theinteractions <strong>of</strong> multiple contaminants and multiple routes <strong>of</strong> exposure, and canrespond to a broad array <strong>of</strong> potential pollutants. Some limitations are that theydo not identify the contaminant responsible for the observed toxicity,population impacts are not readily translated into contaminant remediationgoals, and results are <strong>of</strong>ten confounded by variables not related to contaminanttoxicity (predation, seasonal differences, physicochemical sedimentcharacteristics, food availability).The utility <strong>of</strong> benthic macroinvertebrate surveys may diminish whenconducted in urban streams and rivers that are known to contain diffuseanthropogenic pollutants and/or multiple industrial point discharges. Underthese conditions, survey results <strong>of</strong>ten indicate the presence <strong>of</strong> pollutiontolerant organisms with little to no difference in diversity when compared tothe results from a reference area location, and <strong>of</strong>fer limited useful informationregarding impacts that can be attributed directly to the site under investigation.Under these circumstances, the investigator may decide to rely more heavilyon other lines <strong>of</strong> evidence such as sediment toxicity tests and receptor tissueconcentrations.A full description <strong>of</strong> how to conduct a benthic macroinvertebrate survey isbeyond the scope <strong>of</strong> this document; however, some <strong>of</strong> the more commonlyused references are provided in Section 11.0 (USEPA, 1999b; USEPA, 1990a;USEPA, 1998b; and Long and Chapman, 1985).6.2.2.3 Sediment Pore Water SamplingBulk sediment chemistry data are derived from measuring only the solid phase<strong>of</strong> a sediment sample via standard analytical methods. Typically, bulksediment chemistry data are compared to conservatively based screeningcriteria to evaluate potential risk to benthic infauna. This type <strong>of</strong> comparisonis generally conducted during the screening phase <strong>of</strong> an investigation and it isacknowledged that site-specific bioavailability is not being measured at thisstage.In addition to direct exposure to contaminants associated with the sedimentsolid phase (e.g. mineral or organic phases), benthic organisms are exposed tothe sediment pore water, which is the water located in the interstitial spacebetween the sediment solid-phase particles. It is widely recognized thatcontaminant pore water concentrations more accurately predict toxicity andobserved community level effects than do whole sediment concentrations fornonionic compounds (Di Toro et al., 1991, 2005a; Di Toro, 2008; Hansen et<strong>Ecological</strong> <strong>Evaluation</strong> <strong>Technical</strong> <strong>Guidance</strong> Document 58Version 1.2 8/29/12
al., 1996; USEPA 1994a, 2003). The equilibrium partitioning (EqP) model,widely used for many years, measures bioavailability by calculating a porewater concentration. It is assumed that equilibrium exists between thecontaminants sorbed to the bulk sediment (organic carbon) and the sedimentpore water as expressed in following equation:C W = C S / f OC K OCSediment pore water concentrations (C W ) are derived through a calculationwhereby the bulk sediment concentration (C S ) is divided by the fraction <strong>of</strong>organic carbon (f OC ) times the organic carbon partition coefficient (K OC ).Toxicity in sediments can be estimated by comparing the derived pore waterconcentration to effects concentrations previously measured in water-onlyexposures (e.g. USEPA Ambient Water Quality Criteria).While the use <strong>of</strong> EqP is considered to provide a more accurate measure <strong>of</strong>bioavailability (toxicity) than simply screening bulk sediment data againstscreening values, more recent advancements in pore water sampling havemade it possible to measure site-specific bioavailability at an even greateraccuracy. Many <strong>of</strong> these methods have the advantage <strong>of</strong> directly measuringpore water, and thus reduce the inherent uncertainty associated withcalculating a pore water concentration via a model. Details regardingsediment pore water sampling techniques can be found in Appendix F.Groundwater to Surface Water Discharges:Contaminated groundwater that discharges to surface water also has thepotential to impact the pore water present in the interstitial space <strong>of</strong> sediment.Historically, measuring chemicals in groundwater that discharges to surfacewater was evaluated via groundwater monitoring wells positioned along theshoreline, through mass-balance equations designed to model dischargeconcentrations, or through the analysis <strong>of</strong> grab surface water samples.However, these methods do not accurately characterize the pore watercontaminant levels in the sediment in the biotic zone where the majority <strong>of</strong> thebenthic organisms reside.More recently, methods have been developed to sample tidal and subaqueousgroundwater discharges to a water body (Chadwick and Hawkins, 2008;Chadwick et al., 2003; Duncan et al., 2007a, b). These tools include intertidalseep sampling, piezometers, and diver-deployed diffusion samplers. Thereferences provide a detailed description <strong>of</strong> the tools and measures applicableto measuring COPECs in groundwater and pore water. Additionally, theUSEPA has released a document stressing the importance <strong>of</strong> evaluating thisecologically significant zone: Evaluating Ground-Water/Surface-WaterTransition Zones in <strong>Ecological</strong> Risk Assessments (USEPA, July 2008).Diffusion bags have also been used for the collection <strong>of</strong> pore water fromsediments when the groundwater to surface water pathway is <strong>of</strong> concern. Thediffusion bags are deployed and are allowed to equilibrate over time. Thebags are then collected and the water within the bags is analyzed for the<strong>Ecological</strong> <strong>Evaluation</strong> <strong>Technical</strong> <strong>Guidance</strong> Document 59Version 1.2 8/29/12
COPECs. The following references are provided for this procedure: Savoie,et al., 2000; Vroblesky, 2001a, b; Vroblesky, et al., 2002.6.2.2.4 Benthic Macroinvertebrate SamplingBenthic macroinvertebrate sampling techniques are well established andgenerally do not require expensive equipment or elaborate field effortsbecause these organisms tend to be sedentary and remain fairly localized.However, sampling strategy and data interpretation should reflect the dataneeds <strong>of</strong> the risk assessment.Collocated sediment chemistry analysis should be conducted during anybenthic macroinvertebrate survey. Physicochemical and habitat data should becollected on the same day as the survey. If the data collection requiresdisturbing targeted habitat, it should be conducted either after the survey iscomplete or just outside the survey area.Freshwater benthic macroinvertebrate community surveys should beconducted in accordance with USEPA (1990b, 1997b, and 1999b), USEPARapid Bioassessment Protocols For Use in Streams and Rivers: Periphyton,Benthic, Macroinvertebrates, and Fish (EPA 841-B-99-002), NJDEP (2005),and the NJDEP Water Monitoring and Standards (WMS) Program, Bureau <strong>of</strong>Freshwater and Biological Monitoring Standard Operating Procedures,Ambient Biological Monitoring Using Benthic Macroinvertebrates, Field,Lab, and Assessment Methods, Document No. BMNJ2, Revision No. 1; 2007,availableathttp://www.state.nj.us/dep/wms/bfbm/download/AMNET_SOP.pdf. Forconsistency with <strong>New</strong> <strong>Jersey</strong>’s Ambient Biomonitoring Network (AMNET)Program, benthic community structure should be evaluated with one <strong>of</strong> threestandardized regional multi-metric indices described in the SOP: HighGradient Macroinvertebrate Index (HGMI), Coastal Plain MacroinvertebrateIndex (CPMI), or the Pinelands Macroinvertebrate Index (PMI). The indicesshould be used to determine the biological condition category (i.e., excellent,good, fair, poor) for each sample location.In estuarine water, benthic macroinvertebrate community surveys should beconducted in accordance with the National Coastal Assessment FieldOperations Manual (USEPA 2001), available athttp://www.epa.gov/emap/nca/html/docs/c2kfm.pdf. Benthic communitystructure should be evaluated via two indices. For consistency with theNational Coastal Assessment Program and the NJDEP Bureau <strong>of</strong> MarineWater Monitoring, the Virginian Biogeographic Province benthic indexincorporating three metrics (EMAP BI, Paul et al., 2001) should bedetermined; the indices are used to determine the biological conditioncategory (stressed or not stressed) for each sample location. Additionally, forconsistency with existing USEPA data from the NY/NJ Harbor Estuary, theUSEPA Region 2 Index <strong>of</strong> Biotic Integrity (IBI) for the NY/NJ REMAPProject incorporating five metrics (Weisberg et al., 1998; Adams et al., 2003)<strong>Ecological</strong> <strong>Evaluation</strong> <strong>Technical</strong> <strong>Guidance</strong> Document 60Version 1.2 8/29/12
should also be determined. Detailed specifics on benthic invertebratesampling are included in Appendix G.6.2.2.5 Sediment Toxicity TestsWhen sediment analytical data exceed the sediment ESC, sediment toxicitytests are a line <strong>of</strong> evidence useful in identifying potential effects on aquaticbiota. Populations <strong>of</strong> benthic aquatic organisms (e.g., fish, invertebrates, andplants) can be impacted when the quality <strong>of</strong> the sediment in which they live ischanged. The magnitude <strong>of</strong> the impact depends on the magnitude <strong>of</strong> thechange to either physical parameters (e.g., temperature, DO, Eh/pH, grainsize, TOC, salinity) or chemical parameters (concentrations <strong>of</strong> salts, nutrients,and/or chemicals). Aquatic toxicity testing is used to measure the effects <strong>of</strong>these changes on benthic organism survival, growth, or reproduction using astandardized suite <strong>of</strong> laboratory organisms (e.g., amphipods and midges),following standardized testing protocols.Sediment toxicity tests should follow established guidance such as:Methods for Measuring the Toxicity and Bioaccumulation <strong>of</strong> SedimentassociatedContaminants with Freshwater Invertebrates (USEPA, 2000a)<strong>Evaluation</strong> <strong>of</strong> Dredged Material Proposed for Discharge in Waters <strong>of</strong> theU.S. – Testing Manual (USEPA, 1998c)Standard Test Method for Measuring the Toxicity <strong>of</strong> Sediment-AssociatedContaminants with Freshwater Invertebrates (ASTM E1706 - 05(2010)Standard Guide for Conducting Sediment Toxicity Tests with PolychaetousAnnelids (ASTM, 2007b)Standard Test Method for Measuring the Toxicity <strong>of</strong> Sediment-AssociatedContaminants with Estuarine and Marine Invertebrates (ASTM, 2008a).It is important to discuss sediment study objectives with the toxicity testinglaboratory to ensure that DQOs are met. The study design and statistical goals<strong>of</strong> the study should be fully understood prior to study initiation.While the National Environmental Laboratory Accreditation Program(NELAP) is a national certification program for surface water and wastewatertoxicity testing laboratories, there is no laboratory certification program forsediment or pore water testing. Details regarding sediment toxicity testprocedures can be found in Appendix D.6.2.2.6 Toxicity Testing for Sediment Pore Water and ElutriatePore water samples can be collected to assess impacts on benthic organisms.Elutriate water (water made in the laboratory by centrifuging a slurry <strong>of</strong>sediment and site surface water or laboratory water) samples are prepared toassess impacts <strong>of</strong> sediment resuspension on aquatic organisms. Because theresultant pore water and elutriate samples are in aqueous phase, they are mostappropriately tested like surface water samples.Although considerable research has been performed, standardized methodshave not yet been developed for sediment pore water and elutriate toxicity<strong>Ecological</strong> <strong>Evaluation</strong> <strong>Technical</strong> <strong>Guidance</strong> Document 61Version 1.2 8/29/12
tests (USEPA, 2002e). After collection <strong>of</strong> pore water samples or preparation<strong>of</strong> elutriates, toxicity tests should follow established USEPA guidance foraqueous toxicity tests. Acute toxicity studies should be performed inaccordance with Methods for Measuring the Acute Toxicity <strong>of</strong> Effluents andReceiving Waters to Freshwater and Marine Organisms (USEPA, 2002b).Short-term chronic toxicity studies should be performed in accordance withShort-Term Methods for Estimating the Chronic Toxicity <strong>of</strong> Effluents andReceiving Waters to Freshwater Organisms (USEPA, 2002c), or Short-TermMethods for Estimating the Chronic Toxicity <strong>of</strong> Effluents and ReceivingWaters to Marine and Estuarine Organisms (USEPA, 2002d), as appropriate.NJDEP toxicity laboratory certification is only required for those laboratoriesperforming Whole Effluent Toxicity (WET) testing for NJPDES compliancepurposes. However, surface water toxicity testing guidance can also be foundin the NJDEP’s Regulations Governing the Certification <strong>of</strong> Laboratories andEnvironmental Measurements (N.J.A.C. 7:18, Sub-Chapter 7 ToxicityTesting).While the NELAP is a national certification program for surface water andwastewater toxicity testing laboratories, there is no laboratory certificationprogram for sediment pore water or elutriate testing.Details regarding sediment pore water and elutriate toxicity test procedurescan be found in Appendix E.6.2.3 SoilBasic soil sampling guidance is provided in Section 5.3. The following sectionsdescribe data development issues and the suggested protocols to be used in morecomprehensive soil sampling programs.6.2.3.1 Sampling Plan Design for Study and Reference AreasI. Study DesignThe goals <strong>of</strong> a soil sampling program include preliminary and definitivedetermination <strong>of</strong> the nature and areal extent <strong>of</strong> contamination, andidentification <strong>of</strong> areas <strong>of</strong> highest contamination. Data are gathered in support<strong>of</strong> the ERA, but may also be used for long-term monitoring, or for soiltransport and deposition modeling. Site-specific details regarding the studyobjectives, DQOs, sampling methodology, location, and depth <strong>of</strong> samplesmust be specified, as well as field and laboratory QA/QC procedures(N.J.A.C. 7:26E). The investigator is referred to NJDEP (2005) and Sections5.4 and 6.2.3.3 for further information.II. Analytical Protocol and Additional MeasurementsThe investigator is referred to N.J.A.C. 7:26E-2.1 for appropriate analyticalprotocol and quality assurance requirements. The investigator is also referredto Section 10.0 for additional guidance on QA/QC and the preparation <strong>of</strong>quality assurance plans.<strong>Ecological</strong> <strong>Evaluation</strong> <strong>Technical</strong> <strong>Guidance</strong> Document 62Version 1.2 8/29/12
TOC, grain size, cation exchange capacity, and pH analyses may beconsidered for some soil investigations. These data may provide a qualitativeindication <strong>of</strong> bioavailability and toxicity. These results may also be used tointerpret borderline exceedances in a weight-<strong>of</strong>-evidence or pr<strong>of</strong>essionaljudgment decision (Suter, 1993 and Suter, et al., 2000).III. Background and Reference AreasBasic guidance for background area sampling is provided in Section 5.3.4.The following section describes the suggested reference area sampling to beused in more comprehensive soil sampling programs. When investigating soilcontamination to determine whether it is linked to site operations, and in thedevelopment <strong>of</strong> remedial goals, it is important to establish the chemicalcomposition <strong>of</strong> background area soils and assess the site’s contaminationrelative to the regional quality <strong>of</strong> the upland soil area being investigated.Many <strong>of</strong> the state’s soils, especially in urban and industrial settings, havebecome contaminated by historic nonpoint source discharges, resulting in thediffuse, anthropogenic contamination <strong>of</strong> soils at concentrations higher than thenatural background.While it is difficult to distinguish between site and nonsite-relatedcontamination in some settings, a reasonable attempt should be made to do so.If potential sources <strong>of</strong> contamination are present upgradient <strong>of</strong> the site, and itis believed that these sources have contributed to soil contamination detectedon-site, these areas should be sampled, and pr<strong>of</strong>essional judgment shoulddictate how these data are to be interpreted and used. Note that these resultswill not be considered representative <strong>of</strong> true reference area (i.e., naturalbackground) conditions. To demonstrate that contamination may be causedby natural background, the investigator is referred to N.J.A.C. 7:26E-3.8(a)and 3.8(b).For upgradient and <strong>of</strong>f-site background area locations, the collection <strong>of</strong> threeto five samples is recommended from each appropriate depth interval toestablish a range <strong>of</strong> background contaminant levels (the larger number <strong>of</strong>samples is recommended because <strong>of</strong> soil heterogeneity). Samples should becollected from areas outside the site’s potential influence. The samples shouldnot be collected from locations directly influenced by or in proximity to otherobvious sources <strong>of</strong> contamination (e.g., other hazardous waste sites, sewer andstormwater outfalls, agricultural areas, other point and nonpoint sourcedischarges). At a minimum, upgradient and local background area samplesshould undergo the same chemical analyses as site-related samples.Additional determinations, such as terrestrial floral and faunal structure, maybe required on a case-by-case basis.Given that soil investigations can include community surveys, toxicity tests,tissue residue sampling, and bioaccumulation studies, the identification andselection <strong>of</strong> appropriate reference area samples is a key component to considerwhen developing a soil study design. Testing <strong>of</strong> reference area soils providesa measure <strong>of</strong> relative or incremental risk. Comparisons <strong>of</strong> test soils to<strong>Ecological</strong> <strong>Evaluation</strong> <strong>Technical</strong> <strong>Guidance</strong> Document 63Version 1.2 8/29/12
multiple reference area soils representative <strong>of</strong> the physical characteristics <strong>of</strong>the test soil will facilitate interpretation <strong>of</strong> the resultant data. Further guidanceon the use <strong>of</strong> reference area samples for soil toxicity tests are provided inAppendix H.To ensure meaningful comparisons <strong>of</strong> soil chemistry and toxicity test results,it is important that physical and chemical factors at the reference areaaffecting the site chemistry and bioavailability (e.g., grain size, TOC, redoxpotential, pH, concentrations <strong>of</strong> salts, nutrients, and chemicals) are similar tothe conditions at the site. In addition, habitat conditions at reference arealocations should be as similar as possible to ensure that receptors identified asappropriate for site conditions also might be exposed to reference areas. Ifsite conditions are heterogeneous, it may be necessary to select more than onereference area for evaluation to ensure that all possible variations areaddressed. In addition, established regional background contaminant levels,reflecting ambient soil or tissue concentrations based on monitoring datacollected from throughout a specified area over a given period might be usefulin select cases if reference area locations cannot be established for yourproject.In the event that an acceptable clean reference area cannot be found on-site, an<strong>of</strong>f-site local reference area location should be sampled. If an <strong>of</strong>f-sitereference area is selected, it should be located within the same watershed andshould be <strong>of</strong> a similar habitat type, and differences in morphology should benoted. Any contaminant levels in the reference area should also be noted.6.2.3.2 Terrestrial Habitat Assessments and Community SurveysThe identification <strong>of</strong> terrestrial habitats within ESNRs and quantitativecommunity surveys are <strong>of</strong>ten overlooked components <strong>of</strong> the ERA. However,an understanding <strong>of</strong> the terrestrial environment at a site is a critical feature toaddressing problem formulation concerns with the extent <strong>of</strong> ESNRs, thepotential presence <strong>of</strong> threatened or endangered species, and the type <strong>of</strong>ecological receptors to be used in potential food chain modeling or soiltoxicity testing. Additionally, the evaluation <strong>of</strong> terrestrial habitats andcommunities can be used as a line-<strong>of</strong>-evidence as part <strong>of</strong> the riskcharacterization.Communities are defined as an interacting collection <strong>of</strong> plants and animalsinhabiting a given area. In many ERAs, the community assemblages will besimple or driven by early successional stages that are the result <strong>of</strong>anthropogenic actions (e.g., clearing, landscaping, farming, or building). Insuch instances, a qualitative description <strong>of</strong> the types <strong>of</strong> plants and potentialwildlife inhabiting the area may be developed through a pedestrianreconnaissance <strong>of</strong> the site or AOC. Qualitative surveys such as this arefocused more on a species inventory. However, at other sites encompassing avariety <strong>of</strong> different ESNRs or community types, quantitative surveys may berequired to more adequately define the receptors that will be evaluated in theERA. In complex situations, quantitative surveys may be employed to<strong>Ecological</strong> <strong>Evaluation</strong> <strong>Technical</strong> <strong>Guidance</strong> Document 64Version 1.2 8/29/12
identify community metrics such as density, diversity, dominance, andfrequency. Density is the number <strong>of</strong> individuals per unit area. Diversity is thenumber <strong>of</strong> species per unit area. Dominance is the measure <strong>of</strong> the size,weight, or bulk <strong>of</strong> a species relative to all species in a given area. Frequencyis a measure <strong>of</strong> the commonness and distribution <strong>of</strong> a species within a givenarea.The extent to which plant and animal surveys will be conducted will dependupon the stage <strong>of</strong> the evaluation process and the complexity <strong>of</strong> the site.Qualitative surveys using direct observations are appropriate in EEs.Quantitative surveys that would potentially examine population metrics atdifferent trophic levels may be needed in the most complex <strong>of</strong> ERAs.It is not within the scope <strong>of</strong> this guidance document to present acomprehensive review <strong>of</strong> all potential community survey techniques.Depending upon the type <strong>of</strong> communities being evaluated (e.g., grasslands,shrub lands, or forests), different techniques for quantitative communitysurveys can be employed. The investigator is referred to the followingreferences for information on different community assessment techniques;USFWS (1981); USEPA (1990c); Kent and Coker (1992); USEPA (1992b);Bonham (1989); Suter et al. (2000); USEPA (2002f) and Kapustka et al.(2004). It is suggested that Breden (1989) or Collins and Anderson (1994) beused as a guide for defining plant communities. Additional, specialmanagement areas such as the Meadowlands and the Pinelands (Harshberger,1970) should be researched for communities typical <strong>of</strong> those settings. Forwildlife populations, the investigator is referred to Davis (1982); Skalski andRobson (1992); Suter et al. (2000); Williams et al. (2002); and Braun (2005).6.2.3.3 Surface Soil SamplingSection 5.3 provides general guidance on the collection <strong>of</strong> soil samplesassociated with the performance <strong>of</strong> the EE. The investigator should be awarethat additional soil sampling may be necessary during the performance <strong>of</strong> theERA. The need for such sampling is site-specific and may depend on anumber <strong>of</strong> factors such as refining the extent <strong>of</strong> contamination (horizontallyand vertically) relative to the ESC within an ESNR, or the collection <strong>of</strong> soilsamples in conjunction with methods used to evaluate ecological risk (e.g.,earthworm or small mammal tissue residue or toxicity testing, etc.).6.2.3.4 Biological Sampling <strong>of</strong> Soil Invertebrates, Plants and WildlifeMany contaminants are capable <strong>of</strong> being transferred or concentrated from soilto biota. Bioaccumulation <strong>of</strong> contaminants within tissues <strong>of</strong> organisms cancause chronic effects on individual organisms (e.g., forage or prey species)and expose higher trophic level organisms (predators) to COPECs. Tissueconcentrations <strong>of</strong> bioaccumulated contaminants can increase as they aretransferred up the food chain through the process <strong>of</strong> biomagnification (Section6.1.3.2).<strong>Ecological</strong> <strong>Evaluation</strong> <strong>Technical</strong> <strong>Guidance</strong> Document 65Version 1.2 8/29/12
In ERAs, tissue residue analyses are used to measure whole body contaminantconcentrations in prey consumed by predators <strong>of</strong> concern. Tissue residue dataprovide site-specific information necessary to reduce uncertainty inherent infood chain modeling through multiple trophic levels. This measure <strong>of</strong> thedietary concentration or exposure dose to species <strong>of</strong> concern can be comparedwith dietary benchmarks and literature-based criteria (Sample et al., 1996) toestimate risk. Knowing the concentration <strong>of</strong> a specific contaminant in preytissue corresponding to the LOAEL/NOAEL and the site-specific BAF forthat contaminant, (e.g., the relationship between the contaminant level in soiland in the prey species), a protective soil cleanup number based upon theLOAEL/NOAEL can be estimated (Sample et al., 1996). Further informationregarding development <strong>of</strong> ecological risk-based remediation goals is providedin Section 7.0.Tissue samples collected from any study and reference areas should bespatially and temporally collocated with discrete soil samples to make directcomparisons <strong>of</strong> the data.Soil FaunaThe most commonly sampled soil invertebrate species, typically constitutingthe majority <strong>of</strong> invertebrate biomass in soil, is the earthworm. Samplingtechniques include, but are not limited to coring, driving organisms from soil,sieving, and density separation (ASTM, 2004).The collection <strong>of</strong> additional receptors (prey species) such as terrestrial andflying insects, small birds, amphibians, reptiles, and small mammals fortissue- residue analysis may be appropriate based upon site-specific ECSMexposure pathways. The investigator is referred to the literature to determinethe best sampling methods for their particular study areas (e.g., USEPA,1994a and 1997a).Terrestrial FloraMost plant testing guidance has been geared toward agricultural crops, withtest methods targeting exposure to chemical products such as pesticides.These methods can be used for testing the effects <strong>of</strong> site soils on moreappropriate site-related species such as perennial ryegrass (Lolium perenne)and red clover (Trifolium pratense). Field sample collection techniques forterrestrial fauna may include biased sampling, the use <strong>of</strong> quadrants, transects,or grids. The investigator is again referred to the literature to determine thebest sampling methods to fit their particular circumstances (e.g., USEPA,1994a and 1997a).Background AreasWhen examining site-related tissue residue levels in any study area, it isimportant to take into account potential contaminant contributions frombackground contaminant levels. Background area samples should be collectedfrom an area outside the site’s potential influence and not in locations directlyinfluenced by or in proximity to other obvious sources <strong>of</strong> contamination.<strong>Ecological</strong> <strong>Evaluation</strong> <strong>Technical</strong> <strong>Guidance</strong> Document 66Version 1.2 8/29/12
Man-made habitat is excluded from sampling for background contaminantlevel purposes. Background area locations with comparable habitat,community structure and maturity, and the same soil type and lithology as thestudy area are preferable. Because <strong>of</strong> soil heterogeneity, at a minimum,several background area samples are strongly recommended to establish arange <strong>of</strong> background contaminant levels. At a minimum, background areasamples should receive the same chemical analyses as site-related samples tomake direct comparisons with the data.For more detailed guidance on biota sampling approaches, techniques, andtissue residue analytical methods, the investigator is referred to the literature(e.g., USEPA, 1994a and 1997a; and ASTM, 2004).6.2.3.5 Surface Soil Toxicity TestsWhen surface soil analytical data exceed the soil criteria listed in the NJDEPESC Table, soil toxicity tests can provide an indication <strong>of</strong> potential effects onsoil invertebrates and plants.Populations <strong>of</strong> soil organisms (e.g., invertebrates and plants) can be impactedwhen the quality <strong>of</strong> the soil in which they live is changed. The magnitude <strong>of</strong>the impact depends on the magnitude <strong>of</strong> the change to either physicalparameters (e.g., Eh/pH, grain size, total organic matter) or chemicalparameters (e.g., concentrations <strong>of</strong> salts, nutrients, and chemicals). Soiltoxicity testing is used to measure the effects <strong>of</strong> these changes on soilorganism survival, growth, or reproduction using a standardized suite <strong>of</strong>laboratory organisms (e.g., earthworms and plants), following standardizedtesting protocols.Soil toxicity tests should follow established guidance as published byAmerican Society for Testing and Materials (ASTM), Standard Guide forConducting Laboratory Soil Toxicity or Bioaccumulation Tests with theLumbricid Earthworm Eisenia Fetida and the Enchytraeid PotwormEnchytraeus albidus (ASTM, 2004), and Standard Guide for ConductingTerrestrial Plant Toxicity Tests (ASTM, 2009).Detailed specifics regarding soil toxicity test procedures can be found inAppendix H.6.3 <strong>Ecological</strong> Risk Assessment ReportUpon completion <strong>of</strong> the ERA, the investigator should document the findings andconclusions in a concise report for review and acceptance by the LSRP. The ERAshould outline the process followed in completing the ERA, and the data collected, insupport <strong>of</strong> its development. The investigator should employ a weight-<strong>of</strong>-evidenceapproach in outlining what the potential ecological impacts associated with identifiedreleases in the site-related ESNRs may be. The investigator, at a minimum, shouldincorporate the following information into the report: Executive Summary: providing a summary description <strong>of</strong> the basis andbackground <strong>of</strong> the project, and the findings <strong>of</strong> field investigations;<strong>Ecological</strong> <strong>Evaluation</strong> <strong>Technical</strong> <strong>Guidance</strong> Document 67Version 1.2 8/29/12
Objectives <strong>of</strong> the ERA: including a description <strong>of</strong> the work plan, and anydeviations realized as a result <strong>of</strong> project implementation;Problem formulation: including a comprehensive site history and descriptions <strong>of</strong>the ESNRs located on, adjacent to and potentially under the influence <strong>of</strong> the site,identification <strong>of</strong> assessment and measurement endpoints, development <strong>of</strong> ECSM,and identification <strong>of</strong> TRVs and other screening benchmarks;Description <strong>of</strong> field activities: including discussion <strong>of</strong> equipment used, testprotocols, tabular descriptions <strong>of</strong> sample locations and depth;Results <strong>of</strong> the chemical and biological analyses and risk calculations includingtabular results and figures showing ESNRs, sampling locations, date and depthsand analytical results in excess <strong>of</strong> the appropriate ESC and delineation samples bymedia, chemical fraction and area as necessary as per N.J.A.C. 7:26E-1.6(b)6;Uncertainty analysis;Conclusions; andAppendices, containing laboratory analytical data and field logs.6.4 Special CircumstancesThe purpose <strong>of</strong> this section is to augment this guidance for commonly occurringproblematic or scientifically challenging circumstances that are not comprehensivelyaddressed in the ERAGs guidance and that, if not carefully considered in the projectplanning stage, may result in an EE or ERA that is inadequate in scope.6.4.1 WetlandsWetlands are unique and sensitive ecological units. Science has come torecognize that wetlands provide valuable functions in the natural environment.These functions include providing necessary breeding habitat for a variety <strong>of</strong>organisms such as waterfowl, fish, and shellfish; erosion and stormwater floodcontrol; groundwater recharge; and nutrient transport. Wetlands can be found infreshwater, brackish, and saline conditions. They can be found along coasts, inforests, and along rivers or creeks. They can be found anywhere that the saturatedsoil conditions necessary for wetlands development exist.Wetlands are defined as those areas that are inundated or saturated by surfacewater or groundwater at a frequency and duration sufficient to support, and thatunder normal circumstances do support, a prevalence <strong>of</strong> vegetation typicallyadapted for life in saturated conditions. Wetlands generally include swamps,marshes, bogs, and similar areas [33 CFR 323.2 (c)]. The primary governingregulation for freshwater wetlands in the <strong>State</strong> <strong>of</strong> <strong>New</strong> <strong>Jersey</strong> is the <strong>New</strong> <strong>Jersey</strong>Freshwater Wetlands Protection Act (N.J.S.A. 13:9B-1 et seq.) and to a lesserextent, the Water Pollution Control Act, N.J.S.A. 58:10A-1 et seq. The rulesgoverning the implementation <strong>of</strong> the Freshwater Wetlands Protection Act and theWater Pollution Control Act are the <strong>New</strong> <strong>Jersey</strong> Freshwater Wetlands ProtectionAct Rules at N.J.A.C. 7:7A. The primary governing regulation <strong>of</strong> coastalwetlands is the Coastal Zone Management Rules, N.J.A.C.7:7.While the focus <strong>of</strong> this guidance is on the completion <strong>of</strong> ERAs, it is important tounderstand that wetlands are ESNRs that are regulated by the NJDEP. As part <strong>of</strong><strong>Ecological</strong> <strong>Evaluation</strong> <strong>Technical</strong> <strong>Guidance</strong> Document 68Version 1.2 8/29/12
the process <strong>of</strong> understanding the extent <strong>of</strong> a wetlands as part <strong>of</strong> identifyingESNRs, it may be necessary to define the boundary <strong>of</strong> the wetlands from aregulatory standpoint through a process known as wetlands delineation. TheFreshwater Wetlands Protection Act requires that freshwater wetlands beidentified or delineated in <strong>New</strong> <strong>Jersey</strong> using the three-parameter approach asdescribed in the Federal Interagency Committee for Wetland Delineation (1989).Such an approach dictates that areas meeting the defined criteria <strong>of</strong> vegetation,soils, and hydrology will be designated as jurisdictional wetlands.For vegetation, the criterion is more than 50 percent <strong>of</strong> the composition <strong>of</strong> thedominant species from all strata should be categorized as hydrophytic or adaptedto living in saturated areas. That is, the plant species should be classified asobligate, facultative wetland or facultative as defined in the "National List <strong>of</strong>Plant Species That Occur in Wetlands," published by the United <strong>State</strong>s Fish &Wildlife Service (USFWS, 1988). Soils are considered hydric if they meet thecriteria defined by the National <strong>Technical</strong> Committee for Hydric Soils.Hydrology should be present to effect either permanent or periodic saturation <strong>of</strong>the soil. The Federal Interagency Committee for Wetland Delineation (1989)does allow an assumption that the hydrologic parameter is present if hydric soilsand hydrophytic vegetation are present and field indications <strong>of</strong> hydrology arepresent.Wetland delineation involves the determination <strong>of</strong> the boundary between the areaswhere the three hydric parameters are present and where they are not. Usingperceived changes in elevation and vegetation as a guide, representativeobservation points are selected along the apparent boundary <strong>of</strong> the wetland areas.At each <strong>of</strong> the observation points, soil borings are made to determine soil andhydrologic conditions. Observations <strong>of</strong> floral species and surface hydrologicconditions are also made. Observations would be made on both the wetland andupland side. The boundary would then be located between the two.From a regulatory standpoint, wetland boundaries must be confirmed through theNJDEP Division <strong>of</strong> Land Use Regulation through the Letter <strong>of</strong> Interpretation(LOI) process as is outlined at N.J.A.C. 7:7A-3.The concern with conducting ERAs in wetland environments is that wetlandscontain receptors that can be typical <strong>of</strong> upland and aquatic environments, andthose that may be specific only to wetlands. Wetland media may act as soil,sediment or both depending on the type <strong>of</strong> wetland and season. Refer to Section5.4.3 for additional guidance on whether to use soil ESC or sediment ESC.Additionally, exposure pathways not normally seen in upland settings or in solelyaquatic settings may have to be considered (e.g., groundwater exposure toshallow-rooted plants).In designing ERAs for wetlands, the investigator should bear in mind that one <strong>of</strong>the major benefits to the environment and to society are the ecological functionsthat the wetlands perform. In addition to an understanding <strong>of</strong> ecotoxicologicalimpacts, the risk assessment should consider whether the COPECs beingevaluated have impacted the functional capabilities <strong>of</strong> the wetlands. This<strong>Ecological</strong> <strong>Evaluation</strong> <strong>Technical</strong> <strong>Guidance</strong> Document 69Version 1.2 8/29/12
evaluation might necessitate the completion <strong>of</strong> a wetland functional analysis(Bartoldus, 1999, Bartoldus, et al., 1994, Magee, 1998, and USACE, 1995),which can range from a semiquantitative assessment such as the Wetland<strong>Evaluation</strong> Technique (Adamus, et al., 1987), to a more rigorous quantitativeassessment such as the Hydrogeomorphic (HGM) evaluation (Brinson, 1993,Smith, 1993, and Smith et al., 1995). At a minimum, an increased focus on theproblem formulation stage should be made to ensure that all <strong>of</strong> the intricacies <strong>of</strong>the wetland habitat are addressed.It is also advised that an increased focus be placed on the risk managementaspects <strong>of</strong> the project, and the ecological impacts <strong>of</strong> the proposed remedialmeasures. If the ERA indicates that intrusive remedial measures may benecessary to meet ecologically based cleanup goals, the potential ramifications <strong>of</strong>the physical impacts to the wetlands and the resulting difficulties in mitigating thewetlands for those physical impacts should be considered prior to remedyselection and design. For a full discourse on the completion <strong>of</strong> ERAs in wetlandsenvironments, the investigator is directed to SETAC (1995).6.4.1.1 Wetland Permit ConsiderationsAny person proposing to engage in a regulated activity in freshwater wetlandsand/or <strong>State</strong> open waters as described in N.J.A.C. 7:7A-2.2 must obtain thenecessary permits from the Department as required by the FreshwaterWetlands Protection Act Rules. For more guidance on the freshwaterwetlands program see http://www.nj.gov/dep/landuse/fww.html. Each permitapplication submitted is reviewed by the Department to determine compliancewith freshwater wetlands regulations. Applications should be submitted to theDivision <strong>of</strong> Land Use Regulation, Application Support, Mail Code 501-02A,PO Box 420, Trenton, NJ 08625-0420.At times it is necessary for the Department to seek comments or concurrencefrom federal agencies for regulated activities in freshwater wetlands and/or<strong>State</strong> open waters. Those instances are as follows.Pursuant to a 1993 Memorandum <strong>of</strong> Agreement between the United <strong>State</strong>sFish and Wildlife Service (USFW), the USEPA and the Department, if aFederally-Listed Threatened or Endangered (T&E) Species and DesignatedCritical Habitat is found to be present or adjacent to the site, the Departmentmust provide the USFW with a copy <strong>of</strong> the permit application for review andcomment by the Service. Depending on the nature and extent <strong>of</strong> commentsfrom the USFW, the applicant, in conjunction with the site’s LSRP will berequired to respond to the comments and potentially need to modify theremedy for a given site, or timing <strong>of</strong> said remedy, to be protective <strong>of</strong> afederally-listed T&E species and its designated critical habitat. Accordingly,it is strongly recommended that an LSRP or Responsible Party engage theUSFW service during the development <strong>of</strong> a remedial strategy for a given siteif it is determined that a federally listed T&E species or Designated CriticalHabitat is present or adjacent to the site.<strong>Ecological</strong> <strong>Evaluation</strong> <strong>Technical</strong> <strong>Guidance</strong> Document 70Version 1.2 8/29/12
Pursuant to N.J.A.C. 7:7A-12.2, USEPA Review, the Department is requiredto submit any application involving a major discharge into freshwaterwetlands or <strong>State</strong> open water to the USEPA. A major discharge under thefreshwater wetlands protection act rules is defined in N.J.A.C. 7:7A-1.4. Anexample <strong>of</strong> a major discharge is the filling <strong>of</strong> five or more acres <strong>of</strong> freshwaterwetlands and/or <strong>State</strong> open waters. If the USEPA objects to the issuance <strong>of</strong>the applicable permit, the Department will seek input from the applicant, inconjunction with the site’s LSRP, to address USEPA’s objection to allow forissuance <strong>of</strong> the applicable permits. If a regulated activity is proposed as part<strong>of</strong> the remediation <strong>of</strong> the site that meets the definition <strong>of</strong> a major discharge, itis strongly recommend that the applicant request a pre-application meetingwith the Department to discuss the remedial strategy. To request a preapplicationmeeting, please send a letter with accompanying topographic mapand project description to the Department’s Office <strong>of</strong> Dredging and SedimentTechnology, P.O. 420, Mail code 401-04P, Trenton, NJ 08625-420.Please be advised that other permits may be required for remedial activitiesundertaken in natural resources under the jurisdiction <strong>of</strong> the land useregulation program. For further guidance please refer tohttp://www.nj.gov/dep/landuse/ for further information.6.4.1.2 Wetland Backfill ConsiderationsAs a condition <strong>of</strong> the permit(s), restoration <strong>of</strong> the wetland is required that mayinclude more rigorous components than those associated with a remedialaction undertaken in an industrial or terrestrial setting. The material used torestore a wetland shall be <strong>of</strong> a quality similar that <strong>of</strong> pre-existing conditions asper N.J.A.C. 7:7A-15.2. For example, the type <strong>of</strong> fill material used to backfillan excavation in a wetland must be capable <strong>of</strong> supporting the re-establishment<strong>of</strong> native plant species. Similarly, the type <strong>of</strong> material used to backfill asediment remedial action in a stream should allow for the re-establishment <strong>of</strong>the benthic macroinvertebrate community.6.4.2 EstuariesEstuaries are tidally influenced areas where freshwater inputs from rivers, streamsor other conveyances enter coastal marine environments. They are highlyproductive and nutrient rich, providing nursery and refugia for invertebrates, fish,and wildlife <strong>of</strong> ecological, recreational, and commercial value. Estuaries aredefined as ESNRs pursuant to N.J.A.C 7:1E-1.8 and should be identified in theEE. Estuaries potentially receive contaminants via previously identifiedcontaminant migration pathways. Where the contaminant migration pathway isbelieved to link to the estuarine environment, those areas may be subject to tidalexchanges that require the investigator to factor this into the assessment. Forexample, through a complete contaminant migration pathway, COPECs may enterthe estuarine environment and deposit in the near-shore sediments or nearbyshoreline, or they may be transported some distance depending on their physicaland chemical properties. The potential for COPECs to move within the estuaryshould be considered in the ERA and delineated during the RI pursuant to<strong>Ecological</strong> <strong>Evaluation</strong> <strong>Technical</strong> <strong>Guidance</strong> Document 71Version 1.2 8/29/12
N.J.A.C. 7:26E-4.8(c)1. The ERA may require the sampling <strong>of</strong> environmentaland biological media to underpin this evaluation.In addition, salinity regimes are dynamic in estuaries such that both freshwaterand marine species may be collocated in areas where potential exposure toCOPECs may occur. COPEC fate, transport, and toxicity may also be affected bythe salinity and need to be taken into consideration. Biological surveys may beneeded in those areas to provide more site-specific information on the variety <strong>of</strong>ecological receptors that may require more focused evaluation in the ERA.<strong>Ecological</strong> receptors in the estuary potentially exposed to COPECs includemigratory waterfowl and fish (freshwater and marine), benthicmacroinvertebrates, and submerged and emergent vegetation in the near-shoreareas. Salinity measurements should be taken to determine the appropriate ESCto apply and appropriate species to be used for toxicity testing. Given thatestuaries provide nursery and refugia, it may be appropriate to consider early lifestagetoxicity testing (ASTM, 2005b). Approaches to sampling these groups havebeen provided previously (Section 5.3.3.2).6.4.3 Urban AreasWhile ERAs can be conducted in urban areas, the increased anthropogenicdisturbance, some <strong>of</strong> which may be hundreds <strong>of</strong> years old, places special burdenson the process. The investigator is advised to place special focus on the problemformulation stage and in the selection <strong>of</strong> assessment and measurement endpoints.Of particular importance will be the selection <strong>of</strong> appropriate background arealocations as the potential ability to distinguish between site-related impactsassociated with a release, and the simple physical impacts from extended periods<strong>of</strong> development.6.4.4 Hot SpotsHot spots are well-defined parts <strong>of</strong> a site or ESNRs where contaminant levels aresubstantially elevated above ESC or background contaminant levels in a highpercentage <strong>of</strong> the samples. The identification <strong>of</strong> hot spots will include theapplication <strong>of</strong> pr<strong>of</strong>essional judgment. The area where the high frequency <strong>of</strong>exceedances occurs may be relatively small (e.g., several square yards) or large(e.g., an acre or two), and found within the ESNR. Hot spots generally aredefined by (1) the frequency <strong>of</strong> detection above ESC or background contaminantlevels is elevated compared to surrounding site samples (e.g., 75%), and (2) themagnitude <strong>of</strong> the exceedance is substantial (e.g., more than 10 times the ESC orbackground contaminant levels). Where T&E species are present, a lowermultiplier should be considered. Statistical approaches (e.g., USEPA 2006a) thatidentify outliers at the upper tail <strong>of</strong> the data distribution can also be used toindicate localized source areas.Pr<strong>of</strong>essional judgment will be needed in most cases to help determine whether ahot spot exists. Once identified, hot spots may be managed in a combination <strong>of</strong>ways, but typically through one <strong>of</strong> several actions: (1) collecting <strong>of</strong> morechemical or biological data to reduce uncertainty; (2) moving the areas forward<strong>Ecological</strong> <strong>Evaluation</strong> <strong>Technical</strong> <strong>Guidance</strong> Document 72Version 1.2 8/29/12
into the ERA; or (3) considering an expedited management action (e.g., removal,capping), especially where contaminants may be highly mobile.6.4.5 Extractable Petroleum HydrocarbonsIt is recommended that the Protocol for Addressing Extractable PetroleumHydrocarbons, available at http://www.nj.gov/dep/srp/guidance/rs/#phc, befollowed for the investigation <strong>of</strong> petroleum hydrocarbon contamination in ESNRs.For soil in ENSRs, the NJDEP has established an ESC <strong>of</strong> 1,700 mg/kg EPH(established at "Health Based and <strong>Ecological</strong> Screening Criteria for PetroleumHydrocarbons - Frequently Asked Questions,” Question #3";http://www.nj.gov/dep/srp/guidance/rs/eph_faq.htm). Section 5 <strong>of</strong> this guidanceshould be followed to determine whether further ecological evaluation is needed.For sediment, NJDEP has not established an ESC for EPH; however, pursuant toN.J.A.C. 7:26E-5.1(e) and 5.2(d)2, if free and/or residual product is determined tobe present, such as via test methods in N.J.A.C. 7:26E-2.1(a)14, it must be treatedor removed when practicable, otherwise it must be contained. If EPH isidentified, the EE and ERA should focus on PAH contamination outside <strong>of</strong> theremedial footprint.6.4.6 Polycyclic Aromatic HydrocarbonsPolycyclic aromatic hydrocarbons (PAH) are compounds that result from naturaland anthropogenic processes. USEPA (2009d) states that because <strong>of</strong> the use <strong>of</strong>fossil fuels in industrialized societies and biomass fuels in developing countries(including forest fires), and subsequent transport via atmospheric and aquaticpathways, PAHs are among the most widely distributed organic pollutants. PAHsources include petrogenic PAHs, those derived from petroleum sources (oils,petroleum, coal); and pyrogenic PAHs, which are those associated with theincomplete combustion <strong>of</strong> fossil fuels. They exhibit a wide range <strong>of</strong> toxicity tonatural resources including aquatic and terrestrial plants and animals. The range intoxicity depends on the number <strong>of</strong> rings, molecular weight and the resultingpolarity. The primary mechanism <strong>of</strong> PAH toxicity to sediment invertebrates isnarcosis, which results in the alteration <strong>of</strong> the cell membrane function (USEPA,2009d). Eisler (2000) reports that native fish collected from PAH-contaminatedsediments show a prevalence <strong>of</strong> external abnormalities (lip and skin lesions,tumors); and bivalve mollusks accumulate high PAH levels because <strong>of</strong> theirinability to metabolize and excrete them. In general, PAHs are not associatedwith food chain effects, as most upper trophic level receptors have the ability tometabolize them.During the EE, PAH-contaminated sediments are <strong>of</strong>ten evaluated by simplycomparing bulk sediment chemistry results obtained from traditional analyticalmethods, to appropriate screening values. This approach is designed to measuretotal chemical content but does not take into account site-specific conditions thatmay affect PAH bioavailability (e.g., type <strong>of</strong> organic carbon present). It is widelyrecognized that the freely dissolved fraction <strong>of</strong> nonionic organic chemicals in<strong>Ecological</strong> <strong>Evaluation</strong> <strong>Technical</strong> <strong>Guidance</strong> Document 73Version 1.2 8/29/12
sediment (i.e., that fraction that partitions into pore water), represents thebioavailable fraction that is responsible for benthic toxicity. Several approachesare available that go beyond the screening <strong>of</strong> bulk sediment chemistry results thatone may consider when evaluating PAH-contaminated sediments during the EEstage <strong>of</strong> the investigation.USEPA (2009d) has recently published a white paper that describes the use <strong>of</strong>several methodologies, in a tiered fashion, to evaluate risk to benthic invertebratesfrom PAHs (Figure 6-4). Specifically, in Tier 1, PAHs are initially evaluatedbased on a comparison <strong>of</strong> sediment results to generic screening values or sitespecificscreening values calculated via USEPA’s EqP methodology (USEPA,2003). If this initial evaluation indicates potential risk, then a Tier 2 <strong>Evaluation</strong>may be conducted. The Tier 2 evaluation involves the evaluation <strong>of</strong> PAHbioavailability based on the direct measurement <strong>of</strong> interstitial pore water. Severalmethods have been researched for measuring pore water PAHs. USEPA8272/ASTM D7363-07 uses Solid Phase Microextraction Devices (SPME) toobtain low (picogram/milliliter [pg/ml]) concentrations <strong>of</strong> dissolved PAHs insediment pore water. USEPA (2009d) stresses that when using this method, itshould be expanded to address the “USEPA 34” list <strong>of</strong> target PAH and AlkylTier 1Assessment <strong>of</strong> PAHBioavailability Based onAnalysis <strong>of</strong> WholeSediments (e.g., EqP,empirical guidelines)Is Guid elineEx ceed ed?NOSTOPYESTier 2Assessment <strong>of</strong> PAHBioavailability Based onAnalysis <strong>of</strong> InterstitialWaters (e.g., SPME)SignificantBioavailableConcentrationsDetected ?NOSTOPTier 3Assessment <strong>of</strong> PAHBioavailability Based onToxicity Testing (e.g.,Amphipod to xicity te sts)YESSignificantT oxicity?YESNOProbableRisk<strong>of</strong> AdverseEffectsSTOPFigure 6-4: Conceptual Model for Applying Various Sediment AssessmentApproaches in a Tiered System to Determine the Risk <strong>of</strong> Adverse Effects Due toPAHs in Sediments (USEPA, 2009d).<strong>Ecological</strong> <strong>Evaluation</strong> <strong>Technical</strong> <strong>Guidance</strong> Document 74Version 1.2 8/29/12
PAH homologs listed in the equilibrium benchmark guidance (USEPA, 2003).Pore water concentrations generated from this method are then evaluated usingUSEPA’s hydrocarbon narcosis model (USEPA, 2003). The Tier 2 SPMEanalysis is especially useful when evaluating PAH-contaminated sediments inindustrialized and urban settings where the presence <strong>of</strong> black soot (soot carbon),which is known to influence PAH bioavailability, is potentially present. Thismethod was demonstrated by Hawthorne, et al. (2007) to be significantly betterthan conventional sediment chemistry tests, as well as EqP, for predicting impactto survival as determined by sediment toxicity tests using a sensitive sedimentdwellingspecies (Hyalella azteca). If Tier 2 results indicate the potential for risk,then the assessment may proceed to Tier 3 in which sediment toxicity testing isconducted in the ERA stage <strong>of</strong> the investigation (6.2.2.5).While the USEPA tiered approach discussed above is in the form <strong>of</strong> a “whitepaper,” it represents a logical, step-wise approach that the investigator may usewhen assessing ecological risk to benthic invertebrates from PAH-contaminatedsediments.As noted above, PAHs are present as diffuse anthropogenic pollutants in manywater bodies and concentrations in the low part per million (ppm) range can beexpected in urban watersheds. As such, it is imperative that background areasamples be collected when evaluating PAHs to establish an accurate range <strong>of</strong>PAH background contaminant levels (Section 5.3.4). This information will aid indetermining if the PAHs are related to a site discharge, and may potentiallyinfluence the development <strong>of</strong> an RMD.6.4.7 Polychlorinated Biphenyls (Aroclor vs. Congener)Polychlorinated biphenyls (PCB) are two-ringed structures with a variety <strong>of</strong>chlorination, produced originally under the trade name “Aroclor.” Aroclors aremixtures <strong>of</strong> 209 possible congeners and were produced with a range <strong>of</strong>chlorination (e.g. Aroclor 1016 was 16% chlorine by weight, whereas Aroclor1260 was 60% chlorine by weight). PCBs may also be divided into 10 homologclasses ranging from monochlorobiphenyl to decachlorobiphenyl. Depending onthe application, a variety <strong>of</strong> Aroclor mixtures (typical mixtures were Aroclor1016, 1242, 1248, 1254, and 1260) were used and their chemical signatures arestill found within environmental media (Ashley et al., 2003 and Imamoglu andChristensen, 2002). Because <strong>of</strong> physical, chemical, and biological processes, thelower molecular weight (and less chlorinated) PCBs within the mixture are lessfrequently found compared to relatively more stable (refractory) higher molecularweight congeners (Ashley et al., 2003 and Bernhard, et al., 2001). For example,depending on when the mixture was released into the environment, some <strong>of</strong> the209 PCB congeners present in an original Aroclor mixture may have degradedand it is not uncommon for the mono, di, and tri-substituted PCBs to be lessprevalent in environmental and biological media than the more chlorinatedcongeners (Ashley et al., 2003). The weathering <strong>of</strong> the original Aroclor mixturesand congeners presents some challenges to ecological risk assessors attempting todetermine how best to assess potential risks posed by exposure to these chemicals(de Solla, et al., 2010).<strong>Ecological</strong> <strong>Evaluation</strong> <strong>Technical</strong> <strong>Guidance</strong> Document 75Version 1.2 8/29/12
Twelve dioxin-like PCB congeners have been identified by the World HealthOrganization (WHO) and assigned Toxic Equivalency Factors (TEF) becausethey produce biological effects similar to 2,3,7,8-TCDD with varying potenciesand generally act together in an additive fashion. The term “2,3,7,8-TCDD”refers to the single compound, 2,3,7,8-tetrachloro dibenzo-p-dioxin, the mosttoxic form <strong>of</strong> this class <strong>of</strong> compounds. Refer to Section 6.4.7 for management <strong>of</strong>PCB congener data via the Toxic Equivalency (TEQ) approach.It is important for the field sampling and analysis plan to specify whetherenvironmental media and biota will be analyzed for individual PCB Aroclors,homolog groups, 209 PCB congeners, or the 12 dioxin-like PCB congeners. Inmost cases, sampling conducted for the EE during the SI should be focused onindividual PCB Aroclor analysis. Unless there is clear indication that morerigorous analyses are required, such as for a site known to have elevated PCBs inESNRs, this approach is reasonable because analyzing samples for Aroclors isless time-consuming and less costly than conducting analyses for the homologs orthe congeners (Bernhard and Petron, 2001). For screening purposes, individualPCB Aroclors may be an appropriate level <strong>of</strong> analysis, particularly where thereare time and financial constraints, and where the size <strong>of</strong> the potentially impactedarea is relatively small. During the remedial investigation, where the ERA,potential remedy, or source attribution depends on the speciation <strong>of</strong> the PCBspresent in the samples, it may be necessary to consider the more detailed PCBcongener or homolog analysis. It may be appropriate to conduct PCB congener orhomolog analyses on a subset or percentage <strong>of</strong> the total samples rather than on allsamples.6.4.8 Chlorinated Dioxin, Furans, and Dioxin-like PolychlorinatedBiphenylsThis section is intended to provide guidance on when a dioxin-like(polychlorinated- dioxin, furan, or biphenyl) investigation is warranted and howto perform the investigation, evaluate the data in the EE and ERA, and presentresults.Polychlorinated dibenzo-p-dioxins (PCDD), polychlorinated dibenz<strong>of</strong>uran(PCDF), and polychlorinated biphenyls (PCBs) are persistent biomagnifyingcontaminants typically found in the environment as a mixture <strong>of</strong> congeners, all <strong>of</strong>which present similar chemical structures. There are 75 possible PCDDcongeners, 135 possible PCDF congeners, and 209 possible PCB congeners. Thecongener pattern in a mixture will vary depending on the source material oroperation that generated these compounds and their toxicity depends on thenumber and location <strong>of</strong> chlorine atoms.This guidance document focuses on the internationally recognized subset <strong>of</strong> themost toxic congeners (i.e., the 7 PCDD, 10 PCDF, and 12 PCB compounds) thatcontain laterally-substituted chlorine in the 2, 3, 7, and 8 positions for the PCDDsand PCDFs and laterally-substituted chlorines in the 3,4,5/3’,4’,5’ positions forthe PCBs. To simplify the assessment <strong>of</strong> the toxicity <strong>of</strong> these complex mixtures,the USEPA adopted a WHO procedure based on the relative toxicities <strong>of</strong> the 29<strong>Ecological</strong> <strong>Evaluation</strong> <strong>Technical</strong> <strong>Guidance</strong> Document 76Version 1.2 8/29/12
individual congeners to 2,3,7,8-TCDD, for which the most toxicologicalinformation is available. This procedure is commonly referred to as the TEQapproach and was presented and described in USEPA (1987, 2008b) and Van denBerg et al. (1998, 2006). Although refinements and updates to application <strong>of</strong> thisprocedure have occurred, the basic premise has stayed the same and continues tobe used by the USEPA.The term "dioxins" refers to the 17 tetra- through octa-chlorinated dioxin andfuran and 12 tetra- through hexa-chlorinated biphenyl compounds assigned TEFvalues by the WHO. Dioxins and furans are formed as unintended by-products <strong>of</strong>specialty chemical processes or combustion <strong>of</strong> chlorine-containing substances.Furans and dioxin-like PCBs occur in various proportions in commercial PCBsunder various trade names. These compounds are highly hydrophobic. Whenreleased into the environment, dioxins, furans and dioxin-like PCBs bind to solidsand are typically found in the highest concentrations in soil or sediment. Highvolume water sampling <strong>of</strong> surface, ground and pore waters using EPA Methods1613B and 1668A/B can detect and quantify these congeners in suspended solidsand in the dissolved state (USEPA 1994c and 1999c). Biological matrices can beroutinely characterized as well. Testing for dioxin is relatively expensive;therefore, dioxin testing is warranted only under certain site conditions. Someexamples are as follows: when site history indicates manufacturing (e.g., synthesis, blending or storage)or application <strong>of</strong> chlorophenolic or pesticide and herbicide compounds, whichare known to lead to formation <strong>of</strong> chlorinated dioxins and furans. Thesechemicals were identified by USEPA (1980) as Class I and II chemicals relatedto dioxin formation and Class I and II pesticides related to dioxin formation,respectively; when site history indicates bleach-kraft pulp and paper mill processes involvingthe use <strong>of</strong> chlorine and chlorine derivatives; when site history indicates PCB contamination (e.g., contaminated oils or othermaterials containing a high percentage <strong>of</strong> chlorine-containing substances) thatmay have been involved in a fire, including building interior fires; when site history indicates burning <strong>of</strong> plastics or other materials containingchlorine-containing compounds (e.g., burning <strong>of</strong> plastic coated wiring forprecious metals recovery, miscellaneous burning <strong>of</strong> refuse with high percentage<strong>of</strong> plastic or vinyl-like materials); when site history indicates chlor-alkali plant manufacturing processes usingcarbon electrodes.As described in Section 5.3, sampling and analysis may be conducted in a phasedmanner with soil samples from source areas prioritized for analysis, followed bysampling in contaminant migration pathways and ESNRs. Dioxin source areasinclude areas <strong>of</strong> spills, discharges, burning grounds, and ash or waste disposal.Soil and sediment sampling depth intervals are determined site-specifically;however, because dioxin binds strongly to particulate matter, it is most <strong>of</strong>tenfound in surface or shallow depth soil and sediment intervals, and these intervalsshould be targeted for sampling. The exception to this is when site information<strong>Ecological</strong> <strong>Evaluation</strong> <strong>Technical</strong> <strong>Guidance</strong> Document 77Version 1.2 8/29/12
indicates burial <strong>of</strong> potential dioxin-impacted soil and sediment (or ash), such asthrough landfilling operations, soil re-working activities on site, or long-termaccretion <strong>of</strong> clean sediments. In these situations, alternate depths are targetedbased on site information and conditions. For fly ash or combustion wastesources, sample intervals may be guided by visual evidence <strong>of</strong> the ash.Depending on historic site operations, best pr<strong>of</strong>essional judgment should be usedregarding the decision to limit the field sampling and analysis plan and the TEQprocess to only dioxin and furans or only dioxin-like PCB congeners, or toevaluate both contaminant classes.Detailed specifics regarding the TEQ approach can be found in Appendix I.6.4.9 Historic Fill Material and Dredged MaterialCertain areas <strong>of</strong> sites and ESNRs associated with sites may have, over time,received industrial fill material or dredged materials. This practice was likely tohave been more common at sites adjacent to water bodies where fill was used tocreate upland or to improve grade, and where low-lying areas provided for easydeposition <strong>of</strong> dredged materials. During the SI, COPECs may be found in soil,surface water, and sediment collected from these areas, yet the source <strong>of</strong> thesechemicals may have little or no link to past or present site operations. Theidentification <strong>of</strong> historic fill and dredged materials and management options forthese areas should be evaluated during the SI and RI in accordance with N.J.A.C.7:26E–3.12 & 4.7 and the Historic Fill <strong>Guidance</strong> document. Examples <strong>of</strong> tools toaid in the identification <strong>of</strong> historic fill and dredged materials include review <strong>of</strong>historical documentation and the inclusion <strong>of</strong> soil or sediment assessmenttechniques, such as grain size, TOC, and various soils parameters (e.g., redoxpotential) with sample analyses from areas suspected to have received fill ordredged materials.For ecological purposes, areas <strong>of</strong> historic fill and dredged materials should beconsidered as potential contaminant sources to ESNRs and should be investigatedpursuant to N.J.A.C. 7:26E-1.16 and 4.8. Regardless <strong>of</strong> whether the contaminantsare considered site-related, if adverse ecological effects from the historic fill ordredged materials are documented, remediation may be required. Capping is apresumptive remedy for historic fill or dredged materials in upland (non-ESNR)areas. Alternative remedies should be considered if capping would result inadverse impacts to the ESNR.6.4.10 Acid-Volatile Sulfides/Simultaneously Extracted MetalsBioavailability and associated toxicity <strong>of</strong> some divalent metals found in anoxicsediment has been linked to the presence <strong>of</strong> acid-volatile sulfides (AVS) and theirrelationship to simultaneously extracted metals (SEM). The USEPA hasrecommended the use <strong>of</strong> the AVS/SEM ratio as a predictor <strong>of</strong> the bioavailability<strong>of</strong> these metals in sediment (USEPA, 2005b).The AVS component <strong>of</strong> sediment is comprised <strong>of</strong> a variety <strong>of</strong> reduced sulfurcompounds, quantified using a cold acid extraction. The SEM componentincludes the reactive metal fraction (including cadmium, copper, lead, nickel,<strong>Ecological</strong> <strong>Evaluation</strong> <strong>Technical</strong> <strong>Guidance</strong> Document 78Version 1.2 8/29/12
silver, and zinc) that is extracted with the AVS. Recent literature suggests that Hgshould be included with the SEM components (USEPA, 1997c).The AVS present in sediment reacts with the SEM to form insoluble metalsulfides that are significantly less bioavailable for uptake by benthic organismsthan the corresponding free metals. For divalent metals, one mole <strong>of</strong> SEM willreact with one mole <strong>of</strong> AVS (although one mole <strong>of</strong> silver requires two moles <strong>of</strong>AVS). Therefore, if the total concentration <strong>of</strong> AVS is greater than the totalconcentration <strong>of</strong> SEM, the SEM will likely all be bound as nontoxic metalsulfides. Conversely, if the total concentration <strong>of</strong> SEM is greater than the AVS,the excess fraction <strong>of</strong> the metals may exist as bioavailable free metals that couldcontribute to toxicity.Bulk sediment metals concentrations are a poor predictor <strong>of</strong> potential toxicity.The use <strong>of</strong> AVS/SEM ratios, along with organic carbon normalization has beenfound to be a better predictor <strong>of</strong> sediment toxicity. Earlier literature cites the ratio<strong>of</strong> ∑SEM to AVS (e.g. ∑SEM/AVS). More recent literature, however, expressthe difference between ∑SEM and AVS (e.g. ∑SEM-AVS). The advantages tousing ∑SEM-AVS is that the ratio does not get very large when AVS is very low,and that it can be modified to develop partitioning relationships that include otherphases such as TOC (Di Toro et al., 2005a,b). The use <strong>of</strong> the newer method ispreferred when evaluating divalent metal toxicity because it takes into account thepresence <strong>of</strong> TOC on a site-specific level.A recent study has indicated that measurement <strong>of</strong> AVS and SEM is notreproducible between laboratories (Hammerschmidt and Burton, 2010). Bysending four sediment samples to each <strong>of</strong> seven independent laboratories,demonstrated that measured concentrations <strong>of</strong> both AVS and SEM were highlyvariable. Measurement <strong>of</strong> AVS in the four samples varied between laboratoriesby factors <strong>of</strong> 70 to 3,500-fold. Measurement <strong>of</strong> SEM in the four samples variedbetween laboratories by factors <strong>of</strong> 17 to 60 fold. As a result, the calculation <strong>of</strong>AVS/SEM ratios was highly uncertain.The interlaboratory variation in AVS/SEM was attributed to differences in theUSEPA-approved extraction methods (gravimetry, colorimetry, gaschromatographic photoionization, and ion-specific electrochemistry). Variabilitymay also be introduced through sample heterogeneity, and through oxidation <strong>of</strong>reduced sulfur species between the times <strong>of</strong> collection and analysis. In addition,seasonal fluctuations in sediment chemistry can effect AVS/SEM measurements.A follow-up interlaboratory comparison was conducted by Brumbaugh et al.(2011) where AVS and SEM nickel concentrations were measured by fivelaboratories. In this study, the labs were aware <strong>of</strong> the planned interlaboratorycomparison and they were provided guidance for conducting sample preparation,analysis, and quality control measurements. The results <strong>of</strong> this study showed thatmeasurements <strong>of</strong> AVS and SEM-AVS can be reproducible among laboratories,thus emphasizing the need for consistent quality control procedures.While AVS/SEM is a potentially useful tool for assessing bioavailability andassociated toxicity <strong>of</strong> sediment metals, it should not be used as a stand-alone line<strong>Ecological</strong> <strong>Evaluation</strong> <strong>Technical</strong> <strong>Guidance</strong> Document 79Version 1.2 8/29/12
<strong>of</strong> evidence for evaluating risk until laboratory methods have been standardized toallow consistent interlaboratory reproducibility.7.0 Determination <strong>of</strong> <strong>Ecological</strong> Risk-Based Remediation Goals<strong>Ecological</strong> risk-based remediation goals are soil and sediment concentrations protective<strong>of</strong> specified ecological receptors that are calculated from site-specific biological tests.They are considered preliminary because adjustments may be made following the RMDprocess (Section 9.0). These numeric goals serve as delineation criteria for soils andsediment, which in turn enable determination <strong>of</strong> the contaminant footprint, volume <strong>of</strong>contaminated media, and potential remedial action costs. Remediation goals should bedetermined for all COPECs in any exposure pathway where risk is elevated using variouslines <strong>of</strong> evidence such as food chain modeling and soil and sediment toxicity test results(See Figure 7-1). All ecological risk-based remediation goals must be approved byNJDEP (N.J.A.C. 7:26E-4.8(c)3).7.1 Use <strong>of</strong> Food Chain Models and Tissue Residue Data to DetermineRemediation GoalsThe tissue-residue approach should be used for contaminants that bioaccumulate andbiomagnify. A list <strong>of</strong> such compounds is included in Table 4-2 <strong>of</strong> USEPA’s (2000c)Bioaccumulation Testing and Interpretation for the Purpose <strong>of</strong> Sediment QualityAssessment, Status and Needs. Remediation goals should be determined forcontaminants when the lines <strong>of</strong> evidence in the ERA indicate that there is an adverseecological impact requiring remediation. They are back-calculated from standardfood chain models, using site-specific prey species tissue data, media concentrations,and a TRV, such as the NOAEL/LOAEL for appropriate receptors. A simplifiedexample is presented in Figure 7-2. Detailed guidance is provided in USEPA (2005a).7.2 Use <strong>of</strong> Soil and Sediment Toxicity Test Results to Determine RemediationGoalsSoil and sediment toxicity tests measure significant reduction in survival, growth, andreproduction <strong>of</strong> invertebrate organisms exposed to site-related samples comparedwith reference area location and laboratory control samples. The use <strong>of</strong> these testsresults to determine remediation goals is most appropriate for nonbiomagnifyingcontaminants for the protection <strong>of</strong> the soil and sediment benthic communities.Various approaches are available, including, but not limited to, those listed in thefollowing sections.<strong>Ecological</strong> <strong>Evaluation</strong> <strong>Technical</strong> <strong>Guidance</strong> Document 80Version 1.2 8/29/12
Exposure pathway HQ >1 in ERA dietary Protective soil concentrations, mg/kg(receptor) exposure models (see Figure 7-2 for calculations)orstatistically significant toxicityAvian Insectivore PCBs 2.8(Woodcock) Mercury 2.4Lead 320Copper 402Mammalian Lead 760Herbivore Copper 1,600(Muskrat)Soil Invertebrate Lead 420Community Copper 290(site-specific AET)For PCBs and mercury, since risk is indicated only for avian insectivores, the remediation goals are2.8 mg/kg and 2.4 mg/kg respectively. For lead and copper, it is recommended that the mostconservative concentration be selected as the remediation goal, (i.e., 320 mg/kg for lead based onrisk to avian insectivores and 290 mg/kg for copper based on soil toxicity to the soil invertebrates).Figure 7-1. Hypothetical Example <strong>of</strong> Media Concentrations to Consider forSelection <strong>of</strong> <strong>Ecological</strong> Risk-Based Remediation Goals.1. Calculate site-specific BSAF:BSAF = C tissue / C soil/sediment ; therefore, C tissue = (C soil/sediment ) (BSAF)2. Set the desired dose = to NOAEL/LOAEL and substitute “(C soil/sediment ) (BSAF)” for “C tissue ” :Dose = (C tissue )(IR)/BWNOAEL = (C soil/sediment, X BSAF )(IR)/BW3. Rearrange calculation and solve for “protective” media concentration, i.e., theecological risk-based preliminary remediation goal:Remediation Goal = C soil/sediment = (NOAEL)(BW)(BSAF)(IR)BSAF = Soil/sediment bioaccumulation factor, unitlessDose = Dose <strong>of</strong> individual contaminant, mg/kg-dayC tissue = Contaminant concentration measured in prey species tissue, mg/kg dry weightC soil/sediment = Contaminant concentration <strong>of</strong> soil or sediment media, mg/kg dry weightIR = Ingestion rate, kg/dayBW = Body weight <strong>of</strong> surrogate receptor, kgFigure 7-2. Simplified Example <strong>of</strong> Determining a Remediation Goal Using aStandard Food Chain Model and Site-Specific Tissue Residue Data.<strong>Ecological</strong> <strong>Evaluation</strong> <strong>Technical</strong> <strong>Guidance</strong> Document 81Version 1.2 8/29/12
7.2.1 Apparent Effects Threshold ApproachThe Apparent Effects Threshold (AET) is the contaminant concentration in soil orsediment above which a specific biological effect is always found (i.e., the highestconcentration in which no effect is observed in a given data set). Because thisapproach is based on the absence <strong>of</strong> biological effects and associated chemicalconcentrations, it is useful with contaminant mixtures. See <strong>Evaluation</strong> <strong>of</strong> theApparent Effects Threshold (AET) Approach for Assessing Sediment Quality(USEPA, 1989a) for further guidance. A simplified example is presented inFigure 7-3Assume five (5) sample locations, with chemical analyses and toxicity testing conducted at each locationFor each contaminant, order the results from all locations from highest to lowest concentrations:Station #Arsenic Concentration (mg/kg) Earthworm Toxicity (biomass reduction)2 1000 *1 300 *4 150 *5 60 NE3 30 NE* - Significant effect in toxicity testNE – No significant effectRemediation Goal (As) = AET = 60 mg/kg (the highest concentration above which there is always an effect)Figure 7-3. Simplified Example <strong>of</strong> Determining a Remediation Goal Using theApparent Effects Threshold (AET) Approach7.2.2 Sediment/Soil Effects Concentration ApproachThe Sediment/Soil Effects Concentration (SEC) is the concentration <strong>of</strong> anindividual contaminant in soil or sediment below which toxicity is rarelyobserved. It is the concentration associated with an effect, and above thisconcentration, toxicity is frequently observed. See Calculation and <strong>Evaluation</strong> <strong>of</strong>Sediment Effect Concentrations for the Amphipod Hyalella Azteca and the MidgeChironomus Riparius (USEPA, 1996) for further guidance.8.0 UncertaintySeveral sources <strong>of</strong> uncertainty are associated with ecological risk estimates. Theseinclude initial selection <strong>of</strong> COPECs based on the sampling data, estimates <strong>of</strong> toxicity toecological receptors based on limited laboratory data (usually on other species), anduncertainties in exposure and effects assessment. As part <strong>of</strong> the final steps in estimatingpotential ecological risks associated with a site, the magnitude <strong>of</strong> uncertainties associatedwith the risk estimation should be discussed.Uncertainty in risk estimation has both qualitative and quantitative components.Qualitative uncertainty analyses are recommended by guidance (USEPA, 1988) andcontribute to the confidence with which risk assessment conclusions can be drawn and<strong>Ecological</strong> <strong>Evaluation</strong> <strong>Technical</strong> <strong>Guidance</strong> Document 82Version 1.2 8/29/12
applied (USEPA, 1989b, 1989c, and 1999a). Quantitative uncertainty analyses provideobjective measures <strong>of</strong> the relative confidence in the conclusions that have been drawn inan evaluation.Uncertainty surrounding risk assessment conclusions has important implications for riskmanagement (USEPA, 1988, 1998a). However, uncertainty is not a single, generallyapplicable parameter. Uncertainty surrounding a risk estimate or application has anumber <strong>of</strong> components, including parameter variability, calculation error andsimplification, and the underlying reality <strong>of</strong> exposure assumptions and pathways(USEPA, 1988). Uncertainty includes both real variation (reflecting actual, mechanisticbiological response ranges and variability in ecosystem conditions) and error (USEPA,1997a).Because biological systems are inherently uncertain and variable, some component <strong>of</strong>variability in risk estimation is due to a realistic expression <strong>of</strong> ecological conditions,while another component is due to error or uncertainty introduced by the overallanalytical process. Error is the component to be minimized because error encompassesundesirable uncertainty that has been introduced by the assessment process. However, itis critically important to understand ecosystem variability because this represents animportant component <strong>of</strong> the ecosystem within which RMDs will be made. Substantialdifferences exist between observations and conclusions made at the individual,population, and community levels <strong>of</strong> biological organization. For example, effects notmanifested at the population or community levels (e.g., mortality <strong>of</strong> only a fewindividuals) may not be observable with the type <strong>of</strong> studies implemented. Theramifications <strong>of</strong> this also include an understanding that, because the assessment levelendpoints are protective <strong>of</strong> populations and communities and not individuals, theprojected loss <strong>of</strong> a few individuals may not cause impacts that are important at the levels<strong>of</strong> assessment at which RMDs are made.Because <strong>of</strong> the many potential receptor species and general lack <strong>of</strong> knowledge regardingtheir life cycles, feeding habits, nutritional requirements (e.g., essential elements such asarsenic, trivalent chromium, selenium, and zinc), and relative toxicological sensitivity,the uncertainty surrounding estimates <strong>of</strong> ecological risks may be substantially greaterthan those associated with human health risk assessment. The generic screening andregulatory criteria and TRVs used in this assessment are intended to provide conservativebenchmarks, but it is important to note that no one approach to criterion or TRVderivation is adequate for all sites and all COPECs. The criteria or TRVs used in thisassessment are all chemical-specific and as such, cannot address the additive,antagonistic, or synergistic effects <strong>of</strong> the chemical mixtures typically found in theenvironment. Further, these criteria or TRVs do not take into account the structure anddynamics <strong>of</strong> the ecosystem present at the site, site-specific conditions regulating chemicalcontact and bioavailability, the potential toxicity <strong>of</strong> other constituents that were notquantified, or the pervasive influence <strong>of</strong> physical stressors associated with the disruptionby human activities that is characteristic <strong>of</strong> an area that may have an industrial history.The uncertainty evaluations should be performed within a range <strong>of</strong> conditions defined bycharacteristics <strong>of</strong> the environment at the time field data were gathered. As such, dataobtained and conclusions drawn represent a series <strong>of</strong> snapshots <strong>of</strong> site conditions and,while they can be extrapolated to a broad range <strong>of</strong> conditions, they are most accurate<strong>Ecological</strong> <strong>Evaluation</strong> <strong>Technical</strong> <strong>Guidance</strong> Document 83Version 1.2 8/29/12
when site conditions are most similar to those that existed at the time <strong>of</strong> sampling. Inaddition, screening criteria do not necessarily reflect the entire range <strong>of</strong> possible siteconditions and, as such, the applicability <strong>of</strong> conclusions is also restricted by thesesimplifications.The investigator is referred to Suter et al. 2000 for a comprehensive discussion onuncertainty and the methods for calculating it.9.0 Risk Management ConsiderationsDecisions about whether estimated ecological risks are unacceptable and how to managethem require consideration <strong>of</strong> the magnitude <strong>of</strong> the estimated risk and the weighing <strong>of</strong>expected benefits against the expected short- or long-term harm that might be caused bythe proposed action. Risk Management Decisions (RMDs) are made in a process notdriven wholly by technical information even though the potential for ecological risk is amajor component <strong>of</strong> the decision making. RMDs cannot be performed until ERA hasbeen completed and ecological-based risk goals have been calculated. Overviews <strong>of</strong>ecological risk management can be found in Pittinger et al., 2001a; Pittinger et al.,2001b; Stahl et al., 2001; Wentsel et al., 2001; and USEPA, 1997a.9.1 Soil Remediation Standards and Deed NoticesRemediation to the Soil Remediation Standards (SRS) found at N.J.A.C. 7:26D -Remediation Standards is not appropriate in ESNRs because the SRS are based onhuman health and assume human exposure in a residential or industrial setting.Human exposure to contaminated media within an ESNR would not be expected atthe same exposure level as in a residential or industrial setting. Human exposure tomedia in ESNRs is generally limited, while exposure to ecological receptors is <strong>of</strong>greater concern. Therefore, deed notices and engineering controls for human healthpurposes are not applicable or relevant in ESNRs that consist <strong>of</strong> open water bodies orwetlands. ESNRs that consist <strong>of</strong> uplands where future use may change may require adeed notice as the intention <strong>of</strong> a deed notice is the protection <strong>of</strong> public health in theevent <strong>of</strong> a change in site use. Deed notices contain written notice to current andfuture property owners <strong>of</strong> post-remedial contaminants that will remain at a site aboveSRS, including when engineering controls are used to mitigate human exposure.Therefore, when the site-specific ecological risk-based remediation goals areachieved via site remediation, the appropriate receptors are protected and the need fordeed notices and engineering controls, which require costly permitting and biennialcertifications, is negated for most ESNRs. This approach is appropriate in areasdesignated as preserved in perpetuity (e.g. conservation easements, farmlandpreserved areas, wetland mitigation areas protected pursuant to 7:7A-15.14), becausefuture development is restricted. However, for upland ESNRs, where no suchrestrictions exist and where there is the potential for future development (e.g. uplandforest that may be developed into residential use or where the soil may be used as fillon another site), a deed notice will be required.9.2 Risk Management DecisionsThe approach to setting potential remediation goals has been described in Section 7.0.RMDs involve adjusting ecological risk-based remediation goals for remedial<strong>Ecological</strong> <strong>Evaluation</strong> <strong>Technical</strong> <strong>Guidance</strong> Document 84Version 1.2 8/29/12
decision making and implementation. RMDs should reduce ecological risks to levelsthat will result in the recovery and maintenance <strong>of</strong> healthy local populations andcommunities. In some instances, the proposed remedy may cause more ecologicaldamage then leaving the contaminant in place, particularly where rare or sensitivehabitats exist because <strong>of</strong> widespread physical destruction or alteration <strong>of</strong> the habitatthrough excavation or in situ treatment; however, leaving persistent and/orbioaccumulative contaminants in place may cause an ongoing source <strong>of</strong> contaminantexposure (USEPA, 1999a). In addition, the proposed remedial action may not beachievable because <strong>of</strong> technical impracticability.RMDs consider the present and predicted value <strong>of</strong> the affected ESNRs, and thebeneficial and detrimental effects on the ESNRs’ value with implementation <strong>of</strong> thepotential remedial activities. The key components to consider during the RMD are(1) that impaired habitats can provide some valuable ecological benefit (e.g. foodsource, breeding, rearing, and shelter), (2) the ecosystem extends beyond theperimeter <strong>of</strong> the impaired area, and (3) reduction in ecological benefits in one area <strong>of</strong>the ecosystem may be <strong>of</strong>fset by a corresponding increase in ecological benefits inanother part <strong>of</strong> the ecosystem. Restoration activities should exceed the futuredecreased ecological benefits associated with the continued exposure to COPECs orany remedial activities. All RMDs must be approved by NJDEP (N.J.A.C. 7:26E-4.8(c)3). Examples <strong>of</strong> RMDs are noted in the following text.The following is presented solely to serve as an example <strong>of</strong> one project’s balancing <strong>of</strong>remedial actions and preservation <strong>of</strong> habitat. Other methods <strong>of</strong> balancing these goalsmay be used on a site-specific basis.A firing range is located within a 100-acre mature forested wetland, which iscontiguous with another 500 acres <strong>of</strong> forested wetland, emergent wetland and uplandhabitat. Lead levels exceeding 200,000 ppm have been recorded in surface soils.Contaminated soil depths range from six inches to 30 inches. Based on site-specificBAFs for the earthworm, an ecological risk-based remediation goal <strong>of</strong> 300 ppm hasbeen established for lead based on the woodcock as the higher trophic level receptor.To achieve an average <strong>of</strong> 300 ppm <strong>of</strong> lead in the soil <strong>of</strong> the impacted wetland area,over 90 acres <strong>of</strong> the wetland would have to be destroyed and excavated, and clean fillwould have to be imported to re-establish the grade and replant. Historically, thesuccess <strong>of</strong> re-establishing mature forested wetlands in <strong>New</strong> <strong>Jersey</strong> is limited.According to a 2002 report, “on average, 92% <strong>of</strong> proposed emergent wetland acreagewas achieved, while 1% percent <strong>of</strong> proposed forested wetland acreage was achieved(NJDEP, 2002).”Therefore, an RMD was made to reduce the number <strong>of</strong> acres <strong>of</strong> habitat destroyedwhile still reducing risk and enhancing the habitat to add value to the ecologicalbenefits. A graph was established for the two areas <strong>of</strong> the ESNR with the highestlead levels in soil (see Figure 9-1). The volumetric reduction in total lead(concentration and volume <strong>of</strong> surficial lead removed) was plotted on the Y-axis andthe number <strong>of</strong> acres destroyed was plotted on the X-axis (Figure 9-1). By examiningthese graphs, it was determined that by removing soil in the most highly contaminatedareas and replacing these soils with noncontaminated fill, a 93 percent reduction inexposure risk (volumetric reduction in total lead) could be attained with only<strong>Ecological</strong> <strong>Evaluation</strong> <strong>Technical</strong> <strong>Guidance</strong> Document 85Version 1.2 8/29/12
destroying 10 acres <strong>of</strong> the mature forested wetland. Lead levels <strong>of</strong> up to 3,000 ppm(10x the ecological risk-based remediation goal) would be left in place in the easternpart <strong>of</strong> the ESNR, and lead levels up to 1,000 ppm (over 3x the ecological risk-basedremediation goal) would be left in the western part. All lead-contaminated soilsexceeding the respective cap levels would be removed from the eastern and westernparts. In the 10 acres <strong>of</strong> destroyed habitat, the restoration would consist <strong>of</strong>establishing a mixture <strong>of</strong> emergent wetlands, forested wetlands, and upland forestedareas. In addition, local streams, which had been channelized, would be broadenedand made to meander through these areas. This restoration plan increased the value<strong>of</strong> the habitat while reducing the overall risk <strong>of</strong> exposure to receptors by 93 percenteven though the overall average lead level in soil for the impacted area remainedabove the calculated ecological risk-based remediation goal.Risk <strong>of</strong> Exposure to Lead93 % Exposure Risk ReductionAcres DestroyedFigure 9-1: Plot <strong>of</strong> Exposure Risk Reduction vs. Acres <strong>of</strong> Habitat Destroyed10.0 Quality Assurance/Quality Control and Data UsabilityAnalytical data collected during the EE and ERA should be <strong>of</strong> the correct nature, quality,and quantity to fulfill their intended use in remedial decision making for ESNRs. Towardthis end, data quality assurance and quality control (QA/QC), data validation, and datausability assessment procedures are integral components <strong>of</strong> the field sampling, laboratoryanalysis, and data evaluation stages <strong>of</strong> the ecological investigation. A project-specificQuality Assurance Project Plan (QAPP) is required pursuant to N.J.A.C. 7:26E to ensurethat environmental measurement tasks are appropriately planned, documented, andexecuted so that the resultant data are <strong>of</strong> known quality, verifiable, and defensible. TheQAPP should establish data quality objectives (DQOs) and all data collected should bevetted against the DQOs prior to use. Note the term “validation” typically refers tochemical data; for nonchemical data, such as benthic community data, toxicity test data,<strong>Ecological</strong> <strong>Evaluation</strong> <strong>Technical</strong> <strong>Guidance</strong> Document 86Version 1.2 8/29/12
etc., the term data “verification” may be more appropriate and these metrics should bespecified in the QAPP.The primary guidance on general QA/QA measures, QAPP preparation, DQOdetermination, data validation protocol, and data useability assessments is NJDEP’sQuality Assurance/Quality Control <strong>Technical</strong> <strong>Guidance</strong>. Additional information isavailable from various sources, including, but not limited to, those listed below:• General - QA/QC guidance that specifically includes biological data can be found inUSEPA (1997a), Appendix B, Section 4.0 and USEPA (2000a), Section 8.0. QA/QCrequirements for toxicity testing are addressed in Sections 6.2.2.5 and 6.2.2.6 <strong>of</strong> thisguidance.• QAPPs - refer to USEPA (2005c) Uniform Federal Policy for Quality AssuranceProject Plans. Evaluating, Assessing, and Documenting Environmental DataCollection and Use Programs. Part 1: UFP-QAPP Manual. Final Version 1.• DQOs - refer to USEPA (2006b) <strong>Guidance</strong> on Systematic Planning Using the DataQuality Objectives Process. Additional information is available in USEPA (2004,2005c, and 2006c).• Data Validation - refer to USEPA (2002g) <strong>Guidance</strong> on Environmental DataVerification and Data Validation. Numerous additional guidance documents can befound under “Quality Assurance <strong>Guidance</strong>/RCRA and CERCLA Field and DataValidation Standard Operating Procedures (SOPs).”• Data Useability - refer to USEPA (1992c) <strong>Guidance</strong> for Data Useability in RiskAssessment (Part A).11.0 ReferencesAdamus, P. R., E. J. Clairain, R. D. Smith, and R. E. Young. 1987. Wetland <strong>Evaluation</strong>Technique (WET), Vol. II: Methodology (Operational draft). Washington, D.C.:Wetlands Research Program, U.S. Army Corps <strong>of</strong> Engineers, Environmental Laboratory.Arnold, R.E. and Hodson, M.E. 2007. Effect <strong>of</strong> time and mode <strong>of</strong> depuration on tissuecopper concentrations <strong>of</strong> the earthworms Eisenia andrei, Lumbricus rubellus andLumbricus terrestris. Environmental Pollution, volume 148, number 1, pp 21-30.Ashley, J.T.F., Horwitz, R., Steinbacher, J.C., Ruppel, B. 2003. A comparison <strong>of</strong>congeneric patterns in American eels and striped bass from the Hudson and DelawareRiver estuaries. Mar. Pollut. Bull. 46, 1294-1308.ASTM (American Society for Testing and Materials). 2000. E 1391 -94 Standard guidefor collection, storage, characterization, and manipulation <strong>of</strong> sediments for toxicologicaltesting. p. 768-788. In: 2000 ASTM Standards on Environmental Sampling, Vol. 11.05Conshohocken, PA.ASTM (American Society for Testing and Materials). 2004. Standard Guide forConducting Laboratory Soil Toxicity or Bioaccumulation Tests with the LumbricidEarthworm Eisenia Fetida and the Enchytraeid Potworm Enchytraeus albidus. E1676-04. ASTM, West Conshohocken, PA.ASTM (American Society for Testing and Materials). 2010. Standard Test Method forMeasuring the Toxicity <strong>of</strong> Sediment-Associated Contaminants with FreshwaterInvertebrates. E1706 - 05(2010). ASTM, West Conshohocken, PA.<strong>Ecological</strong> <strong>Evaluation</strong> <strong>Technical</strong> <strong>Guidance</strong> Document 87Version 1.2 8/29/12
ASTM (American Society for Testing and Materials). 2005b. Standard GuideConducting Early Life-Stage Toxicity Tests with Fishes. E1241-05. ASTM, WestConshohocken, PA.ASTM (American Society for Testing and Materials). 2007a. Standard Guide forConducting In-situ Field Bioassays with Caged Bivalves. E2122-02(2007). ASTM,West Conshohocken, PA.ASTM (American Society for Testing and Materials). 2007b. Standard Guide forConducting Sediment Toxicity Tests with Polychaetous Annelids. E1611-00(2007).ASTM, West Conshohocken, PA.ASTM (American Society for Testing and Materials). 2008a. Standard Test Method forMeasuring the Toxicity <strong>of</strong> Sediment-Associated Contaminants with Estuarine and MarineInvertebrates. E1367-03(2008). ASTM, West Conshohocken, PA.ASTM (American Society for Testing and Materials). 2008b. ASTM E1525-02(2008)Standard Guide for Designing Biological Tests with Sediments. ASTM, WestConshohocken, PA.ASTM (American Society for Testing and Materials). 2009. Standard Guide forConducting Terrestrial Plant Toxicity Tests. E1963-09. ASTM, West Conshohocken,PA.ASTM (American Society for Testing and Materials). 2010. Standard Guide forDetermination <strong>of</strong> the Bioaccumulation <strong>of</strong> Sediment-Associated Contaminants by BenthicInvertebrates. E1688-10. ASTM, West Conshohocken, PA.Barnthouse L.W., Munns W.R., and Sorensen M.T. 2008. Population-Level <strong>Ecological</strong>Risk Assessment. Boca Raton, Florida: CRC Press. 1-337 pp.Bartoldus, C. C. 1999. A Comprehensive Review <strong>of</strong> Wetland Assessment Procedures: AGuide for Wetland Practitioners. St. Michaels, Md.: Environmental Concern, Inc.Bartoldus, C.C., E. W. Garbisch, and M.L. Kraus. 1994. <strong>Evaluation</strong> for Planned Wetlands(EPW): A Procedure for Assessing Wetland Functions and a Guide to Functional Design.St. Michaels, MD: Environmental Concern Inc.Barton A.L., Stahl R.G., Bachman R., Clark J.R., deFur P.L., Ells S.J., Pittinger C.A.,Slimak M.W., and Wentsel R.S. 2001. Deciding what resources to protect and settingobjectives. Risk Management: <strong>Ecological</strong> risk-based decision making. Pensacola, Florida:SETAC Press. pp. 41-56.Bernhard, T. and Petron, S. 4/9/2001. Analysis <strong>of</strong> PCB Congeners vs. Aroclors in<strong>Ecological</strong> Risk Assessment. (7 p.)http://www.clu-in.org/download/contaminantfocus/pcb/analysis-<strong>of</strong>-pcb-congeners.pdfBonham, C.D. 1989. Measurements for Terrestrial Vegetation. John Wiley & Sons,NY.Bowers, T.S., N. Shifrin and B. Murphy. 1996. Statistical Approach to Meeting SoilCleanup Goals, Environ. Sci. Technol., Vol. 30, pp. 1437-1444, 1996.<strong>Ecological</strong> <strong>Evaluation</strong> <strong>Technical</strong> <strong>Guidance</strong> Document 88Version 1.2 8/29/12
Braun, C. 2005. Techniques for Wildlife Investigations and Management. The WildlifeSociety, Bethesda, MD.Breden, T.F. 1989. A Preliminary Natural Community Classification <strong>of</strong> <strong>New</strong> <strong>Jersey</strong>. inE.F. Karlin. <strong>New</strong> <strong>Jersey</strong>’s Rate and Endangered Plants and Animals. Institute forEnvironmental Studies, Ramapo College, Mahway, NJ.Brinson, M. M. 1993. A Hydrogeomorphic Classification for Wetlands. WetlandsResearch Program <strong>Technical</strong> Report WRP-DE-4.Brumbaugh, W.G., Hammerschmidt, C.R., Zanella, L., Rogevich, E., Salata, G. andBolek, R. 2011. Interlaboratory Comparison <strong>of</strong> Measurements <strong>of</strong> Acid-Volatile Sulfideand Simultaneously Extracted Nickel in Spiked Sediments, Environmental Toxicology &Chemistry, 30(6): 1306-1309, (91856).Burton, G.A. Jr, Greenberg, M.S., Rowland, C.D., Irvine, C.A., Lavoie, D.R., Brooker,J.A., Moore, L., Raymer, D.F.N. and McWilliam, R.A. 2004. In situ exposures usingcaged organisms: a multi-compartment approach to detect aquatic toxicity andbioaccumulation. Environmental Pollution, volume 134, number 1, pp. 133-144.Canadian Council <strong>of</strong> Ministers <strong>of</strong> the Environment. 1999. Protocol for the Derivation <strong>of</strong>Canadian Tissue Residue Guidelines for the Protection <strong>of</strong> Wildlife that Consume AquaticBiota. http://www.ccme.ca/assets/pdf/trg_protocol.pdf.Chadwick, D., Groves, J. Harre, B. Paulsen, R. and Smith, C. 2003. Coastal ContaminantMigration Monitoring: The Trident Probe and Ultraseep System: Hardware Description,Protocols, and Procedures. SSC San Diego <strong>Technical</strong> Report 1902.www.spawar.navy.mil/sti/publications/pubs/tr/1902/tr1902cond.pdf.Chadwick, B., and Hawkins, A. 2008. Monitoring <strong>of</strong> Water and Contaminant Migrationat the Groundwater-Surface Water Interface. ER200422 Final Report. Arlington, Va.U.S. Department <strong>of</strong> Defense, Environmental Security and Technology CertificationProgram. www.spawar.navy.mil/sti/publications/pubs/tr/1966/tr1966cond.pdf.Collins, B. R. and Anderson, K.H. 1994. Plant Communities <strong>of</strong> <strong>New</strong> <strong>Jersey</strong>. RutgersUniversity Press, <strong>New</strong> Brunswick, NJ.Davis, D.E. 1982. CRC Handbook <strong>of</strong> Census Methods for Terrestrial Vertebrates. CRCPress, Boca Raton, FL.Davison, W., Fones, G., Harper, M., Teasdale, P., and Zhang H. 2000. Dialysis, DET andDGT: In Situ Diffusional Techniques for Studying Water, Sediment and Soils, pp.495−569 in In Situ Monitoring <strong>of</strong> Aquatic Systems: Chemical Analysis and Speciation, J.Buffle and G. Horvai, eds. NY: Wiley.de Solla, S.R., Weseloh, D.V., Hebert, C.E., and Pekarik C. 2010. Impact <strong>of</strong> changes inanalytical techniques for the measurement <strong>of</strong> polychlorinated biphenyls andorganochlorine pesticides on temporal trends in herring gull eggs. EnvironmentalToxicology and Chemistry, v29, n7, p1476-1483, July 2010http://onlinelibrary.wiley.com/doi/10.1002/etc.191/pdfDi Toro, D. M., Zarba, C. S., Hansen, D. J., Berry, W. J., Swartz, R. C., Cowan, C. E.,Pavlou, S. P., Allen, H. E., Thomas, N. A., and Paquin, P. R. 1991. <strong>Technical</strong> Basis for<strong>Ecological</strong> <strong>Evaluation</strong> <strong>Technical</strong> <strong>Guidance</strong> Document 89Version 1.2 8/29/12
Establishing Sediment Quality Criteria for Nonionic Organic Chemicals UsingEquilibrium Partitioning, Environmental Toxicology and Chemistry 10: 1541-83.Di Toro D. M., Berry, W. J., Burgess, R. M., Mount, D. R., O’Connor, T. P., and Swartz,R. C. 2005a. The Predictive Ability <strong>of</strong> Sediment Quality Guidelines Derived UsingEquilibrium Partitioning, in Use <strong>of</strong> Sediment Quality Guidelines and Related Tools forthe Assessment <strong>of</strong> Contaminated Sediments, R. J. Wenning, G. Bartley, C. Ingersoll, andD. Moore, eds. Pensacola, FL.: SETAC Press.Di Toro, D. M, Mcgrath, J. M., Hansen, D. J., Berry, W. J., Paquin, P. R., Mathew, R.,Wu, K. B., and Santore, R. C. 2005b. Predicting Sediment Metal Toxicity Using aSediment Biotic Ligand Model: Methodology and Initial Application, EnvironmentalToxicology and Chemistry 24(10): 2410–27.Di Toro, D. M. 2008. Bioavailability <strong>of</strong> Chemicals in Sediments and Soils: Toxicologicaland Chemical Interactions, pp. B-73-B-103 in SERDP and ESTCP Expert PanelWorkshop on Research and Development Needs for Understanding and Assessing theBioavailability <strong>of</strong> Contaminants in Soils and Sediments. Washington, DC. StrategicEnvironmental Research and Development Program and the Environmental SecurityTechnology Certification Program. http://serdpestcp.org/content/download/8049/99405/version/1/file/Bioavailability_Wkshp_Nov_2008.pdf.Duncan, P., Greenberg, M., Leja, S., Williams, J., Black, C., Henry, R., and Wilhelm, L.2007a. Case Study <strong>of</strong> Contaminated Groundwater Discharge: How In Situ Tools Link anEvolving Conceptual Site Model with Management Decisions, Integrated EnvironmentalAssessment and Management 3: 279–89.Duncan, P., Henry, R., Sheldrake, S., and Thompson, D. 2007b. Adaptation <strong>of</strong>Groundwater <strong>Evaluation</strong> and Sampling Tools for Underwater Deployment, pp. 55–83 inDiving for Science 2006, Proceedings, American Academy <strong>of</strong> Underwater Sciences 25thSymposium, Dauphin Island, AL., J. M. Godfrey and N. W. Pollock, eds.http://Yosemite1.epa.gov/R10/OEA.NSF/investigations/dive+sediment.Eisler, R. 2000. Handbook <strong>of</strong> Chemical Risk Assessment - Health Hazards to Humans,Plants, and Animals. Volume 2 Organics. Chapter 25 PAHs. Boca Raton: LewisPublishers.Environment Canada. 1994. <strong>Guidance</strong> document on collection and preparation <strong>of</strong>sediments for physicochemical characterization and biological testing. EnvironmentalProtection Series. Report EPS 1/RM/29, December 1994, 132 pp.Federal Interagency Committee for Wetland Delineation. 1989. Federal Manual forIdentifying and Delineating Jurisdictional Wetlands. USACE, USEPA, USFWS, andUSDA Soil Conservation Service, Washington, DC. Cooperative technical publication.76 pp. plus appendices.Hammerschmidt, C.R. and Burton, G.A., Jr. 2010. Measurements <strong>of</strong> Acid VolatileSulfide and Simultaneously Extracted Metals are Irreproducible Among Laboratories.Environmental Technology and Chemistry, Volume 29, number 7, pp. 1453-1456.<strong>Ecological</strong> <strong>Evaluation</strong> <strong>Technical</strong> <strong>Guidance</strong> Document 90Version 1.2 8/29/12
Hansen, D.J., Berry, W.J., Mahony, J.D., Boothman, W.S., Di Toro, D.M., Robson, D.L.,Ankley, G.T., Ma, D., Yan, Q., and Pesch, C.E. 1996. Predicting the Toxicity <strong>of</strong> Metal-Contaminated Field Sediments Using Interstitial Concentration <strong>of</strong> Metals and Acid-Volatile Sulfide Normalizations, Environmental Toxicology and Chemistry 15(12): 2080–94.Harshberger, J.W. 1970. The Vegetation <strong>of</strong> the <strong>New</strong> <strong>Jersey</strong> Pine-Barrens. DoverPublications, NY.Hawthorne, S.B., Azzolina, N.A., Neuhauser, E.F., Kreitinger, J.P. 2007. PredictingBioavailability <strong>of</strong> Sediment Polycyclic Aromatic Hydrocarbons to Hyalella azteca usingEquilibrium Partitioning, Supercritical Fluid Extraction, and Pore WaterConcentrations. Environ. Sci. Technol. 2007, 41, 6297–6304.Imamoglu, I., Li, K., and Christensen, E.R. 2002. PCB sources and degradation insediments <strong>of</strong> Ashtabula River, USA, determined from receptor models. Water Scienceand Technology, 46(3), p.89-96.ITRC (Interstate Technology & Regulatory Council). 2005. Technology Overview <strong>of</strong>Passive Sampler Technologies. DSP-4. Washington, DC.: Interstate Technology &Regulatory Council, Authoring Team. www.itrcweb.org.ITRC (Interstate Technology & Regulatory Council). 2011. Incorporating BioavailabilityConsiderations into the <strong>Evaluation</strong> <strong>of</strong> Contaminated Sediment Sites. CS-1. Washington,DC.: Interstate Technology & Regulatory Council, Contaminated Sediments Team.http://www.itrcweb.org/contseds-bioavailability/.Jarvinen, A.W., and Ankley, G.T. 1999. Linkage <strong>of</strong> Effects to Tissue Residues:Development <strong>of</strong> a Comprehensive Database for Aquatic Organisms Exposed to Inorganicand Organic Chemicals. SETAC <strong>Technical</strong> Publications Series. Society <strong>of</strong>Environmental Toxicology and Chemistry, Pensacola, FL.Kapustka, L., Biddinger, G., Luxon, M., and Galbraith, H. 2004. Landscape Ecologyand Wildlife Habitat: Critical Information for <strong>Ecological</strong> Risk Assessment, Land-UseManagement Activities, and Biodiversity Enhancement Activities. ASTM STP 1458,Conshohocken, PA.Kent, M. and Coker, P. 1992. Vegetation Description and Analysis. CRC Press, BocaRaton, FL.Long, E.R. and Chapman, P.M. 1985. A Sediment Quality Triad: Measures <strong>of</strong> SedimentContamination, Toxicity and Infaunal Community Composition in Puget Sound, March1985, Pollution Bulletin, 16, 405–15.Magee, D. W. 1998. "A Rapid Procedure for Assessing Wetland Functional Capacity,Based on Hydrogeomorphic (HGM) Classification." Association <strong>of</strong> <strong>State</strong> WetlandManagers.Moles, A., Holland, L., and Andersson, O. 2006. Assessment <strong>of</strong> the Significant <strong>of</strong> Directand Indirect Pollution Inputs to a Major Salmon-producing River Using PolyethyleneMembrane Devices, Environmental Toxicology and Chemistry 25: 2011–17.<strong>Ecological</strong> <strong>Evaluation</strong> <strong>Technical</strong> <strong>Guidance</strong> Document 91Version 1.2 8/29/12
N.J.A.C. (<strong>New</strong> <strong>Jersey</strong> Administrative Code). 2006. N.J.A.C. 7:18, RegulationsGoverning the Certification <strong>of</strong> Laboratories and Environmental Measurements, Sub-Chapter 7 Toxicity Testing. Last amended November 22, 2006.http://www.nj.gov/dep/rules/rules/njac7_18.pdfNJDEP. 2002. Creating Indicators <strong>of</strong> Wetland Status: Freshwater Wetland Mitigationin <strong>New</strong> <strong>Jersey</strong>. Division <strong>of</strong> Science, Research, & Technology.http://www.state.nj.us/dep/dsr/wetlands/final.pdfNJDEP. 2005. Field Sampling Procedures Manual, August 2005http://www.nj.gov/dep/srp/guidance/fspm/Pittinger, C.A., Stahl, R.G., Clark, J.R., Bachman, R., Barton, A.L., deFur, P.L., Ells,S.J., Slimak, M.W., Wentsel, R.S. 2001a. Managing ecological risk issues in a corporatecontext. Risk Management: <strong>Ecological</strong> risk-based decision making. Pensacola, FL:SETAC Press. pp. 137-148.Pittinger, C.A., Turnley, J.G., Mehrle, P.M., Stahl, R.G., Bachman, R., Barton, A.L.,Clark, J.R., deFur, P.L., Ells, S.J., Slimak, M.W. and others. 2001b. A multistakeholderecological risk management framework. Risk Management: <strong>Ecological</strong> risk-baseddecision making. Pensacola, FL: SETAC Press. pp. 21-32.Sample, B.E. and Suter, G.W. 1994. Estimating Exposure <strong>of</strong> Terrestrial Wildlife toContaminants. Oak Ridge National Laboratory. Oak Ridge, TN. ES/ER/TM-125.http://www.esd.ornl.gov/programs/ecorisk/documents/tm125.pdfSample, B.E., Opresko, D.M., and Suter, G.W. 1996. Toxicological Benchmarks forWildlife: 1996 Revision. Oak Ridge National Laboratory. Oak Ridge, TN. ES/ER/TM-86/R3. http://www.esd.ornl.gov/programs/ecorisk/documents/tm86r3.pdfSavoie, J.G., LeBlanc, D.R., Blackwood, D.S., McCobb, T.D., Rendigs, R.R., and Scott,C. 2000. Delineation <strong>of</strong> Discharge Areas <strong>of</strong> Two Contaminant Plumes by Use <strong>of</strong>Diffusion Samplers, Johns Pond, Cape Cod, Massachusetts, 1998. US Geological SurveyWater-Resources Investigations Report 00-4017, 30 pp.Schmitt, C.J. and Dethl<strong>of</strong>f, G.M. Editors. 2000. Biomonitoring <strong>of</strong> Environmental Statusand Trends (BEST) Program: Selected Methods for Monitoring Chemical Contaminantsand Their Effects in Aquatic Ecosystems. US Geological Survey, Biological ResourcesDivision, Columbia, MO: Information and Technology Report USGS/BRD-2000-0005.81 pp.Skalski, J.R. and Robson, D.S. 1992. Techniques for Wildlife Investigations. AcademicPress, San Diego.Smith, R. D. 1993. A Conceptual Framework for Assessing the Functions <strong>of</strong> Wetlands.Wetlands Research Program <strong>Technical</strong> Report WRP-DE-3. Vicksburg, Miss.: U.S. ArmyEngineer Research and Development Center.Smith, R. D., A. Ammann, C, Bartoldus, and M. Brinson. 1995. An Approach forAssessing wetland Functions Using Hydrogeomorphic Classification, ReferencesWetlands, and Functional Indices. Wetlands Research Program Tech Report WRP-DE-9.Vicksburg, MS: US Army Corp <strong>of</strong> Engineers, Waterways Experiment Station.http://www.wes.army.mil/el/wetlands/wlpubs.html<strong>Ecological</strong> <strong>Evaluation</strong> <strong>Technical</strong> <strong>Guidance</strong> Document 92Version 1.2 8/29/12
Society <strong>of</strong> Environmental Toxicology and Chemistry (SETAC). 1995. Ecotoxicologyand Risk Assessment for Wetlands: Proceedings from the SETAC Pellston Workshop onEcotoxicology and Risk Assessment for Wetlands. eds. M.A. Lewis, F.L. Mayer, R.L.Powell, M.K. Nelson, S. J. Klaine, M.G. Henry, and G.W. Dickson. SETAC Press.Stahl, R.G., Bachman, R., Barton, A.L., Clark, J.R., deFur, P.L., Ells, S.J., Pittinger,C.A., Slimak, M.W., Wentsel, R.S. 2001. Risk Management: <strong>Ecological</strong> Risk-BasedDecision Making. Pensacola: SETAC Press. 1-192 pp.Suter, G.W., II. 1993. <strong>Ecological</strong> Risk Assessment. Lewis Publishers, Boca Raton, FL.Suter, G.W., II, Efroymson, R.A., Sample, B.E., and Jones, D.S. 2000. <strong>Ecological</strong> RiskAssessment for Contaminated Sites. Lewis Publishers, Boca Raton, FL.Tomasaewski, J., and Luthy, R.. 2008. Field Deployment <strong>of</strong> Polyethylene Devices toMeasure PCB Concentrations in Pore Water <strong>of</strong> Contaminated Sediment, EnvironmentalScience and Technology 42: 6086–91.USACE, <strong>New</strong> England District. 1995. The Highway Methodology WorkbookSupplement, Wetland Functions and Values, A Descriptive Approach. NEDEP-360-1-30a.USEPA. n.d. Measurement and Monitoring Technologies for the 21st Century: Samplingfor Contaminants in Sediments and Sediment Porewater. Technology InnovationProgram. http://clu-in.org/programs/21m2/sediment.USEPA. 1980. Dioxins. Industrial Environmental Research Laboratory, Cincinnati, OH.EPA 600/2-80-197.USEPA. 1985a. Sediment Sampling Quality Assurance User’s Guide. EPA/600-4-85-048. PB85-233542. Environmental Monitoring Systems Laboratory. Las Vegas, NV.USEPA. 1985b. Guidelines for Deriving Numerical National Water Quality Criteria forthe Protection <strong>of</strong> Aquatic Organisms and Their Uses. PB85-227049. Office <strong>of</strong> Researchand Development Environmental Research Laboratories. Duluth, MN, Narragansett, RI,and Corvallis, OR.http://water.epa.gov/scitech/swguidance/standards/criteria/aqlife/upload/85guidelines.pdfUSEPA. 1987. Interim Procedures for Estimating Risks Associated with Exposures toMixtures <strong>of</strong> Chlorinated Dibenzo-p-Dioxins and –Dibenz<strong>of</strong>urans (CDDs and CDFs).Risk Assessment Forum, Washington, DC. EPA/625/3-87/012.http://www.epa.gov/raf/publications/interim-procedures-cdds-cdfs.htmUSEPA. 1988. Review <strong>of</strong> <strong>Ecological</strong> Risk Assessment Methods. EPA/230-10-88-041.Office <strong>of</strong> Planning and <strong>Evaluation</strong>, Washington, DC.USEPA. 1989a. <strong>Evaluation</strong> <strong>of</strong> the Apparent Effects Threshold (AET) Approach forAssessing Sediment Quality. SAB-EETFC-89-027. Office <strong>of</strong> the Administrator, ScienceAdvisory Board Washington DC.USEPA. 1989b. Risk Assessment <strong>Guidance</strong> for Superfund, Volume 1, Human Health<strong>Evaluation</strong> Manual – Part A.http://www.epa.gov/oswer/riskassessment/ragsa/pdf/rags-vol1-pta_complete.pdf<strong>Ecological</strong> <strong>Evaluation</strong> <strong>Technical</strong> <strong>Guidance</strong> Document 93Version 1.2 8/29/12
USEPA. 1989c. Risk Assessment <strong>Guidance</strong> for Superfund, Volume II, Environmental<strong>Evaluation</strong> Manual, Interim Final. EPA/540/1-89/001. USEPA, Office <strong>of</strong> Solid Wasteand Emergency Response, Washington, DC.USEPA. 1990a. Macroinvertebrate Field and Laboratory Methods for Evaluating theBiological Integrity <strong>of</strong> Surface Waters. EPA/600/4-90/030.http://www.epa.gov/bioiweb1/pdf/EPA-600-4-90-030MacroinvertebrateFieldandLaboratoryMethodsforEvalutingtheBiologicalIntegrity<strong>of</strong>SurfaceWaters.pdfUSEPA. 1990b. Biological Criteria: National Program for Surface Waters. EPA/440-5-90-004. Office <strong>of</strong> Water Regulations and Standards, Washington, DC.http://www.epa.gov/bioiweb1/html/biolcont.htmlUSEPA. 1990c. Environmental Monitoring and Assessment Program, <strong>Ecological</strong>Indicators. EPA/600/3-90/060. USEPA, Office <strong>of</strong> Research and Development,Washington, DC.USEPA. 1991. Risk Assessment <strong>Guidance</strong> for Superfund (RAGS) Part B, Calculation <strong>of</strong>Risk-Based Preliminary Remediation Goals, Chapter 3.http://www.epa.gov/oswer/riskassessment/ragsb/USEPA. 1992a. Framework for <strong>Ecological</strong> Risk Assessment. EPA/630/R-92/001. RiskAssessment Forum., Washington DC.http://www.epa.gov/raf/publications/pdfs/FRMWRK_ERA.PDFUSEPA. 1992b. <strong>Evaluation</strong> <strong>of</strong> Terrestrial Indicators for Use in <strong>Ecological</strong> Assessmentsat Hazardous Waste Sites. EPA/600/R-92/183.USEPA. 1992c. <strong>Guidance</strong> for Data Useability in Risk Assessment (Part A), PB92-963356. [online]. Office <strong>of</strong> Emergency and Remedial Response, USEPA, Washington,DC. http://www.epa.gov/oswer/riskassessment/datause/parta.htmUSEPA. 1993a. Wildlife Exposure Factors Handbook. EPA/600/R-93/187a. Office <strong>of</strong>Research and Development, Washington, DC. http://www.epa.gov/ncea/pdfs/toc2-37.pdfUSEPA. 1993b. Interim Report on Data and Methods for Assessment <strong>of</strong> 2,3,7,8-Tetrachlorodibenzo-p-dioxin Risks to Aquatic Life and Associated Wildlife. Office <strong>of</strong>Research and Development, Washington, DC. EPA/600/R-93/005.http://www.epa.gov/raf/publications/pdfs/DIOXIN_RISKS_AQUATIC_LIFE_AND_WILDLIFE_1993.PDFUSEPA. 1994a. Catalogue <strong>of</strong> Standard Toxicity Tests for <strong>Ecological</strong> Risk Assessment,ECO Update 2(2). Publication 9345.0-051. Washington, DC. Office <strong>of</strong> Solid Waste andEmergency Response. www.epa.gov/oswer/riskassessment/ecoup/pdf/v2no2.pdf.USEPA. 1994b. Method 8290: Polychlorinated dibenzodioxins (PCDDs) andpolychlorinated dibenz<strong>of</strong>urans (PCDFs) by high-resolution gas chromatography/highresolution mass spectrometry (HRGC/HRMS) in Test Methods for Evaluating SolidWaste, Physical/Chemical Methods, SW846," third edition, Final Update IV, January2008 (as amended and supplemented). Office <strong>of</strong> Solid Waste and Emergency Response,Washington, DC. http://www.epa.gov/SW-846<strong>Ecological</strong> <strong>Evaluation</strong> <strong>Technical</strong> <strong>Guidance</strong> Document 94Version 1.2 8/29/12
USEPA 1994c. Revision B, Method 1613B. Tetra- through Octa-Chlorinated Dioxins andFurans by Isotope Dilution HRGC/HRMS. EPA 821-B-94-005. Washington, DC.http://water.epa.gov/scitech/methods/cwa/organics/dioxins/index.cfmUSEPA. 1995a. Determination <strong>of</strong> Background Concentrations <strong>of</strong> Inorganics in Solidsand Sediments at Hazardous Waster Sites. EPA/540/S-96/500. R.P. Breckenridge andA.B. Crockett, National Engineering Forum Issue. Office <strong>of</strong> Research and Development,Washington, DC. http://www.epa.gov/swertio1/tsp/download/bckgrnd.pdfUSEPA. 1995b. Updates: Water Quality Criteria Documents for the Protection <strong>of</strong>Aquatic Life in Ambient Water (EPA-820-B-96-001)http://yosemite.epa.gov/water/owrccatalog.nsf/0/0b272603b228926785256d83004fd9ee?OpenDocumentUSEPA. 1995c. Environmental Monitoring and Assessment Program (EMAP),Laboratory Methods Manual, Estuaries, Volume 1 – Biological and Chemical Analyses.EPA/620/R-95/008.http://www.epa.gov/emap/html/pubs/docs/groupdocs/estuary/field/lab_man.pdfUSEPA. 1996. Calculation and <strong>Evaluation</strong> <strong>of</strong> Sediment Effect Concentrations for theAmphipod Hyalella Azteca and the Midge Chironomus Riparius. EPA 905-R96-008.Great Lakes National Program Office, Washington, DC.USEPA. 1997a. Interim Final, <strong>Ecological</strong> Risk Assessment <strong>Guidance</strong> for Superfund:Process for Designing and Conducting <strong>Ecological</strong> Risk Assessments. Office <strong>of</strong> SolidWaste and Emergency Response. EPA 540/R-97/006. Office <strong>of</strong> Solid Waste andEmergency Response, Washington DC.http://www.epa.gov/oswer/riskassessment/ecorisk/ecorisk.htmUSEPA. 1997b. Field and laboratory methods for macroinvertebrate and habitatassessment <strong>of</strong> low gradient nontidal streams. Mid-Atlantic Coastal Streams Workgroup,Environmental Services Division, Region 3, Wheeling, WV.http://www.epa.gov/bioindicators/pdf/MACS-FieldandLabMethods.pdfUSEPA. 1997c. Method 1629: Acid Volatile Sulfide and Simultaneously ExtractedMetals in Sediment. Office <strong>of</strong> Water, Washington DC.USEPA. 1998a. Guidelines for <strong>Ecological</strong> Risk Assessment. EPA/630/R-95/002F. RiskAssessment Forum, Washington DC. http://74.6.238.254/search/srpcache?ei=UTF-8&p=Guidelines+for+<strong>Ecological</strong>+Risk+Assessment%2C+Final&fr=yfp-t-701&u=http://cc.bingj.com/cache.aspx?q=Guidelines+for+<strong>Ecological</strong>+Risk+Assessment%2c+Final&d=4795752060553092&mkt=en-US&setlang=en-US&w=f98058a0,523d1f96&icp=1&.intl=us&sig=janoBumwtF_Fq5l7nVNpgw--USEPA. 1998b. Environmental Monitoring and Assessment Program-Surface Waters:Field Operations and Methods for Measuring the <strong>Ecological</strong> Condition <strong>of</strong> WadeableStreams. EPA 620-R-94-004F.http://www.epa.gov/emap/html/pubs/docs/groupdocs/surfwatr/field/Sec05.PDFUSEPA. 1998c. <strong>Evaluation</strong> <strong>of</strong> Dredged Material Proposed for Discharge in Waters <strong>of</strong>the U.S. – Testing Manual. Inland Testing Manual. USEPA Office <strong>of</strong> Water and USArmy Corps <strong>of</strong> Engineers. EPA-823-B-98-004.<strong>Ecological</strong> <strong>Evaluation</strong> <strong>Technical</strong> <strong>Guidance</strong> Document 95Version 1.2 8/29/12
http://www.epa.gov/owow/oceans/regulatory/dumpdredged/pdf/itm_feb1998.pdfUSEPA. 1999a. Issuance <strong>of</strong> Final <strong>Guidance</strong>: <strong>Ecological</strong> Risk Assessment and RiskManagement Principals for Superfund Sites. USEPA, Washington DC. OSWERDirective 9285.7-28 P. http://www.epa.gov/oswer/riskassessment/pdf/final10-7.pdfUSEPA. 1999b. Barbour, M.T., Gerritsen, J., Snyder, B.D., and Stribling, J.B. 1999.Rapid Bioassessment Protocols for Use in Streams and Wadeable Rivers: Periphyton,Benthic Macroinvertebrates and Fish, Second Edition. EPA 841-B-99-002. USEPA;Office <strong>of</strong> Water; Washington, DC.http://www.epa.gov/owow/monitoring/rbp/wp61pdf/rbp_main.pdfUSEPA. 1999c. Method 1668A/B Chlorinated Biphenyl Congeners in Water, Soil,Sediment, Biosolids, and Tissue by high-resolution gas chromatography/high resolutionmass spectrometry (HRGC/HRMS). EPA-821-R-08-020. Office <strong>of</strong> Water, Office <strong>of</strong>Science and Technology. Washington, DC.http://water.epa.gov/scitech/methods/cwa/bioindicators/upload/2009_01_07_methods_method_1668.pdfUSEPA. 2000a. Methods for Measuring the Toxicity and Bioaccumulation <strong>of</strong> SedimentassociatedContaminants with Freshwater Invertebrates. Second Edition, March 2000.EPA 600/R-99/064. USEPA Office <strong>of</strong> Research and Development, Duluth, MN.http://www.waterboards.ca.gov/water_issues/programs/tmdl/records/region_5/2008/ref2759.pdfUSEPA. 2000b. <strong>Guidance</strong> for Assessing Chemical Contaminant Data for Use in FishAdvisories. EPA-823-B-00-007. USEPA, Office <strong>of</strong> Water, Washington, DC.http://water.epa.gov/scitech/swguidance/fishshellfish/techguidance/risk/upload/2009_04_23_fish_advice_volume1_v1cover.pdfUSEPA. 2000c. Bioaccumulation Testing and Interpretation for the Purpose <strong>of</strong> SedimentQuality Assessment, Status and Needs. EPA 823-R-00-001. USEPA, Office <strong>of</strong> Water,Washington, DC. http://water.epa.gov/polwaste/sediments/cs/upload/bioaccum.pdfUSEPA. 2001. Methods for Collection, Storage and Manipulation <strong>of</strong> Sediments forChemical and Toxicological Analyses: <strong>Technical</strong> Manual. USEPA Office <strong>of</strong> Water,Washington, DC. EPA-823-B-01-002.http://www.clu-in.org/download/contaminantfocus/sediments/methods-for-collectionepa-manual.pdfUSEPA. 2002a. <strong>Guidance</strong> for Comparing Background and Chemical Concentrations inSoil for CERCLA Sites. September 2002. Office <strong>of</strong> Emergency and Remedial Response,Washington, DC. EPA-540R-01-003.http://www.epa.gov/oswer/riskassessment/pdf/background.pdfUSEPA. 2002b. Methods for Measuring the Acute Toxicity <strong>of</strong> Effluents and ReceivingWaters to Freshwater and Marine Organisms. Fifth Edition, October 2002. USEPAOffice <strong>of</strong> Water, Washington, DC. EPA-821-R-02-012.http://www.epa.gov/waterscience/methods/wet/disk2/atx.pdf<strong>Ecological</strong> <strong>Evaluation</strong> <strong>Technical</strong> <strong>Guidance</strong> Document 96Version 1.2 8/29/12
USEPA. 2002c. Short-term Methods for Estimating the Chronic Toxicity <strong>of</strong> Effluents andReceiving Waters to Freshwater Organisms. Fourth Edition, October 2002. USEPAOffice <strong>of</strong> Water, Washington, DC. EPA-821-R-02-013.http://water.epa.gov/scitech/swguidance/methods/wet/upload/2007_07_10_methods_wet_disk3_ctf.pdfUSEPA. 2002d. Short-term Methods for Estimating the Chronic Toxicity <strong>of</strong> Effluents andReceiving Waters to Marine and Estuarine Organisms. Third Edition, October 2002.USEPA Office <strong>of</strong> Water, Washington, DC. EPA-821-R-02-014.http://water.epa.gov/scitech/swguidance/methods/wet/upload/2007_07_10_methods_wet_disk1_ctm.pdfUSEPA. 2002e. A <strong>Guidance</strong> Manual to Support the Assessment <strong>of</strong> ContaminatedSediments in Freshwater Ecosystems. Volume III – Interpretation <strong>of</strong> the Results <strong>of</strong>Sediment Quality Investigations. December 2002. USEPA Great Lakes NationalProgram Office, Chicago, IL. EPA-905-B02-001-C.http://www.cerc.usgs.gov/pubs/sedtox/VolumeIII.pdfUSEPA. 2002f. Methods for Evaluating Wetland Condition: Using Vegetation ToAssess Environmental Conditions in Wetlands. EPA-822-R-02-020. Office <strong>of</strong> Water,USEPA, Washington, DC.USEPA. 2002g. <strong>Guidance</strong> on Environmental Data Verification and Data Validation.Office <strong>of</strong> Environmental Information, Washington, DC. EPA QA /G-8. EPA/240/R-02/004. http://www.epa.gov/quality/qs-docs/g8-final.pdfUSEPA. 2003. Procedures for the Derivation <strong>of</strong> Equilibrium Partitioning SedimentBenchmarks (ESBs) for the Protection <strong>of</strong> Benthic Organisms: PAH Mixtures. USEPA,Office <strong>of</strong> Research and Development, Washington, DC. EPA-600-R-02-013.http://www.epa.gov/nheerl/publications/files/PAHESB.pdfUSEPA. 2004. Data Quality Assessment: A Reviewer’s Guide. EPA QA/G-9R. EPA-240-B-06-002. Office <strong>of</strong> Environmental Information, Washington, DC.http://www.epa.gov/quality/qs-docs/g9r-final.pdfUSEPA. 2005a. <strong>Guidance</strong> for Developing <strong>Ecological</strong> Soil Screening Levels (Eco-SSL).OSWER Directive 9285.7-55. Including Attachments 4-2 through 4-5. November 2003.Revised February 2005. http://www.epa.gov/ecotox/ecossl/.USEPA. 2005b. Procedures for the Derivation <strong>of</strong> Equilibrium Partitioning SedimentBenchmarks (ESBs) for the Protection <strong>of</strong> Benthic Organisms: Metal Mixtures (cadmium,copper, lead, nickel, silver, zinc). EPA/600/R-02/011. Office <strong>of</strong> Research andDevelopment, Washington, DC.USEPA. 2005c. Uniform Federal Policy for Quality Assurance Project Plans.Evaluating, Assessing, and Documenting Environmental Data Collection and UsePrograms. Part 1: UFP-QAPP Manual. Final Version 1. March 2005.Intergovernmental Data Quality Task Force (USEPA, US Department <strong>of</strong> Defense, USDepartment <strong>of</strong> Energy). EPA 505-B-04-900A.http://www.epa.gov/fedfac/pdf/ufp_qapp_v1_0305.pdf<strong>Ecological</strong> <strong>Evaluation</strong> <strong>Technical</strong> <strong>Guidance</strong> Document 97Version 1.2 8/29/12
USEPA 2006a. Data Quality Assessment: Statistical Methods for Practitioners.USEPA QA/G-9S. http://www.epa.gov/quality/qs-docs/g9s-final.pdfUSEPA. 2006b. <strong>Guidance</strong> on Systematic Planning Using the Data Quality ObjectivesProcess, USEPA QA/G-4, 2006, EPA-240-B-06-001, Office <strong>of</strong> EnvironmentalInformation., Washington, DC. http://www.epa.gov/quality/qs-docs/g4-final.pdfUSEPA. 2006c. Data Quality Assessment: Statistical Methods for Practitioners. EPAQA/G-9S. EPA-240-B-06-003. Office <strong>of</strong> Environmental Information., Washington, DC.http://www.epa.gov/quality/qs-docs/g9s-final.pdfUSEPA. 2008a. Evaluating Ground-Water/Surface-Water Transition Zones in<strong>Ecological</strong> Risk Assessments. Eco Update/Ground Water Forum Issue Paper. Office <strong>of</strong>Solid Waste and Emergency Response, Washington, DC. EPA-540-R-06-072.http://epa.gov/osa/raf/tefframework/pdfs/tefs-draft-052808.pdfUSEPA. 2008b. Framework for Application <strong>of</strong> the Toxicity Equivalence Methodologyfor Polychlorinated Dioxins, Furans, and Biphenyls in <strong>Ecological</strong> Risk Assessment.Office <strong>of</strong> Science Advisor, Risk Assessment Forum, Washington, DC. EPA-100-R-08-004. http://epa.gov/osa/raf/tefframework/pdfs/tefs-draft-052808.pdfUSEPA. 2008c. <strong>Ecological</strong> Risk Assessment Step 3. USEPA Region V, Chicago, IL.http://www.epa.gov/R5Super/ecology/html/erasteps/erastep3.html#csmUSEPA. 2009a. ProUCL Version 4.00.04 <strong>Technical</strong> Guide. Office <strong>of</strong> Research andDevelopment, Washington, DC.http://www.epa.gov/esd/tsc/ProUCL_v4.00.04/ProUCL_v4.00.04_tech_guide.pdfUSEPA. 2009b. ProUCL s<strong>of</strong>tware. Version 4.00.04. USEPA <strong>Technical</strong> Support Center.http://www.epa.gov/esd/tsc/TSC_form.htmUSEPA. 2009c. Estimation <strong>of</strong> Biota Sediment Accumulation Factor (BSAF) FromPaired Observations <strong>of</strong> Chemical Concentrations in Biota and Sediment. USEPA, Office<strong>of</strong> Research and Development, Duluth, MN. EPA/600/R-06/047, February 2009.http://cfpub.epa.gov/ncea/cfm/recordisplay.cfm?deid=205446#DownloadUSEPA. 2009d. Burgess, R.M. Evaluating <strong>Ecological</strong> Risk to Invertebrate Receptorsfrom PAHs in Sediments at Hazardous Waste Sites. USEPA, <strong>Ecological</strong> Risk AssessmentSupport Center, Cincinnati, OH. EPA-600-R-06-162F. October 2009.http://cfpub.epa.gov/ncea/cfm/recordisplay.cfm?deid=214715#DownloadUSEPA. 2011. <strong>Ecological</strong> Soil Screening Level (Eco-SSL). USEPA. February 10, 2011.http://www.epa.gov/ecotox/ecossl/USEPA/USACE (United <strong>State</strong>s Environmental Protection Agency and United <strong>State</strong>sArmy Corps <strong>of</strong> Engineers). 1991. <strong>Evaluation</strong> <strong>of</strong> Dredged Material Proposed for OceanDisposal, Testing Manual. USEPA Office <strong>of</strong> Water, Washington, DC. EPA 503/8-91/001.USEPA/USACE (United <strong>State</strong>s Environmental Protection Agency and United <strong>State</strong>sArmy Corps <strong>of</strong> Engineers). 1998. <strong>Evaluation</strong> <strong>of</strong> Dredged Material Proposed forDischarge in Waters <strong>of</strong> the U.S. - Testing Manual (Inland Testing Manual). USEPAOffice <strong>of</strong> Water, Washington, DC. EPA-823-B-98-004.<strong>Ecological</strong> <strong>Evaluation</strong> <strong>Technical</strong> <strong>Guidance</strong> Document 98Version 1.2 8/29/12
USFWS. 1981. Estimating Wildlife Habitat Variables. Biological Services Program,FWS/OBS-81/47.USFWS. 1988. National List <strong>of</strong> Plant Species that Occur in Wetlands: NationalSummary. Biological Report 88(24). National Ecology Research Center, St. Petersburg,FL. www.fws.gov/.../National%20List%20<strong>of</strong>%20Plant%20Species%201988.pdfVan den Berg, M., Birnbaum, L., Bosveld, A.T.C., Brunström, B., Cook, P., Feeley, M.,Giesy, J.P., Hanberg, A., Hasegawa, R., Kennedy, S.W., Kubiak, T., Larsen, J.C., vanLeeuwen, F.X.R., Liem, A.K.D., Nolt, C., Peterson, R.E., Poellinger, L., Safe, S.,Schrenk, D., Tillitt, D., Tysklind, M., Younes, M., Wærn, F., Zacharewski, T. 1998.Toxic Equivalency Factors (TEFs) for PCBs, PCDDs, PCDFs for Humans and Wildlife.Environmental Health Perspectives, 106(12): 775-792.Van den Berg, M., Birnbaum, L.S., Denison, M., DeVito, M., Farland, W., Feeley, M.,Fiedler, H., Hakansson, H., Hanberg, A., Haws, L., Rose, M., Safe, S., Schrenk, D.,Tohyama, C., Tritscher, A., Tuomisto, J., Tysklind, M., Walker, N., Peterson, R.E. 2006.The 2005 World Health Organization Reevaluation <strong>of</strong> Human and Mammalian ToxicEquivalency Factors for Dioxins and Dioxin-Like Compounds. Toxicological Sciences93(2), 223–241 (2006). http://toxsci.oxfordjournals.org/content/93/2/223.full.Vroblesky, D.A. 2001a. User’s Guide for Polyethylene-Based Passive Diffusion BagSamplers to Obtain Volatile Organic Compound Concentrations in Wells: Part 1:Deployment, Recovery, Data Interpretation, and Quality Control and Assurance. USGeological Survey Water Resources Investigations Report 01-4060, 18 p.Vroblesky, D.A. 2001b. User’s Guide for Polyethylene-Based Passive Diffusion BagSamplers to Obtain Volatile Organic Compound Concentrations in Wells: Part 2: FieldTests. US Geological Survey Water Resources Investigations Report 01-4061, 102 p.Vroblesky, D.A., Petkewich, M.D. and Cambell, T.R. 2002. Field Tests <strong>of</strong> DiffusionSamplers for Inorganic Constituents in Wells and at a Ground-water Discharge Zone.Water-Resources Investigations Report 02-4031.Wentsel, R.S., Zeeman, M.G., Maciorowski, A.F., Orr, R.L., Ells, S.J., Stahl, R.G.,Bachman, R., Barton, A.L., Clark, J.R., deFur, P.L. and others. 2001. Approaches toecological risk-based decision-making in a U.S. federal regulatory context. RiskManagement: <strong>Ecological</strong> risk-based decision making. Pensacola, FL.: SETAC Press. p91-111.Williams, B.K., Nichols, J.D., and Conroy, M.J. 2002. Analysis and Management <strong>of</strong>Animal Populations. Academic Press, San Diego.Zar, J.H. 1984. Biostatistical Analysis. Second Edition. Prentice-Hall, Inc., EnglewoodCliffs, NJ.Zimmerman, L.R., Thurman, E.M., and Bastian, K.C. 2000. Detection <strong>of</strong> PersistentOrganic Pollutants in the Mississippi Delta Using Semipermeable Membrane Devices,Science <strong>of</strong> the Total Environment 248(2–3): 169–79. http://toxics.usgs.gov/pubs/wri99-4018/Volume2/sectionC/2417_Zimmerman/pdf/2417_Zimmerman.pdf.<strong>Ecological</strong> <strong>Evaluation</strong> <strong>Technical</strong> <strong>Guidance</strong> Document 99Version 1.2 8/29/12
Appendix A - Habitat Survey Forms<strong>Ecological</strong> <strong>Evaluation</strong> <strong>Technical</strong> <strong>Guidance</strong> Document 100Version 1.2 8/29/12
<strong>Ecological</strong> <strong>Evaluation</strong> <strong>Technical</strong> <strong>Guidance</strong> Document 101Version 1.2 8/29/12
<strong>Ecological</strong> <strong>Evaluation</strong> <strong>Technical</strong> <strong>Guidance</strong> Document 102Version 1.2 8/29/12
<strong>Ecological</strong> <strong>Evaluation</strong> <strong>Technical</strong> <strong>Guidance</strong> Document 103Version 1.2 8/29/12
Appendix B - Sampling Procedures for Benthic Algae and PlanktonAlgaeBenthic algae (periphyton) are primary producers and important foundation <strong>of</strong> manystream food webs. Periphyton also stabilize substrata and serves as habitat for many otherorganisms. Their characteristics are affected by physical, chemical, and biologicaldisturbances that may occur in the stream reach.Establish the sampling reach. Collect samples using techniques for specific substratetypes.Removable substrates (hard): gravel, pebbles, cobble, and woody debris. – Removerepresentative substrates from the water; brush or scrape a representative area <strong>of</strong> algaefrom the surface and rinse into a sample jar.Removable substrates (s<strong>of</strong>t): mosses, macroalgae, vascular plants, root masses. –Place a portion <strong>of</strong> the plant in a sample container with some water. Shake it vigorouslyand rub it gently to remove algae. Remove the plant from sample container.Large substrates (not removable): boulders, bedrock, logs, trees, and roots. - PlacePVC pipe with a neoprene collar at one end on the substrate so that the collar is sealedagainst the substrate. Dislodge algae in the pipe with a toothbrush or scraper. Removealgae from the pipe with pipette.Loose sediments: sand, silt, fine particulate organic matter, clay. – Invert a petri dishover sediments. Trap sediments in the petri dish by inserting a spatula under the dish.Remove sediment from the stream and rinse it into the sampling container. Algal samplesfrom depositional habitats can also be collected with spoons, forceps, or pipette. Placesamples collected from all substrate types into a single watertight, unbreakable, widemouthcontainer. If a single habitat is sampled, collect from several areas. A compositesample measuring four ounces (125 ml) is sufficient. Add preservative, and place a labelwith pertinent information on the outside <strong>of</strong> the container.Samples should be preserved (Lugol’s solution, 4% buffered formalin, “M3” fixative, or2% glutaraldehyde) and transported on ice and in the dark.ZooplanktonLocate sampling stations as near as possible to those stations selected for chemicalsampling to ensure maximum correlation <strong>of</strong> findings. These locations will depend uponthe physical nature <strong>of</strong> the water body. Stations should also be set up on either side <strong>of</strong> theriver to account for unequal lateral mixing. Slow-moving sections <strong>of</strong> streams generallycontain more zooplankton than slower-moving segments. If there are any lakes,reservoirs, or backwater areas upstream <strong>of</strong> sampling stations, notes on their nature andlocation should be included in the sampling log. Sampling stations in lakes, reservoirs,estuaries and the ocean should be located along grid networks or transect lines, aligned toprovide the most representative sampling. Points <strong>of</strong> interest should include intake anddischarge areas, constrictions within the water body, and major bays and tributaries <strong>of</strong>fthe main basin.Rivers, streams, shallow bays and coastal waters are usually well-mixed so that onlysubsurface sampling is necessary. In lakes and reservoirs, plankton composition and<strong>Ecological</strong> <strong>Evaluation</strong> <strong>Technical</strong> <strong>Guidance</strong> Document 104Version 1.2 8/29/12
density may vary with depth; therefore, sampling should be done at several depthsdetermined by the depth <strong>of</strong> the thermocline; the euphotic zone, if applicable; and overalldepth at the station. In shallow areas (one to two meters) subsurface samples (to a depth<strong>of</strong> one meter) are usually sufficient. In lentic environments, sample at one-meter intervalsfrom the surface to the lake bottom because these organisms are not confined to theeuphotic zone.Zooplankton analysis requires at least six liters in moderately and highly productivewaters. Sample size, preservation and storage are dependent upon certain variables. Referto the NJDEP Field Sampling Manual for details. Generally, freshwater samples forspecies composition analysis should be preserved with a solution <strong>of</strong> neutralized formalin(5 ml neutralized buffer with formalin/100 ml <strong>of</strong> sample). All preserved samples shouldbe stored in the dark immediately.When collecting live samples, leave at least a four-cm air space in the bottle and chill to4º C (e.g. in a cooler with ice) during transit storage. For delicate flagellated species, donot refrigerate sample bottles. Maintain in situ temperature by storing them out <strong>of</strong> directsunlight, in an ice chest, with some <strong>of</strong> the ambient water. Surface samples in streams,rivers, shallow estuaries and coastal water can be collected simply by inverting thesample bottle, immersing it up to one meter below the water surface and slowly filling itas it is removed from the water. A Kemmerer sampler may also be used by holding it in ahorizontal position and closing it manually. Samples collected for chlorophyll analysisshould not be fixed or preserved. Chlorophyll samples should be preserved by chilling to4°C. If species composition analysis is necessary, then samples should be collected in aseparate sample bottle, or fixed or preserved by laboratory staff after the aliquot forchlorophyll analysis is removed from the sample container.When deeper samples are needed, use <strong>of</strong> a Kemmerer, water bottle, Van Dorn or Judaysamplers is standard. All <strong>of</strong> these sampling devices basically consist <strong>of</strong> a metal or plastichollow cylinder with remotely activated stoppers at both ends. The sampler is lowered toa desired depth with a graduated line. Once at the desired depth, a heavy brass slug or“messenger” attached to the line is released. It slides down the line, and strikes therelease mechanism on the sampler which pulls the stoppers tight against the open ends <strong>of</strong>the cylinder, trapping the sample <strong>of</strong> water inside. The sampler is then withdrawn and thewater emptied into the sample container via a small spigot or tube in one <strong>of</strong> the stoppers.Use only nonmetallic samplers when metal analysis, algal assays, or primary productivitymeasurements will be performed on the sample. Sample bottle labels should identify thebody <strong>of</strong> water sampled and list the date <strong>of</strong> collection, collectors name, preservative ifpresent, and the type <strong>of</strong> biological analysis desired (determination <strong>of</strong> dominant or bloomspecies, total cell count, etc.). It is important that labels clearly identify live planktonsamples as being unpreserved.<strong>Ecological</strong> <strong>Evaluation</strong> <strong>Technical</strong> <strong>Guidance</strong> Document 105Version 1.2 8/29/12
Appendix C - Surface Water Toxicity TestingFreshwater Test SpeciesThe most commonly used species for freshwater (salinity <strong>of</strong> 3.5 ppt or less) surface watertoxicity studies in <strong>New</strong> <strong>Jersey</strong> are the fathead minnow (Pimephales promelas) and thewater flea (Ceriodaphnia dubia). Rainbow trout (Oncorhynchus mykiss) and brook trout(Salvelinus fontinalis) are listed in the USEPA guidance, and brown trout (Salmo trutta)and bluegill (Lepomis macrochirus) are listed in the NJDEP guidance, but these fishspecies are not commonly used in <strong>New</strong> <strong>Jersey</strong>. Two other daphnid species (Daphniapulex and Daphnia magna) are also listed in both the USEPA and NJDEP guidance, butare not commonly used in <strong>New</strong> <strong>Jersey</strong>.Saltwater Test SpeciesThe most commonly used species for saltwater (salinity greater than 3.5 ppt) surfacewater toxicity studies in <strong>New</strong> <strong>Jersey</strong> are the sheepshead minnow (Cyprinodon variegatus)and the opossum shrimp (Americamysis bahia). Three other fish species ― inlandsilversides (Menidia beryllina), Atlantic silverside (M. menidia) and the tidewatersilverside (M. peninsulae) ― are also listed in both the USEPA and NJDEP guidance butare not commonly used in <strong>New</strong> <strong>Jersey</strong>. The USEPA guidance lists a sea urchin (Arbaciapunctulata) and a macroalga (Champia parvula), and the NJDEP guidance lists grassshrimp (Paleomonetes pugio), but these last three are rarely, if ever, used in <strong>New</strong> <strong>Jersey</strong>.Toxicity Test TypesThere are three basic types <strong>of</strong> aqueous toxicity tests:(1) static, nonrenewal tests in which the test solution is not changed throughout thetest. These tests have the advantages <strong>of</strong> being simple, with minimal physicaldisturbance <strong>of</strong> the test organisms, and the disadvantage that toxicants mayvolatilize or degrade during testing;(2) static-renewal tests in which the test organisms are exposed to fresh test solutionperiodically (e.g., every 24 hours). These have the advantage <strong>of</strong> being able toaddress the volatilization/degradation issue but are more labor-intensive and causemore physical disturbance to the test organisms; and(3) flow-through tests in which there is a continual or semi-continual flow <strong>of</strong> freshtest solution through the test chambers for the duration <strong>of</strong> the test. These testshave the advantage <strong>of</strong> exposing organisms in a more stream-like manner, butthese tests are significantly more labor-intensive and are also more expensive thanthe other two test types.Toxicity Test Duration - Acute or ChronicToxicity is generally assessed in the laboratory using acute or chronic studies. Acutestudies are <strong>of</strong> short duration, usually one to four days, and are designed to determinewhether the surface water sample in question will kill the exposed organisms. Chronicstudies are longer, usually seven days or more (some exceeding 90 days), and aredesigned to determine sublethal effects on growth and reproduction. While observedlethality is a direct indication that the sample in question is toxic, sublethal effects areimportant for the assessment <strong>of</strong> long-term population health and are generally theendpoint <strong>of</strong> concern in an ecological risk assessment (ERA).<strong>Ecological</strong> <strong>Evaluation</strong> <strong>Technical</strong> <strong>Guidance</strong> Document 106Version 1.2 8/29/12
If no historical aquatic toxicity information is available, investigators can perform 24-hour to 96-hour acute toxicity studies to determine whether the samples are acutely toxic.If no acute toxicity is observed, investigators can initiate short-term chronic toxicitystudies. Acute toxicity studies are quicker and cheaper than chronic studies. However,because aqueous samples can be diluted, it is <strong>of</strong>ten easier to go straight to the short-termchronic toxicity test, including a series <strong>of</strong> dilutions (sample mixed with clean laboratorywater). For ERAs, chronic studies are <strong>of</strong>ten more appropriate because <strong>of</strong> the long-termexposure <strong>of</strong> the receptors to the contaminant <strong>of</strong> potential ecological concern (COPECs)(assessment <strong>of</strong> maintenance and reproduction <strong>of</strong> a healthy population).Toxicity Test DesignAquatic toxicity studies are conducted by exposing a predetermined number <strong>of</strong> organisms(e.g., four replicates <strong>of</strong> ten organisms) to an undiluted sample or to a series <strong>of</strong>concentrations <strong>of</strong> a surface water or wastewater sample. Aquatic organisms are placed inappropriate test chambers (e.g., beakers, flasks, test tubes) containing the samples, and intest chambers containing clean laboratory water to serve as an experimental control.Investigators make direct observations <strong>of</strong> the exposed test organisms at regular intervalsfor the duration <strong>of</strong> the test to determine responses such as mortality, reduction in growth,or reduced reproduction.Surface water and wastewater samples can be tested undiluted at 100 percent strength;however, if toxicity is observed, such a test does not indicate how toxic the sample is.Both USEPA and NJDEP recommend using five serial dilutions <strong>of</strong> the sample water(e.g., 100%, 50%, 25%, 12.5% and 6.25%) mixed with clean laboratory water. The cleanlaboratory water is also used as a negative control to assess the health <strong>of</strong> the testorganisms (if toxic effects are noted in laboratory water, the batch <strong>of</strong> test organisms isconsidered suspect, and the test may have to be re-run using a different batch <strong>of</strong>organisms). A second “reference” control can also be included in the study, using surfacewater from outside the influence <strong>of</strong> the site (e.g., upstream).To perform statistical analyses to determine whether significant differences exist betweenthe laboratory controls or reference area samples, toxicity studies should be set up withmultiple replicates. As a general rule, more replicates mean greater statistical power andmore confidence in the final results. Acute toxicity studies are typically performed withtwo replicates <strong>of</strong> ten organisms for each test concentration, which is sufficient forcalculation <strong>of</strong> lethal concentrations.Short-term chronic toxicity studies should be performed with four or more replicates <strong>of</strong>ten organisms per exposure concentration for fish and mysid shrimp, and with tenreplicates <strong>of</strong> a single organism per exposure concentration for Ceriodaphnia. Replicationensures sufficient statistical power for the more sensitive sublethal endpoints (e.g.,growth and reproduction).Toxicity Test EndpointsFor acute toxicity studies, the typical endpoint is lethality, which is generally expressedas the LC 50 (the concentration <strong>of</strong> test water that kills half <strong>of</strong> the exposed organisms).Statistical calculation methods are discussed at length in the USEPA guidance manual.<strong>Ecological</strong> <strong>Evaluation</strong> <strong>Technical</strong> <strong>Guidance</strong> Document 107Version 1.2 8/29/12
Short-term chronic studies, endpoints include lethality, growth, or reproduction. Testsmay include the following: The seven-day fathead minnow larval survival and growth assay (USEPA Method1000), and the seven-day sheepshead minnow larval survival and growth assay(USEPA Method 1004) assess survival at test termination as a percentage <strong>of</strong> thenumber <strong>of</strong> fish exposed at test initiation. Growth is assessed as the dry weight <strong>of</strong> thesurviving fish. The seven-day daphnid survival and reproduction assay (USEPA Method 1002) alsoassesses survival at test termination. Reproduction is assessed by comparing the totalnumber <strong>of</strong> progeny produced by each female in each test exposure at test termination.Ceriodaphnia are parthenogenic (meaning the female does not need a male to fertilizeher eggs) and will generally produce three broods <strong>of</strong> progeny in seven days. Tenreplicates, each with a single Ceriodaphnia, are monitored daily for the number <strong>of</strong>progeny released. The seven-day mysid shrimp survival, growth, and fecundity assay (USEPA Method1007) also assesses survival at test termination. Fecundity is assessed by microscopicevaluation <strong>of</strong> all surviving organisms to determine their sex and the percentage <strong>of</strong>surviving females that are carrying eggs. After fecundity counts, growth is assessed asthe dry weight <strong>of</strong> the surviving shrimp.Data <strong>Evaluation</strong>The seven-day short-term chronic endpoints include the LC 50 , the no observed effectconcentration (NOEC) and the lowest observed effect concentration (LOEC). The NOECis the highest test concentration at which there was no statistically significant reduction insurvival, growth, or reproduction or fecundity as compared to the laboratory control orreference area sample. The LOEC is the lowest test concentration at which a significantreduction was observed. The inhibitory concentration (IC) can also be calculated for anypercentage <strong>of</strong> concern. For example, the IC 25 is the test concentration that yielded aninhibitory effect on 25 percent <strong>of</strong> the exposed organisms.All statistical analyses are to be performed as specified in the USEPA guidance manuals.Statistical programs developed specifically for aquatic toxicity studies are commerciallyavailable. Data from site samples should be compared to the laboratory controls todetermine whether observed toxic effects are statistically significant. In addition to thelaboratory control, an appropriately selected field reference area sample may yield resultsthat are more representative <strong>of</strong> actual field conditions. A surface water sample fromupstream <strong>of</strong> a site is an appropriate reference area for a surface water sample fromdownstream <strong>of</strong> a site. If the upstream reference area sample shows toxic effects, it ispossible that at least a portion <strong>of</strong> any toxic effect observed from the downstream sampleis not related to the site.Quality AssuranceAll toxicity studies should meet the minimum test acceptability criteria for controlorganism survival, growth, reproduction or fecundity set forth in the appropriate guidancedocuments. Additionally, Standard Reference Toxicant (SRT) tests should be performedby the laboratory at regular intervals (at least monthly for surface water species). It ispreferable that the SRT be initiated on the same day, by the same technicians, with the<strong>Ecological</strong> <strong>Evaluation</strong> <strong>Technical</strong> <strong>Guidance</strong> Document 108Version 1.2 8/29/12
same batch <strong>of</strong> organisms used for the test samples (so the SRT is directly related to thestudy). The lab should have a reference toxicant control chart for each species and agegroup they regularly use in testing. The object <strong>of</strong> the SRT is to assess the organismhealth, the lab procedure, and the technician's handling.<strong>Ecological</strong> <strong>Evaluation</strong> <strong>Technical</strong> <strong>Guidance</strong> Document 109Version 1.2 8/29/12
Appendix D - Sediment Toxicity TestingFreshwater Test SpeciesTwo benthic invertebrate species are usually tested simultaneously for freshwater(salinity <strong>of</strong> 3.5 ppt or less) sediment toxicity studies in <strong>New</strong> <strong>Jersey</strong>. They are theamphipod (Hyalella azteca) and the midge (Chironomus dilutus). Other potentiallyappropriate species mentioned in the USEPA and ASTM guidance include the amphipod(Diporeia spp.), the midge (Chironomus riparius) the mayfly (Hexagenia spp.) and theoligochaete worms Lumbriculus variegatus and Tubifex tubifex.H. azteca and C. dilutus are usually tested simultaneously to incorporate their varyingsensitivities and their different exposure pathways. H. azteca is epibenthic (lives andfeeds on top <strong>of</strong> the sediment, hidden by leaves and organic detritus), while C. dilutusburrows directly into the sediment. This distinction is important in situ, but in laboratorystudies, no leaves or cover objects are added to the test chambers, so both species burrowdirectly into the sediment. Testing is performed in accordance with USEPA (2000a) andASTM (2005a) guidance.Saltwater Test SpeciesThe most commonly used benthic invertebrates for estuarine and marine sedimenttoxicity testing in <strong>New</strong> <strong>Jersey</strong> are the amphipods, Leptocheirus plumulosus andAmpelisca abdita, and the polychaete worms Neanthes arenaceodentata and Neanthesvirens. Other amphipod species included in the ASTM methods are Eohaustoriusestuarius and Rhepoxynius abronius, Pacific species that are not applicable for use in<strong>New</strong> <strong>Jersey</strong>.Marine sediment toxicity testing is usually performed with a single amphipod species. L.plumulosus is more appropriate for lower salinity (5 to 20 ppt), estuarine sedimentsamples, and A. abdita is more appropriate for higher salinity (20 to 35 ppt), marinesediment samples.Because <strong>of</strong> their relatively large size and available tissue mass, the polychaete worms N.arenaceodentata and N. virens are used for bioaccumulation studies in which the wormsare exposed to a test sediment for a specified time (e.g., 28 days) and then the tissue issubmitted for analysis <strong>of</strong> contaminants <strong>of</strong> concern.Toxicity Test TypesThere are three basic types <strong>of</strong> sediment toxicity tests:(1) static, nonrenewal tests, in which the overlying water is not changed throughoutthe test. These have the advantages <strong>of</strong> being simple, with minimal physicaldisturbance <strong>of</strong> the sediment or test organisms, and the disadvantage that theammonia and oxygen demand from the sediment may confound the results;(2) static-renewal tests in which the overlying water is exchanged periodically (e.g.,every 12 hours). These have the advantage <strong>of</strong> being able to address the ammoniaand dissolved oxygen issues but are more labor intensive and cause more physicaldisturbance to the sediment and test organisms; and(3) flow-through tests in which there is a continual or semi-continual flow <strong>of</strong> freshoverlying water through the test chambers for the duration <strong>of</strong> the test. These have<strong>Ecological</strong> <strong>Evaluation</strong> <strong>Technical</strong> <strong>Guidance</strong> Document 110Version 1.2 8/29/12
the advantage <strong>of</strong> exposing organisms in a more stream-like manner, but they aresignificantly more labor intensive and are also more expensive than the other twotest types.Toxicity Test Duration - Acute or ChronicSediment toxicity is generally assessed in the laboratory using acute or chronic studies.Acute sediment studies take ten days (though screening assays may be shorter), and aredesigned to determine whether the sediment sample in question will kill the exposedorganisms or impact their growth. Chronic studies are longer, usually 20 days or more(some exceeding 50 days), and are designed to determine sublethal effects on growth,emergence and reproduction. While observed lethality is a direct indication that thesample in question is toxic, sublethal effects can be important for the assessment <strong>of</strong> longtermpopulation health. In ecological risk assessments, chronic toxicity tests aregenerally considered to be the preferred alternative. The NJDEP and USEPA Region 2BTAG have routinely recommended the use <strong>of</strong> ASTM E1706 - 05(2010) Standard TestMethod for Measuring the Toxicity <strong>of</strong> Sediment-Associated Contaminants withFreshwater Invertebrates. The previous version <strong>of</strong> this standard (Test Method E1706-95b) described 10-day toxicity tests with the amphipod Hyalella azteca and midgeChironomus. This version <strong>of</strong> the standard now outlines approaches for evaluatingsublethal endpoints in longer-term sediment exposures with these two species (Annex A6and Annex A7).However, in highly urbanized settings where there are numerous sources effecting a site,the longer-term sublethal studies are not always appropriate for environmental sedimentsamples because the short term toxicity tests are adequate to measure potential impactsassociated with the site. Sensitive sublethal tests are good for testing chemicals andwastewater solutions that can be diluted to different concentrations (e.g., 100%, 50%,25%, 12.5% and 6.25%) at which a dose response becomes apparent. If a responseunrelated to dose is observed (e.g., effect at 25%, but not at 100%), the test is suspect.When testing sediment samples, they are not diluted and are tested as 100 percent versusa laboratory control or reference area sample. If there is a sublethal effect, investigatorsmay not be able to tell whether it is related to the sample or to the inherent variability <strong>of</strong>the biological system being tested.Variability is expected even in the laboratory's Standard Reference Toxicant (SRT)studies. Labs perform regular SRT tests to assess the health <strong>of</strong> each batch <strong>of</strong> testorganisms and the procedures used by the technicians setting up the tests. The SRTstudies are typically short-term (96 hours or shorter), water-only tests that use a commonreagent-grade salt (e.g., KCl). The USEPA (2000a) states that even though the final SRTresult is allowed to fall within two standard deviations <strong>of</strong> the laboratory's historical mean,the laboratory is expected to have up to 10 percent <strong>of</strong> SRT tests fall outside <strong>of</strong> that range.It is not until the lab has more than 10 percent SRT failures that a problem is noted.Because USEPA expects so much variability in a short-term test with lab water andreagent salts, it is within reason to expect that long-term, sublethal effects from complexmixtures like site sediment will yield substantially more variability.<strong>Ecological</strong> <strong>Evaluation</strong> <strong>Technical</strong> <strong>Guidance</strong> Document 111Version 1.2 8/29/12
Toxicity Test DesignSediment toxicity studies are conducted by exposing a predetermined number <strong>of</strong>organisms (e.g., eight replicates <strong>of</strong> ten organisms) to a sediment sample. Benthicorganisms are placed in beakers containing a layer <strong>of</strong> the sediment sample covered withclean laboratory water, and in test chambers containing clean laboratory sediment toserve as an experimental control. Investigators make direct observations <strong>of</strong> the exposedtest setup at regular intervals for the duration <strong>of</strong> the test to determine responses such aserratic behavior and visible mortality. However, sediment organisms quickly burythemselves in the test sediment and are not seen again until test termination when theyare removed for final enumeration.A second “reference” control should also be included in each study, using sediment fromoutside the influence <strong>of</strong> the site (e.g., upstream). Use <strong>of</strong> an appropriate reference areasediment is more representative <strong>of</strong> the actual background area stream conditions. While asite sediment may show a significant effect as compared to the laboratory control, it maynot show a significant effect when compared to the reference area.To perform statistical analyses to determine whether significant differences exist betweenthe site-related samples and laboratory controls or reference area samples, toxicity studiesshould be set up with multiple replicates. As a general rule, more replicates mean greaterstatistical power and more confidence in the final results. Acute sediment studies aretypically performed with eight replicates <strong>of</strong> ten organisms for each test sample, whichensures sufficient statistical power for the more sensitive sublethal growth endpoint.Toxicity Test EndpointsFor acute sediment toxicity studies, the endpoints include survival and growth. Survivalis assessed as a percentage <strong>of</strong> the number <strong>of</strong> organisms exposed at test initiation. Growth<strong>of</strong> amphipods, both freshwater and saltwater, is assessed as the dry weight <strong>of</strong> thesurviving organisms.Growth <strong>of</strong> midges is assessed as the ash-free dry weight (AFDW) <strong>of</strong> the survivingorganisms. Sediment grain size influences the amount <strong>of</strong> sediment that C. dilutus larvaeingest, and as a result, larvae exposed to finer-grained sediment will have more sedimentin their guts. Because most sediment sites have varying grain size distributions,significant bias can be added to the C. dilutus growth results. By measuring the dryweight <strong>of</strong> the surviving organisms at test termination, then ashing them to burn <strong>of</strong>f anyorganic material, the weight <strong>of</strong> the sediment grains can be subtracted from the total dryweight to yield AFDW, which is the more appropriate endpoint.Data <strong>Evaluation</strong>All statistical analyses are to be performed as specified in the USEPA and ASTMguidance documents. Data from site samples should be compared to the laboratorycontrols to determine whether observed toxic effects are statistically significant. Inaddition to the laboratory control, an appropriately selected field reference area sedimentmay yield results that are more representative <strong>of</strong> actual background area field conditions.If the upstream reference area sample shows toxic effects, it is possible that at least aportion <strong>of</strong> any toxic effect observed from the downstream sample is not related to the site.<strong>Ecological</strong> <strong>Evaluation</strong> <strong>Technical</strong> <strong>Guidance</strong> Document 112Version 1.2 8/29/12
Quality AssuranceAll toxicity studies should meet the minimum test acceptability criteria for controlorganism survival, growth, reproduction or fecundity set forth in the appropriate guidancedocuments. Additionally, SRT tests should be performed by the laboratory at regularintervals (at least monthly for surface water species). It is preferable that the SRT beinitiated on the same day, by the same technicians, with the same batch <strong>of</strong> organismsused for the test samples (so the SRT is directly related to the study). The lab shouldhave a reference toxicant control chart for each species and age group they regularly usein testing. The object <strong>of</strong> the SRT is to assess the organism health, the lab procedure andthe technician's handling.<strong>Ecological</strong> <strong>Evaluation</strong> <strong>Technical</strong> <strong>Guidance</strong> Document 113Version 1.2 8/29/12
Appendix E - Sediment Pore Water and Elutriate Toxicity TestingFreshwater Test SpeciesThe most commonly used species for freshwater (salinity <strong>of</strong> 3.5 ppt or less) surface watertoxicity studies in <strong>New</strong> <strong>Jersey</strong> are the fathead minnow (Pimephales promelas) and thewater flea (Ceriodaphnia dubia). These species would also be appropriate for testing <strong>of</strong>sediment pore water and elutriate samples.Salt Water Test SpeciesThe most commonly used species for saltwater (salinity greater than 3.5 ppt) surfacewater toxicity studies in <strong>New</strong> <strong>Jersey</strong> are the sheepshead minnow (Cyprinodon variegatus)and the opossum shrimp (Americamysis bahia). These species would also beappropriate for testing <strong>of</strong> sediment pore water and elutriate samples.Toxicity Test TypesThere are three basic types <strong>of</strong> aqueous toxicity tests:(1) static, nonrenewal tests, in which the test solution is not changed throughout thetest. These have the advantages <strong>of</strong> being simple, with minimal physicaldisturbance <strong>of</strong> the test organisms, and the disadvantage that toxicants mayvolatilize or degrade during testing;(2) static-renewal tests in which the test organisms are exposed to fresh test solutionperiodically (e.g., every 24 hours). These have the advantage <strong>of</strong> being able toaddress the volatilization and degradation issues, but are more labor intensive andcause more physical disturbance to the test organisms; and(3) flow-through tests, in which there is a continual or semi-continual flow <strong>of</strong> freshtest solution through the test chambers for the duration <strong>of</strong> the test. These have theadvantage <strong>of</strong> exposing organisms in a more stream-like manner, but they aresignificantly more labor intensive and are also more expensive than the other twotest types.Flow-through assays are difficult to perform with pore water and elutriate samplesbecause <strong>of</strong> the volumes <strong>of</strong> sample required. Therefore, the static-renewal and the staticnonrenewalare the most commonly performed test types.Toxicity Test Duration - Acute or ChronicToxicity is generally assessed in the laboratory using acute or chronic studies. Acutestudies are <strong>of</strong> short duration, usually one to four days, and are designed to determinewhether the sediment pore water or elutriate sample in question will kill the exposedorganisms. Chronic studies usually take seven days and are designed to determinesublethal effects on growth and reproduction. While observed lethality is a directindication that the sample in question is toxic, sublethal effects are important forassessing long-term population health.If no historical aquatic toxicity information is available, investigators can perform 24-hour to 96-hour acute toxicity studies to determine whether the samples are acutely toxic.If no acute toxicity is observed, investigators can initiate short-term chronic toxicitystudies. Acute toxicity studies are quicker and cheaper than chronic studies. However,because aqueous samples can be diluted, it is <strong>of</strong>ten easier to go straight to the short-term<strong>Ecological</strong> <strong>Evaluation</strong> <strong>Technical</strong> <strong>Guidance</strong> Document 114Version 1.2 8/29/12
chronic toxicity test, including a series <strong>of</strong> dilutions (pore water or elutriate sample mixedwith clean laboratory water).Toxicity Test DesignAquatic toxicity studies are conducted by exposing a predetermined number <strong>of</strong> organisms(e.g., four replicates <strong>of</strong> ten organisms) to an undiluted sample or to a series <strong>of</strong>concentrations <strong>of</strong> a pore water or elutriate sample. Aquatic organisms are placed inappropriate test chambers (e.g., beakers, flasks, test tubes) containing the samples and intest chambers containing clean laboratory water to serve as an experimental control.Investigators make direct observations <strong>of</strong> the exposed test organisms at regular intervalsfor the duration <strong>of</strong> the test to determine responses such as mortality, reduction in growthor reduced reproduction.Pore water and elutriate samples can be tested undiluted, at 100 percent strength, but iftoxicity is observed, such a test does not indicate how toxic the sample is. For surfacewater and wastewater assays, both the USEPA and NJDEP recommend using five serialdilutions <strong>of</strong> the sample water (e.g., 100%, 50%, 25%, 12.5% and 6.25%) mixed withclean laboratory water. The clean laboratory water is also used as a negative control toassess the health <strong>of</strong> the test organisms (if toxic effects are noted in laboratory water, thebatch <strong>of</strong> test organisms is considered suspect, and the test may have to be re-run using adifferent batch <strong>of</strong> organisms). A second “reference” control can also be included in thestudy, using pore water or elutriate derived from sediment samples collected outside theinfluence <strong>of</strong> the site (e.g., upstream).To perform statistical analyses to determine whether significant differences exist betweenthe laboratory controls or reference area samples, toxicity studies should be set up withmultiple replicates. As a general rule, more replicates mean greater statistical power andmore confidence in the final results. Acute toxicity studies are typically performed withtwo replicates <strong>of</strong> ten organisms for each test concentration, which is sufficient forcalculation <strong>of</strong> lethal concentrations.Short-term chronic toxicity studies should be performed with four or more replicates <strong>of</strong>ten organisms per exposure concentration for fish and mysid shrimp, and with tenreplicates <strong>of</strong> a single organism per exposure concentration for Ceriodaphnia. Replicationensures sufficient statistical power for the more sensitive sublethal endpoints (e.g.,growth and reproduction).Toxicity Test EndpointsFor acute toxicity studies, the typical endpoint is lethality. Lethality is generallyexpressed as the LC 50 (the concentration <strong>of</strong> test water that kills half <strong>of</strong> the exposedorganisms). Statistical calculation methods are discussed at length in the USEPAguidance manual.For short-term chronic studies, endpoints include lethality, growth or reproductionendpoints. The seven-day fathead minnow larval survival and growth assay (USEPAMethod 1000) and the seven-day sheepshead minnow larval survival and growth assay(USEPA Method 1004) assess survival at test termination as a percentage <strong>of</strong> the number<strong>of</strong> fish exposed at test initiation. Growth is assessed as the dry weight <strong>of</strong> the survivingfish.<strong>Ecological</strong> <strong>Evaluation</strong> <strong>Technical</strong> <strong>Guidance</strong> Document 115Version 1.2 8/29/12
The seven-day daphnid survival and reproduction assay (USEPA Method 1002) alsoassesses survival at test termination. Reproduction is assessed by comparing the totalnumber <strong>of</strong> progeny produced by each female in each test exposure at test termination.Ceriodaphnia are parthenogenic (meaning the female does not need a male to fertilize hereggs), and will generally produce three broods <strong>of</strong> progeny in seven days. Ten replicates,each with a single Ceriodaphnia are monitored daily for the number <strong>of</strong> progeny released.The seven-day mysid shrimp survival, growth and fecundity assay (USEPA Method1007) also assesses survival at test termination. Fecundity is assessed by microscopicevaluation <strong>of</strong> all surviving organisms to determine their sex and the percentage <strong>of</strong>surviving females carrying eggs. After fecundity counts, growth is assessed as the dryweight <strong>of</strong> the surviving shrimp.Data <strong>Evaluation</strong>The seven-day short-term chronic endpoints include the LC 50 , the NOEC and the LOEC.The NOEC is the highest test concentration at which there was no statistically significantreduction in survival, growth, reproduction or fecundity as compared to the laboratorycontrol or reference area sample. The LOEC is the lowest test concentration at which asignificant reduction was observed. The IC can also be calculated for any percentage <strong>of</strong>concern. For example, the IC 25 is the test concentration that yielded an inhibiting effecton 25 percent <strong>of</strong> the exposed organisms.All statistical analyses are to be performed as specified in the USEPA guidance manuals.Statistical programs developed specifically for aquatic toxicity studies are commerciallyavailable. Data from site samples should be compared to the laboratory controls todetermine whether observed toxic effects are statistically significant. In addition to thelaboratory control, an appropriately selected field reference area sample may yield resultsthat are more representative <strong>of</strong> actual field conditions. A pore water or elutriate samplederived from sediment collected upstream <strong>of</strong> a site is an appropriate reference area for apore water or elutriate sample derived from site sediment. If the upstream reference areasample shows toxic effects, it is possible that at least a portion <strong>of</strong> any toxic effectsobserved from the downstream sample is not related to the site.Quality AssuranceAll toxicity studies should meet the minimum test acceptability criteria for controlorganism survival, growth, reproduction or fecundity set forth in the appropriate guidancedocuments. Additionally, standard reference toxicant (SRT) tests should be performedby the laboratory at regular intervals (at least monthly for surface water species). It ispreferable that the SRT be initiated on the same day, by the same technicians, with thesame batch <strong>of</strong> organisms used for the test samples (so the SRT is directly related to thestudy). The lab should have a reference toxicant control chart for each species and agegroup they regularly use in testing. The object <strong>of</strong> the SRT is to assess the organismhealth, the lab procedure and the technician's handling.<strong>Ecological</strong> <strong>Evaluation</strong> <strong>Technical</strong> <strong>Guidance</strong> Document 116Version 1.2 8/29/12
Appendix F – Sediment Pore Water Sampling TechniquesThe following briefly describes some <strong>of</strong> the more recent tools and methods used for thecollection <strong>of</strong> sediment pore water samples. A detailed discussion <strong>of</strong> each method is beyondthe scope <strong>of</strong> this guidance. Rather, this section is intended to simply introduce thesemethods and provide references for their use and interpretation <strong>of</strong> data generated.Ultimately, the use <strong>of</strong> these methods should result in a more accurate measure <strong>of</strong> sitespecificcontaminant bioavailability or toxicity to sediment dwelling organisms.Diffusion Samplers:Diffusion-based samplers consist <strong>of</strong> a semipermeable membrane or dialysis tube filled withdistilled water, purified fish oil (triolein) or a gel, which rely on a solute gradient toestablish equilibrium between the pore water and the sampler. Diffusion samplers are <strong>of</strong>tenused in situ for measuring metals, phosphates, and sulfides. Some <strong>of</strong> the more commonsamplers for in situ diffusion include the following:• Peepers: A sampling device, also referred to as a dialysis cell, which consists <strong>of</strong> a rigidstructure that can hold volumes <strong>of</strong> distilled or deionized water separated from theenvironment by a porous membrane. Holes within the rigid structure allow pore waterand associated contaminants to pass through the membrane, allowing the cell to passivelyequilibrate with the surrounding pore water. These samplers are capable <strong>of</strong> monitoringmost compounds (inorganic and organic) present in dissolved phases (ITRC, 2005).• Semi-Permeable Membrane Devices (SPMD): SPMDs are fat- or lipid-filled membranesthat attempt to mimic uptake into benthos or fish in terms <strong>of</strong> HOC (hydrophobic organicchemical) absorption to lipids in aquatic organisms (Zimmerman, et al., 2000). SPMDsconsist <strong>of</strong> a high molecular weight lipid (typically triolein) that is placed into apolyethylene membrane tube. The device may be placed in a perforated stainless steeldeployment device to provide protection when placed in sediment (USEPA, n.d.).• Diffusive gradient in thin films (DGT): DGTs are another type <strong>of</strong> diffusion sampler, andrefers to two similar tools for collecting metals from sediment pore water (Davison et al.,2000). DGTs differ from other diffusive samplers in that they are typically casings filledwith gels that are specific to the target compound (e.g. a Chelex or acrylamide gel formetals, ferrous-oxide gel for phosphorus). The unique advantage <strong>of</strong> DGTs over otherdiffusive samplers is that after retrieval, the gel can be cut into segments for multipleanalyses.Equilibrium Samplers:Equilibrium samplers are used to measure the pore water concentrations <strong>of</strong> freely dissolvedhydrophobic organic compounds (e.g., PCBs, PAHs). These types <strong>of</strong> samplers can bedeployed in situ (e.g., directly into the sediment) where they accumulate contaminants fromthe pore water, while others are used to extract small quantities <strong>of</strong> contaminants fromextracted pore water.• Solid Phase Microextraction Devices (SPME): This technique, used to establish PAHpore water concentrations, involves using thin silica fibers coated with an organicpolymer. The fibers can be exposed to sediment pore water in situ or in a laboratorysetting. The freely dissolved hydrophobic organic contamination is sorbed onto theSMPE fiber, which is then injected into a GS/MS for analysis. The direct pore water<strong>Ecological</strong> <strong>Evaluation</strong> <strong>Technical</strong> <strong>Guidance</strong> Document 117Version 1.2 8/29/12
esults are then evaluated using USEPA’s hydrocarbon narcosis model (USEPA, 2003).It has been documented that the ability <strong>of</strong> the SPME method to predict toxicity correlatewell with toxicity observed with standard sediment toxicity tests. This technique wasmore reliable at predicting PAH impacts than were those found through the use <strong>of</strong> bulkPAH concentrations and Equilibrium Partitioning (EqP) to estimate pore waterconcentrations (Moles et al., 2006; Hawthorne et al., 2007). The method recentlybecame standardized (USEPA SW-846 Method 8272/ASTM provisional standardD7363-07) and incorporated into USEPA’s document titled Evaluating <strong>Ecological</strong> Riskto Invertebrate Receptors from PAHs in Sediments at Hazardous Waste Sites (2009d).http://cfpub.epa.gov/ncea/cfm/recordisplay.cfm?deid=214715• Polyethylene (PE) and polyoxymethylene (POM) samplers: These samplers are similarto SPMEs in their ability to sorb organic compounds from sediments. A principaladvantage <strong>of</strong> using these samplers is their ability to come into equilibrium faster thanSPMEs. Recent work has shown that uptake <strong>of</strong> PAH and PCBs by PE and POMsamplers correlate with benthic organism uptake (Tomasaewski and Luthy, 2008).Centrifugation:Centrifugation is another method used for the collection <strong>of</strong> pore water samples. Thismethod involves placing bulk sediments in a large-capacity centrifuge (e.g., a bucket-stylecentrifuge with one liter capacity per sample) and centrifuging them at low speed (e.g.,7,400 x gravitational force) for 15 to 30 minutes (ASTM, 2000; Environment Canada,1994). In some cases, subsequent high-speed centrifugation (e.g., 10,000 x gravitationalforce) may be necessary or desirable, particularly if the selected test species have lowtolerance to suspended particles. Centrifugation requires the collection <strong>of</strong> a large volume<strong>of</strong> sediment to extract a sufficient amount <strong>of</strong> pore water suitable for analysis, <strong>of</strong>tencontributing to elevated method detection limits (MDLs).Additional Pore Water Sampling Devices:One additional pore water sampling device that is unique in that it measures threeparameters is the US Navy’s Trident probe. The Trident probe is a flexible, multi-sensor,water-sampling probe for screening and mapping groundwater plumes at the surface waterinterface. The probe has the ability to measure conductivity, temperature, and pore water,and is well-suited for spatially identifying where groundwater is discharging to surfacewater. Once the groundwater and surface water discharge is located, pore water samplescan be collected to chemically characterize the contamination.http://meso.spawar.navy.mil/Capabilities/Trident/index.html<strong>Ecological</strong> <strong>Evaluation</strong> <strong>Technical</strong> <strong>Guidance</strong> Document 118Version 1.2 8/29/12
Appendix G – Invertebrate Sampling MethodsMethods for sampling invertebrates include the use <strong>of</strong> artificial substrates, Surbersamplers, grab samplers and Rapid Bioassessment techniques. These are described below(modified text taken directly from the Field Sampling Procedures Manual (NJDEP,2005) and Rapid Bioassessment Protocols for Use in Streams and Wadeable Rivers(USEPA, 1999b).All benthic macroinvertebrates are preserved in 5 percent formalin (5 ml formalin/100 ml<strong>of</strong> water from which the organism was taken), with 95 percent ethanol, or isopropylalcohol. A Mason jar, or any glass or plastic wide mouth container can be used forbenthic macroinvertebrate samples.Artificial Substrates: (Hester-Dendy)These multi-plate samplers consist <strong>of</strong> eight large tempered plates separated by sevensmall plates, exposing one square foot <strong>of</strong> surface area. A hole is bored through the center<strong>of</strong> each plate. Plates are placed alternatively on a galvanized eyebolt, threaded rod ornylon cord and secured. Samplers may have a brick attached to one end to anchor thesampler to the bottom for use in shallow streams, or they may be suspended fromanchored floats in lakes and deep rivers. Used throughout, artificial substrates provideconsistency <strong>of</strong> habitat to facilitate comparison among stations. Samplers are usuallyplaced at equal intervals across a stream. However, species colonization is greatlyaffected by current velocity. When conducting a survey, care should be taken to placesubstrates at locations having similar flow characteristics. Three samplers are routinelyplaced at each sample site, although more samples may be necessary to satisfy particularstatistical criteria. When using brick-anchored samplers, additional rocks are <strong>of</strong>tennecessary to secure the sampler upright. Care should be taken not to block the plates withthe rocks and thus limit colonization. Sampling devices should be placed asinconspicuously as possible because they are prone to removal by the public. They shouldbe secured with strong nylon line (not attached to the anchor line itself). In deeper waters,suspended samplers should be placed within the euphotic zone (i.e., shallower depthswhere light penetrates) usually less than 2 meters.The samplers should be removed after a six-week colonization period. Gently remove thesampler from the water so as not to dislodge the organisms, and immediately place thesampler in a plastic tub or bucket. Anchors attached to the substrate should not be placedin the tub until any organisms on the anchor are removed and discarded. Add a smallamount <strong>of</strong> water to the tub and wash the easily removable material from the plates. Thengently scrape the top and bottom <strong>of</strong> each plate into the tub, removing the plates ascleaned. Scalpel, spatula or s<strong>of</strong>t toothbrushes are useful cleaning tools. Pour the sampleslurry through a US Standard No. 30 sieve. Additional water may be used to completelyclean the tub. Pass this through the sieve as previously described. Transfer the samplematerial from the sieve to the sample jars using forceps or a stream <strong>of</strong> water from a washbottle. Fill each jar no more than half full. Work directly over the tub so that any spilledmaterials can be recovered. Finally, inspect the tub for any remaining organisms andtransfer them to the sample jar(s). Water-resistant paper should be used for sample labelsand all information written with a s<strong>of</strong>t lead pencil. Include sample (log) number, waterbody, station, sample number, sample device, and other pertinent information.<strong>Ecological</strong> <strong>Evaluation</strong> <strong>Technical</strong> <strong>Guidance</strong> Document 119Version 1.2 8/29/12
Surber or Square-foot BottomThis sampler consists <strong>of</strong> a strong close-woven fabric (0.595-mm opening) approximately69-cm (27 in.) long held open by a one-square-foot metal frame hinged at one side toanother frame <strong>of</strong> equal size. The sampler is generally used in procuring samples in fastflowingstreams less than 1m deep. It can also be used in pools where the water depth iswadeable. Three replicate samples are usually obtained at each sampling station.Carefully place the sampler in position with the net opening facing upstream, using thecurrent to hold the net open while standing downstream and to the side <strong>of</strong> the samplingarea. By imbedding the separate two- or four-inch extensions <strong>of</strong> the horizontal frame, thesampled area will be more effectively isolated. When taking replicate samples, alwayswork across or in an upstream direction. Dislodge the rocks, stones, and other bottommaterial within the frame to a depth <strong>of</strong> at least 2 inches and collect them in the net.Remove the sampler and empty the contents into a plastic tub. Carefully inspect thelarger rocks and stones removing any organisms clinging to them, and discard the stoneswhen cleaned. Also carefully inspect the net and remove any organisms remaining. Afterthe larger materials have been inspected and removed, add a small amount <strong>of</strong> water to thetub and pour the slurry through an US Standard No. 30 sieve. This may have to berepeated several times to completely empty the tub.Grab SamplersThe Ponar, Peterson, and Ekman grab are the most commonly used grab samplers. ThePonar is similar to the Peterson except that it has side plates and a screened top to preventsampling loss. The Ekman grab is useful in sampling silt and muck in water with littlecurrent. Extreme care should be employed when locking open the jaws <strong>of</strong> the samplersbecause premature tripping will squash or sever fingers or hands. Handling by theattached line is recommended with an open sampler. Carefully lower the grab to thebottom so as not to agitate the substrate prior to sampling. Slacken the rope to trip jaws(the Ekman grab employs a messenger, which is released by the operator) and retrieve thesampler. Place it in a plastic tub or large screened bin and carefully open the samplerjaws to release the sample. The sample should be discarded if sticks or stones haveobstructed the jaws or if there is incomplete closure for any other reason. Inspect thelarger debris for organisms and discard the debris when cleaned. Filter the samplethrough a #30 sieve to remove small particles.Rapid BioassessmentBenthic rapid bioassessment procedures (RBPs) usually employ direct sampling <strong>of</strong>natural substrates, as do Surbers and grab samplers. Under certain conditions, however,such as in large rivers, the use <strong>of</strong> artificial substrates may be more appropriate for RBPanalysis. The collection procedure should provide representative samples <strong>of</strong> the benthicmacroinvertebrate fauna from comparable habitat (substrate) types at all stations in aparticular survey. Either single or multiple habitat samples can be employed dependingon which is more suitable for a particular survey. A riffle and run habitat with rocksubstrate will generally provide the most diverse community <strong>of</strong> major benthicmacroinvertebrate groups. If the stream or river is not wadeable or has an unstablesubstrate, fixed structures (e.g., submerged boulders, logs, bridges, and pilings) can<strong>Ecological</strong> <strong>Evaluation</strong> <strong>Technical</strong> <strong>Guidance</strong> Document 120Version 1.2 8/29/12
provide suitable habitat. D-framed or rectangular framed 500 – 900 mm mesh “kick” netscan be employed as either single or multiple habitat samplers.Single Habitat SamplingA 100-meter reach representative <strong>of</strong> the characteristics <strong>of</strong> the stream is chosen, andwhenever possible, upstream <strong>of</strong> road or bridge crossing. A composite sample is takenfrom individual sampling spots in the riffles and runs in the stream reach. A minimum <strong>of</strong>2m 2 composited area is sampled. Sampling begins at the downstream end <strong>of</strong> the reachand proceeds upstream. Two to three kicks are sampled at various velocities in the reach.A kick is a stationary sampling accomplished by positioning the net on the bottom <strong>of</strong> thestream and disturbing one square meter upstream <strong>of</strong> the net. The substrate can bedisturbed using the heel and toe <strong>of</strong> the boot or rubbed by hand for larger substrateparticles. Several kicks will make up the composite sample. Empty the composite sampleinto a sieve or sieve bucket and mix to ensure a homogeneous composite.Multi-habitat SamplingFor sampling low-gradient streams or streams with variable habitats, a multi-habitatsampling approach is required. A 100-meter reach representative <strong>of</strong> the characteristics <strong>of</strong>the stream is chosen, and whenever possible, upstream <strong>of</strong> road or bridge crossing.Sampling begins at the downstream end <strong>of</strong> the reach and proceeds upstream. Habitats aresampled in their approximate proportion to their representation <strong>of</strong> surface area in thereach. In low-gradient streams, snags, vegetated banks, submerged macrophytes, andgravel and sand are habitats that support fauna. A total <strong>of</strong> 20 jabs or kicks should besampled over the length <strong>of</strong> the reach. A kick is a stationary sampling accomplished bypositioning the net on the bottom <strong>of</strong> the stream and disturbing one square meter upstream<strong>of</strong> the net. The substrate can be disturbed using the heel and toe <strong>of</strong> the boot or rubbed byhand for larger substrate particles. A jab consists <strong>of</strong> forcefully thrusting the net into aproductive habitat for a linear distance <strong>of</strong> 0.5 meters. Then, sweep the area with a net toensure that benthic macroinvertebrates that have disengaged from the substrate arecollected. A minimum <strong>of</strong> two square meters <strong>of</strong> composited area is sampled. Empty thecomposite sample into a sieve or sieve bucket and mix to ensure a homogeneouscomposite.<strong>Ecological</strong> <strong>Evaluation</strong> <strong>Technical</strong> <strong>Guidance</strong> Document 121Version 1.2 8/29/12
Appendix H - Soil Toxicity TestingSoil Test SpeciesThe most commonly used invertebrate species for soil toxicity studies is the earthworm(Eisenia fetida). Other species mentioned in the ASTM guidance include the potworm(Enchytraeus albidus), and while use <strong>of</strong> potworms is appropriate, the earthworm canconstitute up to 92 percent <strong>of</strong> the invertebrate biomass in soil (ASTM, 2004) and is,therefore, a more important receptor. Additionally, the earthworm has been more widelyand commonly used by the USEPA. For these reasons, the earthworm is preferred.Most plant toxicity testing guidance is geared toward agricultural crops, and test methodswere developed for exposing crop plants to chemical products (e.g., pesticides). Thesemethods can also be used for testing the effects <strong>of</strong> site soils on more appropriate siterelatedspecies. The noncrop plants most commonly used for soil toxicity testing includeperennial ryegrass (Lolium perenne) and red clover (Trifolium pratense).Toxicity Test TypesThere is basically a single type <strong>of</strong> soil toxicity test: static, nonrenewal. Worms or plantseeds are added to the soil at test initiation and removed from the soil at test termination.However, earthworm biomass loading is dependent on the soil’s total organic carbon(TOC) content, and toxicity tests have been performed where worms have beentransferred to fresh site soil halfway through the study to avoid nutrition-related stress.Toxicity Test DurationSoil toxicity is generally assessed in the laboratory using acute or chronic studies. Acutesoil studies usually take 14 days (though earthworm screening assays may be shorter).Chronic studies are longer, usually 28 days or more (some exceeding 140 days), and aredesigned to determine sublethal effects on growth, emergence and reproduction. Whileobserved lethality is a direct indication that the sample in question is toxic, sublethaleffects are important for the assessment <strong>of</strong> long-term population health.The longer term, sublethal studies are not always appropriate for environmental soilsamples. They are very sensitive, and can yield false positives. Sensitive, sublethal testsare good for testing chemicals and wastewater solutions that can be diluted to differentconcentrations (e.g., 100%, 50%, 25%, 12.5% and 6.25%) at which a dose responsebecomes apparent. If a response not related to dose is observed (e.g., effect at 25%, butnot at 100%), the test is suspect. When testing soil samples, they are not diluted and aretested as 100 percent versus a lab control reference area sample. If there is a sublethaleffect, investigators may not be able to tell whether it is related to the sample or to theinherent variability <strong>of</strong> the biological system being tested.Variability is expected even in the laboratory's standard reference toxicant (SRT) studies.Labs perform regular SRT tests to assess the health <strong>of</strong> each batch <strong>of</strong> test organisms andthe procedures used by the technicians setting up the tests. The SRT studies are typicallyshort-term (96 hours or shorter), water-only tests that use a common reagent-grade salt(e.g., KCl). The USEPA (2000a) states that even though the final SRT result is allowedto fall within two standard deviations <strong>of</strong> the laboratory's historical mean, the laboratory isexpected to have up to 10 percent <strong>of</strong> SRT tests fall outside <strong>of</strong> that range. It is not untilthe lab has more than 10 percent SRT failures that a problem is noted. Because USEPA<strong>Ecological</strong> <strong>Evaluation</strong> <strong>Technical</strong> <strong>Guidance</strong> Document 122Version 1.2 8/29/12
expects that much variability in a short-term test with lab water and reagent salts, it iswithin reason to expect that long-term, sublethal effects from complex mixtures like sitesoil will yield substantially more variability.Toxicity Test DesignSoil toxicity studies are conducted by exposing a predetermined number <strong>of</strong> organisms(e.g., four replicates <strong>of</strong> ten organisms or seeds) to a soil sample. Organisms are placed inappropriate test chambers containing the soil sample, and in test chambers containingclean laboratory soil to serve as an experimental control. Investigators make directobservations <strong>of</strong> the exposed test setup at regular intervals for the duration <strong>of</strong> the test todetermine responses such as erratic behavior and visible mortality. However,earthworms quickly bury themselves in the test soil and are not seen again until testtermination when they are removed for final enumeration. Plants are not visible untilafter the seeds germinate and the plants begin to emerge after four to seven days.A second “reference” control should also be included in the study, using soil from outsidethe influence <strong>of</strong> the site. Use <strong>of</strong> an appropriate reference area soil is more representative<strong>of</strong> the actual field conditions. While a site soil may show a significant effect as comparedto the laboratory control, it may not show a significant effect when compared to thereference area.The laboratory control soil should be an “artificial” soil, as described in the ASTMguidance (ASTM, 2004, Appendix A2). While both the plant and invertebrate toxicitymethods allow for use <strong>of</strong> various artificial soil mixtures, potting soils or natural soils aslaboratory controls, the objective <strong>of</strong> the study is not to compare site soils to “optimum”soil samples. Comparing the growth and reproduction <strong>of</strong> worms or plants grown in sitesoils to those grown in a laboratory control composed <strong>of</strong> a rich, organic potting soil willalmost always show a significant decrease in site sample growth compared to the control,regardless <strong>of</strong> whether the site soil is toxic or not. For this reason, potting soil or any otherrich, organic soil is not appropriate for use as a laboratory control when testing site soilsamples.To perform statistical analyses to determine whether significant differences exist betweenthe laboratory controls or reference area samples, toxicity studies should be set up withmultiple replicates. As a general rule, more replicates equates to greater statistical powerand more confidence in the final results. Soil studies are typically performed with four toeight replicates <strong>of</strong> ten organisms or seeds for each test soil, which ensures sufficientstatistical power for the more sensitive sublethal growth endpoints.Toxicity Test EndpointsFor acute soil toxicity studies with earthworms, the endpoints can include survival andgrowth. While survival is a definitive endpoint, earthworm growth measurements can bemisleading because the worms are measured as wet weight at test initiation and again attest termination. Earthworms are depurated for 24 to 48 hours prior to weighing, to allowthem to purge their digestive tracts <strong>of</strong> soil. The earthworms used in toxicity testingshould all be approximately uniform in size, but because <strong>of</strong> the range <strong>of</strong> soil grain sizeand organic content, different soils will be depurated at different rates. This means thatthe worms in one soil may have completely purged their guts, while the worms from<strong>Ecological</strong> <strong>Evaluation</strong> <strong>Technical</strong> <strong>Guidance</strong> Document 123Version 1.2 8/29/12
another sample may still have a substantial amount <strong>of</strong> soil inside them. This source <strong>of</strong>variability can bias earthworm growth measurements and yield misleading results.If earthworm bioaccumulation is an endpoint <strong>of</strong> concern, investigators should ensure thata sufficient number <strong>of</strong> worms are exposed to the soil samples to yield sufficient tissuemass at test termination to meet analytical mass requirements for all <strong>of</strong> the desiredanalytical parameters. This may require larger test chambers with larger numbers <strong>of</strong>worms exposed for each replicate to retain the ability to perform statistical analyses onthe analytical results.For plant toxicity studies, endpoints can include germination, survival and growth.Germination is assessed by the number <strong>of</strong> plants that emerge from the soil surface.Survival is assessed as the number <strong>of</strong> emergent plants that survive the entire test period.Growth can be measured as shoot height, shoot weight, root length and root weight.Shoot height and weight are measured on the aboveground portion <strong>of</strong> the plant. Rootlength and weight are measured on the belowground portion <strong>of</strong> the plant.If plant bioaccumulation is an endpoint <strong>of</strong> concern, investigators should ensure that asufficient number <strong>of</strong> seeds are exposed to the soil samples to yield sufficient tissue massat test termination to meet analytical mass requirements for all <strong>of</strong> the desired analyticalparameters. This may require a longer test period to produce larger plants, larger testchambers or larger numbers <strong>of</strong> seeds exposed for each replicate to retain the ability toperform statistical analyses on the analytical results.Data <strong>Evaluation</strong>All statistical analyses are to be performed as specified in the USEPA and ASTMguidance documents. Data from site samples should be compared to the laboratorycontrols to determine whether observed toxic effects are statistically significant. Inaddition to the laboratory control, an appropriately selected field reference area soil mayyield results that are more representative <strong>of</strong> actual field conditions. A soil from a locationadjacent to a site may be an appropriate reference area for a site soil sample. If the <strong>of</strong>fsitereference area sample shows toxic effects, it is possible that at least a portion <strong>of</strong> anytoxic effects observed from the site sample are not related to the site.<strong>Ecological</strong> <strong>Evaluation</strong> <strong>Technical</strong> <strong>Guidance</strong> Document 124Version 1.2 8/29/12
Appendix I - Using the Toxic Equivalency (TEQ) Approach to Evaluate Dioxin,Furan, and Dioxin-like PCB ResultsAnalytical MethodsLaboratories performing dioxin analysis must be certified by NJDEP for either USEPASW846 Method 8290 or USEPA Method 1613B (N.J.A.C. 7:26E-2.1(a)1) (USEPA1994b and 1994c). Laboratories performing PCB congener analysis must be certified byNJDEP for USEPA Method 1668A/B (USEPA 1999c). Full laboratory deliverables arerequired per N.J.A.C. 7:26E 2.1(a)15i.If a phased approach to sampling is used, samples from outside the source area may bestored at the laboratory until source area results are reviewed. Samples for dioxinanalysis in soil, sediment, wipe, and chip samples may be archived at the laboratory forup to one year to extraction, followed by one year to analysis. Stored nonaqueoussamples are to be kept in the dark at or below -10 o C. Stored aqueous samples are to bekept in the dark at zero to four degrees C. Sample extracts from both may be stored inthe dark, below -10 o C for one year.TEQ ApproachAs described in 6.4.7, 17 dioxin and furan congeners and 12 dioxin-like PCBs producesimilar biological effects with varying potencies and generally act together in an additivefashion. To facilitate the assessment <strong>of</strong> the most toxic components <strong>of</strong> these complexmixtures, the 29 dioxin-like congener concentrations from biotic and abiotic media aremultiplied by internationally recognized toxic equivalency factors (TEFs), which areorder <strong>of</strong> magnitude estimates <strong>of</strong> the toxicity <strong>of</strong> the individual congeners relative to2,3,7,8-TCDD that have been developed by the World Health Organization (WHO);2,3,7,8 - TCDD is assigned a TEF <strong>of</strong> 1. The resulting concentrations are summed todetermine the TEQ concentration. Each <strong>of</strong> the 29 designated dioxin-like compounds hasbeen assigned a fish, avian, and mammalian TEF (Van den Berg et al., 1998, 2006;www.who.int/ipcs/assessment/tef_update/en/print.html). Only the 2,3,7,8-substitutedPCDDs and PCDFs are factored into the summation for the sample TEQ (i.e., those listedby the laboratory as “other dioxins,” per congener category, are not included in the TEQ).<strong>Evaluation</strong> <strong>of</strong> Dioxins, Furans, and Dioxin-like PCBs for initial screening in the<strong>Ecological</strong> <strong>Evaluation</strong>In the ecological evaluation (EE), the TEQ approach is used to initially characterize,screen, and present dioxin, furan, and dioxin-like PCB data by using TEFs for onereceptor class for a consistent and streamlined evaluation. The application <strong>of</strong> the avianTEFs to dioxin, furan, and dioxin-like PCB concentrations in abiotic media (soil,sediment, surface water) is recommended. The reasons for selecting the avian TEFs areas follows: Among the avian, mammalian, and fish TEFs, the avian and mammalianTEFs are generally similar and more conservative than the fish TEFs. Between the avianand mammalian TEFs, while the TEFs for PCB 126 (a highly toxic WHO PCB congener)are identical, the avian TEF for PCB 77 is higher than the mammalian, resulting in amore conservative TEC for PCB 77. It is appropriate to focus on PCB 77 in thescreening process since it is detected in media samples at greater frequency and at higherconcentrations than PCB 126. Therefore, using avian TEF scheme is the most<strong>Ecological</strong> <strong>Evaluation</strong> <strong>Technical</strong> <strong>Guidance</strong> Document 125Version 1.2 8/29/12
conservative approach from an ecological screening perspective. See Table I-1 for asummary <strong>of</strong> avian TEFs.Table I-1: Summary <strong>of</strong> WHO Avian TEF Values (Van den Berg et al., 1998)CompoundAvian TEFChlorinated dibenzo-p-dioxins2,3,7,8-TCDD 11,2,3,7,8-PeCDD 11,2,3,4,7,8-HxCDD 0.051,2,3,6,7,8-HxCDD 0.011,2,3,7,8,9-HxCDD 0.11,2,34,6,7,8-HpCDD < 0.001OCDD 0.0001Chlorinated dibenz<strong>of</strong>urans2,3,7,8-TCDF 11,2,3,7,8-PeCDF 0.12,3,4,7,8-PeCDF 11,2,3,4,7,8-HxCDF 0.11,2,3,6,7,8-HxCDF 0.11,2,3,7,8,9-HxCDF 0.12,3,4,6,7,8-HxCDF 0.11,2,3,4,6,7,8-HpCDF 0.011,2,3,4,7,8,9-HpCDF 0.01OCDF 0.0001Non-ortho-substituted PCBs3,3’,4,4’-tetraCB (PCB 77) 0.053,4,4’,5-tetraCB (PCB 81) 0.13,3’4,4’,5-pentaCB (PCB 126) 0.13,3’4,4’,5,5’-hexaCB (PCB 169) 0.001Mono-ortho-substituted PCBs2,3,3’4,4’-pentaCB (PCB105) 0.00012,3,4,4’,5-pentaCB (PCB 114) 0.00012,3’4,4’5-pentaCB (PCB118) 0.000012’,3,4,4’,5-pentaCB (PCB 123) 0.000012,3,3’,4,4’,5-hexaCB(PCB 156) 0.00012,3,3’,4,4’5’-hexaCB (PCB 157) 0.00012,3’4,4’5,5’-hexaCB (PCB 167) 0.000012,3,3’4,4’,5,5’-heptaCB (PCB 189) 0.00001TEQs for the three contaminant classes, PCDDs, PCDFs, and PCBs, are generated usingthe avian TEFs for each sample to afford evaluation <strong>of</strong> the relative contribution fromthese classes. The individual congener concentration multiplied by the TEF is the<strong>Ecological</strong> <strong>Evaluation</strong> <strong>Technical</strong> <strong>Guidance</strong> Document 126Version 1.2 8/29/12
Toxicity Equivalence Concentration (TEC). The sum <strong>of</strong> all the TECs is referred to as thetotal, or ∑, TEQ. See Figure I-1: “Example Determination <strong>of</strong> 2,3,7,8-TCDD Equivalents(TEQs).”Contaminant Concentration Avian TEF TEC(ppt)Chlorinated dibenzo-p-dioxins2,3,7,8-TCDD 13.5 1 13.51,2,3,6,7,8-HxCDD 7.9 0.01 0.079PCDD TEQ = ∑ PCDD TECs = 13.5 + 0.079 = 13.58Chlorinated dibenz<strong>of</strong>urans2,3,4,7,8-PeCDF 16.2 1 16.21,2,3,4,7,8-HxCDF 0.5 0.1 .05OCDF 21.7 0.0001 0.00217PCDF TEQ = ∑PCDF TECs = 16.2 + 0.05 + 0.00217 = 16.25Non-ortho-substituted PCBs3,3’4,4’,5-pentaCB (PCB 126) 682 0.1 68.23,3’4,4’,5,5’-hexaCB (PCB 169) 524 0.001 0.524PCB TEQ = ∑ PCB TECs = 68.2 + 0.524 = 68.72∑ TEQ = ∑ PCDD TEQ + ∑PCDF TEQ+ ∑ PCB TEQ = 13.58 + 16.25 + 68.73 = 98.56Figure I-1. Example Determination <strong>of</strong> 2,3,7,8-TCDD Equivalents (TEQs)Two approaches can be used for the handling <strong>of</strong> nondetect data: assume nondetects aszero or nondetects as 1/2 the reported detection limit. For situations in which the primarycontaminant is 2,3,7,8-TCDD and good detection limits are achieved for all congeners(generally less than 10 ppt), using either procedure usually results in similar outcomes forthe calculated sample-specific TEQ. However, if elevated detection limits are reportedfor many <strong>of</strong> the congeners, it is recommended that non-detects are factored in at 1/2 thereported detection limit (adjusted based on TEF) given the uncertainty because <strong>of</strong> theelevated detection limit.TEQ <strong>Evaluation</strong>The individual 2,3,7,8-TCDD concentration, each <strong>of</strong> the three class-specific TEQs, andthe ∑ (total) TEQ are compared with ecological screening criterion for 2,3,7,8-TCDD asper Section 5.4. The resultant HQs are carried through the EE process.<strong>Ecological</strong> <strong>Evaluation</strong> <strong>Technical</strong> <strong>Guidance</strong> Document 127Version 1.2 8/29/12
Data PresentationTabular presentations in the EE report should include raw sample concentrations for the17 dioxins and furans and 12 dioxin-like PCB congeners, sample-specific quantitationlimits, avian TEFs, TECs, TEQs for each <strong>of</strong> the three contaminant classes (e.g., PCDDs,PCDFs, and dioxin-like PCBs), and the total TEQ.<strong>Evaluation</strong> <strong>of</strong> Dioxins, Furans, and Dioxin-like PCBs in the <strong>Ecological</strong> RiskAssessmentThe investigator is referred to USEPA 1993b and USEPA 2008b regarding ecologicalrisk characterization approaches and the application <strong>of</strong> the TEQ process to tissueconcentrations and food chain modeling.<strong>Ecological</strong> <strong>Evaluation</strong> <strong>Technical</strong> <strong>Guidance</strong> Document 128Version 1.2 8/29/12