Demonstrating Excellence Report - Constructing Excellence
Demonstrating Excellence Report - Constructing Excellence
Demonstrating Excellence Report - Constructing Excellence
- No tags were found...

You also want an ePaper? Increase the reach of your titles
YUMPU automatically turns print PDFs into web optimized ePapers that Google loves.
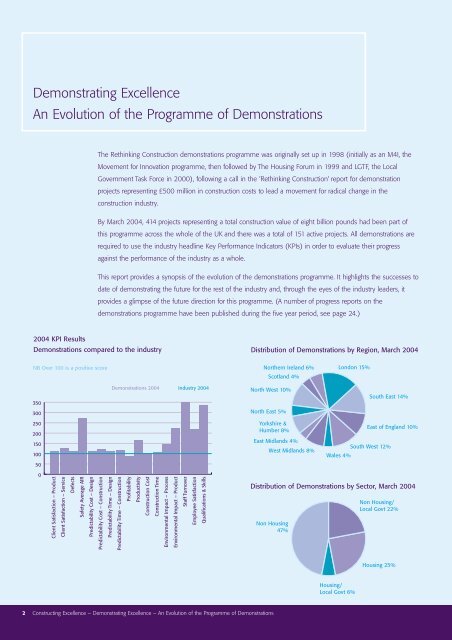
<strong>Demonstrating</strong> <strong>Excellence</strong>An Evolution of the Programme of DemonstrationsThe Rethinking Construction demonstrations programme was originally set up in 1998 (initially as an M4I, theMovement for Innovation programme, then followed by The Housing Forum in 1999 and LGTF, the LocalGovernment Task Force in 2000), following a call in the ‘Rethinking Construction‘ report for demonstrationprojects representing £500 million in construction costs to lead a movement for radical change in theconstruction industry.By March 2004, 414 projects representing a total construction value of eight billion pounds had been part ofthis programme across the whole of the UK and there was a total of 151 active projects. All demonstrations arerequired to use the industry headline Key Performance Indicators (KPIs) in order to evaluate their progressagainst the performance of the industry as a whole.This report provides a synopsis of the evolution of the demonstrations programme. It highlights the successes todate of demonstrating the future for the rest of the industry and, through the eyes of the industry leaders, itprovides a glimpse of the future direction for this programme. (A number of progress reports on thedemonstrations programme have been published during the five year period, see page 24.)2004 KPI ResultsDemonstrations compared to the industryDistribution of Demonstrations by Region, March 2004NB Over 100 is a positive scoreNorthern Ireland 6%Scotland 4%London 15%350300Demonstrations 2004 Industry 2004North West 10%North East 5%South East 14%250200150100Yorkshire &Humber 8%East Midlands 4%West Midlands 8%East of England 10%South West 12%Wales 4%500Client Satisfaction – ProductClient Satisfaction – ServiceDefectsSafety Average AIRPredictability Cost – DesignPredictability Cost – ConstructionPredictability Time – DesignPredictability Time – ConstructionProfitabilityProductivityConstruction CostConstruction TimeEnvironmental Impact – ProcessEnvironmental Impact – ProductStaff TurnoverEmployee SatisfactionQualifications & SkillsDistribution of Demonstrations by Sector, March 2004Non Housing47%Non Housing/Local Govt 22%Housing 25%Housing/Local Govt 6%2 <strong>Constructing</strong> <strong>Excellence</strong> – <strong>Demonstrating</strong> <strong>Excellence</strong> – An Evolution of the Programme of Demonstrations