Download - Constructing Excellence
Download - Constructing Excellence
Download - Constructing Excellence
- No tags were found...

You also want an ePaper? Increase the reach of your titles
YUMPU automatically turns print PDFs into web optimized ePapers that Google loves.
UK Construction IndustryKey Performance IndicatorsHandbookIn Partnership with2006Based on Projects Completed in 2005
UK CONSTRUCTION INDUSTRY KPIsHANDBOOKPage NoIntroduction to KPIs2 The Purpose of the KPIs2 Terminology2 The KPI Data3 Using KPIs3 Best Practice Guide & Case Studies4 The KPI Hierarchy5 Headline Performance Indicators8 Specialist Key Performance Indicators8 KPI Pack9 Housing KPI Toolkit9 Benchmarking Clubs9 KPIs and the Clients’ Charter10 KPI Report for the Minister for Construction10 KPIZoneThe 7 Steps to Implementing KPIs11 The 7 Steps to Implementing KPIs12 Step 1: Decide What to Measure13 Step 2: Collect Data15 Step 3: Calculate KPIs17 Step 4: Report the Results18 Step 5: Analyse the Results19 Step 6: Take Action19 Step 7: Measure AgainFurther Help and Information20 Determining Project Tender Price Indices and Adjustments21 Industry Average Performance22 Data Sources23 Safety: Conversion from AIR to AFR23 Safety: Calculation of Project Performance24 Profitability: Calculation of Project Performance24 Productivity: Calculation of Project Performance25 <strong>Constructing</strong> <strong>Excellence</strong>2006 UK KPIs - Handbook
USING KPIsA note of cautionThe KPIs are produced from the best data available at the time of publication. Users should ensurethat they are comparing themselves against appropriate performance indicators. The KPIs should beused in conjunction with this Handbook and the appropriate Methods of Measurement. They mustbe used as an aid to, not a substitute for, professional judgment.The main ways that KPIs are used in the industry are:To benchmark the performance of a specific project or company.To provide a measurement framework for partnering and framework contracts.To provide evidence of value for money in procurement.To meet the requirements of the Housing Corporation and Clients’ Charter.To provide measures other than price to support procurement decisions.As a marketing tool.To meet the requirements of ISO 9001 quality management systems.To provide a health check as part of a continuous improvement programme.BEST PRACTICE GUIDE & CASE STUDIESEvidence collected by <strong>Constructing</strong> <strong>Excellence</strong> from ‘best practice’ companies shows thatmeasurement and benchmarking can yield benefit to companies by shining a spotlight on theirperformance and showing where action is needed to improve. However, to be of value, themeasurement system needs to be founded on the correct principles. The KPIs and BenchmarkingBest Practice Guide contained in the KPI Pack and the Housing Toolkit describes nine elements ofbest practice that were seen commonly in the Best Practice Companies:Belief in measurement – there must be real commitment to using measurement as a tool for improvement.Start simple – start with a few KPIs and add more later.Measure what’s important – stay focused on critical issues.Communicate effectively – let the data speak – display results so they show performance and trends easily.Clear responsibility, no bureaucracy – use a well designed, straightforward data collection system.Use appropriate technology – IT is excellent when you know what KPIs you want.Become a data-based decision maker – use the data to guide improvement.Action, not data, drives performance improvement – it’s only when action is taken that KPIs add value.KPIs and partnering go together – partnering provides the right environment for KPIs to work.2006 UK KPIs - Handbook 3
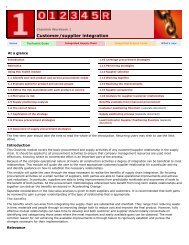
The KPIs and Benchmarking Best Practice Guide addresses the question, “Does using KPIs make youmore profitable?” and concludes that performance measurement only leads to improved profitability ifit forms part of a successfully implemented wider strategy.In addition to the Guide, case studies of individual companies are included in the KPI Pack and theHousing Toolkit; as more case studies are carried out they will be published on the <strong>Constructing</strong><strong>Excellence</strong> website 3 .THE KPI HIERARCHYThe publication of the first set of UK Construction Industry KPIs in 1999 was followed by the Respectfor People KPIs in 2002 and the Environment KPIs in 2003. In addition, there has been a gradualdevelopment as the major sectors of the construction industry published KPIs specific to their area ofactivity. The main sets of performance indicators are summarised in the KPI Hierarchy (see Figure 1).The principles of benchmarking contained in this Handbook apply to all of these KPI sets, but caremust be taken that the correct definitions and methods of calculating performance are used.Further details of all KPIs and Benchmarking Clubs are available on www.kpizone.comHEADLINE KPIs(All Construction)Respect forPeople(Social)+ Economic +EnvironmentNew BuildNon-HousingR&M & Refurb+ +Non-HousingInfrastructureSECTOR KPIS(Economic)New BuildHousingR&M & Refurb+ +HousingRepairs & VoidsHousingSPECIALIST KPISM&EContractors+ Consultants +ConstructionProductsECONOMIC KPISFigure 1: The KPI Hierarchy3 www.constructingexcellence.org.uk42006 UK KPIs - Handbook
HEADLINE PERFORMANCE INDICATORSEconomic Key Performance IndicatorsThese KPIs measure predominantly economic issues at project and company level.Project performance:Client Satisfaction -Product Predictability -Cost Construction CostClient Satisfaction -Service Predictability -Time Construction TimeDefectsCompany performance:Profitability Productivity SafetyThe Economic KPIs are arranged as a ‘family tree.’ At the highest or headline level, the EconomicWallchart includes data from all the major construction industry sectors, excluding constructionproducts’ suppliers. The data is sub-divided into sector-specific charts that are published in theAdditional Performance Indicators book as shown in Figure 2. The New Build (Housing) and Repair &Maintenance and Refurbishment (Housing) data is published as wallcharts in the Housing KPI Toolkit.EconomicNew Build(Housing)New Build(Non-Housing)InfrastructureRepair &Maintenance andRefurbishment(Housing)Repair &Maintenanceand Refurbishment(Non-Housing)Figure 2: Family Tree of Economic KPI chartsRespect for People Key Performance IndicatorsThe Respect for People Key Performance Indicators (RfP KPIs) measure issues of importance to firmswishing to excel in people management.The Respect for People KPIs presented on the wallchart are:Employee Satisfaction Working Hours PayStaff Turnover Qualifications & Skills Investors in PeopleSickness AbsenceSafetyEquality & DiversityTraining2006 UK KPIs - Handbook 5
To support the Respect for People KPIs, <strong>Constructing</strong> <strong>Excellence</strong> publishes a suite of toolkits to providemore detailed evaluation and improvement in the following six areas:Equality & DiversityHealth & SafetyThe Working EnvironmentWorkforce Satisfaction (with employment conditions and the physical working environment)TrainingWork in Occupied PremisesFurther details of the Respect for People Toolkits are available from the <strong>Constructing</strong> <strong>Excellence</strong>Helpdesk 0845 605 55 56 or on www.constructingexcellence.org.ukEnvironment Key Performance IndicatorsThe Environment Key Performance Indicators provide the UK construction industry and its clients withan established method of measuring its performance in critical environmental issues. The EnvironmentKPIs have been designed to help organisations measure and benchmark their project performance inthe most important challenge facing the construction industry: to produce more environmentallyfriendlyfacilities using processes that protect the existing environment, biodiversity and habitat.The Environment KPIs presented on the wallcharts are:Impact on the Environment -Product-Construction ProcessEnergy Use (Designed) -ProductEnergy Use -Construction ProcessMains Water Use (Designed) -ProductMains Water Use -Construction ProcessWaste -Construction ProcessCommercial Vehicle Movements -Construction ProcessImpact on Biodiversity -Product-Construction ProcessArea of Habitat Created/Retained -ProductWhole Life Performance -Product62006 UK KPIs - Handbook
Reducing the impact of construction on the environment is increasingly important for the industry.The development and regular publication of Environment Key Performance Indicators againstwhich the industry can measure its performance has been important for the process of change.As well as looking at some of the broader concepts of overall environmental impact, theindicators follow the key themes developed by the Movement for Innovation Sustainability WorkingGroup 4 : Energy, Water, Waste, Transport and Biodiversity. To these has been added an indicator forWhole Life Performance.Using the Environment KPIs to benchmark and improve performance provides both economic andenvironmental benefits. The economic benefits come through the efficient use of energy andtransport, which can lead to significant cost savings and a reduction of company’s overhead cost.Environmental benefits include increased energy efficiency, which reduces fossil fuel depletion andreduces CO 2 and other emissions that cause global warming, acidification and air pollution. There isalso a reduction of waste going to landfill, as well as ecological benefits that promote the protectionof habitat and species4 Environmental Performance Indicators for Sustainable Construction, Rethinking Construction, Movement for InnovationSustainability Working Group Report, July 2001.2006 UK KPIs - Handbook 7
SPECIALIST KEY PERFORMANCE INDICATORSConstruction Consultants KPIsKPIs for Construction Consultants are produced jointly by the Association for Consulting andEngineering, the Royal Institute of British Architects, Royal Institution of Chartered Surveyors, theChartered Institute of Building, the Chartered Institution of Building Services Engineers, the CharteredInstitute of Architectural Technologists, <strong>Constructing</strong> <strong>Excellence</strong> and the Department of Trade andIndustry. A copy of the Construction Consultants KPI Wallchart is included in the KPI Pack andHousing KPI Toolkit. Further information is available from the project partners and <strong>Constructing</strong><strong>Excellence</strong>. A handbook is available on www.kpizone.comMechanical and Electrical Contractors KPIsKPIs for Mechanical and Electrical Contractors were developed and published by Building ServicesResearch and Information Association with the support of <strong>Constructing</strong> <strong>Excellence</strong> and theDepartment of Trade and Industry. A copy of the M&E Contractors KPI Wallchart is included in the KPIPack and Housing KPI Toolkit. Further information is available from BSRIA, Old Bracknell Lane West,Bracknell, Berks. RG12 7AH. Tel: 0845 606 5704, or kpi@bsria.co.uk. A handbook is available onwww.bsria.co.uk/goto/kpiConstruction Products KPIsKPIs for the construction products industry were developed and published by the ConstructionProducts Association with the support of <strong>Constructing</strong> <strong>Excellence</strong> and the Department of Trade andIndustry. A copy of the Construction Products KPI Wallchart is included in the KPI Pack and HousingKPI Toolkit. Further information is available from the Construction Products Association, 26 Store Street,London WC1E 7BT. Tel: 020 7323 3770. A KPI Handbook is available on www.constprod.org.ukKPI PACKThe KPI Pack is a comprehensive source of information to aid in the effective use of the ConstructionIndustry Key Performance Indicators, and contains all the information needed to measure andbenchmark performance against the rest of the UK construction industry.The KPI Pack contains:KPI Wallcharts for the Economic, Respect for People and EnvironmentMethods of Measurement for the Economic, Respect for People and Environment KPIsProgress Dashboard Wallcharts for Economic, Respect for People and Environment KPIsConsultants, M&E Contractors and Construction Products KPI WallchartsAdditional Performance IndicatorsIndustry Progress ReportCase studiesBest Practice GuideFurther information on the KPI Pack is available from <strong>Constructing</strong> <strong>Excellence</strong> HelpdeskTel: 0845 605 55 56, or on www.kpizone.com82006 UK KPIs - Handbook
HOUSING KPI TOOLKITThe Housing KPI Toolkit provides performance measures relevant to the housing sector covering:New Build HousingHousing Refurbishment and Planned MaintenanceHousing RepairsHousing VoidsThe Housing KPI Toolkit contains:Economic KPI Wallcharts for New Build Housing and Housing Repair & Maintenanceand RefurbishmentEconomic KPIs Methods of Measurement for New Build, Refurbishment andPlanned Works, Repairs and VoidsProgress Dashboard Wallcharts for New Build Housing and Housing Repair & Maintenanceand RefurbishmentRespect for People and Environment KPI WallchartsRespect for People and Environment KPI Methods of MeasurementConsultants, M&E Contractors and Construction Products KPI WallchartsAdditional Performance Indicators BookIndustry Progress ReportCase StudiesBest Practice GuideFurther information on the Housing KPI Toolkit is available from the <strong>Constructing</strong> <strong>Excellence</strong> HelpdeskTel: 0845 605 55 56, or on www.kpizone.comBENCHMARKING CLUBSBenchmarking Clubs are groups of organisations from similar backgrounds that gather and comparedata related to their specialist area. They measure performance in a consistent manner in order toproduce a viable database of benchmark data to help their members achieve best practice.Information on Benchmarking Clubs is available on www.kpizone.comKPIs AND THE CLIENTS’ CHARTERThe aim of the Clients’ Charter 5 is to improve the performance of the construction supply chain, theclients’ own organisations, and the end product in use.Organisations subscribing to the Clients’ Charter must meet its requirements which include:The establishment of a continuous improvement culture.Acceptance of the need for measurement.Setting high standards for health, safety and respect for people.Annual reporting of performance and demonstration of continuous improvement.Raising the industry's performance to improve national and international competitiveness.Clients aiming to meet these requirements will need to adopt systematic performance measurement.5 See www.clientsuccess.org.uk2006 UK KPIs - Handbook 9
KPI REPORT FOR THE MINISTER FORCONSTRUCTIONIn January 2000, the Government published the KPI Report for the Minister for Construction whichgives useful guidance on secondary performance indicators that may be needed to support andanalyse the Headline KPIs. The report provides a framework for establishing a comprehensivemeasurement system within an organisation, and provides common definitions that allow organisationsto compare their performance. This report can be found on the <strong>Constructing</strong> <strong>Excellence</strong> website atwww.kpizone.comKPIZoneKPIZone provides up to date information on KPIs and benchmarking and can be found atwww.kpizone.com . There are two levels of service: the free service provides general advice andguidance, while the subscription service allows users to download graph images and the documentscontained in the KPI Pack and Housing KPI Toolkit102006 UK KPIs - Handbook
THE 7 STEPS TO IMPLEMENTING KPISThere are 7 basic steps to the successful use of KPIs (see Figure 4). Following the 7 stepprocess will help determine which KPIs to use, how to collect and manage the information,and how to report the results.The 7 steps can be applied to any of the sets of Headline or Sector KPIs, but care must betaken to use the correct definitions and methods of measurement.7 STEPSMeasure AgainDecide What to MeasureTake ActionAnalyse the Results6 7 1 25 4 3Calculate KPIsCollect DataReportthe ResultsFigure 4: The 7 Steps to implementing KPIs2006 UK KPIs - Handbook 11
STEP 1: DECIDE WHAT TO MEASUREThe vital first step is to determine what to measure.The two golden rules are:Measure what's important to YOUR ORGANISATIONMeasure what's important to YOUR CUSTOMERSIn the early stages there is a tendency to try to measure too many KPIs which results in confusion.Identify those that are critical, and start with them. The table below can be used to decide which ofthe Headline KPIs to start measuring 6 . Read the descriptions in the Methods of Measurement bookscontained in the KPI Pack and the Housing KPI Toolkit, and tick the boxes to indicate which onesneed to be measured.Economic KPIsTick if neededRfP KPIsTick if neededEnvironment KPIsTick if neededClient Satisfaction-ProductEmployee SatisfactionImpact on theEnvironmentResident Satisfaction-Product (Housing only)Staff TurnoverEnergy Use (Designed)-ProductClient Satisfaction-ServiceSickness/AbsenceEnergy Use-Construction ProcessResident Satisfaction-Service (Housing only)SafetyMains Water Use(Designed) -ProductDefectsWorking HoursMains Water Use-Construction ProcessPredictability -CostQualifications & SkillsWastePredictability -TimeEquality & DiversityCommercial VehicleMovementsSafetyTrainingImpact onBiodiversityProductivityPayArea of HabitatCreated/RetainedProfitabilityInvestors in PeopleWhole LifePerformanceConstruction CostConstruction Time6 Additional KPIs and SPIs are available - refer to the appropriate Methods of Measurement for a complete list.122006 UK KPIs - Handbook
STEP 2: COLLECT DATANormally, data will have to be collected from two sources - existing records and new surveys. Theresponsibility for providing data for the KPIs rests with both clients and suppliers. A supplier willnormally be able to provide information on all company and some project KPIs, but will have to goto the client to get data on KPIs such as client satisfaction, defects, impact on the environment,biodiversity and whole life performance. On the other hand, a client will know results for satisfactionand defects, impact on the environment, biodiversity and whole life performance but will have toobtain information from suppliers on all company and some project measures.A basic data collection form is included on the CD and forms which can be copied are includedin the Appendices to the Methods of Measurement contained in the KPI Pack and the HousingKPI Toolkit.Remember:Keep data collected from different companies/projects separate.Record honestly. Some problems may be outside your direct control, but if the problemcannot be identified, it cannot be solved!Collect comments with the data. For example, if a client provides a low score for satisfaction,record the reason why.Maintain a simple audit trail - you may be asked to show where your data came from.2006 UK KPIs - Handbook 13
The Key Project StagesSome of the KPIs have specific stages at which project data is collected. These stages are describedbelow and shown diagrammatically (see Figure 5).A Commit to InvestThe point at which the client decides to invest in a project for an agreed budget, sets out thebusiness requirements in a clients’ brief and appoints and authorises the project team to completethe design. Early cost advice, feasibility studies, outline planning permission, planning appeals,land bank appraisals, etc, would normally be carried out before Point A was reached. At Point A, theclient will normally know the contracted cost/time for the design process and the estimated cost andtime for the construction process and will be committed to paying for the completed design.B Commit to ConstructThe point at which the client authorises the project team to start the construction of the projectand has made the site available to the constructor. The timing of Point B can depend upon the type ofprocurement method employed. The design will not necessarily be complete at Point B. At Point B, theclient will normally know the final time for the design process, the contracted cost for the design processand the contracted cost and time for the construction process and will be committed to paying for thecompleted design and the completed product.C Available for UseThe point at which the product is available for substantial occupancy or use. Point C may be inadvance of contract completion, for example where ancillary work (e.g. landscaping) is completedafter the product has been put to use. At Point C, the product will be available for the client to use.The client will normally know the final cost and time for the design and construction processes andthe client will be committed to paying the final accounts for the completed design and thecompleted product.ACommit toInvestBCommit toConstructCAvailablefor UseDesignConstructionClientSanctionStarton SiteConstructionCompletionFigure 5: Key project stages142006 UK KPIs - Handbook
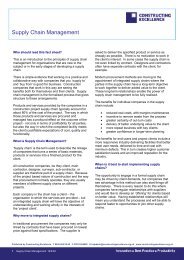
STEP 3: CALCULATE KPIsDeciding What to Benchmark AgainstBefore you can calculate your KPIs, you need to decide what you are going to compare your resultsagainst. Where UK data is available, it is published in the KPI wallcharts contained in the KPI Pack andthe Housing KPI Toolkit, and from these you can measure your benchmark score. However, where nonational data is available, you will need to set your own targets. Collect the data first and then setrealistic targets based on improving your current performance.The data collection forms included in the appendices to the Methods of Measurement contained inthe KPI Pack and the Housing KPI Toolkit give the formulae needed to calculate your performance.For most KPIs this is quite straightforward and can be carried out manually. To assist calculation ofyour benchmark scores, the KPI Dashboard and a KPI Calculator are included on the CD and areavailable on www.kpizone.com .Measuring the Project or Company Benchmark ScoreOnce you have measured your performance, you need to compare it with the industry data to findout your benchmark score. Having selected the appropriate KPI graph (e.g. Profitability from theEconomic KPIs), follow these steps with reference to the illustration below (see Figure 6):1 Plot your measured performance on the vertical axis.2 Read across to the performance line.3 Read down to the horizontal axis. This is the benchmark score out of 100%.+30%ProfitabilityPerformanceProfitability (before tax and interest)Higher ProfitabilityLower Profitability+20%+10%0%-10%-20%1 23-30%0% 10% 20% 30% 40% 50% 60% 70% 80% 90% 100%Benchmark ScoreFigure 6: Example of the calculation of a benchmark scoreIn this example, a company wishes to benchmark its pre-tax profitability. Its performance (a pre-taxprofit of 10%) equates to a benchmark score of 63%. This means that 63% of companies haveachieved equal or lower profitability, and the remaining 37% have achieved higher profitability thanthe example company.2006 UK KPIs - Handbook 15
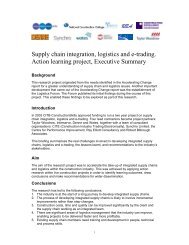
Dealing with ‘Flat’ Sections on GraphsA number of KPI graphs have sections where the performance line runs horizontally. This is becausethe underlying data set contains a relatively large number of results of the same value.To achieve a correct benchmark score in these cases, follow these steps with reference to theillustration below (see Figure 7):1 Plot the measured benchmark score on the vertical axis (1).2 Read across to the graph line (2).3 If the graph line is intersected at a ‘flat’ zone, follow the graph line to the lastpoint of contact at the end of the flat section (3).4 Read down to the horizontal axis (4). This is the company/project benchmarkscore out of 100%.PerformanceChange between estimated and actual costCost DecreaseCost Increase-30%-20%-10%0%+10%+20%Predictability - CostDesign costConstruction cost1 2 3+30%0% 10% 20% 30% 40% 50% 60% 70% 80% 90% 100%Benchmark ScoreFigure 7: KPI graph - reading a graph with flat sections4In the example (see Figure 7) a company wishes to benchmark its predictability of cost of design.It has delivered on cost, achieving a performance of 0% which equates to a benchmark score of76%. This means that 76% of projects performed equal to or worse than the example (i.e. theywere on or above cost), and 24% achieved a better performance than the example (i.e. theywere below the estimated cost).162006 UK KPIs - Handbook
STEP 4: REPORT THE RESULTSNow you have your benchmark scores, you need to let someone know about them!A convenient way to do this is to plot them on the radar chart contained on each wallchart.The radar chart gives a rapid picture of the organisation’s overall benchmark performance. In order tocomplete the radar chart, take the benchmark scores for each KPI, plot each result on the appropriateaxis of the radar chart, and join with a line (see Figure 8). In general, the nearer the plotted line is tothe outer perimeter of the radar chart, the higher the overall performance.The benchmark score for Profitability of 63%, from the previous example (see Figure 6), has beenplotted on the radar chart for the Economic KPIs along with the other company and projectbenchmark scores.Client Satisfaction- ProductClient Satisfaction100%Construction Time- Service80%60%Construction Cost40%20%0DefectsSafetyProductivity020%40%60%80%100%ProfitabilityPredictability- TimePredictability- CostThe software tools mentioned in Step 3 will produce a radar chart, or it is straightforward to makeyour own using standard spreadsheet software.The radar chart is good for presenting the results of a single set of KPIs, but is limited if many datasets are being analysed. Simple bar charts or line graphs of performance are better for reporting theresults of individual KPIs over time (see examples in Figures 9 and 10).Client Satisfaction - Benchmark ScoreBenchmark Score100%90%80%70%60%50%40%30%20%10%0%Project 1 Project 2 Project 3 Project 4 Project 5 Project 6 Project 7 Project 8Figure 9: Example of bar graph showing trends in client satisfaction ratings over successive projects2006 UK KPIs - Handbook 17
Client Satisfaction - Benchmark Score100%90%80%Benchmark Score70%60%50%40%30%20%10%Jan Feb Mar April May June July AugFigure 10: Example of a line graph showing trends in client satisfaction over timeTo avoid confusion, make it clear exactly what the results refer to (e.g. an individual project, severalprojects, or the average for your organisation over the past 12 months).The CD in the KPI Pack and the Housing KPI Toolkit contains a KPI Dashboard that provides a simplevisual display of current performance and benchmark scores. Images can be copied into reports oronto charts which can be displayed on, for example, site office walls. The KPI Dashboard isaccompanied by a proforma Dashboard Wallchart that allows organisations to record theirperformance and benchmark scores and plot changes over time (for example during the life of aproject, or at intervals during the year).Don't forget to send your data to a benchmarking club if you belong to one. Details of benchmarkingclubs are available on www.kpizone.comAveraging PerformanceOrganisations may wish to calculate their average company performance using data gathered fromindividual projects. The correct way to do this is to calculate the benchmark score for each projectseparately, then average the benchmark score. For example, an organisation completed 3 projects andmeasured Client Satisfaction - Product from the Economic KPIs. The results were:Performance (using the 1-10 scale)Benchmark Score6 10%8 55%9 85%The overall performance is the average benchmark score, i.e. (10+55+85)/3 = 50%. It would bewrong to take the average performance, i.e. (6+8+9)/3 = 7.7 and use this to derive an overallbenchmark score.STEP 5: ANALYSE THE RESULTSWhatever method of reporting is used, it is important that you let the results 'speak' to you.Look for links between different benchmark scores. For example, using the Economic KPIs,high benchmark scores for time predictability linked with low scores for client satisfactionwith the product may indicate that corners are being cut to get the job done on time.182006 UK KPIs - Handbook
Set clear decision criteria to judge what action is needed. Some organisations consider thatperformance that is below the industry average is unacceptable and must be followed upwith corrective action.STEP 6: TAKE ACTIONToo many organisations stop at Step 5, so they never get the benefit of using their benchmark datato make improvements. Action will be needed to maintain strengths and to eliminate weaknesses.The KPIs cannot themselves tell you what action you need to take.Key points to think about are:Avoid strategies that improve one aspect at the expense of another (e.g. improvingprofitability by cutting corners on the product and increasing defects).Improvements will take time, and may involve joint action between clients and suppliers.For this reason KPIs are ideally suited to support partnering.STEP 7: MEASURE AGAINNow you have completed your first set of KPIs it is vital that you capitalise on the lessons learned! Therewill be further improvements to be made, and you may need to review your measurement system andadjust it in the light of your experience to make it work more effectively for you.Remember, high performing athletes collect and analyse a whole range of data on their performance,looking for ways to stay ahead. You wouldn't expect them to win one race and then stop checking theirperformance, so don't fall into the trap of using KPIs once and then forgetting them. Keep them in theforefront of people's minds by carrying out regular checks and performance reviews, and publicising theresults widely.There is no right answer to the question "How often should I measure my performance?" The tablebelow gives some guidelines, but it is up to you to decide. Remember, too little sends out a signal that"This is not important" and too much can lead to overload and "analysis paralysis!"FrequencyAnnualEnd of projector phaseQuarterlyMonthlyUsefulnessProvides a 'snapshot' of how an organisation has performed. Limited data forlimited effort. May meet the initial requirements of some client organisationsand can be used to ‘kick-start’ a continuous improvement programme and auditthe results.Provides more rapid feedback in greater quantity. Requires greater effort, butcan form the basis of significant performance improvement.Provides regular performance management information. Keeps the focus onorganisation’s targets. May conflict with the natural cycle of projects.Keeps a firm check on performance and may meet contractual requirements.May not leave time for measurable improvement to take place.2006 UK KPIs - Handbook 19
DETERMINING PROJECT TENDER PRICEINDICES AND ADJUSTMENTSSome of the Economic KPIs use Tender Price Indices and Adjustment in the processof normalisation.Organisations wishing to determine a project Tender Price Index should write to:PUBLIC SECTOR PROJECTSDepartment of Trade and IndustryCMI DivisionIES DirectorateBay 289151 Buckingham Palace RoadLondonSW1W 9SSPRIVATE SECTOR PROJECTSBuilding Cost Information Service LtdBCIS Ltd12 Great George StreetLondonSW1P 3ADOrganisations wishing to adjust Tender Price Indices or contract sums for location, function,size and changes in resource cost should refer to:PUBLIC SECTOR PROJECTSDTI - Quarterly Building Priceand Cost Indicespublished by:Tudorseed Construction LtdUnit 3, Rippon House35 Station LaneHornchurch, Essex RM12 6JLPRIVATE SECTOR PROJECTSBCIS - Quarterly Review ofBuilding Pricespublished by:BCIS Ltd12 Great George StreetLondonSW1P 3AD202006 UK KPIs - Handbook
INDUSTRY AVERAGE PERFORMANCEThe industry average performance is the median of the sample whose distribution is shown on theKPI graph. It is used by some organisations embarking on performance measurement as an earlytarget to benchmark against.The industry average performance can be easily calculated. Having selected the appropriate KPIgraph (e.g. Profitability from the Economic KPIs), follow the steps illustrated below (see Figure 11).1 Ascertain the 50% benchmark score on the horizontal axis.2 Read up to the performance line.3 Read across to the vertical axis. This is the industry average performance.+30%ProfitabilityPerformanceProfitability (before tax and interest)Higher ProfitabilityLower Profitability+20%+10%0%-10%-20%3 21-30%0% 10% 20% 30% 40% 50% 60% 70% 80% 90% 100%Benchmark ScoreFigure 11: Example of calculation of industry average performanceIn the example, the industry average performance (i.e. 50% benchmark score) for Profitability beforetax and interest is +6%.2006 UK KPIs - Handbook 21
DATA SOURCESThe data sources used in the preparation of these KPIs are shown in the table below.Economic KPIsData Source(see below)RfP KPIsData Source(see below)Environment KPIsData Source(see below)Client Satisfaction-Product1,6Employee Satisfaction5Impact on theEnvironment1,6Client Satisfaction-Service1,6Staff Turnover2Energy Use (Designed)-Product1,6Defects1,6Sickness/Absence2Energy Use-Construction Process2Predictability -Cost1,6Safety2,9Mains Water Use(Designed) -Product1,6Predictability -Time1,6Working Hours10Mains Water Use-Construction Process2Safety2,9Qualifications & Skills2Waste2Productivity8Equality & Diversity1,6Commercial VehicleMovements2Profitability8Training2Impact onBiodiversity1,6Construction Cost4,7Pay11Area of HabitatCreated/Retained1,6Construction Time3Investors in People12Whole LifePerformance1,6The data sources referred to in the table above are:1. DTI Quarterly Clients’ KPI Survey2. DTI Quarterly Contractor KPI Survey3. DTI New Orders Survey4. DTI Quarterly Building Price & Cost Indices5. DTI Annual Employee Satisfaction Survey6. BCIS Annual Clients’ KPI Survey7. BCIS Quarterly Review of Building Prices8. Dun and Bradstreet, Intercompany Comparisons,and Companies House supplied by pH Group Ltd9. Health & Safety Executive10. Office for National Statistics - Labour Force Survey11. Office for National Statistics - Annual Survey ofHours and Earnings12. Investors in People UK Ltd222006 UK KPIs - Handbook
SAFETYSafety: Conversion from AIR to AFRIn line with the data published by the Health and Safety Executive, the Safety KPI is the AccidentIncidence Rate (AIR) which is number of reportable accidents per 100, 000 employed per year. Themethod of calculating AIR is described in the Methods of Measurement. However, someorganisations collect safety data as the Accident Frequency Rate (AFR) which gives the accident rateper 100,000 person hours worked. Unlike the AIR, the AFR formula makes allowance for variations inpart-time work or overtime. AFR is calculated as follows:AFR =Number of reportable accidentsNumber of person-hours worked including self-employed and sub-contractorsx 100,000Formulae for converting one from the other are given below.AIR to AFR (simplified) =AIR2,000AFR (simplified) to AIR = AFR x 2,000AFR (measured) to AIR = AFR x (Number of hours worked in the year by a typicalfull-time worker)The calculation above uses an assumption of 2,000 hours worked per person during the year. Usingthis figure for all those employed gives a simplified AFR calculation which makes no allowance forvariations in working weeks. Using the actual number of hours worked by the entire workforce will bemore accurate for those companies where this information is available.Safety: Calculation of Project AIR PerformanceOrganisations wishing to calculate safety (AIR) at a project rather than company level should usethe formula:Performance (AIR) safety =Number of reportable accidents during projectAverage number employed during the project includingx100,000x52Project durationself-employed and sub-contractors(weeks)or they should calculate the project Accident Frequency Rate (AFR) and convert this to the projectAccident Incidence Rate (AIR) using one of the conversion formulae given above.Care should be taken when comparing project results against KPI graphs of companyperformance as the results could be misleading.2006 UK KPIs - Handbook 23
PROFITABILITYProfitability: Calculation of Project PerformanceOrganisations wishing to calculate profitability at a project rather than company level shoulduse the formula:Project profitPerformance (%) profitability =x 100Project final account plus head office chargesCare should be taken when comparing project results against KPI graphs of company performanceas the results could be misleading.PRODUCTIVITYProductivity: Calculation of Project PerformanceOrganisations wishing to calculate productivity at a project rather than company level should usethe formula:Performance (£) value added per employee =Project final account - total value of sub-contracted services -total value of goods suppliedAverage number of directly employed full-timeequivalent employees on the projectx52Project duration(weeks)Care should be taken when comparing project results against KPI graphs of companyperformance as the results could be misleading.242006 UK KPIs - Handbook
CONSTRUCTING EXCELLENCE<strong>Constructing</strong> <strong>Excellence</strong> provides a range of services to help implement KPIs:HelpdeskA direct point of contact to answer initial enquiriesabout KPIs. TEL 0845 605 55 56The KPI PackA source of comprehensive information fororganisations wishing to use KPIs.The Housing KPI ToolkitVital information for using KPIs in the housing sector.KPIZoneA website dedicated to KPIs. Visit www.kpizone.comfor free information on KPIs and benchmarking clubs.KPIZone also has a subscription service from which youcan download the information contained in the KPI Packand Housing KPI Toolkit.KPI MasterclassesAn introduction to the benefits and use of theConstruction Industry KPIs. Each Masterclassexplores the importance of measuring performancewith the help of practical examples, a step by stepguide to their use, and presentations by organisationsthat have successfully implemented KPIs.WebsiteAn extensive database of best practice activities,information and resources is available onwww.constructingexcellence.org.uk .At <strong>Constructing</strong> <strong>Excellence</strong> we bring distinctive value to our customers’ businessesthrough six core activities:Innovation and Research:Members shape and take part in <strong>Constructing</strong><strong>Excellence</strong>’s research programme, from major actionresearch projects to working groups and confidentiallearning clubs.Measurement and Diagnostics:<strong>Constructing</strong> <strong>Excellence</strong> has led the way in industryperformance measurement, with diagnostic toolscentral to its activities. Members receive:• Complimentary KPI pack• Complimentary introductory ExplorerInteractive TM business diagnostic session• 20% discount on KPI Masterclasses.Tailored Services for BusinessImprovement:<strong>Constructing</strong> <strong>Excellence</strong> is able to offer membersconsultancy tailored to their business requirements. Thisservice includes free or discounted access to <strong>Constructing</strong><strong>Excellence</strong> publications, and discounts on facilitation andmentoring services and conferences.Business-to-Business Networks:Existing members see real benefits in these networks,meeting with other like minded individuals andcompanies, building relationships, sharing best practiceand developing business contacts.Showcasing and Exemplars:One of the key benefits of membership is being able todemonstrate participation to key stakeholders such ascustomers, employees, suppliers and investors.<strong>Constructing</strong> <strong>Excellence</strong> provides members:• Opportunities to showcase projects• Opportunities to share and learn frommembers’ exemplars• Invitations to speak as an acknowledged industryleader at <strong>Constructing</strong> <strong>Excellence</strong> events.Leadership and Influence:<strong>Constructing</strong> <strong>Excellence</strong> works closely with government,strategic partners, firms and influencer organisations toshape the future of the sector. Members have the chanceto take an active role in influencing Government prioritiesand to have input into the formation of future policy atregular forums and conferences.CONSTRUCTING EXCELLENCEWarwick House, 25 Buckingham Palace Road, London, SW1W 0PP0845 605 55 56(calls charged at local rate)email: helpdesk@constructingexcellence.org.ukwww.constructingexcellence.org.uk2006 UK KPIs - Handbook 25
CONSTRUCTING EXCELLENCEWarwick House25 Buckingham Palace RoadLondonSW1W 0PPTel: 0845 605 55 56Fax: 020 7592 1101E-mail: helpdesk@constructingexcellence.org.ukWebsite: www.constructingexcellence.org.ukIn Partnership withPublished by <strong>Constructing</strong> <strong>Excellence</strong>ISBN: 1-905033-17-6Construction Industry KPI Pack 2006/Housing KPI Toolkit 2006Electronic Copy