Download - Constructing Excellence
Download - Constructing Excellence
Download - Constructing Excellence
- No tags were found...

You also want an ePaper? Increase the reach of your titles
YUMPU automatically turns print PDFs into web optimized ePapers that Google loves.
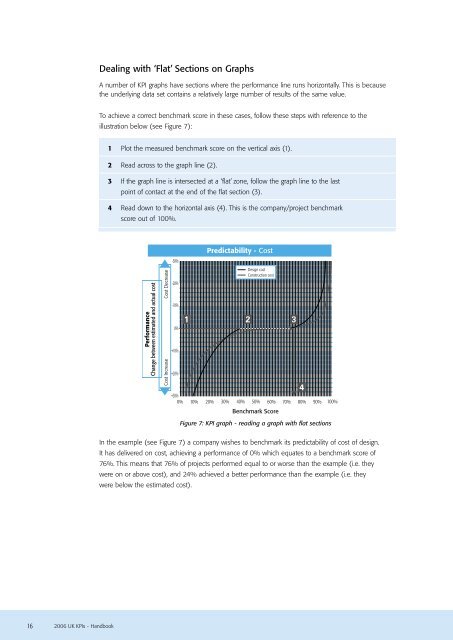
Dealing with ‘Flat’ Sections on GraphsA number of KPI graphs have sections where the performance line runs horizontally. This is becausethe underlying data set contains a relatively large number of results of the same value.To achieve a correct benchmark score in these cases, follow these steps with reference to theillustration below (see Figure 7):1 Plot the measured benchmark score on the vertical axis (1).2 Read across to the graph line (2).3 If the graph line is intersected at a ‘flat’ zone, follow the graph line to the lastpoint of contact at the end of the flat section (3).4 Read down to the horizontal axis (4). This is the company/project benchmarkscore out of 100%.PerformanceChange between estimated and actual costCost DecreaseCost Increase-30%-20%-10%0%+10%+20%Predictability - CostDesign costConstruction cost1 2 3+30%0% 10% 20% 30% 40% 50% 60% 70% 80% 90% 100%Benchmark ScoreFigure 7: KPI graph - reading a graph with flat sections4In the example (see Figure 7) a company wishes to benchmark its predictability of cost of design.It has delivered on cost, achieving a performance of 0% which equates to a benchmark score of76%. This means that 76% of projects performed equal to or worse than the example (i.e. theywere on or above cost), and 24% achieved a better performance than the example (i.e. theywere below the estimated cost).162006 UK KPIs - Handbook