Download - Constructing Excellence
Download - Constructing Excellence
Download - Constructing Excellence
- No tags were found...

Create successful ePaper yourself
Turn your PDF publications into a flip-book with our unique Google optimized e-Paper software.
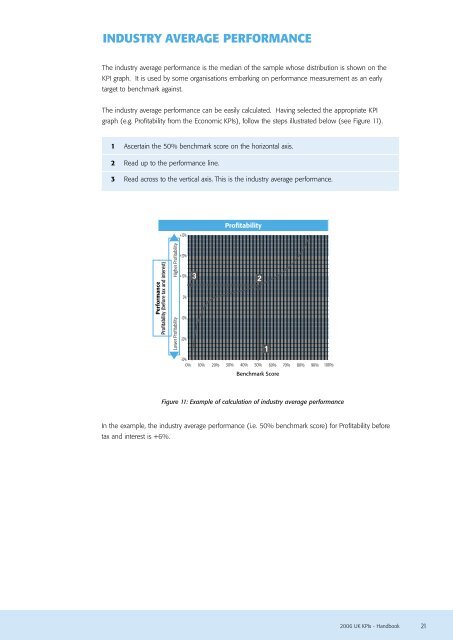
INDUSTRY AVERAGE PERFORMANCEThe industry average performance is the median of the sample whose distribution is shown on theKPI graph. It is used by some organisations embarking on performance measurement as an earlytarget to benchmark against.The industry average performance can be easily calculated. Having selected the appropriate KPIgraph (e.g. Profitability from the Economic KPIs), follow the steps illustrated below (see Figure 11).1 Ascertain the 50% benchmark score on the horizontal axis.2 Read up to the performance line.3 Read across to the vertical axis. This is the industry average performance.+30%ProfitabilityPerformanceProfitability (before tax and interest)Higher ProfitabilityLower Profitability+20%+10%0%-10%-20%3 21-30%0% 10% 20% 30% 40% 50% 60% 70% 80% 90% 100%Benchmark ScoreFigure 11: Example of calculation of industry average performanceIn the example, the industry average performance (i.e. 50% benchmark score) for Profitability beforetax and interest is +6%.2006 UK KPIs - Handbook 21