Cores 11 through 26 by Gary B. Dr - University of Illinois at Urbana ...
Cores 11 through 26 by Gary B. Dr - University of Illinois at Urbana ...
Cores 11 through 26 by Gary B. Dr - University of Illinois at Urbana ...

You also want an ePaper? Increase the reach of your titles
YUMPU automatically turns print PDFs into web optimized ePapers that Google loves.
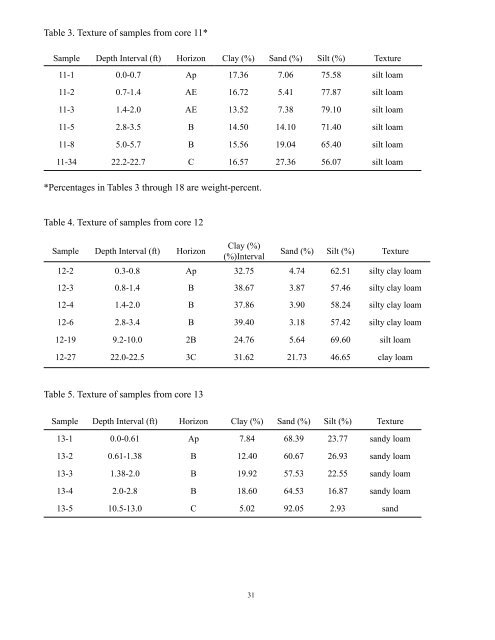
Table 3. Texture <strong>of</strong> samples from core <strong>11</strong>*Sample Depth Interval (ft) Horizon Clay (%) Sand (%) Silt (%) Texture<strong>11</strong>-1 0.0-0.7 Ap 17.36 7.06 75.58 silt loam<strong>11</strong>-2 0.7-1.4 AE 16.72 5.41 77.87 silt loam<strong>11</strong>-3 1.4-2.0 AE 13.52 7.38 79.10 silt loam<strong>11</strong>-5 2.8-3.5 B 14.50 14.10 71.40 silt loam<strong>11</strong>-8 5.0-5.7 B 15.56 19.04 65.40 silt loam<strong>11</strong>-34 22.2-22.7 C 16.57 27.36 56.07 silt loam*Percentages in Tables 3 <strong>through</strong> 18 are weight-percent.Table 4. Texture <strong>of</strong> samples from core 12Sample Depth Interval (ft) HorizonClay (%)(%)IntervalSand (%) Silt (%) Texture12-2 0.3-0.8 Ap 32.75 4.74 62.51 silty clay loam12-3 0.8-1.4 B 38.67 3.87 57.46 silty clay loam12-4 1.4-2.0 B 37.86 3.90 58.24 silty clay loam12-6 2.8-3.4 B 39.40 3.18 57.42 silty clay loam12-19 9.2-10.0 2B 24.76 5.64 69.60 silt loam12-27 22.0-22.5 3C 31.62 21.73 46.65 clay loamTable 5. Texture <strong>of</strong> samples from core 13Sample Depth Interval (ft) Horizon Clay (%) Sand (%) Silt (%) Texture13-1 0.0-0.61 Ap 7.84 68.39 23.77 sandy loam13-2 0.61-1.38 B 12.40 60.67 <strong>26</strong>.93 sandy loam13-3 1.38-2.0 B 19.92 57.53 22.55 sandy loam13-4 2.0-2.8 B 18.60 64.53 16.87 sandy loam13-5 10.5-13.0 C 5.02 92.05 2.93 sand31