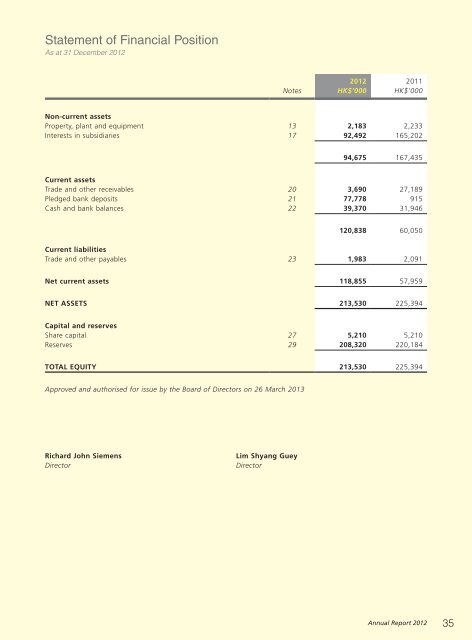
Statement of Financial PositionAs at 31 December <strong>2012</strong><strong>2012</strong> 2011Notes HK$’000 HK$’000Non-current assetsProperty, plant and equipment 13 2,183 2,233Interests in subsidiaries 17 92,492 165,20294,675 167,435Current assetsTrade and other receivables 20 3,690 27,189Pledged bank deposits 21 77,778 915Cash and bank balances 22 39,370 31,946120,838 60,050Current liabilitiesTrade and other payables 23 1,983 2,091Net current assets 118,855 57,959NET ASSETS 213,530 225,394Capital and reservesShare capital 27 5,210 5,210Reserves 29 208,320 220,184TOTAL EQUITY 213,530 225,394Approved and authorised for issue by the Board of Directors on 26 March 2013Richard John SiemensDirectorLim Shyang GueyDirector<strong>Annual</strong> <strong>Report</strong> <strong>2012</strong> 35
e-<strong>KONG</strong> GROUP LIMITEDConsolidated Statement of Changes in EquityFor the year ended 31 December <strong>2012</strong>Attributable to equity holders of the CompanyShare ShareCapitalExchange redemptionShareCapital repurchase Contributed AccumulatedNoncontrollingTotalcapital premium reserve reserve reserve reserve surplus profits Total interests equityHK$’000 HK$’000 HK$’000 HK$’000 HK$’000 HK$’000 HK$’000 HK$’000 HK$’000 HK$’000 HK$’000As at 1 January 2011 5,229 68,341 4,278 6 (63) (247) 83,489 50,987 212,020 – 212,020Profit for the year – – – – – – – 16,828 16,828 (761) 16,067Other comprehensive loss for the yearReleased from exchange reserve upondisposal of subsidiary – – (939) – – – – – (939) – (939)Exchange differences on translation offoreign subsidiaries – – (535) – – – – – (535) – (535)Total comprehensive income / (loss) for the year – – (1,474) – – – – 16,828 15,354 (761) 14,593Transactions with equity holders of the CompanyRepurchase of own shares for cancellation(note 27(b)) (19) (1,248) – 19 – 247 – (19) (1,020) – (1,020)Deemed partial disposal of a subsidiary – – – – 69 – – – 69 (69) –Total transactions with equity holdersof the Company (19) (1,248) – 19 69 247 – (19) (951) (69) (1,020)As at 31 December 2011 5,210 67,093 2,804 25 6 – 83,489 67,796 226,423 (830) 225,593Loss for the year – – – – – – – (12,851) (12,851) (904) (13,755)Other comprehensive income for the yearExchange differences on translation offoreign subsidiaries – – 920 – – – – – 920 – 920Total comprehensive income / (loss) for the year – – 920 – – – – (12,851) (11,931) (904) (12,835)Transaction with equity holders of the CompanyArising from acquisition of a subsidiary – – – – – – – – – 764 764Total transaction with equity holdersof the Company – – – – – – – – – 764 764As at 31 December <strong>2012</strong> 5,210 67,093 3,724 25 6 – 83,489 54,945 214,492 (970) 213,52236<strong>Annual</strong> <strong>Report</strong> <strong>2012</strong>