Annual Report 2012 - e-KONG Group Limited
Annual Report 2012 - e-KONG Group Limited
Annual Report 2012 - e-KONG Group Limited
Create successful ePaper yourself
Turn your PDF publications into a flip-book with our unique Google optimized e-Paper software.
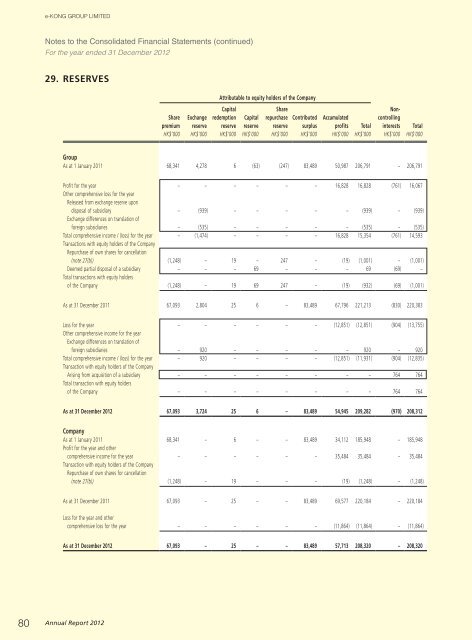
e-<strong>KONG</strong> GROUP LIMITEDNotes to the Consolidated Financial Statements (continued)For the year ended 31 December <strong>2012</strong>29. RESERVESAttributable to equity holders of the CompanySharepremiumExchangereserveCapitalredemptionreserveCapitalreserveSharerepurchasereserveContributedsurplusAccumulatedprofits TotalNoncontrollinginterests TotalHK$’000 HK$’000 HK$’000 HK$’000 HK$’000 HK$’000 HK$’000 HK$’000 HK$’000 HK$’000<strong>Group</strong>As at 1 January 2011 68,341 4,278 6 (63) (247) 83,489 50,987 206,791 – 206,791Profit for the year – – – – – – 16,828 16,828 (761) 16,067Other comprehensive loss for the yearReleased from exchange reserve upondisposal of subsidiary – (939) – – – – – (939) – (939)Exchange differences on translation offoreign subsidiaries – (535) – – – – – (535) – (535)Total comprehensive income / (loss) for the year – (1,474) – – – – 16,828 15,354 (761) 14,593Transactions with equity holders of the CompanyRepurchase of own shares for cancellation(note 27(b)) (1,248) – 19 – 247 – (19) (1,001) – (1,001)Deemed partial disposal of a subsidiary – – – 69 – – – 69 (69) –Total transactions with equity holdersof the Company (1,248) – 19 69 247 – (19) (932) (69) (1,001)As at 31 December 2011 67,093 2,804 25 6 – 83,489 67,796 221,213 (830) 220,383Loss for the year – – – – – – (12,851) (12,851) (904) (13,755)Other comprehensive income for the yearExchange differences on translation offoreign subsidiaries – 920 – – – – – 920 – 920Total comprehensive income / (loss) for the year – 920 – – – – (12,851) (11,931) (904) (12,835)Transaction with equity holders of the CompanyArising from acquisition of a subsidiary – – – – – – – – 764 764Total transaction with equity holdersof the Company – – – – – – – – 764 764As at 31 December <strong>2012</strong> 67,093 3,724 25 6 – 83,489 54,945 209,282 (970) 208,312CompanyAs at 1 January 2011 68,341 – 6 – – 83,489 34,112 185,948 – 185,948Profit for the year and othercomprehensive income for the year – – – – – – 35,484 35,484 – 35,484Transaction with equity holders of the CompanyRepurchase of own shares for cancellation(note 27(b)) (1,248) – 19 – – – (19) (1,248) – (1,248)As at 31 December 2011 67,093 – 25 – – 83,489 69,577 220,184 – 220,184Loss for the year and othercomprehensive loss for the year – – – – – – (11,864) (11,864) – (11,864)As at 31 December <strong>2012</strong> 67,093 – 25 – – 83,489 57,713 208,320 – 208,32080<strong>Annual</strong> <strong>Report</strong> <strong>2012</strong>


