You also want an ePaper? Increase the reach of your titles
YUMPU automatically turns print PDFs into web optimized ePapers that Google loves.
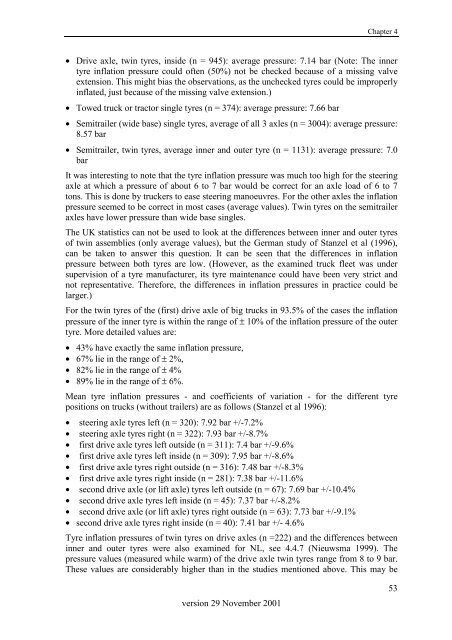
Chapter 4• Drive axle, twin tyres, inside (n = 945): average pressure: 7.14 bar (Note: The innertyre inflation pressure could often (50%) not be checked because of a missing valveextension. This might bias the observations, as the unchecked tyres could be improperlyinflated, just because of the missing valve extension.)• Towed truck or tractor single tyres (n = 374): average pressure: 7.66 bar• Semitrailer (wide base) single tyres, average of all 3 axles (n = 3004): average pressure:8.57 bar• Semitrailer, twin tyres, average inner and outer tyre (n = 1131): average pressure: 7.0barIt was interesting to note that the tyre inflation pressure was much too high for the steeringaxle at which a pressure of about 6 to 7 bar would be correct for an axle load of 6 to 7tons. This is done by truckers to ease steering manoeuvres. For the other axles the inflationpressure seemed to be correct in most cases (average values). Twin tyres on the semitraileraxles have lower pressure than wide base singles.The UK statistics can not be used to look at the differences between inner and outer tyresof twin assemblies (only average values), but the German study of Stanzel et al (1996),can be taken to answer this question. It can be seen that the differences in inflationpressure between both tyres are low. (However, as the examined truck fleet was undersupervision of a tyre manufacturer, its tyre maintenance could have been very strict andnot representative. Therefore, the differences in inflation pressures in practice could belarger.)For the twin tyres of the (first) drive axle of big trucks in 93.5% of the cases the inflationpressure of the inner tyre is within the range of ± 10% of the inflation pressure of the outertyre. More detailed values are:• 43% have exactly the same inflation pressure,• 67% lie in the range of ± 2%,• 82% lie in the range of ± 4%• 89% lie in the range of ± 6%.Mean tyre inflation pressures - and coefficients of variation - for the different tyrepositions on trucks (without trailers) are as follows (Stanzel et al 1996):• steering axle tyres left (n = 320): 7.92 bar +/-7.2%• steering axle tyres right (n = 322): 7.93 bar +/-8.7%• first drive axle tyres left outside (n = 311): 7.4 bar +/-9.6%• first drive axle tyres left inside (n = 309): 7.95 bar +/-8.6%• first drive axle tyres right outside (n = 316): 7.48 bar +/-8.3%• first drive axle tyres right inside (n = 281): 7.38 bar +/-11.6%• second drive axle (or lift axle) tyres left outside (n = 67): 7.69 bar +/-10.4%• second drive axle tyres left inside (n = 45): 7.37 bar +/-8.2%• second drive axle (or lift axle) tyres right outside (n = 63): 7.73 bar +/-9.1%• second drive axle tyres right inside (n = 40): 7.41 bar +/- 4.6%Tyre inflation pressures of twin tyres on drive axles (n =222) and the differences betweeninner and outer tyres were also examined for NL, see 4.4.7 (Nieuwsma 1999). Thepressure values (measured while warm) of the drive axle twin tyres range from 8 to 9 bar.These values are considerably higher than in the studies mentioned above. This may beversion 29 November 200153


