19 strategic link to the millennium development goals - LGRC DILG 10
19 strategic link to the millennium development goals - LGRC DILG 10
19 strategic link to the millennium development goals - LGRC DILG 10
Create successful ePaper yourself
Turn your PDF publications into a flip-book with our unique Google optimized e-Paper software.
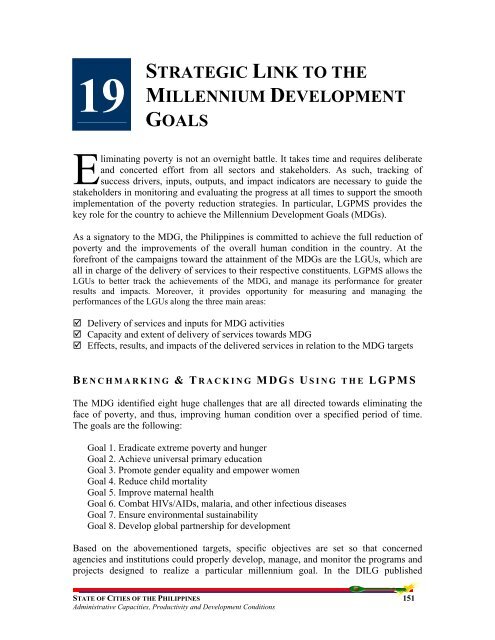
<strong>19</strong>STRATEGIC LINK TO THEMILLENNIUM DEVELOPMENTGOALSEliminating poverty is not an overnight battle. It takes time and requires deliberateand concerted effort from all sec<strong>to</strong>rs and stakeholders. As such, tracking ofsuccess drivers, inputs, outputs, and impact indica<strong>to</strong>rs are necessary <strong>to</strong> guide <strong>the</strong>stakeholders in moni<strong>to</strong>ring and evaluating <strong>the</strong> progress at all times <strong>to</strong> support <strong>the</strong> smoothimplementation of <strong>the</strong> poverty reduction strategies. In particular, LGPMS provides <strong>the</strong>key role for <strong>the</strong> country <strong>to</strong> achieve <strong>the</strong> Millennium Development Goals (MDGs).As a signa<strong>to</strong>ry <strong>to</strong> <strong>the</strong> MDG, <strong>the</strong> Philippines is committed <strong>to</strong> achieve <strong>the</strong> full reduction ofpoverty and <strong>the</strong> improvements of <strong>the</strong> overall human condition in <strong>the</strong> country. At <strong>the</strong>forefront of <strong>the</strong> campaigns <strong>to</strong>ward <strong>the</strong> attainment of <strong>the</strong> MDGs are <strong>the</strong> LGUs, which areall in charge of <strong>the</strong> delivery of services <strong>to</strong> <strong>the</strong>ir respective constituents. LGPMS allows <strong>the</strong>LGUs <strong>to</strong> better track <strong>the</strong> achievements of <strong>the</strong> MDG, and manage its performance for greaterresults and impacts. Moreover, it provides opportunity for measuring and managing <strong>the</strong>performances of <strong>the</strong> LGUs along <strong>the</strong> three main areas: Delivery of services and inputs for MDG activities Capacity and extent of delivery of services <strong>to</strong>wards MDG Effects, results, and impacts of <strong>the</strong> delivered services in relation <strong>to</strong> <strong>the</strong> MDG targetsB ENCHMARKING & T RACKING MDGS U SING THE LGPMSThe MDG identified eight huge challenges that are all directed <strong>to</strong>wards eliminating <strong>the</strong>face of poverty, and thus, improving human condition over a specified period of time.The <strong>goals</strong> are <strong>the</strong> following:Goal 1. Eradicate extreme poverty and hungerGoal 2. Achieve universal primary educationGoal 3. Promote gender equality and empower womenGoal 4. Reduce child mortalityGoal 5. Improve maternal healthGoal 6. Combat HIVs/AIDs, malaria, and o<strong>the</strong>r infectious diseasesGoal 7. Ensure environmental sustainabilityGoal 8. Develop global partnership for <strong>development</strong>Based on <strong>the</strong> abovementioned targets, specific objectives are set so that concernedagencies and institutions could properly develop, manage, and moni<strong>to</strong>r <strong>the</strong> programs andprojects designed <strong>to</strong> realize a particular <strong>millennium</strong> goal. In <strong>the</strong> <strong>DILG</strong> publishedSTATE OF CITIES OF THE PHILIPPINES 151Administrative Capacities, Productivity and Development Conditions
Per Capita Income. A related indica<strong>to</strong>r <strong>to</strong> employment is <strong>the</strong> per capita income. In 2004,<strong>the</strong> average annual per capita income in 86 cities was P16,888. Such was way below <strong>the</strong>LGPMS benchmark and MDG target average income of more than one dollar a day orabout P20,000 a year at an exchange rate of P 55 <strong>to</strong> a dollar. Urban centers in Luzon had<strong>the</strong> highest average per capita income of P21,800. The lowest, on <strong>the</strong> o<strong>the</strong>r hand, was in<strong>the</strong> cities in <strong>the</strong> Visayas with P13,721. The urban centers in Mindanao had P15,138. Poorincome condition was prevalent in at least 55% of <strong>the</strong> 86 cities in <strong>the</strong> Philippines withaverage family earning of less than P<strong>19</strong>,999 (see Figure <strong>19</strong>.2).Figure <strong>19</strong>.2 Range of Per Capita Income in 86 Cities, PY 200490,00080,00070,000Income Per Capita60,00050,00040,00030,00020,000<strong>10</strong>,000-Number of CitiesTarget: Reduce by 50% <strong>the</strong> number of underweight children below five years oldMalnutrition Rate. The proportion of malnourished children aged zero <strong>to</strong> five wasestimated at nearly 13% in 116 cities (see Figure <strong>19</strong>.3). Urban centers in <strong>the</strong> NLAQ had<strong>the</strong> lowest malnutrition rates at 9.25%. Both <strong>the</strong> 32 cities in <strong>the</strong> CP and <strong>the</strong> 27 urbancenters in <strong>the</strong> MSR registered malnutrition rates of around 14%, while those in <strong>the</strong>MLUB had a little more than 13%.In <strong>the</strong> next decade, <strong>the</strong> target for <strong>the</strong> LGUs is <strong>to</strong> reduce <strong>the</strong> malnutrition rate <strong>to</strong> at least6%, which is attainable considering <strong>the</strong> performance levels in terms of <strong>the</strong> productivityand capacities of <strong>the</strong> cities in <strong>the</strong> localization of <strong>the</strong> MDGs.STATE OF CITIES OF THE PHILIPPINES 153Administrative Capacities, Productivity and Development Conditions
Figure <strong>19</strong>.3 Malnutrition Rates in 116 Cities, PY 2004<strong>10</strong>012.9513.2614.5614.72<strong>10</strong>9.251NationalAverageNor<strong>the</strong>rn LuzonAgribusinessQuadrangleMetro LuzonUrban BeltwayCentralPhilippinesMindanao SuperRegionTarget: Reduce by 50% <strong>the</strong> number of people with no access <strong>to</strong> safe drinking waterHousehold with Potable Water. In 2004, a very high national average of 83.3% wasreported by all <strong>the</strong> households in <strong>the</strong> 112 cities in <strong>the</strong> Philippines regarding <strong>the</strong>ir access <strong>to</strong>safe potable water supply. The 55 urban centers in Luzon registered an average of 85.3%of <strong>the</strong> households with access <strong>to</strong> drinkable water while <strong>the</strong> 27 cities in Mindanao, and 30in <strong>the</strong> Visayas had 84.0% and 76.8%, respectively. The accomplishment was quiteimpressive among <strong>the</strong> 72% of <strong>the</strong> urban centers as exhibited by <strong>the</strong>ir distributionaccording <strong>to</strong> performance levels in <strong>the</strong> provision of clean water.Based on <strong>the</strong> current performance average, accomplishing a <strong>10</strong>0% access <strong>to</strong> potablewater for all <strong>the</strong> households in every city in <strong>the</strong> Philippines is not impossible. Based onLGPMS estimates, <strong>the</strong> <strong>to</strong>tal number of households in <strong>the</strong> country without access <strong>to</strong>drinkable water was around 800,000 (see Figure <strong>19</strong>.4). Moreover, <strong>the</strong> cities in <strong>the</strong> MLUBcovered about 36% or nearly 300,000 households without access <strong>to</strong> safe drinking water.This was followed by those in <strong>the</strong> CP with around 29% or over 220,000 households, andthose in <strong>the</strong> MSR with about 23% or nearly 186,000 households without access <strong>to</strong> cleanwater. The urban centers in <strong>the</strong> NLAQ, on <strong>the</strong> o<strong>the</strong>r hand, had <strong>the</strong> lowest number ofhouseholds without access <strong>to</strong> potable water at over 92,000 or 12% of <strong>the</strong> <strong>to</strong>tal.It is anticipated that in <strong>the</strong> next <strong>10</strong> years, <strong>the</strong> target for cities <strong>to</strong> reduce <strong>the</strong> number ofhouseholds with no access <strong>to</strong> drinkable water will be around 400,000. With <strong>the</strong>convergence of efforts and resources, and proper focusing of target areas, such goal iscertainly realistically attainable.154 STRATEGIC LINK TO THE MILLENNIUM DEVELOPMENT GOALS
Figure <strong>19</strong>.4 Estimated Number of Households in 112 Cities With No Access <strong>to</strong> Potable Water, PY 2004800,000796,791Number of Households600,000400,000200,0000NationalAv erage92,584Nor<strong>the</strong>rnLuzonAgribusinessQuadrangle293,895Metro LuzonUrbanBeltw ay229,280CentralPhilippines185,816MindanaoSuper RegionSuper RegionsGoals 2 and 3: Achieve Universal Primary Education and PromoteGender EqualityTarget: Ensure that all boys and girls complete a full course of primaryschoolingElementary Enrolment Rate. While <strong>the</strong> present LGPMS indica<strong>to</strong>r structure does notprovide for sex-disaggregated data on primary education, this particular MDG can beanalyzed using <strong>the</strong>Figure <strong>19</strong>.5 Primary and Secondary Education Enrolment and Graduationelementary schoolRates in <strong>10</strong>8 Cities, PY 2004enrolment rates asindica<strong>to</strong>r.In 2004, <strong>the</strong> elementaryschool enrolment rate inall <strong>the</strong> cities in <strong>the</strong>Philippines was 94% (seeFigure <strong>19</strong>.5). Thisperformance report washigher than that ofDepEd’s nationalenrolment average of 82%in 2004. Judging from this,<strong>the</strong> attainment of <strong>the</strong> goalfor primary education in<strong>the</strong> urban centers isachievable given <strong>the</strong>proper support andstrategies.Elementary SchoolEnrollment rateSecondary SchoolEnrollment RateSecondaryGraduation Rate77.7084.1293.840 20 40 60 80 <strong>10</strong>0PercentSTATE OF CITIES OF THE PHILIPPINES 155Administrative Capacities, Productivity and Development Conditions
Target: Eliminate gender disparity in primary and secondary education by 2005, andin all levels by 2015High School Completion Rate. A related LGPMS indica<strong>to</strong>r in tracking this particularMDG is <strong>the</strong> secondary or high school graduation rate or completion rate under <strong>the</strong>Education Service Area. In 2004, a <strong>to</strong>tal of <strong>10</strong>8 cities reported an average high schoolcompletion rate of about 78%. This was way above <strong>the</strong> DepEd’s average of 51% during<strong>the</strong> SY 2003-2004.The urban centers in Luzon registered <strong>the</strong> highest completion rate of 85.3%, where firstyear entrants completed <strong>the</strong> four-year secondary education program. The 29 cities in <strong>the</strong>Visayas and 27 in Mindanao exhibited weak performances as far as steering <strong>the</strong>irrespective students’ paths until <strong>the</strong> secondary finish line are concerned with only 74.5%and 69.2% respectively.Goal 4: Reduce Child MortalityTarget: Reduce by two thirds <strong>the</strong> mortality rate among children under fiveThe LGPMS performance report on <strong>the</strong> goal of reducing children mortality was veryencouraging based on <strong>the</strong> average report of 115 cities. With appropriate support fromall sec<strong>to</strong>rs, particularly from <strong>the</strong> LGUs, reducing children mortality is on track and anachievable target in <strong>the</strong> next <strong>10</strong> years.Figure <strong>19</strong>.6 Infant Mortality Rates in 115 Cities and Children Mortality Rates in 116 Cities, PY 2004<strong>10</strong>Percent98766.0898.169.258.1254322.614.03<strong>10</strong>1.321.552.38Nor<strong>the</strong>rn LuzonAgribusinessQuadrangleMetro LuzonUrban BeltwayCentralPhilippinesMindanao SuperRegionNational AverageSuper RegionsMortality Rate of Children aged 1-5Infant Mortality Rate156 STRATEGIC LINK TO THE MILLENNIUM DEVELOPMENT GOALS
Infant Mortality Rates. IMR in 115 cities was 8.12 deaths per 1,000 live births (D/1kLB)(see Figure <strong>19</strong>.6). The cities in <strong>the</strong> MSR recorded <strong>the</strong> highest average IMR of 9.25D/1kLB. Those in MLUB and in <strong>the</strong> CP, on <strong>the</strong> o<strong>the</strong>r hand, had 9.00 D/1kLB and 8.16D/1kLB, respectively. The urban centers in <strong>the</strong> NLAQ recorded <strong>the</strong> lowest IMR at 6.08D/1kLB.Children One <strong>to</strong> Five Years Old Mortality Rates. CMR for one <strong>to</strong> five years old childrenwas 2.38 deaths per 1,000 population (D/1kP) in 116 urban centers. Moreover, it washigh in <strong>the</strong> cities in <strong>the</strong> CP with an average rate of 4.03 D/1KP. This was followed bythose in <strong>the</strong> MLUB and MSR with 2.61 D/1kP and 1.55 D/1kP, respectively. Again,NLAQ recorded <strong>the</strong> lowest average at 1.32 D/1kP.Goal 5: Improve Maternal HealthTarget: Reduce by three quarters <strong>the</strong> maternal mortality ratioMaternal mortality rate is not included in <strong>the</strong> 2004 indica<strong>to</strong>rs of LGPMS. The efforts of<strong>the</strong> cities in promoting pre-natal programs are indicative of <strong>the</strong> prevailing conditions of<strong>the</strong> services for improving maternal health in <strong>the</strong> urban centers in <strong>the</strong> Philippines.In 2004, about 74.3% of pregnant women in 112 cities in <strong>the</strong> Philippines were providedwith pre-natal care. Urban centers in Luzon registered <strong>the</strong> highest pre-natal programcoverage of 78.4%. Cities in <strong>the</strong> Visayas and Mindanao recorded 73.0% and 69.4%,respectively.Goal 6: Combat HIV/AIDS, Malaria, and O<strong>the</strong>r Infectious DiseasesTarget: Halt and begin <strong>to</strong> reverse <strong>the</strong> incidence of malaria and o<strong>the</strong>r major diseasesThe LGPMS report on <strong>the</strong> leading causes of morbidity in <strong>the</strong> Philippines was indicativeof <strong>the</strong> cities’ performances for MDG 6. The leading causes of morbidity in <strong>the</strong> countryinclude diarrhea with a national incidence of 1,189 per <strong>10</strong>0,000 population (/<strong>10</strong>0kP);pneumonia with 939/<strong>10</strong>0kP, and; bronchitis with 908/<strong>10</strong>0kP. The following informationwere extracted from <strong>the</strong> 113 cities in <strong>the</strong> Philippines in 2004 (see Figure <strong>19</strong>.7): 56 cities or 49.0% of <strong>the</strong> <strong>to</strong>tal had lower incidences for all <strong>the</strong> leading causes ofmorbidity 29 urban centers or 25.7% of <strong>the</strong> <strong>to</strong>tal had lower rates than <strong>the</strong> national levels for <strong>the</strong>two <strong>to</strong>p diseasesSTATE OF CITIES OF THE PHILIPPINES 157Administrative Capacities, Productivity and Development Conditions
Figure <strong>19</strong>.7Morbidity Incidences in 113 Cities, PY 2004605056Number of Cities40302920<strong>10</strong>0Incidence is Incidence islow er than low er thannational nationalaverages for <strong>to</strong>p averages for 23 diseases of <strong>the</strong> <strong>to</strong>p 3diseases12Incidence islow er thannational averagein 1 of <strong>the</strong> <strong>to</strong>p 3diseases6Incidence ishigher thannational averagefor <strong>to</strong>p 2diseases<strong>10</strong>Incidence ishigher thannational averagefor all <strong>to</strong>p 3diseases 12 cities (<strong>10</strong>.6%) had lower rates for one of <strong>the</strong> <strong>to</strong>p illnesses six urban centers (5.0%) had higher averages compared <strong>to</strong> <strong>the</strong> national average fortwo <strong>to</strong>p ailments <strong>10</strong> cities (9.7%) had higher averages compared <strong>to</strong> <strong>the</strong> national average for all <strong>the</strong> <strong>to</strong>pthree sicknessesTarget: Provision of Sanitary ToiletsFigure <strong>19</strong>.8 Estimated Number of Households With No Sanitary Toilets in <strong>10</strong>9 Cities, PY 2004Number of Households721,657800,000700,000600,000500,000185,816229,280293,895400,000300,000200,00046,040<strong>10</strong>0,000Mindanao SuperRegionCentral PhilippinesMetro Luzon UrbanBeltwayNor<strong>the</strong>rn LuzonAgribusinessQuadrangleNational Total-Super Regions158 STRATEGIC LINK TO THE MILLENNIUM DEVELOPMENT GOALS
Forest Cover. Forest cover in <strong>the</strong> forest lands in <strong>the</strong> urban centers in <strong>the</strong> Philippines wascontinuously declining. In 2004, <strong>the</strong> average forest cover reported by 62 cities s<strong>to</strong>od a<strong>to</strong>nly 56% (see Figure <strong>19</strong>.9). The urban centers in <strong>the</strong> MLUB had <strong>the</strong> highest remainingforest cover at 74%. This was followed by those in <strong>the</strong> MSR with 55% and <strong>the</strong> NLAQwith 51%. The lowest forest cover was in <strong>the</strong> cities in <strong>the</strong> CP with 46%.The forest cover in <strong>the</strong> cities was complemented by <strong>the</strong> annual reforestation activitiesimplemented by <strong>the</strong> urban centers. In 2004, a <strong>to</strong>tal of 32 cities reported <strong>the</strong>ir respectivereforestation activities in <strong>the</strong>ir forestlands, tree parks, and greenbelts areas. Urban centersin <strong>the</strong> MLUB registered <strong>the</strong> highest reforestation effort at 65%. Cities in <strong>the</strong> NLAQ andMSR both recorded 46% reforestation rates, while those in <strong>the</strong> CP had 36%.Coral Reef. Coral reefs are also at critical level. Only 50% of coastal cities reported 80%<strong>to</strong><strong>10</strong>0% intact coral reefs remaining. The rest of <strong>the</strong> urban centers had declining live coralreefs remaining. In 2004, <strong>the</strong> 12 cities in <strong>the</strong> MSR recorded <strong>the</strong> highest remaining livecorals at 66%. This was closely followed by <strong>the</strong> four cities in <strong>the</strong> MLUB with 65%remaining live coral reefs. The three cities in <strong>the</strong> NLAQ, meanwhile, registered 48%remaining live corals while <strong>the</strong> lowest was recorded in CP at 37%.Target: Achieve significant improvements in <strong>the</strong> lives of <strong>the</strong> slum dwellersInformal Settlements. About 13.3% of <strong>the</strong> <strong>to</strong>tal households in <strong>the</strong> cities are living ininformal settlements or makeshift houses. This was translated <strong>to</strong> about 587,000households living in informal settlements or makeshift houses in 2004 (see Figure <strong>19</strong>.<strong>10</strong>).Of this number, <strong>the</strong> cities in <strong>the</strong> MLUB had <strong>the</strong> highest percentage share of informalsettlements at 63% or about 369,000 households. Those in <strong>the</strong> CP and MSR had onlyover <strong>10</strong>5,000 and 148,000, respectively. The lowest number of informal settlements wasin NLAQ with over 44,000 households.One of <strong>the</strong> compounding problems on informal settlements is electrification. On <strong>the</strong>average, 79.3% of <strong>the</strong> <strong>to</strong>tal households in <strong>the</strong> cities had electricity. Such average waswithin <strong>the</strong> suggested benchmark level under <strong>the</strong> LGPMS. But <strong>the</strong> remaining 21% ofhouseholds with no access <strong>to</strong> electricity in 2004 was equivalent <strong>to</strong> an estimated 948,000households.The volume of households with no electricity was in <strong>the</strong> MLUB with an estimated334,000 households. This was followed by <strong>the</strong> MSR with 294,000 households and CPwith 265,000. NLAQ registered <strong>the</strong> lowest number of households with no electricity at77,000.160 STRATEGIC LINK TO THE MILLENNIUM DEVELOPMENT GOALS
Figure <strong>19</strong>.<strong>10</strong> Number of Households Living in Informal Settlements in 97 Cities and Number ofHouseholds with No Access <strong>to</strong> Electricity in <strong>10</strong>8 Cities, PY 2004PY 2004Number of Households1,000,000900,000800,000700,000600,000500,000400,000300,000200,000<strong>10</strong>0,000-National Total Nor<strong>the</strong>rn LuzonAgribusinessMetro LuzonQuadrangleUrban BeltwaySuper RegionsCentralPhilippinesMindanaoSuper RegionNumber of Households Living in Informal SettlementsNumber of Households without ElectricityL OCALIZATION OF THE MDGThe roles of <strong>the</strong> LGUs in <strong>the</strong> realization of <strong>the</strong> MDGs cannot be overemphasized. TheLGUs are at <strong>the</strong> forefront of service delivery in <strong>the</strong>ir respective areas. Moreover, <strong>the</strong>y canprovide <strong>the</strong> leadership, direction, and influence in managing programs and projectsdirected <strong>to</strong>wards reducing poverty. LGPMS, on <strong>the</strong> o<strong>the</strong>r hand, can provide <strong>the</strong>policymakers, and <strong>the</strong> resource and donor institutions with pictures of internalcapabilities and areas of priorities of <strong>the</strong> LGUs.Localizing <strong>the</strong> MDG for Poverty Reduction: LGUs Efforts, Contributions, andProductivity in Reducing PovertyThe efforts of <strong>the</strong> 117 cities in poverty reduction were measured through LGPMS,particularly <strong>the</strong> productivity of LGUs concerning <strong>the</strong> generation of jobs, <strong>the</strong> expansion ofenterprises, <strong>the</strong> provision of agriculture and fishery programs <strong>to</strong> farmers and fisherfolks,and <strong>the</strong> creation of an environment conducive <strong>to</strong> local investments and industry<strong>development</strong>.STATE OF CITIES OF THE PHILIPPINES 161Administrative Capacities, Productivity and Development Conditions
In 2004, <strong>the</strong> following were <strong>the</strong> accomplishments of <strong>the</strong> cities: About 76% of all <strong>the</strong> urban centers were able <strong>to</strong> generate jobs and expand enterprises Over 60% of <strong>the</strong> fishing and farming households were members of <strong>the</strong> cooperativesand o<strong>the</strong>r collective organizations More than 60% of <strong>the</strong> farming and fishing households directly benefited fromagricultural and fishery <strong>development</strong> programs initiated by <strong>the</strong> cities Around 93% of <strong>the</strong> barangays in all <strong>the</strong> urban centers were connected <strong>to</strong> <strong>the</strong>ir citycenters Roughly 90% of <strong>the</strong> cities had formulated and passed <strong>the</strong>ir respective LIICsFur<strong>the</strong>rmore, <strong>the</strong> urban centers had specifically targeted focus groups in <strong>the</strong> expenditureprograms for <strong>the</strong>ir 20% <strong>development</strong> fund. Over 60% of <strong>the</strong> 20% <strong>development</strong> fundswere spent for <strong>the</strong> population in need. Also, majority of <strong>the</strong> cities involved <strong>the</strong> NGOs ando<strong>the</strong>r peoples’ organizations in implementing <strong>the</strong>ir respective priority projects financedby <strong>the</strong> 20% <strong>development</strong> funds.The urban centers in <strong>the</strong> Philippines were ready <strong>to</strong> be actively involved in povertyreduction measures. This was shown by <strong>the</strong>ir emerging administrative capacities forproviding services and programs that would help reduce poverty and facilitate <strong>the</strong>creation of jobs, <strong>the</strong> promotion of investments, <strong>the</strong> expansion of enterprises, and <strong>the</strong>generation of income in <strong>the</strong> cities including <strong>the</strong> following: Existence of functional Small- and Medium-Term Development Councils Implementation of LIICs Presence of <strong>development</strong> activities <strong>to</strong> support improvements in farming and fisherypractices Availability of LGU research and <strong>development</strong> facilities <strong>to</strong> support farmers andfisherfolks in testing and adopting new projects and practices Accessibility of basic infrastructure and facilities in <strong>the</strong> areas zoned for business andindustryLocalizing <strong>the</strong> MDG for achieving primary universal education, for eliminatingdisparity in secondary education, and for promoting gender equalityMost of <strong>the</strong> cities in <strong>the</strong> Philippines had adequate capacity in delivering <strong>the</strong> necessaryinputs that would complement NG’s services <strong>to</strong> ensure <strong>the</strong> availability of primaryeducation <strong>to</strong> all elementary school age population in <strong>the</strong> cities. About 73% of all <strong>the</strong> urban centers had functioning LSBs Around 87% of all cities had operational barangay DCCs A better ratio of extension class teachers <strong>to</strong> pupils at 1:38 funded by SEF. A <strong>to</strong>tal of 54% of <strong>the</strong> urban centers had very high capacity in providing extensionteachers <strong>to</strong> complement DepEd’s teaching force. A satisfac<strong>to</strong>ry ratio of extension classrooms <strong>to</strong> pupils at 1:34, which was within <strong>the</strong>standards set by <strong>the</strong> HLURB. A <strong>to</strong>tal of 52% of <strong>the</strong> cities had available funds <strong>to</strong> construct additional classrooms.162 STRATEGIC LINK TO THE MILLENNIUM DEVELOPMENT GOALS
All <strong>the</strong> 117 urban centers had existing non-formal and extension educationprogramsOn <strong>the</strong> whole, <strong>the</strong> cities’ own efforts in encouraging all <strong>the</strong> secondary school agepopulation <strong>to</strong> enroll in secondary education was relatively high at 84% compared <strong>to</strong> <strong>the</strong>nationwide net enrolment rate reported by DepEd at 47%. The corresponding rates forLuzon with 50 urban centers, Visayas with 28, and Mindanao with 27 were 98.55%,90.39%, and 78.40%, respectively.Promoting Gender Equality. In <strong>the</strong> area of GAD, 89% of <strong>the</strong> cities in <strong>the</strong> Philippines hadsufficient capacities in preparing <strong>the</strong>ir GAD Plans. Meanwhile, 57 urban centers hadalready existing GDCs. Also, 98% of <strong>the</strong> 116 cities had sufficient capacities inimplementing Women’s and Children’s Protection Program.Localizing <strong>the</strong> MDG for reducing children mortality and improving overall healthconditionThe contribution of cities in <strong>the</strong> Philippines <strong>to</strong> <strong>the</strong> improvement of children’s healthcondition was reflected in <strong>the</strong> service coverage for immunization. A <strong>to</strong>tal of 115 urbancenters indicated about 87% immunization coverage. Cities in Luzon had <strong>the</strong> highestimmunization coverage at 87% while those in <strong>the</strong> Visayas and Mindanao at 82% and89%, respectively.Likewise, <strong>the</strong> cities in <strong>the</strong> Philippines had <strong>the</strong> necessary administrative and basic healthfacilities, which ensure that related services, particularly those pertaining <strong>to</strong> children,women and general health were addressed: About 84% of <strong>the</strong> urban centers had functioning LHBs Around 71% of all <strong>the</strong> barangays in <strong>the</strong> cities had operational BHCs Roughly 71% of <strong>the</strong> urban centers had exceeded <strong>the</strong> standard ratio of one nurse per15,000 population More than 50% of <strong>the</strong> cities had exceeded <strong>the</strong> minimum requirements for <strong>the</strong>number of doc<strong>to</strong>rs (1:20,000 population) and midwives (1:5,000 population). Approximately one out of four urban centers fare adequately in <strong>the</strong> number ofdentists (1:20,000 population)Localizing <strong>the</strong> MDG <strong>to</strong>wards environmental sustainabilityThe NRM efforts of <strong>the</strong> cities were encouraging especially against <strong>the</strong> backdrop ofcontinuing degradation of <strong>the</strong> country’s natural resources. In 2004, a <strong>to</strong>tal of <strong>19</strong> urbancenters had reported very high productivity in terms of reforestation with coverage of70% <strong>to</strong> <strong>10</strong>0%. Ano<strong>the</strong>r 13 cities had reforested about 50% of <strong>the</strong>ir forestlands, greenbeltsand tree parks.In summary, LGPMS provided <strong>the</strong> following performance indica<strong>to</strong>rs for <strong>the</strong> overallcapacities of <strong>the</strong> cities in managing <strong>the</strong> natural resources, and in improvingSTATE OF CITIES OF THE PHILIPPINES 163Administrative Capacities, Productivity and Development Conditions
environmental sustainability: Majority of <strong>the</strong> urban centers had established partnerships with communityorganizations that manage natural resources 58 cities had formulated and passed <strong>the</strong>ir respective Environmental Codes, whichdefine <strong>the</strong>ir strategies for environmental protection All urban centers had <strong>the</strong> required capacities for preparing CLUPs and CDPs 66 cities had existing housing programs in place, and completing over 80% of <strong>the</strong>targeted housing construction in 2004 42% of <strong>the</strong> urban centers had achieved <strong>the</strong> manda<strong>to</strong>ry reduction of 25% of solidwastes through recycling and composting programs 30 cities had instituted stricter pollution control measures among its establishedindustries 80% of <strong>the</strong> urban centers had sufficient capability in formulating qualityenvironmental ordinances 72% of <strong>the</strong> cities had reached at least 70% of <strong>the</strong>ir barangays for <strong>the</strong>ir IECconservation campaigns 50 urban centers had started implementing mangrove conservation and rehabilitationprograms 95% of <strong>the</strong> cities had organized <strong>the</strong>ir SWMBs where 67 urban centers had prepared<strong>the</strong>ir <strong>10</strong>-year SWMPs164 STRATEGIC LINK TO THE MILLENNIUM DEVELOPMENT GOALS


