Solution Architecture Report - IRDA
Solution Architecture Report - IRDA
Solution Architecture Report - IRDA

You also want an ePaper? Increase the reach of your titles
YUMPU automatically turns print PDFs into web optimized ePapers that Google loves.
<strong>Solution</strong><strong>Architecture</strong> -<strong>IRDA</strong> BusinessAnalytics ProjectNov2010
<strong>Solution</strong> <strong>Architecture</strong> Document - <strong>IRDA</strong> Business Analytics ProjectTable of ContentsList of Abbreviations Used with Their Definition .......................................................................................... 5List of Terms Used with Their Definition ...................................................................................................... 91. Executive Summary ......................................................................................................................... 141.1 Introduction ................................................................................................................................ 141.2 <strong>Solution</strong> <strong>Architecture</strong> .................................................................................................................. 142. Objectives of the Business Analytics <strong>Solution</strong> ................................................................................ 173. Key Business Drivers ....................................................................................................................... 174. <strong>Solution</strong> Themes ............................................................................................................................. 185. Present IT Infrastructure at <strong>IRDA</strong> .................................................................................................... 195.1 Existing applications used in <strong>IRDA</strong> .............................................................................................. 195.2 Existing applications and their status: ........................................................................................ 206. Data Management Challenges ........................................................................................................ 217. <strong>Solution</strong> <strong>Architecture</strong> Components ................................................................................................ 237.1 Reference <strong>Architecture</strong> ............................................................................................................... 237.2 Functional <strong>Architecture</strong> .............................................................................................................. 257.3 List of interfaces for the Business Analytics <strong>Solution</strong> ................................................................. 307.4 Delivery Channel <strong>Architecture</strong> (Information View) .................................................................... 317.5 Application <strong>Architecture</strong> ............................................................................................................. 378. <strong>Architecture</strong> Considerations and Constraints ................................................................................. 439. Interoperability Aspects of Business Analytics <strong>Solution</strong> ................................................................. 459.1 Challenges of Interoperability ..................................................................................................... 459.2 Technology Considerations for Interoperability ......................................................................... 4610. Conceptual Data Model Design ...................................................................................................... 4710.1 Overview ..................................................................................................................................... 47Business Analytics Project Page 2
<strong>Solution</strong> <strong>Architecture</strong> Document - <strong>IRDA</strong> Business Analytics Project16.6 Data and Document Migration Methodology ............................................................................ 8316.7 Data Archiving Strategy............................................................................................................... 8616.8 Physical and Analog Data Conversion tools and techniques ...................................................... 8716.9 Risks and challenges in Data Migration ...................................................................................... 89Appendix ..................................................................................................................................................... 91A. Department wise data model ......................................................................................................... 91B. Indicative List of Dimensions with their values and attributes ..................................................... 204C. Data Sizing Estimate for the <strong>IRDA</strong> BAP <strong>Solution</strong> ........................................................................... 211a) Life Department ............................................................................................................................ 212b) Non Life General Department ....................................................................................................... 213c) Non Life Reinsurance Department ................................................................................................ 214d) Health Department ....................................................................................................................... 215e) Actuarial Department ................................................................................................................... 216f) Intermediaries- Brokers Department ............................................................................................ 217g) F&A Department ........................................................................................................................... 218h) Total physical space Estimation .................................................................................................... 218i) Server Load Estimation ................................................................................................................. 219D. CDC and DR Specification .............................................................................................................. 221E. Technical details of Security for <strong>IRDA</strong> Business Analytics <strong>Solution</strong>............................................... 228F. Security Settings for <strong>IRDA</strong> Business Analytics Project .................................................................. 244G. Data Archiving Procedures and Guidelines for <strong>IRDA</strong> Business Analytics <strong>Solution</strong> ........................ 246H. Existing applications at <strong>IRDA</strong> with their details ............................................................................ 250Business Analytics Project Page 4
<strong>Solution</strong> <strong>Architecture</strong> Document - <strong>IRDA</strong> Business Analytics ProjectList of Abbreviations Used with Their DefinitionAbbreviationsACLADSANSIAPIATIB2BBCPCBACCDC/DCCOMDDDMZDNSDRCDRMDTLSDescriptionAn access control list (ACL) is a list of permissions attached to an object. An ACLspecifies which users--or system processes--are granted access to objects, as well aswhat operations are allowed to be performed on given objects.Active Directory Server (ADS) is a technology created by Microsoft that provides avariety of network servicesThe American National Standards Institute (ANSI) is a private non-profit organizationthat oversees the development of voluntary consensus standards for products,services, processes, systems, and personnel in the United StatesAn application programming interface (API) is an interface implemented by a softwareprogram to enable interaction with other softwareAgent Training InstitutesBusiness - to - BusinessBusiness continuity planning (BCP) is the creation and validation of a practicedlogistical plan for how an organization will recover and restore partially or completelyinterrupted critical (urgent) functions within a predetermined time after a disaster orextended disruption. The logistical plan is called a business continuity plan.Context-based access control (CBAC) intelligently filters TCP and UDP packets based onapplication layer protocol session information and can be used for intranets, extranetsand internets.Centralized Data Center or Data Center is a facility used to house computer systemsand associated components, such as telecommunications and storage systems.COM (hardware interface) (COM) is a serial port interface on IBM PC-compatiblecomputers running Microsoft Windows or MS-DOSDeputy DirectorThe Demilitarized Zone (DMZ) is a critical part of a firewall: it is a network that isneither part of the un trusted network, nor part of the trusted networkThe Domain Name System (DNS) is a hierarchical naming system for computers,services, or any resource connected to the Internet or a private networkA Disaster Recovery Center (DRC) is a backup site is a location where an organizationcan easily relocate following a disaster, such as fire, flood, terrorist threat or otherdisruptive event.Disaster Recovery Management (DRM) is the process, policies and procedures relatedto preparing for recovery or continuation of technology infrastructure critical to anorganization after a natural or human-induced disaster.The Datagram Transport Layer Security (DTLS) protocol provides communicationsprivacy for datagram protocols.Business Analytics Project Page 5
<strong>Solution</strong> <strong>Architecture</strong> Document - <strong>IRDA</strong> Business Analytics ProjectAbbreviationsODSOLAPRBACRPCRPORTOSAMLSANSIPSLASOAPSQLSSLSSOTATTCPDescriptionAn operational data store (ODS) is a database designed to integrate data from multiplesources to make analysis and reporting easierOnline analytical processing (OLAP) is an approach to quickly answer multidimensionalanalytical queriesRole-based access control (RBAC) is an approach to restricting system access toauthorized users.Remote procedure call (RPC) is an Inter-process communication technology thatallows a computer program to cause a subroutine or procedure to execute in anotheraddress space (commonly on another computer on a shared network) without theprogrammer explicitly coding the details for this remote interaction.Recovery Point Objective (RPO) is the point in time to which you must recover data asdefined by your organization. This is what an organization determines is an"acceptable loss" in a disaster situation.Recovery Time Objective (RTO) is the duration of time and a service level within whicha business process must be restored after a disaster (or disruption) in order to avoidunacceptable consequences associated with a break in business continuity.Security Assertion Markup Language (SAML) is an XML-based standard for exchangingauthentication and authorization data between security domains, that is, between anidentity provider (a producer of assertions) and a service provider (a consumer ofassertions)A Storage area network (SAN), an architecture to attach remote computer storagedevices to servers in such a way that the devices appear as locally attached to theoperating systemThe Session Initiation Protocol (SIP) is a signaling protocol, widely used for controllingmultimedia communication sessions such as voice and video calls over InternetProtocol (IP)Service Level Agreement (SLA) is a part of a service contract where the level of serviceis formally defined. SLA is sometimes used to refer to the contracted delivery time (ofthe service) or performance.SOAP, originally defined as Simple Object Access Protocol, is a protocol specificationfor exchanging structured information in the implementation of Web Services incomputer networks.SQL (Structured Query Language) is a database computer language designed formanaging data in relational database management systems (RDBMS)Secure Sockets Layer (SSL) is a cryptographic protocol that provides security forcommunications over networks such as the InternetSingle sign-on (SSO) is a property of access control of multiple, related, butindependent software systemsTurn Around TimeThe Transmission Control Protocol (TCP) is one of the core protocols of the InternetProtocol Suite.Business Analytics Project Page 7
<strong>Solution</strong> <strong>Architecture</strong> Document - <strong>IRDA</strong> Business Analytics ProjectAbbreviationsTLSTPAUDPUMLVoIPDescriptionTransport Layer Security (TLS) is a cryptographic protocol that provides security forcommunications over networks such as the InternetThird Party AgentsThe User Datagram Protocol (UDP) is one of the core members of the InternetProtocol Suite, the set of network protocols used for the Internet.Unified Modeling Language (UML) is a standardized general-purpose modelinglanguage in the field of software engineering.Voice over Internet Protocol (VoIP) is a general term for a family of transmissiontechnologies for delivery of voice communications over IP networks such as theInternet or other packet-switched networks.VPN A virtual private network (VPN) encapsulates data transfers between two ormore networked devices not on the same private network so as to keep thetransferred data private from other devices on one or more intervening local or widearea networks.WANA wide area network (WAN) is a computer network that covers a broad area (i.e., anynetwork whose communications links cross metropolitan, regional, or nationalboundariesXMLXML (Extensible Markup Language) is a set of rules for encoding documentselectronicallyBusiness Analytics Project Page 8
<strong>Solution</strong> <strong>Architecture</strong> Document - <strong>IRDA</strong> Business Analytics ProjectList of Terms Used with Their DefinitionTermsDescriptionApplication Server An application server is a software framework dedicated to theefficient execution of procedures (programs, routines, scripts) forsupporting the construction of applications.Audit loggingBiometricsBusiness IntelligenceBusiness process managementCaching/cacheConceptual data modelContent ManagementContext based accessAudit log is a chronological sequence of audit records, each of whichcontains evidence directly pertaining to and resulting from theexecution of a business process or system function.Biometrics comprises methods for uniquely recognizing humans basedupon one or more intrinsic physical or behavioral traits.Business Intelligence (BI) refers to computer-based techniques used inspotting, digging-out, and analyzing business data, such as salesrevenue by products and/or departments or associated costs andincomes.Business process management (BPM) is a management approachfocused on aligning all aspects of an organization with the wants andneeds of clients.a cache is a component that improves performance by transparentlystoring data such that future requests for that data can be servedfaster. The data that is stored within a cache might be values that havebeen computed earlier or duplicates of original values that are storedelsewhere.A conceptual data model is a map of concepts and their relationships.This describes the semantics of an organization and represents a seriesof assertions about its nature.Content management, or CM, is the set of processes and technologiesthat support the collection, managing, and publishing of information inany form or medium. In recent times this information is typicallyreferred to as content or, to be precise, digital content.Context-based access control intelligently filters TCP and UDP packetsbased on application layer protocol session information and can beused for intranets, extranets and internetsBusiness Analytics Project Page 9
<strong>Solution</strong> <strong>Architecture</strong> Document - <strong>IRDA</strong> Business Analytics ProjectTermsData EncryptionData IntegrityDescriptionData encryption is the process of transforming information (referred toas plaintext) using an algorithm (called cipher) to make it unreadable toanyone except those possessing special knowledge, usually referred toas a key.Data integrity is data that has a complete or whole structure. Allcharacteristics of the data including business rules, rules for how piecesof data relate dates, definitions and lineage must be correct for data tobe complete.Data Mapping Data mapping is the process of creating dataelement mappings between two distinct data models.Data ProfilingDatabase IndexData profiling is the process of examining the data available in anexisting data source and collecting statistics and information about thatdata.A database index is a data structure that improves the speed of dataretrieval operations on a database table at the cost of slower writesand increased storage space.Database Server A database server is a computer program thatprovides database services to other computer programs or computers,as defined by the client–server model.Digital SignatureA digital signature is a mathematical scheme for demonstrating theauthenticity of a digital message or document. A valid digital signaturegives a recipient reason to believe that the message was created by aknown sender, and that it was not altered in transit.Digitization Digitization is the representation ofan object, image, sound, document or a signal (usually an analog signal)by a discrete set of its points or samples.FirewallFTPA firewall is a part of a computer system or network that is designed toblock unauthorized access while permitting authorizedcommunications.File Transfer Protocol (FTP) is a standard network protocol used to copya file from one host to another over a TCP/IP-based network, such asthe Internet.Business Analytics Project Page 10
<strong>Solution</strong> <strong>Architecture</strong> Document - <strong>IRDA</strong> Business Analytics ProjectTermsKnowledge ManagementLoad BalancingDescriptionKnowledge management (KM) comprises a range of strategies andpractices used in an organization to identify, create, represent,distribute, and enable adoption of insights and experiences. Suchinsights and experiences comprise knowledge, either embodied inindividuals or embedded in organizational processes or practiceLoad balancing is a technique to distribute workload evenly across twoor more computers, network links, CPUs, hard drives, or otherresources, in order to get optimal resource utilization, maximizethroughput, minimize response time, and avoid overload.Metadata management Meta-data Management involves storing information about otherinformation. With different types of media being used references tothe location of the data can allow management of diverse repositories.MISMultifactor authenticationOperational Data StoreA management information system (MIS) is a system or process thatprovides information needed to manage organizations effectivelyMulti-factor authentication means two or more of the authenticationfactor required for being authenticated.An operational data store (or "ODS") is a database designed tointegrate data from multiple sources to make analysis and reportingeasier.Payment Gateway A payment gateway is an e-commerce application serviceprovider service that authorizes payments for e-businesses, onlineretailers, bricks and clicks, or traditional brick and mortar. It is theequivalent of a physical point of sale terminal located in most retailoutlets.Physical Data ModelPortletsProxy ServerA physical data model (database design) is a representation of a datadesign which takes into account the facilities and constraints of a givendatabase management system.Portlets are pluggable user interface software components that aremanaged and displayed in a web portal. Portlets produce fragments ofmarkup code that are aggregated into a portal page.A proxy server is a server (a computer system or an applicationprogram) that acts as an intermediary for requests from clients seekingresources from other servers.Business Analytics Project Page 11
<strong>Solution</strong> <strong>Architecture</strong> Document - <strong>IRDA</strong> Business Analytics ProjectTermsRole based accessRouterDescriptionRole-based access control is an approach to restricting system access toauthorized usersA router is a device that interconnects two or more computernetworks, and selectively interchanges packets of data between them.SOA A Service-Oriented <strong>Architecture</strong> (SOA) is a flexible setof design principles used during the phases of developmentand integration. A deployed SOA-based architecture will provide aloosely-integrated suite of services that can be used within multiplebusiness domains.SSL encryptionStorage Area NetworkSystem IntegrityTokenUniversal Serial BusVirtual TokenWeb GardeningAn SSL encryption establishes a private communication channelenabling encryption of the data during transmission. Encryptionscrambles the data, essentially creating an envelope for messageprivacy.A storage area network (SAN) is an architecture to attach remotecomputer storage devices (such as disk arrays, tape libraries,and optical jukeboxes) to servers in such a way that the devices appearas locally attached to the operating system.The state that exists when there is complete assurance that under allconditions an IT system is based on the logical correctness andreliability of the operating system, the logical completeness ofthe hardware and software that implement the protectionmechanisms.A security token is a physical device that an authorized user ofcomputer services is given to ease authentication.Universal Serial Bus (USB) is a specification to establish communicationbetween devices and a host controller (usually personal computers).Virtual tokens are a new concept in multi-factor authentication whichreduce the costs normally associated with implementation andmaintenance of multi-factor solutions by utilizing the user's existinginternet device as the "something the user has" factor.The scalability on multiprocessor machines can be enhanced by loadbalancing, each with processor affinity set to its CPU. The technique iscalled Web gardening, and can dramatically improve the performanceBusiness Analytics Project Page 12
<strong>Solution</strong> <strong>Architecture</strong> Document - <strong>IRDA</strong> Business Analytics ProjectTermsof application.DescriptionWeb ServerWeb ServicesA web server is a computer program that delivers (serves) content,such as web pages, using the Hypertext Transfer Protocol (HTTP), overthe World Wide Web.Web services are typically application programming interfaces (API)or web APIs that are accessed via Hypertext Transfer Protocol andexecuted on a remote system hosting the requested services.Business Analytics Project Page 13
<strong>Solution</strong> <strong>Architecture</strong> Document - <strong>IRDA</strong> Business Analytics Project1. Executive Summary1.1 IntroductionPost AS IS study, Requirement gathering activity across all the eight departments under consideration ofthis project was started. Based on the requirements study and keeping in mind the differentfunctionalities to be expected out of the solution, the next stage was to propose and design a technicalplatform which would support all such functionalities. The purpose of this document is to provide thedesign the architecture of the envisaged business analytics solution based on the functionalrequirements.1.2 <strong>Solution</strong> <strong>Architecture</strong>Presently various external entities including Insurers are submitting data to <strong>IRDA</strong> in hardcopy documentsor in softcopies sent over email or through the memory disk. There is no central storage of data andreporting system in place so as to generate relevant information out of the raw data in form of reportsor analysis. To eliminate the cumbersome and complex manual processes involved in generatinginformation from the raw data, the envisaged solution needs to be designed in such a manner all thedifferent manual processes will be automated and correct information will be available to the businessusers at right point and with respect to the appropriate context.The overarching objective of the Business Analytics solution is to provide necessary data andinformation for analyzing the insurance companies and regulatory decision making.For designing the solution architecture, the system requirements have been considered as one of thekey input. Based on both functional and system requirements different views of the solution has beenrepresented to describe the entire solution in details.The architecture section includes following components:Business Analytics <strong>Solution</strong> <strong>Architecture</strong>o Reference <strong>Architecture</strong> - Gives an overview of the entire solution containing the keycomponents of the solution.o Functional View - Elaborates various functional components of the envisaged solution. Thefunctional components have been identified based on the functional requirements specified bythe business users across departments and across levels during the requirement gatheringactivities.o Overall envisaged technology platform of <strong>IRDA</strong> system will comprise of a set of applications andservices. A number of services will be hosted for internal consumption; typically to manage thebusiness processes and functions of <strong>IRDA</strong> as an organization and some external services throughcontent, data and application level integration will also be rendered through this platform to theinsurer, <strong>IRDA</strong> customers, employees and management team.o The functional view comprises of the following services / applications:Business Analytics Project Page 14
<strong>Solution</strong> <strong>Architecture</strong> Document - <strong>IRDA</strong> Business Analytics ProjectPlatform Management ServicesSecurity Services: Standard authentication and authorization services, applicationregistration and strong auditing capabilities for the transactions and other pertinentdetails. Application Management Services: Along with the set of services provided in a typicalapplication server environment, typical IT and SLA management servicesInformation Dissemination/Rendering Services <strong>IRDA</strong> Portal: The portal will provide a platform for the extended enterprise to bemanaged. It will therefore expose both enterprise applications and a number offunctional applications to the extended enterpriseBusiness Applications and ServicesBusiness Applications: These will be offered as a platform to <strong>IRDA</strong>. This platform will berun on the internal environment and will be accessible, to differing extents, through thechannels of information dissemination through defined integration touch points. Internal Applications: Hosted enterprise application suite is expected to be in place tomanage the internal operations of <strong>IRDA</strong> in various departments.Application Design/Integration ServicesoServices Design and Maintenance Platform: Comprises of an integrated developmentenvironment providing an interface to maintain services based on the relevantdevelopment framework. Data Integration: Data will be resident in multiple repositories of the platform. Some ofthe data assets might also reside outside the platform in the database of specificapplication provider e.g. agency portal systemInformation View - This view of the architecture elaborates the flow of information rightfrom its point of acquisition to its point of consumption by the various stakeholdersFollowing are the layers / components of the Information view through which informationpasses:Data Acquisition LayerData Aggregation and Storage LayerBusiness Access LayerInformation Delivery LayerInformation Consumer LayeroApplication View - Elaborates the applications to fit the Functional requirement of thesystem and to support the Information flow in the system. The application view assumes allthe different applications spread across departments would be accessible from the portalusing a central integration layer.Business Analytics Project Page 15
<strong>Solution</strong> <strong>Architecture</strong> Document - <strong>IRDA</strong> Business Analytics ProjectoInfrastructure View - Elaborates the Infrastructure need of <strong>IRDA</strong> to support the applicationsthat has been proposed in the previous view. The infrastructure view comprises of thefollowing components:Central Data Centre (CDC) and Disaster Recovery (DR) site specificationsBusiness Continuity PlanHardware InfrastructureNetwork ConfigurationScalability PlanoSecurity Framework and <strong>Architecture</strong> - Elaborates the security need of <strong>IRDA</strong> to safeguardthe data, information, other contents, applications from various internal and externalsecurity threats. This section describes the different methods, processes and mechanismssuch as access control, authentications and encryption mechanisms through advancedsolutions like biometric devices and digital signatureBusiness Analytics Project Page 16
<strong>Solution</strong> <strong>Architecture</strong> Document - <strong>IRDA</strong> Business Analytics Project4. <strong>Solution</strong> ThemesBased on the objectives, the following themes are identified for the envisaged solution. These themesare the guiding factors in designing the envisaged solution.<strong>Solution</strong> ThemeSingle version of truthReduced manual interventionEnhanced Analysis capabilityWorkflow and NotificationTransparencyInformation DisseminationDescriptionA centralized de-duplicated database – all the departments in theAuthority will utilize that database to enable cross functional andconsistent analysisReduce the time and effort spent both at Insurer end and <strong>IRDA</strong> endto manage the dataThe evolving analysis need of the authority to safeguard the Insuredand Insurers and support wholesome growth in the sectorManaging the activities, follow-up action, corrective action etc ontimeMake information available within <strong>IRDA</strong> from DD level to theChairman level without any dependency on individual wishShare and distribute the information to various internal andexternal stakeholders with role base access controlBusiness Analytics Project Page 18
<strong>Solution</strong> <strong>Architecture</strong> Document - <strong>IRDA</strong> Business Analytics Project5. Present IT Infrastructure at <strong>IRDA</strong>5.1 Existing applications used in <strong>IRDA</strong>Along with the gathering of functional requirements from the different departments, a study regardingthe existing IT environment for <strong>IRDA</strong> was also conducted. The findings of the study were based on theinputs from the IT department and the different documents containing specifications of the existingoperational applications used in the organization. The current IT system landscape of <strong>IRDA</strong> can bedivided in to two parts. Web based and non web based systems. Presently <strong>IRDA</strong> has three websites andthe different web based modules/components under each of them are the shown as the following:www.irda.gov.in:oooooooContent Management – Used for storing, controlling, versioning, and publishing industry-specificdocumentation such as news articles, operators' manuals, technical manuals, sales guides, andmarketing brochuresBrokers Online Filing – Used for filling up online forms for registering the brokers with <strong>IRDA</strong>. Thisfacility is available online in this portal.Grievance Management - The grievance management system tracks the new complaint,forwarded complaints, update status of complaints, rending the insurers and generating somecustomized reports on the basis of the complaints.New Business Statistics – This module is designed to capture new business data for both life andnon life departmentAdvertisement - This module is designed to track the details advertisements for each insurer.The module also tracks those advertisements that are released by intermediaries.Third Party Administrator - This module is designed to track the details of the third partyadministratorsSurveyor Licensing System - Surveyor Licensing Module is developed to track the information onthe surveyor. It consists of the pre-defined HTML forms which are robust and secure.www.irdaindia.org:oAgency Licensing Portal - This is a system developed for online licensing of the agents andcorporate agentswww.irdaonline.org:Presently there are no components hosted in this website. This website is used for informationgathering purpose only.Business Analytics Project Page 19
<strong>Solution</strong> <strong>Architecture</strong> Document - <strong>IRDA</strong> Business Analytics ProjectThe non web based solutions at <strong>IRDA</strong> at present are the following:Receipt and Inward System - Tracking of inward mails /office notesMIS - Collecting Regulatory returns from Insurers and Generating AnalysisATI Database - Capturing new application details of ATIs (both Online / Off-line)5.2 Existing applications and their status:As of now following is the current status of the different applications in terms of usage:ApplicationWeb Based/ Non-webbasedDevelopmentStatusCurrentlyused ornotInternet/Intranet/OthersContentManagementModuleBrokers OnlineFilingGrievanceManagement(Life & Non-Life)Web Based(www.irda.gov.in)Web Based(www.irda.gov.in)Web Based(www.irda.gov.in)Finished In Place InternetFinished In Place InternetFinished In Place IntranetNew BusinessStatistics (Life& Non-Life)Web Based(www.irda.gov.in)FinishedCurrentlyNot UsedNAAdvertisementWeb Based(www.irda.gov.in)FinishedCurrentlyNot UsedNATPA OnlineFilingWeb Based(www.irda.gov.in)Developmentis not overyetNANAOnline AgentRegistrationWebBased(www.irdaonline.org)Finished In Place InternetReceipt andInward SystemMISNon Web Based Finished In Place Stand Alone ModeNon Web Based Finished Currently Not NAin UsePlease refer to the Appendix H of the appendix section for details of all the above mentioned systemsgathered from the inputs of the IT department and other supporting documents.Business Analytics Project Page 20
<strong>Solution</strong> <strong>Architecture</strong> Document - <strong>IRDA</strong> Business Analytics ProjectBusiness Analytics Project Page 22
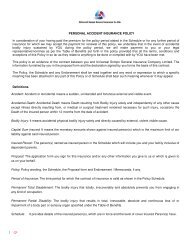
<strong>Solution</strong> <strong>Architecture</strong> Document - <strong>IRDA</strong> Business Analytics Project7. <strong>Solution</strong> <strong>Architecture</strong> ComponentsFor designing the solution architecture, the system requirement has been considered as one of the keyinput. These system requirements have been divided into the Functional Requirement and Systemrequirement of the solution. Based on both functional and system requirements different views of thesolution has been represented to describe the entire solution in details.The solution architecture section comprises following components:Reference <strong>Architecture</strong>Functional <strong>Architecture</strong>Delivery Channel <strong>Architecture</strong> (Information View)Application <strong>Architecture</strong>The following subsections elaborate the abovementioned components of the solution architecture.7.1 Reference <strong>Architecture</strong>The reference architecture gives an overview of the entire solution containing the key components ofthe solution. The Business Analytics <strong>Solution</strong> has three broad components that interact with each other.A front-end portal which acts as a window to all <strong>IRDA</strong> applications e.g. Insurer datacapture and approval.A centralized database for having single version of truthA view that facilitates regulatory monitoring and understanding of marketdevelopment activities of the Insurance companies.An analytical platform, gathering input from the operational data warehouse,providing analytics and reporting across various dimensions.The diagram below depicts the key components of the solution.Business Analytics Project Page 23
<strong>Solution</strong> <strong>Architecture</strong> Document - <strong>IRDA</strong> Business Analytics ProjectBusiness Analytics Project Page 24
<strong>Solution</strong> <strong>Architecture</strong> Document - <strong>IRDA</strong> Business Analytics ProjectFunctional view of the <strong>Solution</strong> <strong>Architecture</strong>The components of the solution architecture, as depicted in the above diagram, will render various services as given in the table below:StakeholdersIntegration ServicesExternal StakeholdersOther StakeholdersSecurity ServicesAuthenticationAuthenticationAuthorization &PrivacyNon-repudiationAuthorization &PrivacyIdentity MgmtConfidentiality Fraud Detection &IntegrityIdentity MgmtSecuredCommunicationChannelsSingle Sign OnApplicationManagementServicesLoggingLoggingNotificationNotificationMonitoringMonitoringRelease/PatchExceptionManagement HandlingIT Replication & SLA MgmtManagementIT & BusinessDashboardsMetadataManagementExceptionHandlingPolicy HoldersPolicy HolderViewAdministrativeViewInsurerPortal ViewsIntermediariesInsurer ViewViewInsurance AgentViewFunctionalities for the external stakeholdersE-Filing of returns and online datacapture from Insurers, brokers,surveyors and ATIsContent Authoring/PublishingGrievance Redressal System (ExternalSystem)Agency Licensing Portal(ExternalSystem)IntermediariesKM ViewBusiness Applications & ServicesOperational Data StoresDevice Aggregation ServiceSearchPersonalizationCollaboration<strong>IRDA</strong> OfficialsData Stores<strong>IRDA</strong> ViewMDM ViewPeer RegulatoryBodiesEmail ServicesTracking Compliancethrough Notifications/AlertsFunctionalities for the internal stakeholdersComplianceMonitoring<strong>Report</strong>ing/AnalyticsMIS, QueriesEarly WarningSystemResearch InstWorkflowManagementNotificationsDocumentManagementOther GovtBodiesTracking &MonitoringKnowledgeManagementBusiness Intelligence ServicesApplication IntegrationMessageTransformationMaster DataManagementWorkflow EngineData IntegrationETLExtractTransformationData LoadingCleansingAuditingIT & SLA MgmtServer StatisticsAnalysisTransactionalDataAdministrativeMaster Data Business Rule Access LogDataSubject Area wiseAnalytical DataData MigrationManagementMetadata MgmtBusiness Analytics Project Page 26
<strong>Solution</strong> <strong>Architecture</strong> Document - <strong>IRDA</strong> Business Analytics ProjectServicePlatform ManagementServicesDescriptionPlatform Management Services comprise of two broad set of servicesuites-Security Services: Standard authentication and authorization services,application registration and strong auditing capabilities for thetransactions and other pertinent details. A single sign-on process is alsoexpected to be implemented as part of these services that will allow theintegration of multiple applications and services through a boundapplication gateway. Encryption and support for standard encryptionalgorithm/mechanism like SSL and applicable payment industrystandards.Application Management Services: Along with the set of servicesprovided in a typical application server environment, typical IT and SLAmanagement services in terms of response times and other parametersas well as some application monitoring dashboards are envisaged to be apart of these services.Overall technical architecture and distributed nature of environment isexpected to pose some additional integration challenges in thisenvironment.InformationDissemination/RenderingServicesContent and transactions will be rendered through a number of differentchannels. Currently, there is only one channel. However, assuming thatthe number of channels may be extended in future, a device aggregationlayer should be planned to make the service delivery device independent.<strong>IRDA</strong> Portal: The portal will provide a platform for the extendedenterprise to be managed. It will therefore expose both enterpriseapplications and a number of functional applications to the extendedenterprise. The portal should therefore operate through an appropriateparser that is able to render a broad number of services while connectedto the portal. Each response request in the portal should be wellintegrated with the parsing application. The parser application andinfrastructure is expected to form a key component of solution design.All the customer- facing services will be available through the portal sinceit is expected to be the primary gateway for Insurance Companies,Insurance Customers, Peer Regulatory bodies etc.Separate views and instances of applications will be provided throughtypical portal application. Views should be modularized and customizableto a significant extent. These customizations will be driven by businessprocess and logic.Business applications and services may be broadly divided into twocategoriesBusiness Analytics Project Page 27
<strong>Solution</strong> <strong>Architecture</strong> Document - <strong>IRDA</strong> Business Analytics ProjectServiceBusiness Applications andServicesDescriptionBusiness Applications: These will be offered as a platform to <strong>IRDA</strong>. Thisplatform will be run on the internal environment and will be accessible,to differing extents, through the channels of information disseminationthrough defined integration touch points.All the customer facing services will need to have a tightly coupledintegration with <strong>IRDA</strong> service delivery platform. It is critical to capture thedata and transaction footprints for these services. Internal applicationswill also need to have data and application level footprints. Data andapplication logic will be completely resident on the respectiveenvironments. Specific data level integration requirements will bedefined during the analysis phase of the project.The applications envisaged are1. Content Authoring/Publishing Service – A service which allowsusers to upload/download and access document repositories inthe <strong>IRDA</strong> portal2. Knowledge Management – The KM portal will contain variousdocuments and information about various activities of <strong>IRDA</strong> andon the Insurance sector as a whole. This will have two basic subpartsa. Repository of information and documents available toexternal stakeholdersb. Information and documents only available to <strong>IRDA</strong>employees / users3. Collaboration Services – Services rendered by the portal howeverthese are not necessarily owned by the portal. Instead theseservices may e borrowed for other portals or applications4. Search –Allows users to search for a specific service in the portal,instead of trying navigate to the link for that particular service5. Personalization – Allows the user to personalize the web pages,look & feel and save favorite links etc.Internal Applications: Hosted enterprise application suite is expected tobe in place to manage the internal operations of <strong>IRDA</strong> in variousdepartments. Typical areas of operation will be generation of various MISreports, automated tracking of various compliance deadline (including ontime submission of data) for the various companies.All these applications will have tightly coupled integration with the datalayer. Internal applications would also include a master data managementmodule to add/delete/modify and manage all key master entitiesincluding the hierarchy and roles management.For details of the internal application please refer to businessrequirements.ApplicationThis set of services comprises of three categories-Business Analytics Project Page 28
<strong>Solution</strong> <strong>Architecture</strong> Document - <strong>IRDA</strong> Business Analytics ProjectServiceDesign/IntegrationServicesDescriptionServices Design and Maintenance PlatformComprises of an integrated development environment providing aninterface to maintain services based on the relevant developmentframework. The interface will be used to modify and manage the changesin the services description and definition. A typical environment wouldalso contain workflow and rules management engine to provide theability to design configurable services.Data IntegrationData will be resident in multiple repositories of the platform. Some of thedata assets might also reside outside the platform in the database ofspecific application provider e.g. agency portal system. A concerted datamanagement strategy will need to be designed. Typical on and offlinedata integration model should be considered as part of the overalltechnology solution stack.Data StoresOverall application layer will have multiple data stores in two differentvariationsa) Data Stores within the <strong>IRDA</strong> controlled environment: <strong>IRDA</strong> willhave complete control and direct access to the data beinglogged/created out of proprietary applications.b) Data Store in Application Providers Environment: Data will bemanaged by the respective environment owner. While the exactneed and a mechanism to pull out this information will bedetermined during solutioning, there is a currently envisagedneed to integrate this data in an online mode.Each application is envisaged to have a dedicated operational data store.From here, an integrated data store providing a 360 degree view ofcustomer and sales information is envisaged as part of this architecture.This data store is expected to receive synchronized and asynchronousfeeds from multiple services and applications through an integratedinformation hub described in the application architecture section.Business Analytics Project Page 29
<strong>Solution</strong> <strong>Architecture</strong> Document - <strong>IRDA</strong> Business Analytics Project7.3 List of interfaces for the Business Analytics <strong>Solution</strong>Following is the list of interfaces for the business analytics solution. Some of the interfaces are withexternal solutions. The BAP solution will be loosely integrated with these systems in terms of extractionof data from these systems for reporting and analytics:External Interfaces:IGMS (Proposed Integrated Grievance Redressal Management System)Agency Licensing PortalHealth DatabasePayment GatewayInternal Interfaces:Workflow Application or Business Process Management SystemsBusiness Intelligence Application, Analytical , Data warehousing ApplicationsContent Management <strong>Solution</strong>IT security ApplicationsIntranetData Quality ApplicationsMetadata Management RepositoryBusiness Analytics Project Page 30
<strong>Solution</strong> <strong>Architecture</strong> Document - <strong>IRDA</strong> Business Analytics Project7.4 Delivery Channel <strong>Architecture</strong> (Information View)This view of the architecture elaborates the flow of information right from its point of acquisition to itspoint of consumption by the various stakeholders. The information passes through various layers asfollowing:Data Acquisition LayerData Aggregation and Storage LayerBusiness Access LayerInformation Delivery LayerInformation Consumer LayerThe diagram in the following page depicts the information flow through various layers:Business Analytics Project Page 31
<strong>Solution</strong> <strong>Architecture</strong> Document - <strong>IRDA</strong> Business Analytics ProjectInformation view of the <strong>Solution</strong> <strong>Architecture</strong>Business Analytics Project Page 32
<strong>Solution</strong> <strong>Architecture</strong> Document - <strong>IRDA</strong> Business Analytics ProjectThe table below elaborates the various layers of the information view and the services it renders.Information View Layer Description Relevance to <strong>IRDA</strong>Data Acquisition LayerThis layer is responsible for providingunstructured as well as structured datato the next layer for processing.Operational/TransactionalSourcesThis is the form of operational datarelated to day to day transactions, viaeForms, Spreadsheet uploads, BulkUpload etc. Reference/Master Sources This is the reference data which isprimarily altered or uploaded by systemadministrators, and is altered rarely Unstructured Sources These is the form of data like documents,eMails, Circulars, guidelines etc.Data Integration LayerFor Structured Data: This layer uses dataprovided by the Data Acquisition layerand processes and transforms the datafor use by next layer. It enables data tobe used in a more efficient manner aswell as makes it more scalable. This layermay also house an ETL (Extraction-Transformation- Loading) program toload the data warehouse.However the most common practice is toload the transactional data in the ODSand use a transformation mechanism likean ETL to move the historical data to theData Warehouse.Multiple methodsof data acquisitionfrom InsurersMaster datamanagement on<strong>IRDA</strong> Database.Documentmanagement/published<strong>IRDA</strong>byData required forvarious analyticalreports for <strong>IRDA</strong>internal and PeerRegulatory bodies.For Unstructured Data: This layer has anindexing and Meta Tagging mechanismby means of which the unstructured datais organized.Data Aggregation & Storage layer This layer stores and maintainstransformed data received from the DataBusiness Analytics Project Page 33
<strong>Solution</strong> <strong>Architecture</strong> Document - <strong>IRDA</strong> Business Analytics ProjectInformation View Layer Description Relevance to <strong>IRDA</strong>Integration Layer. Data Warehouse Takes in data from various sources andstores it for reporting and analysispurposes as per the different subjectareas.Data Required forAnalyticalreporting is storedin the datawarehouse Operational data store Handles and stores transactional data. Primarilytransactional datastorage i.e. thedata as uploadedby insurers Master Data Management Maintain various types of Master Datareceived from the corresponding sourcein Data Acquisition Layer. Business Process Management Contains the rules database whichcontains the configurable business rulesfor managing real time data andtransactions.It also manages the workflow which runsacross all the applications exposedthrough the portal. This workflow shouldbe configurable and extendable. Content Repository Stores and maintains unstructured datalike Documents, Web Content, Records,Published reports, etc.Master data usedin various moduleswill be centrallyadministered andmaintained fromhere.Management ofworkflow i.e.rules, queues,sequences,authorizations,permissions,notifications etcshould bemaintained fromhere.Documents,reports, guidelinespublished by <strong>IRDA</strong>Business Access LayerThis is the layer which is actuallyresponsible for performing businesstransactional and reporting services. Thislayer would have some components forBusiness Analytics Project Page 34
<strong>Solution</strong> <strong>Architecture</strong> Document - <strong>IRDA</strong> Business Analytics ProjectInformation View Layer Description Relevance to <strong>IRDA</strong>carrying out business transactions as persome defined business logic (whichwould reside in Business ActivityMonitoring). The business activityservices would be residing on top of theODS and transactional data mart. Thislayer would also contain the analyticaland reporting components such as adhocquery, data mining, forecasting etc. Business intelligence This section is responsible for the variousBI and Analytical reports which includeAd-Hoc <strong>Report</strong>s, Canned <strong>Report</strong>s,Operational <strong>Report</strong>s and Forecasting. Business Activity Primarily defines and responsible for thebusiness transactions. Business Activity Monitoring This is used for Monitoring real timebusiness transactions and takingnecessary actions on defined ruleviolations. Content Management The takes care of the Content lifecyclemanagement, Workflow provides afeature of full text search and indexingand various library services for the storedcontent.Information DeliveryThis layer enables delivery of variousservices through the different channels(web portal, email etc.) using variouscommunication methods such as usingmessage bus and through filesinterchange etc.E.g. Automatedemail remindersasking forcompliance datafrom insurers.Through this layerdifferentdocuments likecompanyinformation,research papersetc. will beavailable to <strong>IRDA</strong>employees andinternalstakeholders.Business Analytics Project Page 35
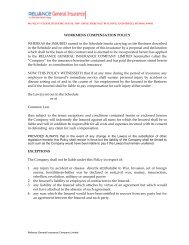
<strong>Solution</strong> <strong>Architecture</strong> Document - <strong>IRDA</strong> Business Analytics Project7.5 Application <strong>Architecture</strong>This view of the architecture elaborates the applications to fit the Functional requirement of the systemand to support the Information flow in the system.The application view assumes all the different applications spread across departments would beaccessible from the portal using a central integration layer. This layer would act as a hub for the overallarchitecture both from a data and application level communication perspective. This layer will facilitatecommunication between the portal, different internal applications, back end systems, accessmanagement services and all other channels. The diagram below shows a model of the <strong>IRDA</strong> BusinessAnalytics solution application view.Business Analytics Project Page 37
<strong>Solution</strong> <strong>Architecture</strong> Document - <strong>IRDA</strong> Business Analytics ProjectApplication view of the <strong>Solution</strong> <strong>Architecture</strong>InsuranceCompaniesIntermediaries<strong>IRDA</strong>EmployeesAccess ControlAccess ManagementAccess ParserAuthentication/Authorization ServicesAuthenticateand AuthorizeAuthorizationinformation ispassed to Portal tomanageauthentication andauthorization withother applicationsApplication PortalEAI/B2B ServicesIntegratorAnalytics/<strong>Report</strong>ingServicesCaching Services (Data, Web Pages, Predictive Caching)Portal ServerIndex/SearchServicesValidation/Rules EngineCollaborationServicesPersonalizationServicesContent Authoring/Publishing ServicesInsurer data processing serviceOtherRegulatoryBodiesIntegration HubSystem ManagementConsoleResearchInstitutesPortal UsersData AccessData Access LayerDatabase-Portal/System/DatabaseAdministrationDirectoryWebAdmin<strong>IRDA</strong> UserDirectoryLDAP RootServices ManagementWorkflow EngineMessage CommunicationMaster Data ManagementServicePublications SystemEnterprise Service Bus (Queues/Channels/Direct Calls)Notifications Services-Logging/ErrorHandling-Monitoring-Deployment/PatchManagementITDI<strong>IRDA</strong> EmployeeApplication/Services ConnectivityConnectorConnectorConnectorConnectorConnector-Analytics/Statistics-OperationsDirectoryClientAPPLICATIONS/SERVICES AND DATABASESIDM/SSO DB (MAS)Backend DatabaseApplications SystemsRelational DatastoreMetadataExternal Apps/ServicesExistingLegacy SystemExternal dataInternal Hosted ApplicationsMISKIPCore Infrastructure ServicesCentral ContentManagementSystemOperational DBPortal DataSynchCommunicationsComponentsSynchMigrated DataInsurer/InsuredEmailServerPaymentGatewayDepartmental Data<strong>IRDA</strong> Business Analytics <strong>Solution</strong> - Application ViewBusiness Analytics Project Page 38
<strong>Solution</strong> <strong>Architecture</strong> Document - <strong>IRDA</strong> Business Analytics ProjectApplication ComponentsFollowing application components are envisaged as main building blocks:Access Management component serves as a gateway to overall application landscape. It providesfor role secured role based access to different views of the portal. This component enables SingleSign-On (SSO) so that users need not sign in again for each of the applications accessed through theportal.Application Portal components serve as a gateway for all the Business applications, along withcontent and knowledge management features. There will be different informational/transactionalviews offered to different stakeholders depending on their role/level of access.Integration Hub will serve a fulcrum for the overall application view. It will have several componentsfor complex standards-based as well as proprietary integrations, connectivity with all internal hostedapplication/services, connectors etc. These layers will also serve as on and offline data integrationgateway.Application Services and Databases: Core applications/components that is resident in individualenvironments as well as hosted infrastructure for <strong>IRDA</strong>. It includes the Existing data store of <strong>IRDA</strong>along with the ODS required to run the business applications in Portal.Each component has been further detailed out below:Access ManagementAccess Management component will serve as a gateway for all requests that are routed through webbrowser. It will use an Employee directory of <strong>IRDA</strong> along with a SSO/IDM infrastructure to authenticateusers. All the external users would be validated against a user credential database. Access Managementmodule should be designed in an open mode with ability to accommodate additional applications andsecurity management solution for new applications.Application PortalApplication portal will serve as a gateway for requests that may be routed through browser. Portalshould be developed using standard portal server. Portal server may have following illustrativecomponents-Knowledge Management Services: Portal will provide for rich knowledge management capabilitiesacross different departments. A role based view of this system would be given to internal andexternal stakeholders.Analytics and <strong>Report</strong>ing Services: Portal will provide reporting and data analysis features in forms ofreports and dashboards.Work Flow Services: A configurable workflow service would be running across all the businessapplications.Notifications and Monitoring Services: A configurable notifications service would be running inassociation with the work flow serviceBusiness Analytics Project Page 39
<strong>Solution</strong> <strong>Architecture</strong> Document - <strong>IRDA</strong> Business Analytics ProjectSearch Services: Ability to conduct regular and advanced search.Collaboration Services: Ability to perform content, data and application based collaboration in linewith Web 2.0 principlePersonalization Services: Ability to present customized views (e.g. language based personalization)and modules through a portal depending on the type and nature of usersRules Engine – Modules to perform basic validation of the data uploaded by the insurers.EAI/B2B Integrator: Modules to provide data integration services for on and offline data transfersPayment Gateway: The proposed portal will have an interface with a full-featured payment gatewaysolution and would provide the ability to process online payments using many payment instruments.Financial Transaction processing component will communicate to the card issuing banks/financialinstitution through a payment gateway solution. The payment gateway will be invoked from theIntegration hub through a request that is raised by the portal. The gateway services will authenticateand process the payment request based on the overall information sent. This payment requeststatus would then be passed back to integration layer and then the results are displayed back toportal.The capabilities of the Payment Gateway would be the following –Transaction ProcessingBasic validation of Payment Informationo MOD 10 validationo Well-formed Credit card number validationo Card expiry date validationAuthentication of payment informationo Authentication for Issuing Bankso Authentication for Internet payment processingo Support for services like Verified-by-Visa, MasterCard SecureCode etcAuthorization of payment informationCapability to ensure atomicity of the transactionEfficient and centralized Reconciliation mechanismSecurityCapability to securely communicate to other third party application/services on the Internetusing SSL protocolProtection by Secured firewallVerisign certificationAdministrationChecking the status of individual transactionsMIS <strong>Report</strong>sRefunding transactions if applicableBusiness Analytics Project Page 40
<strong>Solution</strong> <strong>Architecture</strong> Document - <strong>IRDA</strong> Business Analytics ProjectSystems FeaturesIndustry-standard ScalabilityIndustry-standard PerformanceIntegration HubIntegration hub will serve three core functionsManage the interface between various applications through application to application andapplication to data integration. Each of the applications may have their dedicated data stores. At aphysical level, this may result in separate schema or separate databases. This managed layer willhandle the transient and persistent storage of this information.Manage the interface between the Business Applications/Services Layer and Presentation Interface:Application/data level integration for internal services and application will be managed by this layer.In addition to managing this interface through a message queue, enterprise service bus, channels ordirect RPC calls, this layer will also be responsible for hosting capabilities like workflow engine,master data management components, unified notifications and content publishing services.Application/Services level connectivity with the applications/databases that is hosted in <strong>IRDA</strong>environment will be managed through this integration hub. This layer will ensure loose or tightlycoupled connectivity for the different applications.In addition to these services, a set of common services should also be provisioned for using thisintegration hub. This would include-Content and Information publication managementWorkflow EngineNotification EngineMaster Data Management componentsBusiness Transaction Services – All the services required to execute the business processes.Application/Services and DatabasesThis layer includes:Back End systems: These are mostly existing systems with which other business applications need tointeract in uni/bidirectional way with respect to information integration.Central Content Management SystemCore Infrastructure Services: This would include all operational databases containing data pertainingto different business applications, users, portal metadata etc. It would also include communicationcomponents such as Email.Business Analytics Project Page 41
<strong>Solution</strong> <strong>Architecture</strong> Document - <strong>IRDA</strong> Business Analytics ProjectFollowing are the key considerations for <strong>IRDA</strong>’s envisaged Business Analytics solution:Heterogeneous Environment: Overall system is expected to have multiple components resident indifferent and diverse technology platforms. Proper consideration should be given to this point whilefinalizing the integration architecture.End-to-end Integration (Data Level): This application would have significant data level integrationbetween legacy systems and the <strong>IRDA</strong> Portal which will pose a significant challenge in terms oflatency, frequency of information. Ensuring the consistency and integration of transaction in aconcerted mode will pose a significant challenge to this architectureBusiness Analytics Project Page 42
<strong>Solution</strong> <strong>Architecture</strong> Document - <strong>IRDA</strong> Business Analytics Project8. <strong>Architecture</strong> Considerations and Constraints1. The hardware sized for all the applications should be redundant and scalable. All the componentswithin the server should be hot swappable and should incur no downtime due to component failure.2. All the servers suggested should have dual power supplies. The power input to the power supplieswill be from separate Uninterrupted Power Supplies which will be fed from two different powersources. In case of failure of one power supply, the second power supply should be able to take thefull load without causing any interruption in services.3. All servers should have at a minimum of dual 1000 Mbps network interface cards (NIC) installed ondifferent slots. Each NIC will be cabled from a different module on the switch using gigabit speedcabling.4. The system should be platform independent and should not only be deployable on multipleplatforms such as HP UNIX, IBM AIX, IBM i, Sun Solaris, Microsoft Windows, Linux etc., but shouldalso allow integration with other software deployed across heterogeneous operating systemplatforms.5. The system should have the capability to use Service Oriented <strong>Architecture</strong> best practices andshould use industry standards for integration to achieve universal use.6. The system should be database independent and should allow deployment on multiple RDBMS suchas DB2, Oracle, and Microsoft etc. The system should allow integration with other heterogeneousdatabases irrespective of the choice of database for the enterprise system. The database languageshould be ANSI SQL and should avoid using any Vendor specific proprietary extensions to ANSI SQL(e.g. PL-SQL)7. Ability to be browser independent. The system should be compatible with the following browsers7.1 Internet Explorer 6.0 or higher7.2 Mozilla Firefox 3.0.7 or higher7.3 Safari, Netscape, etc.8. The system should have modular structure providing the flexibility to deploy selected modulesproducts-lines of business combination as per the <strong>IRDA</strong>’s convenience9. The system should provide fast and steady response times (Quality of Service). The speed andefficiency of the system should not be affected with growing volumes, especially during searchoperations, data warehousing, reporting, MIS, online processes and batch processes.10. The system should be operational with good response time using low band width in the region ofabout 15Kb per user, especially for WAN and internet users.Business Analytics Project Page 43
<strong>Solution</strong> <strong>Architecture</strong> Document - <strong>IRDA</strong> Business Analytics Project11. The system should meet the following scalability requirements:11.1 Support multi- tier architecture (The Application should at least have the followingwithin its architecture) for all modules within the application with well definedinterfaces between the layers11.1.1 Presentation Layer11.1.2 Business Logic Tier11.1.3 Data Tier11.2 Capability to integrate with external / third party components like Rules Engine,Functional Modules, General Ledger etc which should not be point to point integration,but with well defined interfaces for data integration using enterprise data model11.3 Ability to scale horizontally without redesign11.4 Multiple similar hardware and mix of multiple hardware in a horizontal setup.11.5 Scalability for external components (External components should not restrict scalability)- Provide performance benchmarks for similar functions required in <strong>IRDA</strong> for <strong>Solution</strong>scalability11.6 Ability to scale vertically without redesign11.7 Addition of CPU, Memory, Hard disk capacity without causing downtime11.8 Support the deployment of additional modules at a later point in time with minimaldowntime and loss of productivity.11.9 Support message patterns and protocols supported - e.g. publish/subscribe,synchronous/asynchronous, push/pull/pool, topics/queues.Business Analytics Project Page 44
<strong>Solution</strong> <strong>Architecture</strong> Document - <strong>IRDA</strong> Business Analytics Project9. Interoperability Aspects of Business Analytics <strong>Solution</strong>9.1 Challenges of InteroperabilityInteroperability is essential for the <strong>IRDA</strong> business analytics solution. In order to apply Interoperability tothe BAP solution the following challenges may arise:Technical interoperabilityTechnical Interoperability covers the technical issues of computer systems. It includes also issues onplatforms and frameworks. Frameworks for the solution might become complex and many timesprovide conceptual differences to working approaches. In addition, at times frameworks are duplicativeand contradicting with multiple levels. Hence, thorough review and utmost care should be taken whiledeciding on the frameworks and platforms for the solution. Some of the specific platform andframework related considerations for the business analytics solutions are:Choice of the operating system for both client and serverOption to use server farm and use load balancing to host the portalChoice of the browser and it’s add on componentsOther considerations which are dependent on the platform and frameworks are:Portlets built for one portal platform would not interoperate with other portal platformsDevelopers would need to build the same portlet many times to support multiple portalvendors.A limited number of portlets will be available from a particular portal vendor for page designers.Deployment of portlets may want to be managed on certain systems but “consumed” on othersystems.Organizational interoperabilityOrganizational interoperability is concerned with organizational processes and cooperation of agencies.Some of the processes may not be enough flexible and adaptive to be integrated and be interoperable.The <strong>IRDA</strong> top level management will need to play a vital role in such a context. Leadership and strategicdirection of management are cited as the most important factors for corporate adoption of Webtechnology.Semantic InteroperabilityInteroperability or integration efforts are about making information from one system syntactically andsemantically accessible to another system. Syntax problems involve format and structure. Semanticsbeing an important technical issue is one that is almost invisible outside technical circles. What it boilsdown to is that the meaning of apparently identical terms can differ in significant ways betweensystems. Such differences normally make it more difficult to make systems work together. TheBusiness Analytics Project Page 45
<strong>Solution</strong> <strong>Architecture</strong> Document - <strong>IRDA</strong> Business Analytics Projectdifferences can be minimized if systems are designed using agreed data formats. Semantics relate to theunderstanding and integrity of the information.9.2 Technology Considerations for InteroperabilityThere are various technologies that help in achieving the objectives of the business analytics solution bysolving the problem of interoperability. Key technologies are discussed below:Service-oriented <strong>Architecture</strong> (SOA)SOA is an architectural style whose goal is to achieve loose coupling among interacting software agents.A service is a unit of work done by a service provider to achieve desired end results for a serviceconsumer.Service Oriented Environment is based on the following key principals:.SOA is not just architecture of services seen from a technology perspective, but the policies,practices, and frameworks by which the right services are provided and consumed.With SOA it is critical to implement processes that ensure that there are at least two differentand separate processes—for provider and consumer.Rather than leaving developers to discover individual services and put them into context, theBusiness Service Bus is instead their starting point that guides them to a coherent set that hasbeen assembled for their domain.Web Services (WS)A web service supports direct interactions with other software agents using XML-based messagesexchanged via Internet-based protocols”. The Semantic Web infrastructure of ontology services,metadata annotators, reasoning engines and so on will be delivered as Web services. In turn Webservices need semantic-driven descriptions for discovery, negotiation and composition.The encountered problems with development of Web Services are: Its ontology building in itself is time consuming. The dynamic nature of the field. The exponential rise in the number of bioinformatics Webservices over the past year required a further two months effort to maintain and extend theontology. Lack of guidelines on how to build the domain specific ontology, or indeed how to relate it toupper level ontologies. Differing interpretation of the myriad of standards – SOAP, WSDL, UDDI, XML Schema etc.; andhow they relateBusiness Analytics Project Page 46
<strong>Solution</strong> <strong>Architecture</strong> Document - <strong>IRDA</strong> Business Analytics Project10. Conceptual Data Model Design10.1 OverviewA conceptual data model shows relationships among various data entities to represent high-leveldependencies among the data required by business functions/departments. In other words, it showsrelationship and interactions among conceptual data entities. It also zooms in on the area of theorganization that is the subject of analysis for the project and provides a high-level view representingthe business under study for that organization. Entities here refer to the different dimensions /parameters across which different analyses are performed and the facts or measures which are beinganalyzed across these dimensions. The data model comprises of entities that were defined during thedata collection and requirements gathering phases of the project, and includes all entities necessary tosupport the client’s business analytics platform and is developed at a departmental level after analysisof the metrics and reports of the following departments:1. Life2. Non – Lifea. Generalb. Reinsurance3. Health and TPAs4. Actuarial5. Intermediaries 1a. Brokersb. Corporate Agentsc. SurveyorsLeaving few forms, owing to the flat dimensional structure for F&A and investment, no dimensionalmodel is suggested for these departments.Each department is further split into subject areas having similar data elements and analytical context.Similar forms are clubbed together to form a subject area. Each department and the underlying subjectareas have a specific set of dimensions or parameters depending upon the analytical requirements.Some of them are common across departments for example time and insurer which are common across1 Agents and ATIs data are already captured in agency licensing portal and hence not a part of the dimensional designBusiness Analytics Project Page 47
<strong>Solution</strong> <strong>Architecture</strong> Document - <strong>IRDA</strong> Business Analytics Projectdepartments. Some of them are unique to a particular department such as broker which is relevant onlyfor intermediaries.Dimensions have attributes in them which are the characteristics metadata elements to further detailout a dimension. A subject area is represented by fact table which represent the metrics or measure in aparticular subject area. Dimensions are linked to a fact table using a unique identifier (a key / ID) whichshows that the kind of relationship it has with the fact and also the level of granularity at which themetric is analyzed. For example, if month ID is connected with a fact table, it means the metrics in thefact table for that particular subject area are analyzed monthly with respect to the time dimension. Itcan be represented in the diagram below: – TimeInsurer1. Insurer ID2. Insurer Name3. Insurer Type4. Date of RegistrationRelationship(Granularity)1. Year ID2. Half Year ID3. Quarter ID4. Month ID5. DayABC FactDimensions/Parameters1. Insurer ID2. Month IDABC MetricsFact Table(Metrics)10.2 Form De duplication MatrixFollowing the data model, all forms in the particular subject area are listed down along with all thesimilar forms from other departments. To facilitate the form de duplication process purpose, a matrixhave been prepared which shows in a subject area across what dimensions or parameters the differentforms are capturing the data. It shows a snapshot of the dimensional commonality across differentforms. Also, similar forms from other departments which capture similar data are also shown with theirdimensional intersection which helps in finding out the overlaps across interdepartmental dataBusiness Analytics Project Page 48
InsurerProductLoBPremiumTypeDivisionChannelTypeGeographyGroupLocationTime<strong>Solution</strong> <strong>Architecture</strong> Document - <strong>IRDA</strong> Business Analytics Projectcapturing process. This outcome of this process is summarized and visual snapshot of the commonalityof the forms in terms of data capture within and across departments. The structure for this matrix isrepresented as shown below:DimensionsDept.Form NameABC XYZ X P X MThis represents that form XYZ of ABC department is capturing data across Insurer, product (at the lowestproduct level granularity) and channel wise. The frequency of the data capture is monthly.For detailed data models and de duplication matrix for the different departments, please refer toAppendix A.For the detailed structure of the dimensions please refer to Appendix B in the appendix section.Business Analytics Project Page 49
<strong>Solution</strong> <strong>Architecture</strong> Document - <strong>IRDA</strong> Business Analytics Project11. Infrastructure SpecificationsThis section elaborates the Infrastructure need of <strong>IRDA</strong> to support the applications that has beenproposed in the previous section.A fully web based application architecture is envisaged that will ensure all the application access isthrough web. Specific description of different infrastructure solution components along with therationale is presented in respective sections:Central Data Centre (CDC) and Disaster Recovery (DR) siteStrategy for Disaster RecoveryBusiness Continuity PlanHardware InfrastructureNetwork ConfigurationSizing and Performance Related ConsiderationsScalability Plan11.1 Data Centre and Disaster Recovery SiteThis section will assess the current Disaster Recovery plans, discuss best practices, and provideinfrastructure recommendations to meet the recovery requirements of the <strong>IRDA</strong> Business AnalyticsProjectAssumptionsThe following are assumptions used in developing this assessment:This assessment is to focus on the technological aspects of disaster recovery not the businessoperationsCurrent system business continuity plans do not cover the new requirements that will beneeded for <strong>IRDA</strong> infrastructureDisaster recovery infrastructure capacity must be able to operate at the same performance levelas the primary siteDoes not include overall restoration priority with other systems, such as IGMS.Any recommended infrastructure needs are specific to <strong>IRDA</strong> and thus independent of any otherapplicationDevelopment environments will be recovered via appropriate backups as time/resource permitupon completion of DR plan executionIn the event of a disaster, the recovery facility and services should provide the capability tomaintain operations of the in-scope the business analytics solution components and relatedapplications for an undetermined amount of timeBusiness Analytics Project Page 50
<strong>Solution</strong> <strong>Architecture</strong> Document - <strong>IRDA</strong> Business Analytics ProjectThe proposed Data Centre at can be referred to as the Central Data Center (CDC). Functional andtechnical resources can be located at CDC and an IT “Help desk” for issue resolution and solutionenhancement should be established at the Data Center.CDC should host various applications, as detailed out in the Application View of the solutionarchitecture.The Central Data Centre should have full capacity for hosting and running the network/serverInfrastructure of <strong>IRDA</strong>. This should be installed in Hot Stand By mode or back-up in cold state. CDCshould act as Primary Data Center and also Business Continuity Planning (BCP) and Disaster Recovery(DR) site for backup of CDC.In normal situation, CDC should be able to provide services to the different categories of IT users. Anautomatic load balancer should be installed to divert traffic to least occupied server in CDC. In case offailure of CDC, the DR site should automatically take over the task of failed CDC. DR process shouldreplicate the data from CDC to DR site as online replication. In case of failure of the CDC, this DR shouldbe in a position to take over the entire load automatically.It is recommended that there should be one “Centralized Data Centres” (CDC) at the <strong>IRDA</strong> Headquarterin Hyderabad. CDC should be connected to a Disaster Recovery (DR) site and, if possible, established in adifferent seismic zone, from that of the CDC. Also, if the recovery needs are higher, in such a case, a nearsite is proposed which will be exactly a replica of the CDC in terms of storage. Further, the computingpower of the CDC can be replicated into the near site as well for an almost near real time recovery.11.2 Strategy for Disaster Recovery (DR)Disaster Recovery is a strategy used for providing alternate option to at least restore key operations incase problems at main sites. In the context of IT services, typically DR relates to creating backups orhaving alternate site for restoring the operations. Below is a matrix showing the different types ofdisaster recovery strategies applicable for the <strong>IRDA</strong> business analytics project along with their technicalspecifications:Business Analytics Project Page 51
<strong>Solution</strong> <strong>Architecture</strong> Document - <strong>IRDA</strong> Business Analytics ProjectRecovery StrategyData ReplicationDedicated DBServersDedicatedApplication ServerCapacity for CriticalApplicationsEnhancements toReduce RecoveryTime, Complexity, &RiskTech Services ToolsTechnical Specifications SAN Replication between the Data Centers for critical data bases needed tomeet accelerated RPO requirements (up to 2hours or less of lost data) Deployment of Recovery Data Center Database Server Capacity to supportthe critical Data Bases Procurement of additional virtualization capacity at the Recovery DC Purchase of additional applications, middleware, and tool servers at theRecovery DC CPU, Memory, and Logical Partition upgrades to existing development, test,and stage servers at the Recovery Data Center Upgrade of the Recovery DC Operations (people and process) capabilities tosupport production requirements Expansion of E-mail Infrastructure to support resiliency across the DataCenters Wireless Network Deployment Technology Services Tools Resiliency BCP Security Access Changes Make monitoring and support tools resilient or quickly available at therecovery data centerTechnical specifications for the DRC for the <strong>IRDA</strong> business analytics programThe following with respect to Disaster Recovery is recommended for the <strong>IRDA</strong> business analyticsprogram:Technical ConsiderationsNetwork connectivity and sufficient bandwidth will be needed between DC and DRC; burstablebandwidth provisioning should be negotiated with WAN provider(s).System software should be used to synchronize platforms at production and recovery locationsDedicated equipment is required at the DRC, but it could be used to provide testing ordevelopment during normal operations Automated provisioning/repurposing of test and development equipment forproduction/recovery purposes is a recommended capabilityBoot-from-SAN, Ignite or similar process should be used to reduce recovery timeRegular, full-scale testing of the disaster recovery solution should be performedA distinct DR site should be created in the next seismic zone, designed as the backup (mirror)site to the main site. The DR site should deploy the entire application solution (current andlatest version of the application builds, and all solution components).Business Analytics Project Page 52
<strong>Solution</strong> <strong>Architecture</strong> Document - <strong>IRDA</strong> Business Analytics ProjectThe DR site should be invoked automatically when the production site fails to provide itsservices and it should ensure that it supports a degraded performance of at least 80 per cent ofthat prescribed for the primary site.It should be ensured that data is replicated at the DR site at regular intervalsRoutine tests should be simulated to ensure that in case of an emergency, rollover to the DR sitehappens automatically without any service downtime.<strong>IRDA</strong> should run all services and transactions from the DR Site, at least once in a month, on anon-peak day to check its performance in case of an exigency and service provider (s) shouldperform DR drills monthly.In terms of storage requirements for the DRC, <strong>IRDA</strong> needs to implement some type ofInformation Lifecycle Management (ILM) approach. Data needs to be classified and placed onthe appropriate class of storage. <strong>IRDA</strong> needs to implement a synchronous or asynchronousreplication approach for critical data (e.g. SRDF, TrueCopy, PPRC, SnapMirror, etc.).In addition to <strong>IRDA</strong>’s disaster recovery initiatives, other options also include investigating theuse of third party vendors to provide offsite data storage. Offsite data storage services from athird party provider provide a secured means to store critical business and application data inthe event of a disaster. Many of these vendors also provide disaster recovery services, whichmay include the ability to use vendor hardware to run <strong>IRDA</strong> business applications in the event ofa disaster to the <strong>IRDA</strong> operations center.Server Side Recommendations for DRC at <strong>IRDA</strong>The servers should be designed in an “Active/Passive” strategy for the SAN replication.The servers located in the CDC will continually replicate to the clustered servers in DRC.All storage/database servers have matching model numbers, CPU and memory configurations.There are duplicate SAN with identical disk configurations on both sitesUse of technologies to create and maintain standby databasesNon-Production servers would be used to support Production during a disaster or extendedoutageAs a part of the disaster recovery procedures, all non-production components/servers would beshutdown.The production Web and Application servers would be mounted on the non-productionhardware from the mirrored copies. The production databases can be started from the standbydatabases or restored from a backup or mirrored copy depending on the disaster scenario.Server Cluster will deliver high-availability functionality to the Business Analytics <strong>Solution</strong>. Thiswill enable the applications to remain available in the case of a hardware; network or OperatingSystem failure on one of the servers in the cluster group.These Server Clusters will be configured with cluster resources required by the BAP application.These resources include network names, IP addresses, application data, services, and diskdrives. Once the Cluster resources are brought online it then begins processing client requests.Business Analytics Project Page 53
<strong>Solution</strong> <strong>Architecture</strong> Document - <strong>IRDA</strong> Business Analytics Project11.3 Connectivity between CDC and DR Site in normal operationDR (Disaster Recovery) site should be at a different seismic zone from that of CDC. To ensureundisturbed connection between CDC and DR site the connectivity needs to be at least from twoindividual ISPs, one is for main network connection and the other is as fall back option. Similarly in DRsite, internet connectivity should be same like CDC. It is recommended to have an online replicationbetween CDC and CDC – DR site.CDC and DR Specifications have been provided in Appendix – D. CDC and DR Specifications.Business Analytics Project Page 54
<strong>Solution</strong> <strong>Architecture</strong> Document - <strong>IRDA</strong> Business Analytics Project11.4 Business Continuity Plan<strong>IRDA</strong>’s Data Centre will host critical applications and database which needs to be protected from variousthreats of disaster to minimize business interruption/ disruption. Business Continuity Planning is the actof proactively planning a way to prevent, if possible, and manage the consequences of a disaster,limiting it to the extent that a business can afford. Business survival is an issue with all organisations, bigor small, due to various threats and vulnerabilities such as:catastrophic events - floods, earthquakes, or acts of terrorismaccidents or disruption by internal or external factorsoutages due to an application error, hardware or network failuresBusiness survival necessitates planning for every type of business disruption including, but by no means,limited to the above mentioned categories of disasters with results ranging from insured losses ofreplaceable tangibles to uninsurable capital losses to customer dissatisfaction and possible desertion tocomplete insolvency.A business continuity plan is an insurance against such disasters and ensures that key (if not all),business functions continue. A business continuity strategy, then, is a high-value as well as a highmaintenanceproposition. In this context, <strong>IRDA</strong> is no exception and it is as vulnerable as any otherenterprise globally.The key challenge of business continuity preparation is not technology, but the internal “business”aspects that begin at the foundation level of any project and continue throughout its life cycle: such asjustification, executive buy-in, broad organizational support, governance and politics.Perhaps the most important point to make about business continuity support technologies is that itseffectiveness depends entirely upon the organization’s top-down commitment to the entire project,including updating and testing IT Systems and Infrastructure, recommending suitable policies formaintenance to remain ever geared up for an unexpected turn of events.Therefore, it is strongly recommended to have a comprehensive Business Continuity Planning andDisaster Recovery initiative at <strong>IRDA</strong> with full commitment and support from top management and seniorexecutives. Even though Business Continuity Planning (BCP) appears to primarily deal with technology, itis equally associated with the business.Business Analytics Project Page 55
<strong>Solution</strong> <strong>Architecture</strong> Document - <strong>IRDA</strong> Business Analytics Project11.5 Recovery Point and Time Objectives for the Business Analytics<strong>Solution</strong>The business requirements for IT disaster recovery services were captured by reviewing each of the keybusiness processes within the functional areas of <strong>IRDA</strong>, identifying for each: How quickly following a disaster a particular process needs to be operational (the RTO –Recovery Time Objective)The amount of data that can be lost as a result of a disaster (the RPO – Recovery PointObjectives)In addition, various design attributes relating to the process, such as, if there is a workaround that canbe put in place, if it is necessary to be able to perform the process out of the office, were identified.Functional Areas ReviewedOnline submission of data and electronic communication management are considered thehighest priority functional area for restoration in the event of a disaster.<strong>Report</strong>ing and analytics, tracking and monitoring and workflow are considered to be of mediumpriority.Document and Knowledge Management and other functions like collaborations, search etc.were considered low priority since generally their component processes are not time critical andworkarounds are possible providing that the firm can communicate with its clients and accessdocuments.Business Processes ConsideredooRestoration priorities (RTO) align with being able to communicate with the externalstakeholders, being able to complete disclosure transactions, and the ability to be ableaccess and update documents.Zero data loss (RPO) is required for all the critical functionalities.Required RTOFunctional AreaOnline submission ofdataElectronicCommunications<strong>Report</strong>ing and analyticsTrackingMonitoringandWorkflow ManagementBetween 5 Hours to 24HoursBetween 2 Hours to 4Hours< 2 HoursBusiness Analytics Project Page 56
<strong>Solution</strong> <strong>Architecture</strong> Document - <strong>IRDA</strong> Business Analytics ProjectRequired RTOFunctional AreaBetween 5 Hours to 24HoursBetween 2 Hours to 4Hours< 2 Hours2 DocumentManagementKnowledgeManagementSupport Services andOthersLegendsFunctional Areas with high priorityFunctional Areas with medium priorityFunctional Areas with low priority2 Document management can be of medium or high priority at times. The priority of document management can be seasonal attime. Ex. in case of inspection activities or enquiry of an insurer/intermediary.Business Analytics Project Page 57
<strong>Solution</strong> <strong>Architecture</strong> Document - <strong>IRDA</strong> Business Analytics ProjectDR Approaches and OptionsPrior to the capture of business requirements, three approaches to DR were defined providingdifferent levels of recovery capability.Following the capture of the business requirements and technology constraints, three solutionoptions were developed broadly in line with the three approaches.Business Analytics Project Page 58
<strong>Solution</strong> <strong>Architecture</strong> Document - <strong>IRDA</strong> Business Analytics ProjectOverview of options and featuresKey FeaturesOption 1Option 2Data for critical applications replicated in real timebetween the existing data centre and a near sitelocated outside <strong>IRDA</strong>. In case of any failures,replication will take place between the DC andnear site almost at real time for immediateprevention. In terms of storage capacity andspecifications the near site will be a replica of theDC. Depending upon the level of urgency ofrecovery, the transactional capabilities also can bemade available in the DRC. Replication will alsotake place between the near site and the DRC.Processing equipment in the DR data centre willbe maintained for all services.RPO: Almost zero loss of saved data forcritical applications.RTO: Recovery of critical applicationswithin 2 hours of invocation.Performance in case of disaster: Same asnormal for critical applications, reducedfor non critical applications. Benefits: Meets and exceedsrequirements. Simplest failback toproduction operation requiring relativelyminimal outage (e.g. overnight).Weaknesses: Costs of dark fibres opticlinks will vary significantly between datacentres (careful choice required).Operator error in the near site and theDRC environment could impact productionoperations. If even computation power isreplicated in the near site as well, thecosts will go even higher.<strong>Architecture</strong> similar to Option 1, except that lowerperformance and cost network links between thedata centres are provisioned such that thereplication of data between sites will incur a lag.RPO: 30 minutes of data loss.RTO: Recovery of critical applicationsBusiness Analytics Project Page 59
<strong>Solution</strong> <strong>Architecture</strong> Document - <strong>IRDA</strong> Business Analytics ProjectKey FeaturesOption 3within 2-4 hours, although additionaltesting prior to services coming on line andpotential synchronisation errors maycause recovery time to be extended.Performance in case of disaster: Slightlyreduced relative to normal operation forcritical applications, reduced for noncritical applications.Benefits: Meets requirements (with somerisk on recovery time objective).Weaknesses: Failback to normal operationrequires a planned day of outage.No replication of data, recovery reliant instead onrestoration of data from tape. Low prioritysystems are not maintained, but ‘called off’ in a DRscenario.RPO: up to an hour of data loss.RTO: Recovery of critical applications likelyto take 2-4 hoursPerformance in case of disaster: Slightlyreduced relative to normal operation forcritical apps, reduced for non critical apps.Benefits: DR tests can be handled entirelyoffline and without interruption to normaloperations.Weaknesses: Failback to normal operationlikely to require a planned weekend ofoutage. DR tests are time consuming.Business Analytics Project Page 60
<strong>Solution</strong> <strong>Architecture</strong> Document - <strong>IRDA</strong> Business Analytics ProjectOptions and their fitment to Functional AreasOptions mapping against the recovery requirementsFunctional AreaOnline submissionof dataElectronicCommunications<strong>Report</strong>inganalyticsTrackingMonitoringWorkflowManagementDocumentManagementKnowledgeManagementandandSupport Servicesand OthersRequirement Option 1 Option 2 Option 3RTO RPO RTO RTO RPO RPO RTO RPO< 2 Hours Near Zero< 2 Hours Near Zero2-4 Hours < 30minutes2-4 Hours < 30minutes2-4 Hours < 30minutes< 7 days < 2 Hours< 7 days < 2 Hours< 7 days < 2 HoursLegendsDescriptionExpected to meet requirementBusiness Analytics Project Page 61
<strong>Solution</strong> <strong>Architecture</strong> Document - <strong>IRDA</strong> Business Analytics ProjectHigher operational risk in meetingrequirementsDoes not meet requirementComparison of OptionsOption 3 provides some improvements over the current state, primarily the certainty that afacility and systems will be available to recover the services. However the RTO objectives forpriory areas would be not met and recovery relies on relatively unreliable tapes. Option 3 is nota recommended approach given the scale of incremental investment required relative to thebenefit delivered.Option 2 meets most of the business recovery requirements and will cost lesser to implementthan Option 1. However, the cost difference is not as large as anticipated because theasynchronous replication software costs more than the synchronous equivalent and is licensedby terabyte of data replicated. This is likely to result in recurring charges increasing moresharply in this option, than in Option 1 (where the software is licensed per device).Option 1 meets the business recovery requirements. Assessing these options against selectioncriteria including IT operational risk, cost and match to business recovery requirements, Option1 can be the preferred solution. The relatively small incremental costs brings:ooooominimised data loss (zero for saved data in critical processes),faster recovery of services,relative ease of failback, negating any prolonged period of outage,ease of maintainability anda potential platform for further improving continuity in the future through ‘stretching’primary services between the DC and DR data centre. Although this would be at extracost, it is not possible with other options.Business Analytics Project Page 62
<strong>Solution</strong> <strong>Architecture</strong> Document - <strong>IRDA</strong> Business Analytics Project11.6 Strategy for Business Continuity Planning (BCP)In the context of IT services, typically BCP relates to creating backups or having alternate mechanism forproviding un-interrupted continuous services during a crisis. Adherence to the following list ensures thatthe BCP strategy works with utmost ease at the time of any contingency.The Alternate Site (AS) should be exactly like Main Site (MS) in storage capacity and shouldshare standby for each other in case of failure, switching immediately in case of a failure. Theperformance level should not go below 80% in case of failure of either site.During normal operations, both main site and alternate site should be running in the “Active-Passive” mode with an automatic load balancer between them, sharing 80 per cent of the fullenvisaged load.Maximum time for a down site to recover should be 24 hours.Minimal data loss should be envisaged during failure and that too only to the extent of databeing in the transmission lines. Also, all such incidents should be suitably notified to theclients/users.A drill should be carried out randomly once every month to test the BCP functionality.Vendors should be encouraged to suggest their own business continuity plan during tenderingprocess. Evaluation of solution proposed by the vendors and SLAs proposed by them should bekey parameters for evaluating the technical proposals.BCP (Business Continuity Planning) addresses the following types of failureLEVEL 0FailureFailure of a component in amachine (Machine can beNetwork InfrastructureDevices and Servers and Highenduser’s Systems)<strong>Solution</strong>Each machine should have 100 per cent fault tolerance capability.Fault Tolerance feature should be restored immediatelyThe faulty component should be replaced with a new componentand it should be sent for repair/warranty replacement, etc at theearliest.FailureFailure where the machinecomes to a halt (Machinerefer to NetworkInfrastructure Devices andServers and High-end user’sLEVEL 1<strong>Solution</strong>Each machine should have a backup counterpart.During problem/breakdown of a machine, backup machine shouldautomatically take over the job of primary machineThe faulty machine should be replaced with the new machine,which should be sent for repair/warranty replacement etc.Business Analytics Project Page 63
<strong>Solution</strong> <strong>Architecture</strong> Document - <strong>IRDA</strong> Business Analytics ProjectSystems)LEVEL 2FailureFailure which causes thecomplete site to haltFailureFailure which causes theentire site to halt, includingDR site<strong>Solution</strong>Two similar sites (one CDC and one DR site) have been proposedwhich should always be up and running for normal operation. Incase of higher recovery normal expectations a near site is alsoproposed which will get replicated at almost at a near real time.In case of problem/breakdown of a site, DRC should automaticallytake over the entire load and should start functioning as theprimary site.The status of faulty site shall be restored to normal as soon aspossible.LEVEL 3<strong>Solution</strong>Options such as hiring data center services from ISP vendors, etc.should be explored and latest backup should be restored to startthe operation.Efforts should be made to restore the normal status of main sitesand DR sites at the earliestBusiness Analytics Project Page 64
<strong>Solution</strong> <strong>Architecture</strong> Document - <strong>IRDA</strong> Business Analytics Project12. Service Level Agreement for <strong>IRDA</strong> Business Analytics <strong>Solution</strong>This section broadly outlines the various services to be carried out for the business analytics project12.1 Description and Scope of Services CoveredServicesDescriptionDevelopmentImplementationTrainingApplication SupportService MonitoringandThis service delivers the development and delivery of theapplication as per functional requirements specificationsand technical specificationsThis service captures end user training and systemadministrator training.This service captures bug fixing, fixing problems in theapplication and responding to calls with respect to theapplicationThis service captures events (IT alarms, alerts andnotifications) in the IT infrastructure and forwards themto appropriate personnel or systems for further action.Identity/Access Managementfor Infrastructure.Problem Management SupportIncident Management SupportBackup/Restore ManagementThis service manages and administers access to systemsand services in the infrastructure through user IDs,passwords and access control lists.This service proactively reduces incident occurrences byidentifying their root causes and takes actions tocoordinate development of workarounds for KnownErrors and actions to remove those errors from theapplicationThis service coordinates actions to restore normalbusiness operations as quickly as possible and minimizesthe adverse impact on business operations when agreedservice levels are threatened.This service provides backup and restoration of data,applications and systems used to underpin IT and ITBusiness Support services.Business Analytics Project Page 65
<strong>Solution</strong> <strong>Architecture</strong> Document - <strong>IRDA</strong> Business Analytics ProjectServicesDescriptionRelease and DeploymentSupportThis service plans, manages and coordinates activities todeploy service solutions as set out in release packages.ConfigurationSupportService TestingManagementThis service provides identification, tracking and controlinformation about service configurations in an accuratemanner and makes that information available to allinfrastructure services.This service ensures that new or changed IT services andtheir supporting infrastructure are adequately tested andaccepted for successful delivery and operation.Production AssuranceThis service provides oversight and testing of newservices and service changes prior to them going toproduction operations.Knowledge Management This service manages and administers knowledgerepositories, subscriptions and information to ensure thatthe right information is delivered to the appropriate placeor person at the right time.Capacity ManagementAvailability Management<strong>Solution</strong> Design ServicesStorage ManagementThis service ensures that all current and future capacityand performance aspects of the application are providedto meet business and service requirements at acceptablecost.This service optimizes the capability of the services andsupporting organization to deliver sustained levels ofservice availability that meet business requirements atacceptable costs.This service plans, and designs solutions to supportbusiness services, processes or functions.Provides a service to maintain and support infrastructuredigital storage assets used to underpin IT and businessservices.Business Analytics Project Page 66
<strong>Solution</strong> <strong>Architecture</strong> Document - <strong>IRDA</strong> Business Analytics Project13. Sizing and Performance Considerations for <strong>IRDA</strong> BusinessAnalytics ProgramThis section illustrates the methodologies to be followed and considered for data and hardware (server)sizing for the data storage for <strong>IRDA</strong> business analytics project. The exact calculations can be performedduring the design stage when all the table structures will be designed and ready to be developed.Data SizingSizing of the database exclusive of the indexesThe template below will capture the sizing estimates for the databases excluding indexes.DatabaseNameTable Type(Fact/ Master/Others)TableNameLength of theRow (B)Number ofRows(C)EstimatedSize(D=B*C)Total (E=D*No. ofYears ofHistoryData)TotalInputs Required:No. of Rows: For master tables, the no. of the members in that particular dimension along withtheir attributes will be the measure for the no. of rows in the particular table. For fact table itwill be the combination of all the members in different master tables together. For example, ifthere are 3 master tables, M-1, M-2 and M-3 having 3,4,5 members respectively, the total rowsin the fact table will be 3X4X5 = 60 rows. For the other transactional tables, an empirical orestimated no. of rows can be captured which is typically a percentage of the total no. of rows inthe fact table.Row Length: The data type represents the length of a row or the data storage for a particularrow. If the data type is VarChar it will be 8kb and if it is a SmallInt it will be 32 KB and so on. Thenumber when multiplied by the no. of rows will give the estimate for the data size for the entireBusiness Analytics Project Page 67
<strong>Solution</strong> <strong>Architecture</strong> Document - <strong>IRDA</strong> Business Analytics Projecttable of a data base. This estimated number when multiplied by no. of years of history data willrepresent the total storage size in KB.No. of Years of History Data: This will be typically the years of history data needed to capturefor tracking, monitoring, reporting and archiving.Sizing of the database inclusive of the indexesThe template below captures the sizing estimates for the databases including indexes. This is theminimum real memory requirement for the different database tables.DB NameDB Size(KB)Indexes (KB)Total (KB)Total(GB)TotalInputs RequiredDB Size (From previous calculation)Index SizeSizing of the database for incremental increase in data on a year on year basisThe template below captures the server for the data stored in the data bases based on incrementalgrowth of the data on a year on year basis. The incremental increase in data needs to be estimated forthis case.IndexedScenario Total Size (KB) Incremental Rate (%)TotalSizeData Rate(KB/sec)Not IndexedInputs RequiredTotal Size of the databases (From the previous calculations)Business Analytics Project Page 68
<strong>Solution</strong> <strong>Architecture</strong> Document - <strong>IRDA</strong> Business Analytics ProjectEstimated incremental Rate of Increase in data (on a YoY basis)Load EstimationEstimated Query Response TimeTheoretical calculations can be carried out on the queries to estimate the load on the networkconnections. The usage assumptions (given below) can be used to complete this analysis. Also, datafrom sizing estimates of the data stored can be used in calculating the average length of rows and thetotal number of rowsThe theoretical estimated query response is captured in the table shown below:Load Volume User Types Max RowsBytes/Row# Times User’sAccess System/SecondNumber ofConcurrentUsersGB / secScenario A:MaximumLoadLight UsersMediumUsersHeavy UsersMinimum Response Time (in secs)Scenario B:Typical LoadLight UsersMediumUsersHeavy UsersMinimum Response Time (in secs)Business Analytics Project Page 69
<strong>Solution</strong> <strong>Architecture</strong> Document - <strong>IRDA</strong> Business Analytics ProjectInputs RequiredUser profiles and assumptionsThe following assumptions associated with corporate query workload are defined in estimating therequired computing resources for the <strong>IRDA</strong> BAP solution data storage:Light users create approximately 1,000 bytes each transaction, with 15 transactions an hour foran 8-hour business dayMedium analytical processing/relational online analytical processing (OLAP/ROLAP) users createapproximately 4,000 bytes each transaction, with 20 transactions an hour for an 8-hour businessdayHeavy create approximately 75,000 bytes each transaction with 10 transactions an hour for an8-hour business dayBased on the above assumptions, complete the workload assumptions below:Workload InputsThe following assumptions associated with corporate user demographics are defined to assist incomputing resources required for the data storage for <strong>IRDA</strong> business analytics:__________% is heavy-users conducting exhaustive analysis with query tools supportingmultidimensional analysis__________% of the medium user community is medium users requiring online analyticalprocessing of large volumes of data__________% perform simple to medium complexity queries against the data warehouseApplications SpecificationsApplication specifications will enable determining data load to and from the BAP solution with respectto the queries in question:The following factors need to be considered when setting the requirements:Complicated CalculationsNumber of UsersHardware SpecificationsData SizeThe template below can be used to capture definitions of simple, medium and complex queries:Measures Dimensions Time Period ofData (In Years)# of TableJoins“Group By”StatementsBusiness Analytics Project Page 70
<strong>Solution</strong> <strong>Architecture</strong> Document - <strong>IRDA</strong> Business Analytics ProjectSimpleMediumComplexFrom the template above, the application usage for the different applications can be found out:ApplicationNameQueryComplexity(Simple, Med,etc.)Frequency# of ConcurrentUsersData Transfer Rate(KB/Second)The no. of users’ information can be found out from the users having access to the differentapplications.Network SizingThe purpose of this section is to determine the network (LAN/WAN) usage requirements and identifythe loads that may be placed on the network by the system.The assumptions and inputs required to perform network sizing for the <strong>IRDA</strong> Business Analytics solutionare:Volume of data requested by a user queryNo. of queries generated in a particular time span by concurrent usersThe highest volume of data for any of the queries shouldn’t exceed beyond a certain thresholdThe row of a database will have a defined average sizeA maximum of X concurrent users will execute the queries at a time.Business Analytics Project Page 71
<strong>Solution</strong> <strong>Architecture</strong> Document - <strong>IRDA</strong> Business Analytics ProjectThese assumptions/inputs will be captured for both the scenarios of maximum load and normal load.Data from this analysis can be captured in the template shown below:Load Volume Rows/Month Bytes/Row# Times User’sAccess System/SecondNumber ofConcurrentUsersKilobytes /SecondScenario A:Maximum LoadScenario B:Typical LoadFrom the template above, describe the network usage between the different servers:Applications Rows/Month Bytes/RowSystemAccess/Second# of ConcurrentUsersKB/SecondFor detailed data sizing of <strong>IRDA</strong> BAP for the different departments, please refer to Appendix CBusiness Analytics Project Page 72
<strong>Solution</strong> <strong>Architecture</strong> Document - <strong>IRDA</strong> Business Analytics Project14. Scalability and Obsolescence PlanAs the <strong>IRDA</strong> portal envisages a potential user base of insurers, employees/management of <strong>IRDA</strong>,Scalability is must-have aspect to be incorporated in the solution architecture, design, implementationand management. The proposed solution tries to meet the scalability requirements from a number ofangles, such as:Technical AngleThe following components of the technical solution would help cater to the envisaged scalabilityrequirements. These have also been covered in the application architecture section.Load balancing – this component would provide load balancing capabilities for incomingrequests, thereby allowing the portal user traffic to be uniformly serviced by a number of frontendservers. Application Server Web Caching would be used for providing this functionality.Caching – Caching services would provide a universal view of the caching by means of caching ofthe followingo Web contentooDataUser InformationThis would be made possible by retaining versions of rendered web pages, common web pageareas (headers, footer and navigation panels), frequently accessed data, rarely changing datafrom external applications/services. Caching would result in greater performance,responsiveness and scalability by reducing repeated database access for same data, execution ofweb page generation logic, cross-system calls or business logic. Caching layer would have builtinintelligence to hold data in the memory based on frequency of access, change frequency, userbehaviour. Techniques to invalidate the cache when newer data is available would also beapplied.Database – The database design, development and operational plans would be designed usingproven best practices for data centric applications to ensure maximum possible scalability.Operations AngleFrom an Operations perspective, the following best practices would be followed to ensure scalability.Regular database re indexingWell-defined database maintenance plansWell-defined maintenance plans for serversDiagnostic tuning of servers to ensure best performanceQuick Failure Isolation and replacement of faulty componentsBusiness Analytics Project Page 73
<strong>Solution</strong> <strong>Architecture</strong> Document - <strong>IRDA</strong> Business Analytics ProjectPeriodically measure the system performance counters of the server using System ManagementConsole to ensure that the hardware is scaling upDisable unnecessary heavy performance logging in the system. (e.g. Windows PerfMon)Defragment the storage periodicallyCheck the storage health periodicallyInfrastructure AngleFrom an Infrastructure perspective, the following best practices would be followed to ensure scalability.High Availability: Application, Web and database servers need to be designed in failover andfirm mode with an ability to ensure full-proof operationsRedundancy: Adequate processing and capacity redundancy need to be built in within thesystem to ensure zero to minimal disruption in the overall operationsOptimal network design to ensure best bandwidth usagesConsider the use of Web GardeningIdeal recycle times for the Web Server process. Ensure that it is set to be recycled based on theresource utilization.Business Analytics Project Page 74
<strong>Solution</strong> <strong>Architecture</strong> Document - <strong>IRDA</strong> Business Analytics Project15. Security Framework for <strong>IRDA</strong> Business Analytics <strong>Solution</strong>15.1 Application Security StrategyThe strategy for <strong>IRDA</strong> Business Analytics application level security including all development productioninstances is to grant security access on a “least privileged” basis. The least privileged security approachwill restrict users only to the components and reports that they require access to, in order to performtheir job. This will be accomplished by implementing an “All Doors Closed” approach to applicationsecurity within the Business Analytics <strong>Solution</strong>. This means that by default, users will be prevented fromaccessing interactive applications and data unless they have been explicitly authorized. Security levelsand techniques will be applied within the solution to achieve this objective, balancing securityrequirements with business needs.This security strategy will be implemented in a manner that provides for as efficient administrativeprocess, as possible after go live.Basic application security will be used to prevent access to key configuration and administrativeapplications. Action, processing option and other security methods will be implemented to furthersecure allowed objects.Access to applications, reports, and tools will be granted on an individual role basis. Each user willbelong to a security role to which security will be applied. IT will be allowed for the users to belong tomore than one security role. In general, the security roles will be designed such that each user will onlyhave one security role per environment. Security will be applied at the Role level, not the user level.15.2 Security Considerations<strong>IRDA</strong> will be utilizing many environments within one instance of the Business Analytics <strong>Solution</strong> duringthe design and implementation process, through to production. Users can be assigned specificenvironments and secured out of the remaining environments depending on their involvement in thedevelopment and testing of the system design. Each of the environments will have its own set ofbusiness data. Data in one environment cannot be accessed unless specific access is granted to a Useror Role to that environment.It is recommended that an audit of the user list be reviewed periodically after go live, to help to ensurethat users have been assigned appropriate environments and to identify unauthorized access to theProduction environment.Business Analytics Project Page 75
<strong>Solution</strong> <strong>Architecture</strong> Document - <strong>IRDA</strong> Business Analytics ProjectEnvironmentEnvironmentDescriptionPurposePD Production Live SystemTR Training Training of UsersQA Quality Assurance Validated TestingDV Development Development EnvironmentThe following table shows a list of access by environment for the development and project teams as wellas end users.PD TR QA DV CVKey Users N N Y N NAdministrators Y Y Y Y YProject Team N N N Y YTraining N Y N N NProduction Support Y N N N N15.3 Approach for Security TypesThe following is the strategy for utilizing the security options for the <strong>IRDA</strong> Business Analytics <strong>Solution</strong>1. Application Level Security plays an important role in the security strategy and approach formitigating risks in the “to be” environment after go live. Application security will be used toblock all users leaving the administrators to run and install components on the top of thesolution. This will in effect restrict users from running application or batch objects, by default.2. Action Level SecurityTo simplify security configuration the following variations of action security will be configured:Business Analytics Project Page 76
<strong>Solution</strong> <strong>Architecture</strong> Document - <strong>IRDA</strong> Business Analytics ProjectSetting Change Add Copy Delete ScrollVIEW ONLY N N N N NCHANGE ONLY Y N N N NADD ONLY N Y Y N NNO DELETE Y Y Y N NFULL ACCESS Y Y Y Y NIn interactive applications with drill down options, the security options must also be configuredfor that user or role to be able to drill down.3. Row Security will be used to restrict access, through Business Analytics <strong>Solution</strong>, to the data intables. The use of row security will be limited to situations where the other security types proveto be insufficient, due to the system performance implications.4. Column Security will be used to restrict access to the data in the Business Analytics <strong>Solution</strong> datatables and in applications and forms. As this security type does not have any significant impacton performance, it is expected that this security will be used in the <strong>IRDA</strong> BAP security design, incompliance with business requirements, in order to protect key data fields.5. Form Security will be used to restrict end users from opening unauthorized and restricted datainput forms for data entry.6. <strong>Report</strong> Security will be used to restrict access, through Business Analytics <strong>Solution</strong>, to theunauthorized static and canned reports.7. Analytical Security will be used to allow end users access to searching/selecting tables orbusiness views (i.e., creating ad-hoc queries).8. Design Security will be used on a need-only basis in the <strong>IRDA</strong> security design. This securityrestricts or allows the role the ability to make changes to the webpages/tabs/forms/reports/RDBMS and other components within the entire solution. Heretypically the access will be given to System Administrators.Business Analytics Project Page 77
<strong>Solution</strong> <strong>Architecture</strong> Document - <strong>IRDA</strong> Business Analytics Project15.4 Other Security Considerations1. Version Level SecurityVersion security is enabled for an application only if access to its version has to be restrictedfrom appearing on menu of a particular role(s). If application security is applied to an object,then it includes all versions by default unless it is specifically denied. If application security isapplied to a specific version, it will take precedence over security applied to the general object.2. Roles & EnvironmentEnvironments are defined at the Role level. A role needs to be explicitly granted access to anenvironment before privileges assigned to the role can be effective in that environment15.5 Role Based Security StrategySecurity roles will be based on the functional business process designs to be created by the businessanalytics implementation team and will be approved by the business process owners. Users will beassigned to these roles by the <strong>IRDA</strong>’s business process owners based on the user’s job functions.<strong>IRDA</strong> will develop separate user roles for the following groups of users:‣ Technical and Power User type roles‣ End User Functional Roles‣ Data input Roles (Roles designed specifically for the external stakeholders such as insurers andintermediaries etc.)For the detailed security setting for the <strong>IRDA</strong> business analytics project, please refer to Appendix FBusiness Analytics Project Page 78
<strong>Solution</strong> <strong>Architecture</strong> Document - <strong>IRDA</strong> Business Analytics Project15.6 Technical Framework for SecurityThis section elaborates the security need of <strong>IRDA</strong> to safeguard the data, information, other contents,applications from various internal and external security threats. a three tier security system is proposedfor the Business Analytics <strong>Solution</strong>, as following:ApplicationSystem and NetworkThe abovementioned security tiers will cover the various security aspects as following:System &InformationIntegrityIdentification&AuthenticationAccess ControlAudit &AccountabilitySystem &CommunicationProtectionApplicationMulti FactorAuthenticationDigitalSignatureRole BasedAccessAudit LoggingSSLEncryptionSystemSoftwareIntegrityStrongPasswordsIdentityManagementRole BasedAccessAudit LoggingFirewallHIDS/NIDSNetworkMulti FactorAuthenticationACLSAudit LoggingMulti FactorAuthenticationACLSEach security tier has been explained in details the Appendix EBusiness Analytics Project Page 79
16. Data and Document Migration Strategy16.1 Data Migration ObjectivesThe key data migration objectives of the Business Analytics projects are to:Migrate active transactional data from source systems to target solution with no deteriorationin data quality;Provide read only access to inactive transactional data either through solution or alternatereporting mechanisms; andDispose of any redundant data.There may also be a requirement for migration routines to be developed to populate reference datawithin the new application or sub modules.16.2 Data Migration ScopeData SourcesThe data sources that needs to be considered in data migration activities areHardcopiesExcel SpreadsheetsText FilesMS – Word DocumentsExisting legacy systems databasesBusiness Analytics Project Page 80
16.3 Data Migration – Business ConsiderationsThe historic data that is not required to be migrated into the new application will be retained offline.Ideally the Regulatory Programme data migration approach would adhere to the business’ archivingstrategies and standards and utilise existing archiving approaches and solutions. From a migrationperspective three options are available as a stop gap arrangement in case of absence of a formalarchiving strategy:Option Pros Cons1 Migrate all ‘Active’ and‘Inactive’ data that thebusiness cares about into thenew applications.Once the archiving solutionhas been developed for thenew application the migrateddata can be archived via thesolution as per the businessarchiving strategy.Consistent archivingapproach can be taken.Logic for migration datasetsmay be simplified.Users have access to live andhistoric data through thesame interface.Large volumes of data that isnot required withinoperational systems whichmay impair performance andusability of new applicationfunctionality.Development of archivingstrategy and solution may besome time after newapplications are implemented.2 Data requiring offline accessis migrated to an enterprisereporting / warehousesolution.Enterprise warehousingsolution could provide abilityfor the business to conductad-hoc reporting and dataanalysis against historic data.Migration effort is morecomplex than option 3 as afourth target system is addedto the scope.Development effort requiredto build/extend a reporting/warehouse solution.3 Existing legacy databases aretaken offline and access todata is via reports (cannedand ad-hoc) across thedatabase.Restricts the volume of datathat requires migration.Restricts the volume ofmultiply migrated datarecords within newapplications.Migration source retainsintact for post migrationaudits and queries.Once new applicationarchiving solutions areimplemented offlinedatabases may requiremigration into the archivingsolution.Business Analytics Project Page 81
Logical State ofData →16.4 Data Migration – Technical ConsiderationsWhile implementing data migration architecture, the data migration team has to take a number ofconsiderations. Following are a few of such considerations:Data volume analysisSource system and target system processing powerComplexity of data mapping rules and business rulesIf during transformation, several records are normalized into separate database records that will resultin a significant increase in the overall data volume, extract data from the source system(s) as is andmove it to a staging area in the target system, then apply cleansing and transformations locally.Highlights:Reduced network round tripLocal transformations means the actual data migration process is over, data has actuallyreached the targeted server.Leverage processing power of target server16.5 Data Migration ApproachThe data migration process for <strong>IRDA</strong> Business Analytics Program will chiefly have three stepsConversion of data into electronic formatSemantically or logically aligning dataTransforming the data into physical formatsFollowing table illustrates the approach needs to be taken for the different combinations of physical andlogical states of the data.Physical Data ModelConceptual Data ModelContentPhysical Tabular StructurePaper DataPhysical Tabular StructureExcel based dataPhysical Tabular StructureRDBMS storageConceptual level Structure Conceptual level Structure Conceptual level StructurePaper DataExcel based dataRDBMS storageNo Logical Structure Conceptual level Structure Conceptual level StructurePaper dataExcel based dataRDBMS storageHardcopy Excel RDBMSPhysical State of Data →Depending upon the state of data both logical and physical appropriate courses of actions needs to betaken.Business Analytics Project Page 82
16.6 Data and Document Migration MethodologyPre – Migration Activities and DeliverablesKey activities:Identify data source and their detailsRun system extracts and queriesConduct user interviews and awareness programs on data migration processReview migration scope and validation strategyCreate work plan and milestone datesIdentify data cleansing needs and expectationsCreate data prep worksheetsClean up source data in current systemFormat unstructured data in other systemsRun extracts and queries to determine data qualityCreate metrics to capture data volume, peak hours and off-peak hoursDeliverables/OutputsMigration scope documentMigration validation strategy documentWork plan with milestone datesData CleansingOne of the main activities in this stage will be to clean the data to minimize data quality issues in thedata sources.A data quality issue can be categorised into two types:1. A ‘semantic’ data quality issue in which data does not comply with ‘As Is’ business rules; or2. A ‘physical’ data quality issue in which the data which does not comply with application rules,data definitions or validations in either existing source systems or new applications.While there are synergies between migration and cleansing, there can be no. of challenges faced whichare the following:Identification of ‘semantic’ data quality issues requires an in depth knowledge of the businessdomain which will required <strong>IRDA</strong> business users involvementResolution of such quality issues requires subjective judgement which draws on businessexpertise.Business Analytics Project Page 83
Many data quality issues require resolutions that are too complex to automate successfullythrough the backend and can only be fixed manually via the frontend application.Data migration is a critical activity which requires as stable a dataset as possible.Data migration must be complete before implementation, whereas only a small proportion ofcleansing of ‘semantic’ quality issues are likely to be critical to the implementation andoperation of the new system.Invariably during the data migration life cycle, data quality issues will be identified that will prevent asuccessful migration. Therefore the Business Analytics data migration team will need to work with thedata owners to facilitate resolutions for such issues. The data migration team will maintain a dataquality issue register and pass any identified data quality issues back to the business owner forresolution. Each business unit impacted by the migration of the data from different sources will berequired to identify a data quality champion to whom any the data quality issues can be referred andwho will coordinate their resolution prior to the migration activity.To allow the business the greatest lead time possible, the <strong>IRDA</strong> Business Analytics Program datamigration team will conduct analysis across the dataset requiring migration to identify as many dataquality issues that may impact the data migration process as early as possible in the life cycleAs part of the migration process data from the source systems may be ‘transformed’ to make itcompatible with the target application. The data transformation logic may be able to fix simple ‘physical’data quality issues such as:Removal of leading and trailing white space;Removal of illegal character types;Mapping of invalid codes to valid codes;Change of case e.g. upper to lower case; etc.Business Analytics Project Page 84
Migration Activities and DeliverablesKey Activities: Create/verify data element mappings Run data extracts from current system(s) Create tables, scripts, jobs to automate the extraction Address additional data clean-up issues Execute application specific customizations Run mock migrations Conduct internal data validation checks including business rules and referential integrity checks Perform data validation Prepare migration validation reports and data movement metrics Review migration validation reports and metrics Record count verifications on the new system Reconcile or resolve any exceptions or unexpected variations Sign off on migration validationDeliverables/Outputs Extracts from source system Data migration modules, jobs, scripts New application(s) loaded with converted data Exceptions, alerts and error handling control points Exception reports, cross-reference files/manuals Signed-off data migration validation documentPost – Migration Activities and DeliverablesKey Activities Complete data migration reports and cross-reference files/manuals Data Archiving StrategyDeliverables / Outputs Data archiving strategy documentBusiness Analytics Project Page 85
16.7 Data Archiving StrategyIt is important to determine the specific level of controls necessary for each piece of data. Data shouldbe classified into groups based on its value or sensitivity. The data classification process should definethe information controls necessary to ensure appropriate confidentiality. <strong>IRDA</strong> should utilize aninformation classification program for their data as per International Standard ISO -15489, whichdescribes requirements to identify, retain, and protect records used in the course of business to ensureintegrity with proper handling.Roles and ResponsibilitiesIt is necessary to identify individuals by their authority and access requirements to implement policies,standards, and procedures. Three groups of authority are recommended in the context of DocumentControl and they are Owner, Custodian and User. It should be noted that the roles may be overlappingand an individual may simultaneously handle multiple roles.Data OwnerThe executives or managers should form this group responsible for the data content. Responsibilitiesinclude, but are not limited to the following:Data content verificationAssign information classification levelAssigning of appropriate controlsSpecify acceptable use of the dataIdentify appropriate users and the Data CustodianData UserThis group consists of users who use the computerized data for various official purposes. These usersmay be internal or external to the organization. Responsibilities include, but are not limited to thefollowing:Follow standards of acceptable use and compliance with the owner's controlsMaintain confidentiality of the data and report unauthorized activityData CustodianImplementation of data storage safeguards and ensuring availability of the data is the primaryresponsibility of this group. This group should provide support to the business user(s).Responsibilities include, but are not limited to the following:Business Analytics Project Page 86
Implement controls matching information classificationMonitor data security for violations and administer user access controlsEnsure data integrity through processing controlsBack up data to protect from lossAct as a point of resolution for any confusion relating to dataFor details of marking, transmission, storage, restoration, and destruction procedures / guidelines forinformation assets, please refer to Appendix G16.8 Physical and Analog Data Conversion tools and techniquesThere are several tools and techniques available for converting physical analog data to electronic data.All the hardcopies of the document submitted as an attachment by the insurers and other users of thesystem in <strong>IRDA</strong> can be converted into electronic formats using these techniques. In the context of <strong>IRDA</strong>,two techniques are suggested:Manual data entry – This is the conventional and most prevalent technique and is applied byemploying data entry operators who will on a regular basis for a certain time period in theimplementation schedule will manually enter data using the hardcopy and the physical files in <strong>IRDA</strong>in a format prescribed during the design stage and finally the data will get stored in the systemdatabases.Data Digitization and scanning – Digitization is a method of converting analog form of data to digitaland electronic formats using advanced tools and technologies without the need of manualintervention. Scanning is a method of converting physical formats of data into electronic formats likeimages and PDFs etc. Data digitization and scanning in <strong>IRDA</strong> will involve the following processes:ooooooIdentification of the items for the collection – Identify which data are needed to beconverted into digital formats. For example, actuarial report and abstract submitted bythe insurer to the actuarial department.Choice of formats – Deciding upon the formats to which these data is going to beconverted. For example, *.doc, *.html, *.rtf etc.Choice of hardware – Hardware infrastructure needed to convert this data to electronicformat. For example, scanners, OCRs (Optical Character Readers), computers etc.Choice of software – Selection of the software supporting digitization such as OCR andICR.Storage and archiving – Calculating the storage space required for the digitized data.Management – Managing the activities so as to ensure optimal results. There severalfactors to be kept in mind for getting the desired quality for digitization such asconditions and coloring of the source documents, font types, persons handling theBusiness Analytics Project Page 87
activities etc. along with unknown factors. All these needs to be managed whilemanaging the entire activity of digitizationFollowing diagram is a representation of the workflow of the manual data conversion activities to becarried out in <strong>IRDA</strong>.<strong>IRDA</strong> Physical Data ConversionWorkflowStartPhysical Documentssubmitted by insurersand others areaccumulated fordigitalization andscanningIdentification ofbatchesDocuments aredigitalized/scannedRe- scanning/digitizing ofdocuments forbetter accuracyWhether the data isproperly captured as perdesired results?With ErrorsHigh Level errorafter scanning/digitizingMedium Levelerror afterscanning/digitizingLow Level orminor errors afterscanning/digitizingThoroughcleansing andEditing of dataMinor Cleansingand editing of datato increaseaccuracyError FreeEndBack-upArchive the document indocument managementsystemScannedWhether thedocument isscanned ordigitized?DigitizedCreation ofmetadataDigitized data getsstored in thedatabasesBack-up ofdatabase is taken.EndBusiness Analytics Project Page 88
16.9 Risks and challenges in Data MigrationKey Risks and ChallengesThe success of the data migration project lies in a seamless data movement and always remains on theshadow of implementing the new system. 3Following are few common risks involved in a data migration process.Failure to treat data migration as a project unto itself. Data migration is complex undertaking thatshould not be regarded as merely a peripheral effort to the main development project. The datamigration effort should be treated as a complete sub-project with a defined process, a thoughtfullyderived time and cost estimate, and a series of phases that can be tracked or managed.Underestimating the time and cost of data migration. It is important to perform a reasonably diligentsurvey of source systems in order to determine the quality of those source system's documentation andsource data. If the source system does not have up-to-date data documentation in the form of datamodel and data dictionary, the task of determining the structure and data types of the desired sourcedata and it's mapping to the target data will be increased in time and cost. If the source system has lessstringent data quality requirements than the target system or if the data quality of the source systemhas been allowed to lapse over time, the actual act of performing the migration will take longer timedue to the need to perform post-migration data clean up.Lack of end-state data quality. If the migration effort does not formally specify the level of end-statedata quality and the set of quality control tests that will be used to verify that data quality, the targetdomain may wind up with poor data quality. This will negatively impact the perceived outcome of thedevelopment effort.Failure to support the organizational support. When the complexity and importance of data migrationis not adequately appreciated it may be difficult to gain organizational support for that data migration,especially in terms of funding and resources. It may be even more difficult to garner a positive levelsupport in separate organizations that have primary responsibility for the source data. This can happenwhen the organization supporting the source data feels threatened by the new system or it can happensimply because the migration effort is not a top priority for that organization.Lack of appreciation for the complexities of data mapping. The central effort of data migration isunderstanding the source data and developing the mapping that allows the data in the source domain tobe accurately transformed and moved to the target domain. There are many factors affecting mappingthat can be ignored:Ensuring that the semantics sense of a given attribute is correctly mapped: the same datum maycarry a different name in the source domain than in the target domain; the source domain and thetarget domain may carry the same name for what is conceptually a different datum.3 For details of risks related to Business Analytics Project, please refer to “Risk Mitigation Strategy” section of theimplementation plan documentBusiness Analytics Project Page 89
Understanding that the number of entities and their respective relationships may be vastly differentbetween the source domain and the target domain.Strategies and extensions may have to be developed to handle certain intractable mappings if theyare discovered. An attribute may exit in the source domain that does not exist in the target domainand vice versa.These issues and subsequent impacts may manifest themselves in both quantitative and qualitativeways:In quantitative sense this can result in:Costs associated with error detectionCosts associated with error reworkCosts associated with error preventionTime delays in operationsCosts associated with delays in processingIn a qualitative sense this can result in:Difficult and/or erroneous decisionsOrganization wide data inconsistencyLow acceptance level by users of the new systemRisks Mitigation ProcessThe most important factors in mitigating the risks of data migration are to treat the data migration as aproject and to use a sound methodical process having the following KPIs:Data Profiling - Gain a complete understanding of the content, structure, quality, and integrity ofthe data of the source system.Data Mapping - Develop an accurate set of data mapping specifications from the source system tothe target system.Migration Approach and Architectural Considerations - Whether point-to-point migration or huband-spokemigration, this needs to be evaluated and carefully articulated.Development – Selecting a tool to automate the migration process and make it more scalableshould be a high-priority item.Quality Assurance - Conduct mock migrations, pilot migrations before the final migration run; thiswill ensure that the migration process is robust and trusted.Business Analytics Project Page 90
AppendixA. Department wise data model1. Life DepartmentLife – New Business DataInsurer1. Insurer ID2. Insurer Name3. Insurer Type4. Date of RegistrationDivision1. Division ID2. Division NameNB FactTime1. Year ID2. Half Year ID3. Quarter ID4. Month ID5. DayPremium Type1. Premium Type ID2. Premium TypeProduct1. Product Category2. Category ID3. Target Group4. Product Name5. UIN6. Date of approval7. Average TermLine of Business1. LOB ID2 LOB Name3. LOB Type1. Insurer ID2. Quarter ID3. Channel ID4. Business ID5. State ID6. Premium Type ID7. Division ID8. UIN9. Group IDNew Business MetricsGeography1. Classification2. Country ID3. Country Name4. State ID5 State Name6. City Name7.. Pin CodeLocation1. Location ID2. Location NameChannel Type1. Channel ID2. Channel NameGroup1. Group ID2. Group NameBusiness Analytics Project Page 91
Associated Forms (Life-Department)Code Form Name Objective FrequencyINPUT_LIFE_9New BusinessData - ChannelwiseTo capture the new business data against allchannels at an overall levelQuarterlyINPUT_LIFE_9.1New BusinessData - Productand Channel WiseTo capture the new business data for eachchannel and productYearlyINPUT_LIFE_10New BusinessData - State wiseTo capture data on new business acrossstates for individual and group business.QuarterlyINPUT_LIFE_12Group NewBusiness Categorywise DataTo capture information on New Business -(single premium and regular premium) fordifferent schemes of group businessQuarterlyINPUT_LIFE_11(b)Business Data onSocial SecuritySchemesTo capture data on Social Security Schemesfunded/subsidized by Government ofIndia/State GovernmentYearlyINPUT_LIFE_9.2 New Business -Commissions DataTo capture the commissions expenses datafor an insurerYearlyINPUT_LIFE_14Details of NewBusiness Data ForMI - Channel wiseTo capture data on new business against allthe micro insurance channels along with no.of total existing MI products.QuarterlyINPUT_LIFE_14.1Details of NewBusiness Data ForMI - Product andChannel wiseTo capture data on new business for each MIproduct and channel typeYearlyINPUT_LIFE_14(a)New BusinessData For MI -State wiseTo captures the state wise break up of MINew Business DataQuarterlyBusiness Analytics Project Page 92
Similar Forms from Other Departments (F&A-Department)Code Form Name Objective FrequencyINPUT_FnA_LIFE_NBSNew BusinessData for LifeDepartmentTo capture the new business data for lifeinsurance productsMonthlyINPUT_FnA_LIFE_SCHEDULE2CommissionExpenses – Line ofBusiness WiseTo capture the detailed breakup of thecommission expense for each line of businessYearlyBusiness Analytics Project Page 93
InsurerProductLoBPremiumTypeDivisionChannelTypeGeographyGroupLocationTimeDimensionsDept.Form NameNew Business Data - Channel wise X C X X X X QNew Business Data - Product and ChannelWiseX P X X X X YNew Business Data - State wise X C X X X X QGroup New Business Category wise Data X C X X X QLifeBusiness Data on Social Security Schemes X P X X X QNew Business - Commissions Data X C X X X YDetails of New Business Data For MI - ChannelwiseDetails of New Business Data For MI - Productand Channel wiseX X X QX P X X YNew Business Data For MI - State wise X X X QF&ANew Business Data for Life Department X C X X X X X MCommission Expenses – Line of Business Wise X X X YC: Category Level; P: Product levelM: Monthly; Q: Quarterly; Y: YearlyBusiness Analytics Project Page 94
Life – Renewal Business DataInsurer1. Insurer ID2. Insurer Name3. Insurer Type4. Date of RegistrationDivision1. Division ID2. Division NameRNB FactTime1. Year ID2. Half Year ID3. Quarter ID4. Month ID5. Day1. Insurer ID2. Quarter ID3. Channel ID4. Business ID5. Premium Type ID6. Division IDRenewal Business MetricsLine of Business1. LOB ID2 LOB Name3. LOB TypeProduct1. Product Category2. Category ID3. Target Group4. Product Name5. UIN6. Date of approval7. Average TermChannel Type1. Channel ID2. Channel NameBusiness Analytics Project Page 95
InsurerProductLoBDivisionChannelTypeTimeAssociated Forms (Life Department)Code Form Name Objective FrequencyINPUT_LIFE_9.3Renewal BusinessData - Product andChannel WiseTo capture the renewal business data foreach channel and productYearlyINPUT_LIFE_9.4Renewal BusinessData - Channel wiseTo capture the new business data againstall channels and sub-segments (rural,urban, semi urban and metro)QuarterlyDimensionsDept.Form NameLifeRenewal Business Data - Product and ChannelWiseX P X X X YRenewal Business Data - Channel wise X C X X X QBusiness Analytics Project Page 96
Life – Claims DataInsurer1. Insurer ID2. Insurer Name3. Insurer Type4. Date of RegistrationPremium Type1. Premium Type ID2. Premium TypeProduct1. Product Category2. Category ID3. Target Group4. Product Name5. UIN6. Date of approval7. Average TermLine of Business1. LOB ID2 LOB Name3. LOB TypeClaims Fact1. Insurer ID2. Quarter ID3. Channel ID4. Business ID5. State ID6. Premium Type ID7. Division ID8. Product Category ID9. Claim IDGeography1. Classification2. Country ID3. Country Name4. State ID5 State Name6. City Name7.. Pin CodeDivision1. Division ID2. Division NameClaims MetricsTime1. Year ID2. Half Year ID3. Quarter ID4. Month ID5. DayChannel Type1. Channel ID2. Channel NameClaim Details1. Claim ID2. Claim Type3. Claim Description4. Claimant NameBusiness Analytics Project Page 97
Associated Forms (Life Department)Code Form Name Objective FrequencyINPUT_LIFE_11(a)Claims Data onSocial SecuritySchemesTo collect the state wise claims information on socialsecurity schemesQuarterlyINPUT_LIFE_16Survival/PeriodicBenefits andMaturityBenefits(Individual)To capture the data on survival/periodic and maturitybenefits under individual businessQuarterlyINPUT_LIFE_17(a)Death Claims(Individual)To capture the data on death claims for individualbusinessQuarterlyINPUT_LIFE_17(b)Death Claims(Group)To capture the data on death claims for groupbusinessQuarterlyINPUT_LIFE_17©Rider ClaimsDataTo capture the data on rider claims for individualbusinessQuarterlyINPUT_LIFE_18State wise DeathClaimsMovement FormTo capture the claims data for each state for bothindividual and group businessQuarterlyINPUT_LIFE_18.2Details of ClaimsHandledthrough TPAsTo capture the movement of claims handled throughTPAQuarterlyINPUT_LIFE_19(a)MI ClaimsMovement Form– MaturityTo capture the claims data for MI business – MaturityonlyQuarterlyINPUT_LIFE_19(b)MI ClaimsMovement Form- Death ClaimsTo capture the claims data for MI business – Deathclaims onlyQuarterlyINPUT_LIFE_20Penal InterestPaid - Claimsand BenefitsTo capture the data on penal interest paid topolicyholders.QuarterlyINPUT_LIFE_21 Health Claims To capture data for health claims QuarterlyBusiness Analytics Project Page 98
InsurerProductLoBPremiumTypeDivisionChannelTypeGeographyClaimDetailsTimeAssociated Forms (Life Department)Code Form Name Objective FrequencyDataINPUT_LIFE_23RepudiatedClaims DataTo capture claim wise details for each instance ofrepudiationQuarterlySimilar Forms from Other Departments (Non Life Department)Code Form Name Objective FrequencyINPUT_NONLIFE_Pending_ClaimsClaims pendingfor more thansix months andrepudiatedclaimsTo capture claim wise details for each instance ofrepudiation and pendency for more than 6 monthsQuarterlyDimensionsDept.Form NameClaims Data on Social Security Schemes X P X X QSurvival/Periodic Benefits and MaturityBenefits (Individual)X C X X X QLifeDeath Claims (Individual) X C X X X QDeath Claims (Group) X C X X X QRider Claims Data X X QState wise Death Claims Movement Form X X X X QDetails of Claims Handled through TPAs X X QBusiness Analytics Project Page 99
InsurerProductLoBPremiumTypeDivisionChannelTypeGeographyClaimDetailsTimeDimensionsDept.Form NameMI Claims Movement Form – Maturity X X QMI Claims Movement Form - Death Claims X X X QPenal Interest Paid - Claims and Benefits X X QHealth Claims Data X X QRepudiated Claims Data X P X QNon LifeClaims pending for more than six months andrepudiated claimsX P X QBusiness Analytics Project Page 100
Life – Agency StatisticsTimeInsurer1. Insurer ID2. Insurer Name3. Insurer Type4. Date of RegistrationAgency Statistics Fact1. Insurer ID2. Quarter ID3. Channel ID4. State ID5. Slab ID1. Year ID2. Half Year ID3. Quarter ID4. Month ID5. DayAgency Statistics MetricsChannel TypeGeography1. Classification2. Country ID3. Country Name4. State ID5 State Name6. City Name7.. Pin CodePolicy Slab1. Slab ID2. Slab Name1. Channel ID2. Channel NameBusiness Analytics Project Page 101
InsurerGeographyChannelTypeTimePolicy SlabAssociated Forms (Life Department)Code Form Name Objective FrequencyINPUT_LIFE_1AgencyStatisticsDataTo capture the data on movement of agents duringthe year for each insurerQuarterlyINPUT_LIFE_1.3AgencyStatisticsData – SlabWiseTo capture the detailed breakup of the agents basedon different policy slabsQuarterlyINPUT_LIFE_1(a)AgencyStatisticsData – StatewiseTo capture the data on no. of agents at the end ofquarter for each state.QuarterlyINPUT_LIFE_1(b))MicroInsuranceAgencyStatisticsDataTo capture the data on movement of MI agentsduring the year for each insurerQuarterlyINPUT_LIFE_1(c)MicroInsuranceAgencyStatisticsData - StatewiseTo collect the data on no. of MI agents at the end ofquarter for each state.QuarterlyDimensionsDept.Form NameAgency Statistics Data X X Q XLifeAgency Statistics Data – Slab Wise X X Q XAgency Statistics Data – State wise X X X QBusiness Analytics Project Page 102
InsurerGeographyChannelTypeTimePolicy SlabDimensionsDept.Form NameMicro Insurance Agency Statistics Data X X QMicro Insurance Agency Statistics Data - StatewiseX X X QBusiness Analytics Project Page 103
Life – Office DataTimeInsurer1. Insurer ID2. Insurer Name3. Insurer Type4. Date of Registration1. Insurer ID2. Month ID3. Office ID4. City ID5. Location IDOffice Fact1. Year ID2. Half Year ID3. Quarter ID4. Month ID5. DayGeographyOffice Data Metrics1. Classification2. Country ID3. Country Name4. State ID5 State Name6. City Name7.. Pin CodeLocationOffice Details1. Office Type2. Office ID3. Office Name1. Location ID2. Location NameBusiness Analytics Project Page 104
Associated Forms (Life Department)Code Form Name Objective FrequencyINPUT_LIFE_2New OfficeApplication Form(Online)Each insurer who seeks to open newoffices will have to fill up the form forapproval of <strong>IRDA</strong>As andWhenINPUT_LIFE_2(a)Intimation ofopening/relocation/closureof officesInsurers are required to inform <strong>IRDA</strong>about opening/relocation/closure ofoffices in the reporting month.MonthlyINPUT_LIFE_4Office StatisticsData – State WiseTo capture the movement of no. ofoffices for an insurer state wise.QuarterlySimilar Forms from Other Departments (Non Life Department)Code Form Name Objective FrequencyINPUT_NON_LIFE_ Office_1 OFFICE DETAILS To collect the information on the office(Branch) details in each state for eachinsurer.QuarterlyINPUT_NON_LIFE_Office_1.1Details of foreignofficesTo capture the information on theforeign offices classified asrepresentative offices, branches,subsidiaries, agency officesQuarterlyBusiness Analytics Project Page 105
InsurerGeographyOfficeDetailsTimeLocationDimensionsDept.Form NameNew Office Application Form (Online) X X X D XLifeIntimation of opening/ relocation/closure ofofficesX X X M XOffice Statistics Data – State Wise X X M XNon LifeOFFICE DETAILS X X QDetails of foreign offices X X QBusiness Analytics Project Page 106
Life – OthersInsurer1. Insurer ID2. Insurer Name3. Insurer Type4. Date of RegistrationPremium Type1. Premium Type ID2. Premium TypeProduct1. Product Category2. Category ID3. Product Name4. Product IDLine of BusinessDivision1. Division ID2. Division NameOthers1. Insurer ID2. Quarter ID3. Case ID4.Premium ID5. Division ID6. Product Category ID7. Channel ID8. LOB ID9.. URNOther FactsTime1. Year ID2. Half Year ID3. Quarter ID4. Month ID5. DayCase Details1. Case Location2. Case Source3. Case IDChannel Type1. Channel ID2. Channel Name1. LOB ID2 LOB Name3. LOB TypeAdvertisementDetails1. URN2. Date of Launch3. Ad Type4.Co Insurer Name5. MediumBusiness Analytics Project Page 107
Associated Forms (Life Department)Code Form Name Objective FrequencyINPUT_LIFE_5(a)Premium AwaitedPolicies (For thequarter)To capture the details of the premiumawaited policies for a particular quarterQuarterlyINPUT_LIFE_5(b)Premium AwaitedPolicies (For thequarter)To capture the details of the premiumawaited policies up to a particular quarterQuarterlyINPUT_LIFE_6Data on legal casesfor an insurerTo capture movement of no. of legalcases during a particular period for aninsurerQuarterlyINPUT_LIFE_7Details ofAdvertisementsReleasedTo capture detailed level information ofthe advertisements those are released.MonthlyINPUT_LIFE_7(a)Details ofAdvertisementsFiled for Approval -Joint SalesAdvertisementTo capture the detailed level informationof the joint sales advertisementsAs and WhenINPUT_LIFE_13Data forsurrenders, partialwithdrawals,switches and topups.To capture the information on surrenders,partial withdrawals, switches and top-ups.QuarterlyINPUT_LIFE_22Free Look andCheque dishonordataTo collect data on free look and chequedishonor data during the quarter.QuarterlyINPUT_LIFE_24 Persistency Data To capture persistency data for an insurerchannel wiseQuarterlyBusiness Analytics Project Page 108
InsurerProductLoBPremiumTypeDivisionChannelTypeAdvertisement DetailsCase DetailsTimeDimensionsDept.Form NamePremium Awaited Policies (For the quarter) X C X QPremium Awaited Policies (Up to the quarter) X C X QData on legal cases for an insurer X X QDetails of Advertisements Released X X MLifeDetails of Advertisements Filed for Approval -Joint Sales AdvertisementXXData for surrenders, partial withdrawals,switches and top-ups.X C X X QFree Look and Cheque dishonor data X X QPersistency Data X C X X QBusiness Analytics Project Page 109
2. Non Life DepartmentConceptual Data Model – Non Life Business DataInsurer1. Insurer ID2. Insurer Name3. Insurer Type4. Date of RegistrationTime1. Year ID2. Half Year ID3. Quarter ID4. Month ID5. DayBusiness Data FactLocation1. Location ID2. Location Name1. 1. Insurer ID ID2. 2. Quarter ID ID3. 3. Channel Channel ID ID4. LoB ID4. State ID5. State ID5. LOB ID6. Location IDBusiness Data FactsChannel Type1. Channel ID2. Channel NameGeographyLine of Business1. LoB ID2. LoB Name3 LoB Type1. Classification2. Country ID3. Country Name4. State ID5. State Name6. City Nam7. Pin CodeBusiness Analytics Project Page 110
Associated Forms (Non-Life-Department BS Data)Code Form Name Objective FrequencyINPUT_NON_LIFE_PREMIUM_1Segment wise GrossPremium data across allChannels - For the quarterTo collect Segment wise and State wiseinformation on Gross Premium, No. ofPolicies and Total Sum Assured acrossChannels of Non-Life General businessQuarterlyINPUT_NON_LIFE_PREMIUM_1.1Segment wise GrossPremium data across allChannels - Upto the quarterTo collect Segment wise and State wiseinformation on Gross Premium, No. ofPolicies and Total Sum Assured acrossChannels of Non-Life General businessQuarterlyINPUT_NON_LIFE_PREMIUM_2Segment wise directbusiness - Upto the quarterTo collect Segment wise and State wiseinformation on Gross Premium, No. ofPolicies and Total Sum Assured fordirect businessQuarterlyINPUT_NON_LIFE_PREMIUM_2.1Segment wise directbusiness - For the quarterTo collect Segment wise and State wiseinformation on Gross Premium, No. ofPolicies and Total Sum Assured fordirect businessQuarterlySimilar Forms from Other Departments (F&A-Department)-Code Form Name Objective FrequencyINPUT_FnA_NONLIFE_NBSNew BusinessData for Non LifeDepartmentTo capture the new business data for non lifeinsurance productsMonthlyBusiness Analytics Project Page 111
InsurerLoBChannelTypeGeographyTimeLocationDimensionsDept.Form NameNon LifeSegment wise Gross Premium data across allChannels - For the quarterSegment wise Gross Premium data across allChannels - Upto the quarterSegment wise direct business - Upto thequarterSegment wise direct business - For thequarterX X X X QX X X X QX X X X QX X X X QFnA New Business Data for Non Life Department X X X X M XC: Category Level; P: Product levelM: Monthly; Q: Quarterly; Y: YearlyBusiness Analytics Project Page 112
Conceptual Data Model for Non-Life – Product PerformanceAnalysisInsurer1. Insurer ID2. Insurer Name3. Insurer Type4. Date of RegistrationTime1. Year ID2. Half Year ID3. Quarter ID4. Month ID5. DayProduct Performance FactLine of Business1. Business ID2. Business Name3. Business Type1. Insurer ID2. Business ID3. Quarter ID4. Channel ID5. UINProduct PerformanceMetricsChannel Type1. Channel ID2. Channel NameProduct1. Product Category2. Category ID3. Target Group4. Product Name5. UIN6. Date of approval7. Average TermBusiness Analytics Project Page 113
Associated Forms (Non-Life Department-Product Performance Analysis)Code Form Name Objective FrequencyINPUT_NONLIFE_PDTPERF1.0Details of productperformance for productswith 1 year contractTo collect product information foreach product launched during theyear.Yearly and asand whenrequiredINPUT_NONLIFE_PDTPERF2.0Details of productperformance for productswith more than 1 yearcontractTo collect product information foreach product launched during theyear.Yearly and asand whenrequiredINPUT_NONLIFE_PDTPERF3.0Details of productperformance in terms ofclaims development andaging (To be furnished byAll insurers having non-lifeproducts)To collect claims movement andclaims aging data for each productlaunched during the year.QuarterlyINPUT_NONLIFE_PDTPERF4.0Details of productperformance in terms ofchannels (To be furnishedby All insurers having nonlifeproducts)To capture the performance of theproducts in terms of distributionchannelsYearly and asand whenrequiredSimilar Forms from Other Departments (F&A Department)Code Form Name Objective FrequencyINPUT_FnA_NonLife_Schedule3Details of commissionsexpensesTo collect commissions expenses fornon life insurersYearlyBusiness Analytics Project Page 114
InsurerProductLoBChannelTypeTimeDimensionsDept.Form NameNon LifeDetails of product performance for productswith 1 year contractDetails of product performance for productswith more than 1 year contractDetails of product performance in terms ofclaims development and aging (To befurnished by All insurers having non-lifeproducts)Details of product performance in terms ofchannels (To be furnished by All insurershaving non-life products)X P X X YX P X X YX P QX P X YFnA Details of commissions expenses X X YBusiness Analytics Project Page 115
Non Life – Claims DataInsurer1. Insurer ID2. Insurer Name3. Insurer Type4. Date of RegistrationTime1. Year ID2. Half Year ID3. Quarter ID4. Month ID5. DayClaims FactLine of Business1. LOB ID2 LOB Name3. LOB Type1. Insurer ID2. LOB ID3. Quarter ID4. Channel ID5. State ID6. Claim IDClaims MetricsChannel Type1. Channel ID2. Channel NameGeography1. Classification2. Country ID3. Country Name4. State ID5 State Name6. City Name7. Pin CodeClaim Details1. Claim ID2. Claim Type3. Claimant NameBusiness Analytics Project Page 116
InsurerLoBChannelTypeGeographyClaimDetailsTimeAssociated Forms (Non-Life Department- Claims Data)Code Form Name Objective FrequencyINPUT_NON_LIFE_CLAIMS_1State wise and channelwise claims reportedTo collect information on the claims reportedin each state during the quarter.QuarterlyINPUT_NON_LIFE_CLAIMS_2Catestrophic/largeClaims Details -StatewiseTo capture the claims details of catastropheclaims or large claims in each stateQuarterlyINPUT_NONLIFE_Pending_ClaimsClaims pending formore than six monthsand repudiated claimsTo capture the details for each instances ofclaim if pending for more than six months orrepudiatedQuarterlyDimensionsDept.Form NameState wise and channel wise claims reported X X X X QNon LifeCatestrophic/large Claims Details - Statewise X X X X X QClaims pending for more than six months andrepudiated claimsX X QBusiness Analytics Project Page 117
Conceptual Data Model for Non Life Micro InsuranceInsurer1. Insurer ID2. Insurer Name3. Insurer Type4. Date of RegistrationNon Life Micro InsuranceFact1. Insurer ID2. Quarter ID3. Cover Type ID4. State IDTime1. Year ID2. Half Year ID3. Quarter ID4. Month ID5. DayMicro Insurance MetricsGeographyCover Type1. Classification2. Country ID3. Country Name4. State ID5 State Name6. City Name7. Pin CodeCover Type ID1. Cover Type ID2. Cover TypeNameBusiness Analytics Project Page 118
InsurerGeographyCover TypeTimeAssociated Forms (Non-Life Department- Micro Insurance)Code Form Name Objective FrequencyINPUT_NON_LIFE_MI_1MICROINSURANCESTATISTICS -Forthe quarterTo gather information on MicroInsurance Business Details across allstates.QuarterlyINPUT_NON_LIFE_MI_1.1MICROINSURANCESTATISTICS -Uptothe quarterTo gather information on MicroInsurance Business Details across allstates.QuarterlyDimensionsDept.Form NameMICROINSURANCE STATISTICS -For the quarter X X X QNon LifeMICROINSURANCE STATISTICS -Upto thequarterX X X QBusiness Analytics Project Page 119
Non Life – Office DataInsurer1. Insurer ID2. Insurer Name3. Insurer Type4. Date of RegistrationOffice DataTime1. Year ID2. Half Year ID3. Quarter ID4. Month ID5. Day1. Insurer ID2. State ID3. Quarter ID4. Office ID5. Location IDGeography1. Classification2. Country ID3. Country Name4. State ID5 State Name6. City Name7. Pin CodeOffice MetricsLocation1. Location ID2. Location NameOffice Details1. Office Type2. Office ID3. Office Name4. Office AddressBusiness Analytics Project Page 120
InsurerGeographyOfficeDetailsTimeLocationAssociated Forms (Non Life Department-Office Data)Code Form Name Objective FrequencyINPUT_NON_LIFE_Office_1OFFICE DETAILS-QuarterlyTo collect the information on the office(Branch) details in each state for eachinsurer.QuarterlyINPUT_NON_LIFE_Office_1.1Details of foreignofficesTo collect the information on theforeign offices classified asrepresentative offices, branches,subsidiaries, agency officesQuarterlyDimensionsDept.Form NameNon LifeOFFICE DETAILS-Quarterly X X X QDetails of foreign offices X X X Q XBusiness Analytics Project Page 121
3. Non Life Reinsurance DepartmentNon Life Reinsurance – Treaty Wise DataRe-Insurer1. Reinsurer ID2. Reinsurer Name3. Reinsurer Type4. Date of RegistrationInsurer1. Insurer ID2. Insurer Name3. Insurer Type4. Date of RegistrationTime1. Year ID2. Half Year ID3. Quarter ID4. Month ID5. DayProduct1. Product Category2. Category ID3. Target Group4. Product Name5. UIN6. Date of approval7. Average TermNon Reinsurance - Fact1. Reinsurer ID2. Year ID3. Treaty ID4. Insurer ID5. LOB ID6. UINReinsurance MetricsTreaty Details1. Treaty ID2. Treaty Type3. Treaty Name4. Nature of Treaty5. Basis of TreatyLine of Business1. LOB ID2 LOB Name3. LOB TypeBusiness Analytics Project Page 122
Associated Forms (Non Life Reinsurance Department)Code Form Name Objective FrequencyINPUT_NL_REINSURANCE_1List of reinsurance treatiesduring the yearTo capture the information on thereinsurers, treaties and productscovered in each treaty.YearlyINPUT_NL_REINSURANCE_1.1Summary of reinsurancetreaties during the yearTo capture the summary of the treatiesdone by the insurers during the yearYearlyINPUT_NL_REINSURANCE_2Particulars of ProportionalTreaty For the YearTo capture the details of theProportional treaties filed by theinsurerYearlyINPUT_NL_REINSURANCE_2.1Performance of ProportionalTreaty - To be furnished byinsurersTo collect the performance data on theproportional treatyYearlyINPUT_NL_REINSURANCE_3Particulars of Excess of LossCover Treaty For the YearTo capture the details of the excess ofloss cover treaties filed by the insurerYearlyINPUT_NL_REINSURANCE_3.1Performance of excess of losscover treaty - To be furnishedby InsurersTo collect the performance data on theExcess of Loss Cover treatyYearlyINPUT_NL_REINSURANCE_10Facultative PlacementCompliance <strong>Report</strong>To capture the details of the facultativeplacement data at policy level.YearlyBusiness Analytics Project Page 123
InsurerLoBProductTypeReinsurerTimeTreatyDetailsDimensionsDept.Form NameNon LifeReinsuranceList of reinsurance treaties during theyearSummary of reinsurance treaties duringthe yearParticulars of Proportional Treaty For theYearPerformance of Proportional Treaty - Tobe furnished by insurersParticulars of Excess of Loss Cover TreatyFor the YearPerformance of excess of loss covertreaty - To be furnished by InsurersX X P X Y XX X Y XX X P X Y XX X Y XX X P X Y XX Y XC: Category Level; P: Product levelM: Monthly; Q: Quarterly; Y: YearlyFacultative Placement Compliance <strong>Report</strong> X X X Y XBusiness Analytics Project Page 124
Non Life Reinsurance-Program DataRe-Insurer1. Reinsurer ID2. Reinsurer Name3. Reinsurer Type4. Date of RegistrationInsurer1. Insurer ID2. Insurer Name3. Insurer Type4. Date of RegistrationTime1. Year ID2. Half Year ID3. Quarter ID4. Month ID5. DayPremium Type1. Premium Type ID2. Premium TypeProduct1. Product Category2. Category ID3. Target Group4. Product Name5. UIN6. Date of approval7. Average TermLine of BusinessReinsurance ProgramFact1. Reinsurer ID2. Quarter ID3. Claim ID4. Insurer ID5. LOB ID6. Premium Type ID7. UIN8. Sub Class ID9. Treaty IDReinsurance ProgramMetricsSub Class DetailsTreaty Details1. Treaty ID2. Treaty Type3. Treaty Name4. Nature of Treaty5. Basis of TreatyClaim Details1. Claim ID2. Claim Type3. Claimant Name1. LOB ID2 LOB Name3. LOB Type1. Sub Class ID2. Sub Class NameBusiness Analytics Project Page 125
InsurerLoBProductReinsurerTimeTreatyDetailsSub ClassClaimDetailsPremiumTypeAssociated Forms (Non Life Reinsurance Department)Code Form Name Objective FrequencyINPUT_NL_REINSURANCE_1.2Details of reinsurance Program -To be furnished by InsurerTo collect the details ofreinsurance program of eachinsurerYearlyINPUT_NL_REINSURANCE_11Detailed report on reinsuranceprogramThis report shows of the detailsof the reinsurance programYearlyDimensionsDept.Form NameNon LifeReinsuranceDetails of reinsurance Program - To befurnished by InsurerX X Y X X XDetailed report on reinsurance program X X P X Y X X XBusiness Analytics Project Page 126
Non Life Reinsurance-Business DataInsurer1. Insurer ID2. Insurer Name3. Insurer Type4. Date of RegistrationTime1. Year ID2. Half Year ID3. Quarter ID4. Month ID5. DayReinsurance BusinessData Fact1. Insurer ID2. Yearr ID3. Treaty ID4. LOB IDReinsurance BusinessData MetricsTreaty DetailsLine of Business1. LOB ID2 LOB Name3. LOB Type1. Treaty ID2. Treaty Type3. Treaty Name4. Nature of Treaty5. Basis of TreatyBusiness Analytics Project Page 127
InsurerLoBTimeTreatyDetailsAssociated Forms (Non Life Reinsurance Department)Code Form Name Objective FrequencyINPUT_NL_REINSURANCE_4Reinsurance Statisticsunder Reg 3(12) -Business Within India(to be furnished byInsurers)To collect the information on ReinsuranceStatistics for Business within IndiaYearlyINPUT_NL_REINSURANCE_5Reinsurance Statisticsunder Reg 3(12) -Foreign Business (To befurnished by Insurers)To collect the information on ReinsuranceStatistics for Business outside IndiaYearlyDimensionsDept.Form NameNon LifeReinsuranceReinsurance Statistics under Reg 3(12) -Business Within India (to be furnished byInsurers)Reinsurance Statistics under Reg 3(12) -Foreign Business (To be furnished byInsurers)X X Y XX X Y XBusiness Analytics Project Page 128
Non Life Reinsurance-Recoveries DataRe-Insurer1. Reinsurer ID2. Reinsurer Name3. Reinsurer Type4. Date of RegistrationInsurer1. Insurer ID2. Insurer Name3. Insurer Type4. Date of RegistrationReinsurance RecoveriesFactTime1. Year ID2. Half Year ID3. Quarter ID4. Month ID5. DayLine of Business1. LOB ID2 LOB Name3. LOB Type1. Reinsurer ID2. Quarter ID3. Treaty ID4. Insurer ID5. LOB IDReinsurance RecoveriesMetricsTreaty Details1. Treaty ID2. Treaty Type3. Treaty Name4. Nature of Treaty5. Basis of TreatyBusiness Analytics Project Page 129
InsurerLoBTimeTreatyDetailsReinsurerAssociated Forms (Non Life Reinsurance Department)Code Form Name Objective FrequencyINPUT_NL_REINSURANCE_6Details of OutstandingRecoveries - To befurnished by the insurerTo collect information on outstandingrecoveries for the reinsurers. This form wouldbe furnished by each insurerYearlyINPUT_NL_REINSURANCE_6.1Aging data ofreinsurance recoverableTo capture the details of reinsurancerecoverable along with its aging as perdifferent bucketsQuarterlyDimensionsDept.Form NameReinsuranceDetails of Outstanding Recoveries - To befurnished by the insurerX X Y X XAging data of reinsurance recoverables X X Q X XBusiness Analytics Project Page 130
Non Life Reinsurance-Claims DataInsurer1. Insurer ID2. Insurer Name3. Insurer Type4. Date of RegistrationReinsurance Claims FactTime1. Year ID2. Half Year ID3. Quarter ID4. Month ID5. Day1. Insurer ID2. Quarter ID3. LOB ID4. ClassificationReinsurance ClaimsMetricsGeographyLine of Business1. LOB ID2 LOB Name3. LOB Type1. Classification2. Country ID3. Country Name4. State ID5 State Name6. City Name7. Pin CodeBusiness Analytics Project Page 131
InsurerLoBTimeGeographyAssociated Forms (Non Life Reinsurance Department)Code Form Name Objective FrequencyINPUT_NL_REINSURANCE_12Claims data for reinsuranceTo capture the claims data related toreinsuranceQuarterlyINPUT_NL_REINSURANCE_13Premium and Claims DataTo capture the data for premiumsand claims with detailed break upsand finally calculating claims ratioQuarterlyNon LifeReinsuranceClaims data for reinsurance X X Q XPremium and Claims Data X X Q XBusiness Analytics Project Page 132
Reinsurance-Others DataInsurer1. Insurer ID2. Insurer Name3. Insurer Type4. Date of RegistrationReinsurance Others FactTime1. Year ID2. Half Year ID3. Quarter ID4. Month ID5. Day1. Reinsurer ID2. Quarter ID3. Insurer ID4. Rating Agency IDReinsurance OthersMetricsRating Agency1. Rating Agency ID2. Rating AgencyTypeRe-Insurer1. Reinsurer ID2. Reinsurer Name3. Reinsurer Type4. Date of RegistrationBusiness Analytics Project Page 133
InsurerReinsurerRatingAgencyTimeAssociated Forms (Reinsurance Department-Others Data)Code Form Name Objective FrequencyINPUT_NL_REINSURANCE_9Reinsurance ConcentrationTo capture the information on therisk profile of reinsurer in terms ofreinsurers' rating.YearlyDimensionsDept.Form NameReinsurance Reinsurance Concentration X X X YBusiness Analytics Project Page 134
4. Health DepartmentConceptual Data Model – Health Business DataInsurer1. Insurer ID2. Insurer Name3. Insurer Type4. Date of RegistrationTime1. Year ID2. Half Year ID3. Quarter ID4. Month ID5. DayBusiness Data Fact1. Insurer ID2. Quarter ID3. Channel ID4. Business ID5. State IDChannel Type1. Channel ID2. Channel NameBusiness Data MetricsGeographyLine of Business1. LoB ID2. LoB Name3. LoB Type1. Classification2. Country ID3. Country Name4. State ID5 State Name6. City Name7. Pin CodeBusiness Analytics Project Page 135
InsurerLoBChannelTypeGeographyTimeAssociated Forms (Health Department)Code Form Name Objective FrequencyINPUT_HEALTH_4.1Details of new business andrenewal business - StatewiseTo capture the statewise new businessand renewal business activities for eachinsurerYearlyDimensionsDept.Form NameHealthDetails of new business and renewalbusiness - StatewiseX X X X QC: Category Level; P: Product levelM: Monthly; Q: Quarterly; Y: YearlyBusiness Analytics Project Page 136
Conceptual Data Model for Health – Product PerformanceAnalysisInsurer1. Insurer ID2. Insurer Name3. Insurer Type4. Date of RegistrationTime1. Year ID2. Half Year ID3. Quarter ID4. Month ID5. DayProduct Performance FactLine of Business1.Insurer ID2.Quarter ID3.LOB ID4.Channel ID5.TPA ID6.UIN7.Claims IDChannel Type1. Channel ID2. Channel Name1. LOB ID2 LOB Name3. LOB TypeClaims DetailsInsurer1. Claim ID2. Claim Type3. Claimant Name4. Claim DescriptionProduct Performance MetricsProduct1. Product Category2. Category ID3. Target Group4. Product Name5. UIN6. Date of approval7. Average TermTPA1. TPA ID2. TPA Name3. Date of RegistrationBusiness Analytics Project Page 137
Associated Forms (Health Department)Code Form Name Objective FrequencyINPUT_HEALTH_1 Details of product performance -Products with 1 year or less than1 year term (To be furnished byAll insurers having healthproducts)INPUT_HEALTH_1(a) Details of product performance -Products with more than 1 yearterm (To be furnished by Allinsurers having health products)To collect product informationfor all products having term 1year or less than 1 yearTo collect product informationfor all products having termmore than 1 yearYearly and asand whenrequiredYearly and asand whenrequiredINPUT_HEALTH_1.1Details of product performancein terms of claims developmentand aging (To be furnished by Allinsurers having health products)To collect claims movementand claims aging dataYearly and asand whenrequiredINPUT_HEALTH_2Details of product performancein terms of claims managementw.r.t TPA (To be furnished byinsurers having health insurancebusiness)To capture the performance ofthe products in terms of claimsmanagement w.r.t TPAYearly and asand whenrequiredINPUT_HEALTH_3Details of product performancein terms of channels (To befurnished by insurers havinghealth insurance business)To capture the performance ofthe products in terms ofdistribution channelsYearly and asand whenrequiredINPUT_HEALTH_6.4Performance of Universal HealthInsurance Scheme (UHIS)/RSBYThis form is used to capture thedetails of the Performance ofUniversal Health InsuranceScheme (UHIS)/RSBY for aninsurerQuarterlyBusiness Analytics Project Page 138
InsurerProductLoBChannelTypeTPAClaims TypeTimeDimensionsDept.Form NameHealthDetails of product performance - Productswith 1 year or less than 1 year term (To befurnished by All insurers having healthproducts)Details of product performance - Productswith more than 1 year term (To be furnishedby All insurers having health products)Details of product performance in terms ofclaims development and aging (To befurnished by All insurers having healthproducts)Details of product performance in terms ofclaims management w.r.t TPA (To befurnished by insurers having health insurancebusiness)Details of product performance in terms ofchannels (To be furnished by insurers havinghealth insurance business)Performance of Universal Health InsuranceScheme (UHIS)/RSBYX P X YX P X YX P X YX P X X YX X YX P QBusiness Analytics Project Page 139
Health – Claims DataInsurer1. Insurer ID2. Insurer Name3. Insurer Type4. Date of Registration1. Division ID2. Division Name1. Insurer ID2. Quarter ID1. Insurer ID3. Channel ID4.2.BusinessDivisionIDID5. 3. State Quarter ID ID6.Premium 4. TPA ID8. 5. Division Claim ID ID9. Product ID10. Claim IDDivisionClaims FactTime1. Year ID2. Half Year ID3. Quarter ID4. Month ID5. DayTPA1. TPA ID2. TPA Name3. Date of RegistrationClaims FactsClaim Details1. Claim ID2. Claim Type3. Claimant NameBusiness Analytics Project Page 140
Associated Forms (Health Department)Code Form Name Objective FrequencyINPUT_HEALTH_6Details of ClaimsHandled directly- To besubmitted by theinsurers having healthbusiness (Individual)To collect the information of the claimshandled directly by insurers having healthbusiness for the individual businessMonthlyINPUT_HEALTH_6.1Details of ClaimsHandled directly- To besubmitted by theinsurers having healthbusiness (Group)To collect the information of the claimshandled directly by insurers having healthbusiness for the group businessMonthlyINPUT_HEALTH_6.2Details of ClaimsHandled through TPA-To be submitted by theinsurers having healthbusinessTo collect the information of the claimshandled through TPA.MonthlyINPUT_HEALTH_6.3Details of Claims for anInsurer- StatewiseTo collect the information of the claims for aninsurer.YearlyINPUT_HEALTH_12Claims Data for TPAs(To be furnished byTPAs)To capture the claims data for TPAs. And theclaims from policyholders, claims fromhospitals and claims in aggregate level.MonthlyINPUT_HEALTH_13Details of OutstandingClaims ( outstanding formore than 6 months)for TPA (To befurnished by TPAs)To capture the detailed level informationabout those claims those are outstanding formore than 6 months.YearlyBusiness Analytics Project Page 141
InsurerDivisionClaimDetailsTPATimeDimensionsDept.Form NameHealthDetails of Claims Handled directly- To besubmitted by the insurers having healthbusiness (Individual)Details of Claims Handled directly- To besubmitted by the insurers having healthbusiness (Group)Details of Claims Handled through TPA- To besubmitted by the insurers having healthbusinessX X MX X MX X X X MDetails of Claims for an Insurer- Statewise X X YClaims Data for TPAs (To be furnished byTPAs)Details of Outstanding Claims ( outstanding formore than 6 months) for TPA (To be furnishedby TPAs)X X X MX X YBusiness Analytics Project Page 142
Health-TPA AnalysisInsurer1. Insurer ID2. Insurer Name3. Insurer Type4. Date of RegistrationTime1. Year ID2. Half Year ID3. Quarter ID4. Month ID5. DayTPA Analysis Fact1. Insurer ID2. Quarter ID3. TPA IDTPA Analysis MetricsTPA1. TPA ID2. TPA Name3. Date of RegistrationBusiness Analytics Project Page 143
InsurerTPATimeAssociated Forms (Health Department)Code Form Name Objective FrequencyINPUT_HEALTH_5 Details of Due payable to TPA To measure the effectiveness offunctions of TPAs in terms of claimfloat and TPA FeesMonthlyINPUT_HEALTH_7Details of TPA AdministrativeConfiguration (To befurnished by TPAs)To capture the existingadministrative configuration of TPA.This form includes data on directors,CEOs and CAOs.YearlyINPUT_HEALTH_8TPA Contract Details (To befurnished by TPAs)To capture the data on the contractsof TPAs with insurers andhospitals/doctors along with the dataon claims processed during previousyearYearlyDimensionsDept.Form NameDetails of Due payable to TPA X X MHealthDetails of TPA Administrative Configuration(To be furnished by TPAs)XYTPA Contract Details (To be furnished byTPAs)X X YBusiness Analytics Project Page 144
Health –TPA Financial AnalysisFinancial Analysis of TPAsFact1. Quarter ID2. TPA IDFinancial Analysis of TPAsFactsTime1. Year ID2. Half Year ID3. Quarter ID4. Month ID5. DayTPA1. TPA ID2. TPA Name3. Date of RegistrationBusiness Analytics Project Page 145
TPATimeAssociated Forms (Health Department)Code Form Name Objective FrequencyINPUT_HEALTH_8.1Contract Details andShare Holding pattern (Tobe furnished by TPAs) -QuarterlyTo collect data on details of capitalstructure and shareholding pattern ofTPAs.QuarterlyINPUT_HEALTH_9Profit & Loss Statementfor TPAs (To be furnishedby TPAs)This return contains the Profit & LossStatement of the TPAs. The format ofprofit and loss statement is standardacross all TPAs for easy consolidationof the financialsYearlyINPUT_HEALTH_10Profit & LossAppropriation Format forTPAs (To be furnished byTPAs)To capture the profit & lossappropriation for each TPAYearlyINPUT_HEALTH_11Balance Sheet for TPAs(To be furnished by TPAs)To represent the balance sheet itemsof the TPAs.YearlyDimensionsDept.Form NameContract Details and Share Holding pattern(To be furnished by TPAs) - QuarterlyXQHealthProfit & Loss Statement for TPAs (To befurnished by TPAs)Profit & Loss Appropriation Format for TPAs(To be furnished by TPAs)XXYYBalance Sheet for TPAs (To be furnished byTPAs)XYBusiness Analytics Project Page 146
5. Actuarial DepartmentActuarial – IBNR DataInsurer1. Insurer ID2. Insurer Name3. Insurer Type4. Date of RegistrationTime1. Year ID2. Half Year ID3. Quarter ID4. Month ID5. Day1. Insurer ID2. Quarter ID3. Actuary ID4. LoB IDActuarial IBNR FactActuarial IBNR MetricsLine of Business1. LOB ID2 LOB Name3. LOB TypeActuary1. Actuary ID2. Actuary NameBusiness Analytics Project Page 147
Associated Forms (Actuarial Department)Code Form Name Objective FrequencyINPUT_NL_ACTUARIAL_1IBNR-A: Statementof IBNR ProvisionTo capture data on IBNR Provisionsfor those policiesQuarterlyINPUT_NL_ACTUARIAL_2IBNR-B1(a):CumulativeStatement of PaidClaimsDevelopment ( ByAmount)To capture data on amount of paidclaims development in terms ofamountQuarterlyINPUT_NL_ACTUARIAL_2.1IBNR-B1(b):CumulativeStatement ofIncurred ClaimsDevelopment ( ByAmount)To capture data on amount ofincurred claims development in termsof amountQuarterlyINPUT_NL_ACTUARIAL_3IBNR-B2(a):CumulativeStatement of PaidClaimsDevelopment ( ByNumber)To capture data on incurred claimsdevelopment in terms of numberQuarterlyINPUT_NL_ACTUARIAL_3.1IBNR-B2(b):CumulativeStatement ofIncurred ClaimsDevelopment ( ByNumber)To capture data on incurred claimsdevelopment in terms of numberQuarterlyINPUT_NL_ACTUARIAL_4Utilization of ClaimsData - AccidentYear WiseTo capture the utilization of claimsdata - accident year wiseQuarterlyBusiness Analytics Project Page 148
InsurerActuaryLoBTimeAssociated Forms (Actuarial Department)Code Form Name Objective FrequencyINPUT_NL_ACTUARIAL_5Utilization of ClaimsData - FinancialYear WiseTo capture the utilization of claimsdata – financial year wiseQuarterlyINPUT_NL_ACTUARIAL_6Incurred ClaimsRatio Data -Accident Year WiseTo capture incurred claims ratio data -Accident year wiseQuarterlyIBNR-A: Statement of IBNR Provision X X X QActuarialIBNR-B1(a):Cumulative Statement of PaidClaims Development ( By Amount)IBNR-B1(b):Cumulative Statement ofIncurred Claims Development ( By Amount)IBNR-B2(a):Cumulative Statement of PaidClaims Development ( By Number)IBNR-B2(b):Cumulative Statement ofIncurred Claims Development ( By Number)X X X QX X X QX X X QX X X QUtilization of Claims Data - Accident YearWiseUtilization of Claims Data - Financial YearWiseIncurred Claims Ratio Data - Accident YearWiseXXXQYYBusiness Analytics Project Page 149
Actuarial – Valuations DataInsurer1. Insurer ID2. Insurer Name3. Insurer Type4. Date of RegistrationDivision1. Division ID2. Division NameActuarial – Valuations FactTime1. Year ID2. Half Year ID3. Quarter ID4. Month ID5. DayPremium Type1. Premium Type ID2. Premium Type1. Insurer ID2. Quarter ID3. Business ID4. State ID5. Premium Type ID6. Division ID7.UIN8. Group IDProduct1. Product Category2. Category ID3. Target Group4. Product Name5. UIN6. Date of approval7. Average TermActuarial Valuation - MetricsGeographyGroupLine of Business1. LOB ID2 LOB Name3. LOB Type1. Classification2. Country ID3. Country Name4. State ID5 State Name6. City Name7.. Pin Code1. Group ID2. Group NameBusiness Analytics Project Page 150
Associated Forms (Actuarial Department)Code Form Name Objective FrequencyINPUT_ACTUARIAL_1Form DD - Formfor NewBusiness andTotal In-ForceBusiness DataTo capture the data on new business in the yearand total in-force business during the year.YearlyINPUT_ACTUARIAL_2Form DDD -Form forBusinessMovementduring the yearTo capture the business movement during theyearYearlyINPUT_ACTUARIAL_3Form DDDD -Details ofLapsed andReinstatedpoliciesTo capture the details of lapsed policies andreinstated policies during the yearYearlyINPUT_ACTUARIAL_4Form NLB 1 -Details of inforcepolicies atproduct level (Non-LinkedPolicies)To capture the details of in-force policies atproduct level in the yearYearlyINPUT_ACTUARIAL_5Form LB 1 -Details of inforcepolicies atproduct level(LinkedBusiness)To capture the details of in-force policies atproduct level in the yearYearlyINPUT_ACTUARIAL_6Form LB 2 -Statement ofNet Asset Valuefor theSegregatedTo capture the performance of the segregatedfunds in unit linked business in the yearYearlyBusiness Analytics Project Page 151
Associated Forms (Actuarial Department)Code Form Name Objective FrequencyFundsMaintained bythe insurer(LinkedBusiness)INPUT_ACTUARIAL_7Form LB 3 -Statement ofNo. of units inthe SegregatedFundsMaintained bythe insurer(LinkedBusiness)To capture the data of units of the segregatedfunds in unit linked business in the yearYearlyINPUT_ACTUARIAL_8Form KT-1 -Statement ofsolvency marginTo capture the data on solvency marginmaintained by insurer in the yearYearlyINPUT_ACTUARIAL_9Form KT-2 -Statement ofsolvency marginTo capture the data on solvency marginmaintained by insurer in the yearYearlyINPUT_ACTUARIAL_10Form KT - Q -Statement ofavailablesolvency marginand solvencyratioTo capture the data on solvency marginmaintained by insurer in the quarterQuarterlyINPUT_ACTUARIAL_10.1Form KT - 3 -Statement ofavailablesolvency marginand solvencyratioTo capture the data on solvency marginmaintained by insurer in the yearYearlyBusiness Analytics Project Page 152
InsurerProductLoBPremiumTypeDivisionGeographyGroupTimeAssociated Forms (Actuarial Department)Code Form Name Objective FrequencyINPUT_ACTUARIAL_11 Form IA To capture the information on negative reserves YearlyINPUT_ACTUARIAL_12Form HTo capture the mathematical reserves atclassification and category level.YearlyINPUT_ACTUARIAL_13Valuation BasesTo capture the valuation parameters used in thevaluation of productsYearlyINPUT_ACTUARIAL_14Return onAssetsTo capture the details of return on assets forpolicyholders' fund and shareholders' fundYearlyINPUT_ACTUARIAL_15Details offoreignoperationTo capture the details of the foreign operationsof each insurerYearlyINPUT_ACTUARIAL_16Components ofglobal reservesTo capture the details of additional informationon global reservesYearlyForm DD - Form for New Business and TotalIn-Force Business DataX C X X X X X YActuarialForm DDD - Form for Business Movementduring the yearForm DDDD - Details of Lapsed andReinstated policiesForm NLB 1 - Details of in-force policies atX C X X X X X YX C X X X X X YX P X X X X X YBusiness Analytics Project Page 153
InsurerProductLoBPremiumTypeDivisionGeographyGroupTimeproduct level ( Non-Linked Policies)Form LB 1 - Details of in-force policies atproduct level (Linked Business)X C X X YForm LB 2 - Statement of Net Asset Value forthe Segregated Funds Maintained by theinsurer (Linked Business)X C X X X X X YForm LB 3 - Statement of No. of units in theSegregated Funds Maintained by the insurer(Linked Business)Form KT-1 - Statement of solvency marginForm KT-2 - Statement of solvency marginForm KT - Q - Statement of available solvencymargin and solvency ratioForm KT - 3 - Statement of available solvencymargin and solvency ratioForm IAForm HValuation BasesX P X X X X X YX C X X YX X YX X QX X YX C X X YX C X X X X YX P X YReturn on AssetsXYDetails of foreign operationX X YComponents of global reservesXYBusiness Analytics Project Page 154
Actuarial – Valuations DataInsurer1. Insurer ID2. Insurer Name3. Insurer Type4. Date of RegistrationDivision1. Division ID2. Division NameActuarial – Valuations FactTime1. Year ID2. Half Year ID3. Quarter ID4. Month ID5. DayPremium Type1. Premium Type ID2. Premium Type1. Insurer ID2. Quarter ID3. Business ID4. State ID5. Premium Type ID6. Division ID7.UIN8. Group IDProduct1. Product Category2. Category ID3. Target Group4. Product Name5. UIN6. Date of approval7. Average TermActuarial Valuation - MetricsGeographyGroupLine of Business1. LOB ID2 LOB Name3. LOB Type1. Classification2. Country ID3. Country Name4. State ID5 State Name6. City Name7.. Pin Code1. Group ID2. Group NameBusiness Analytics Project Page 155
Associated Forms (Actuarial Department)Code Form Name Objective FrequencyINPUT_ACTUARIAL_1Form DD - Formfor NewBusiness andTotal In-ForceBusiness DataTo capture the data on new business in the yearand total in-force business during the year.YearlyINPUT_ACTUARIAL_2Form DDD -Form forBusinessMovementduring the yearTo capture the business movement during theyearYearlyINPUT_ACTUARIAL_3Form DDDD -Details ofLapsed andReinstatedpoliciesTo capture the details of lapsed policies andreinstated policies during the yearYearlyINPUT_ACTUARIAL_4Form NLB 1 -Details of inforcepolicies atproduct level (Non-LinkedPolicies)To capture the details of in-force policies atproduct level in the yearYearlyINPUT_ACTUARIAL_5Form LB 1 -Details of inforcepolicies atproduct level(LinkedBusiness)To capture the details of in-force policies atproduct level in the yearYearlyINPUT_ACTUARIAL_6Form LB 2 -Statement ofNet Asset Valuefor theSegregatedTo capture the performance of the segregatedfunds in unit linked business in the yearYearlyBusiness Analytics Project Page 156
Associated Forms (Actuarial Department)Code Form Name Objective FrequencyFundsMaintained bythe insurer(LinkedBusiness)INPUT_ACTUARIAL_7Form LB 3 -Statement ofNo. of units inthe SegregatedFundsMaintained bythe insurer(LinkedBusiness)To capture the data of units of the segregatedfunds in unit linked business in the yearYearlyINPUT_ACTUARIAL_8Form KT-1 -Statement ofsolvency marginTo capture the data on solvency marginmaintained by insurer in the yearYearlyINPUT_ACTUARIAL_9Form KT-2 -Statement ofsolvency marginTo capture the data on solvency marginmaintained by insurer in the yearYearlyINPUT_ACTUARIAL_10Form KT - Q -Statement ofavailablesolvency marginand solvencyratioTo capture the data on solvency marginmaintained by insurer in the quarterQuarterlyINPUT_ACTUARIAL_10.1Form KT - 3 -Statement ofavailablesolvency marginand solvencyratioTo capture the data on solvency marginmaintained by insurer in the yearYearlyBusiness Analytics Project Page 157
InsurerProductLoBPremiumTypeDivisionGeographyGroupTimeAssociated Forms (Actuarial Department)Code Form Name Objective FrequencyINPUT_ACTUARIAL_11Form IATo captures the information on negativereservesYearlyINPUT_ACTUARIAL_12Form HTo capture the mathematical reserves atclassification and category level.YearlyINPUT_ACTUARIAL_13Valuation BasesTo capture the valuation parameters used in thevaluation of productsYearlyINPUT_ACTUARIAL_14Return onAssetsTo capture the details of return on assets forpolicyholders' fund and shareholders' fundYearlyINPUT_ACTUARIAL_15Details offoreignoperationTo capture the details of the foreign operationsof each insurerYearlyINPUT_ACTUARIAL_16Components ofglobal reservesTo capture the details of additional informationon global reservesYearlyForm DD - Form for New Business and TotalIn-Force Business DataX C X X X X X YActuarialForm DDD - Form for Business Movementduring the yearForm DDDD - Details of Lapsed andReinstated policiesForm NLB 1 - Details of in-force policies atX C X X X X X YX C X X X X X YX P X X X X X YBusiness Analytics Project Page 158
InsurerProductLoBPremiumTypeDivisionGeographyGroupTimeproduct level ( Non-Linked Policies)Form LB 1 - Details of in-force policies atproduct level (Linked Business)X C X X YForm LB 2 - Statement of Net Asset Value forthe Segregated Funds Maintained by theinsurer (Linked Business)X C X X X X X YForm LB 3 - Statement of No. of units in theSegregated Funds Maintained by the insurer(Linked Business)Form KT-1 - Statement of solvency marginForm KT-2 - Statement of solvency marginForm KT - Q - Statement of available solvencymargin and solvency ratioForm KT - 3 - Statement of available solvencymargin and solvency ratioForm IAForm HValuation BasesX P X X X X X YX C X X YX X YX X QX X YX C X X YX C X X X X YX P X YReturn on AssetsXYDetails of foreign operationX X YComponents of global reservesXYBusiness Analytics Project Page 159
Actuarial – Valuations DataInsurer1. Insurer ID2. Insurer Name3. Insurer Type4. Date of RegistrationDivision1. Division ID2. Division NameActuarial – Valuations FactTime1. Year ID2. Half Year ID3. Quarter ID4. Month ID5. DayPremium Type1. Premium Type ID2. Premium Type1. Insurer ID2. Quarter ID3. Business ID4. State ID5. Premium Type ID6. Division ID7.UIN8. Group IDProduct1. Product Category2. Category ID3. Target Group4. Product Name5. UIN6. Date of approval7. Average TermActuarial Valuation - MetricsGeographyGroupLine of Business1. LOB ID2 LOB Name3. LOB Type1. Classification2. Country ID3. Country Name4. State ID5 State Name6. City Name7.. Pin Code1. Group ID2. Group NameBusiness Analytics Project Page 160
Associated Forms (Actuarial Department)Code Form Name Objective FrequencyINPUT_ACTUARIAL_1Form DD - Formfor NewBusiness andTotal In-ForceBusiness DataTo capture the data on new business in the yearand total in-force business during the year.YearlyINPUT_ACTUARIAL_2Form DDD -Form forBusinessMovementduring the yearTo capture the business movement during theyearYearlyINPUT_ACTUARIAL_3Form DDDD -Details ofLapsed andReinstatedpoliciesTo capture the details of lapsed policies andreinstated policies during the yearYearlyINPUT_ACTUARIAL_4Form NLB 1 -Details of inforcepolicies atproduct level (Non-LinkedPolicies)To capture the details of in-force policies atproduct level in the yearYearlyINPUT_ACTUARIAL_5Form LB 1 -Details of inforcepolicies atproduct level(LinkedBusiness)To capture the details of in-force policies atproduct level in the yearYearlyINPUT_ACTUARIAL_6Form LB 2 -Statement ofNet Asset Valuefor theSegregatedTo capture the performance of the segregatedfunds in unit linked business in the yearYearlyBusiness Analytics Project Page 161
Associated Forms (Actuarial Department)Code Form Name Objective FrequencyFundsMaintained bythe insurer(LinkedBusiness)INPUT_ACTUARIAL_7Form LB 3 -Statement ofNo. of units inthe SegregatedFundsMaintained bythe insurer(LinkedBusiness)To capture the data of units of the segregatedfunds in unit linked business in the yearYearlyINPUT_ACTUARIAL_8Form KT-1 -Statement ofsolvency marginTo capture the data on solvency marginmaintained by insurer in the yearYearlyINPUT_ACTUARIAL_9Form KT-2 -Statement ofsolvency marginTo capture the data on solvency marginmaintained by insurer in the yearYearlyINPUT_ACTUARIAL_10Form KT - Q -Statement ofavailablesolvency marginand solvencyratioTo capture the data on solvency marginmaintained by insurer in the quarterQuarterlyINPUT_ACTUARIAL_10.1Form KT - 3 -Statement ofavailablesolvency marginand solvencyratioTo capture the data on solvency marginmaintained by insurer in the yearYearlyBusiness Analytics Project Page 162
InsurerProductLoBPremiumTypeDivisionGeographyGroupTimeAssociated Forms (Actuarial Department)Code Form Name Objective FrequencyINPUT_ACTUARIAL_11Form IATo captures the information on negativereservesYearlyINPUT_ACTUARIAL_12Form HTo capture the mathematical reserves atclassification and category level.YearlyINPUT_ACTUARIAL_13Valuation BasesTo capture the valuation parameters used in thevaluation of productsYearlyINPUT_ACTUARIAL_14Return onAssetsTo capture the details of return on assets forpolicyholders' fund and shareholders' fundYearlyINPUT_ACTUARIAL_15Details offoreignoperationTo capture the details of the foreign operationsof each insurerYearlyINPUT_ACTUARIAL_16Components ofglobal reservesTo capture the details of additional informationon global reservesYearlyForm DD - Form for New Business and TotalIn-Force Business DataX C X X X X X YActuarialForm DDD - Form for Business Movementduring the yearForm DDDD - Details of Lapsed andReinstated policiesForm NLB 1 - Details of in-force policies atX C X X X X X YX C X X X X X YX P X X X X X YBusiness Analytics Project Page 163
InsurerProductLoBPremiumTypeDivisionGeographyGroupTimeproduct level ( Non-Linked Policies)Form LB 1 - Details of in-force policies atproduct level (Linked Business)X C X X YForm LB 2 - Statement of Net Asset Value forthe Segregated Funds Maintained by theinsurer (Linked Business)X C X X X X X YForm LB 3 - Statement of No. of units in theSegregated Funds Maintained by the insurer(Linked Business)Form KT-1 - Statement of solvency marginForm KT-2 - Statement of solvency marginForm KT - Q - Statement of available solvencymargin and solvency ratioForm KT - 3 - Statement of available solvencymargin and solvency ratioForm IAForm HValuation BasesX P X X X X X YX C X X YX X YX X QX X YX C X X YX C X X X X YX P X YReturn on AssetsXYDetails of foreign operationX X YComponents of global reservesXYBusiness Analytics Project Page 164
Actuarial – Life Reinsurance DataInsurer1. Insurer ID2. Insurer Name3. Insurer Type4. Date of RegistrationProduct1. Product Category2. Category ID3. Target Group4. Product Name5. UIN6. Date of approval7. Average TermActuarial – ReinsuranceFact1. Insurer ID2. Quarter ID3. Business ID4. Classification6. UIN8. Treaty IDTime1. Year ID2. Half Year ID3. Quarter ID4. Month ID5. DayActuarial Reinsurance -MetricsRe Insurer1. Re Insurer ID2. Re Insurer Name3. Re Insurer Type4. Date of RegistrationGeography1. Classification2. Country ID3. Country Name4. State ID5 State Name6. City Name7.. Pin CodeTreaty Details1. Treaty ID2. Treaty Type3. Treaty Name3. Treaty Nature3. Treaty BasisBusiness Analytics Project Page 165
Associated Forms (Actuarial Department)Code Form Name Objective FrequencyINPUT_REINSURANCE_1Form LR-1: List ofreinsurancetreaties for theyearTo capture the information on the reinsurers,treaties and products covered in each treaty.YearlyINPUT_REINSURANCE_1.1Summary ofreinsurancetreaties during theyearTo capture the summary of the treaties doneby the insurers during the yearYearlyINPUT_REINSURANCE_2Form LR-2:Particulars ofSurplus Treaty Forthe YearTo capture the details of the surplus treatiesfiled by the insurerYearlyINPUT_REINSURANCE_1Form LR-3: Resultof Surplus TreatyTo capture the business data of thereinsurance for surplus treatyYearlyINPUT_REINSURANCE_4Form LR-4:Particulars ofQuota ShareTreaty For theYearTo capture the details of the quota sharetreaties filed by the insurerYearlyINPUT_REINSURANCE_5Form LR-5: Resultof Quota Sharesurplus Treaty forTo collect the business data of thereinsurance for quota share surplus treatyYearlyINPUT_REINSURANCE_6Form LR-6:Particulars ofExcess of Losscover/CatastropheTreaty For theYearTo capture the details of the excess ofloss/catastrophe treaties filed by the insurerYearlyINPUT_REINSURANCE_7Form LR-7: Resultof Excess ofLoss/catastropheTreatyTo capture the business data of thereinsurance for Excess of Loss/catastropheTreatyYearlyBusiness Analytics Project Page 166
InsurerProductReinsurerTreatyGeographyTimeAssociated Forms (Actuarial Department)Code Form Name Objective FrequencyINPUT_REINSURANCE_8Form LR-8:ReinsuranceAccounts for thequarterTo capture the business data of thereinsurance for all treatiesQuarterlyForm LR-1: List of reinsurance treaties for theyearSummary of reinsurance treaties during theyearForm LR-2: Particulars of Surplus Treaty Forthe YearX P X X X YX C X YX P X X X YForm LR-3: Result of Surplus Treaty X C X X X YActuarialForm LR-4: Particulars of Quota Share TreatyFor the YearForm LR-5: Result of Quota Share surplusTreaty forForm LR-6: Particulars of Excess of Losscover/Catastrophe Treaty For the YearForm LR-7: Result of Excess ofLoss/catastrophe TreatyForm LR-8: Reinsurance Accounts for thequarterX P X X X YX C X X X YX P X X X YX C X X X YX C X QBusiness Analytics Project Page 167
6. Intermediaries – Brokers DepartmentBrokers-Financial Business Analysis DataBroker1. Broker ID2. Broker Name3. Broker Category4. Broker Type5. License No.6. Sub ClassInsurer1. Insurer ID2. Insurer Name3. Insurer Type4. Date of RegistrationBroker Business DataBroker FinancialFactAnalysisFact1. Broker ID2. Quarter ID3. Client ID1. 4. Broker Insurer ID2. 5. Quarter UINID3. 6. Shareholder LOB IDID4. 7. Account Premium No. Type IDBroker Financial Business Analysis DataMetricsFactsTime1. Year ID2. Half Year IDs3. Quarter ID4. Month ID5. DayClient Details1. Client ID2. Client NameBank DetailsProduct1. Product Category2. Category ID3. Target Group4. Product Name5. UIN6. Date of approval7. Average TermLine of Business1. LOB ID2 LOB Name3. LOB TypePremium Type1. Premium Type ID2. Premium TypeBusiness Analytics Project Page 168
BrokerInsurerTimeClientPremiumTypeProductCategoryLoBAssociated Forms (Brokers Department)Code Form Name Objective FrequencyINPUT_BROKER_10 Business Data for brokers To capture the new business data for abroker insurer wise and client wiseYearlyINPUT_BROKER_10.1Business Data for brokers(Life Insurers)To capture the new business data forbrokers for life insurersQuarterlyINPUT_BROKER_10.2Business Data for brokers(Non Life Insurers)To capture the new business data forbrokers for non life insurersQuarterlyDimensionsDept.Form NameBusiness Data for brokers X X Y XBrokersBusiness Data for brokers (Life Insurers) X Q X P XBusiness Data for brokers (Non Life Insurers) X Q XC: Category Level; P: Product levelM: Monthly; Q: Quarterly; Y: YearlyBusiness Analytics Project Page 169
Broker – Claims DataBroker1. Broker ID2. Broker Name3. Broker Category4. Broker Type5. License No.Time1. Year ID2. Half Year ID3. Quarter ID4. Month ID5. DayClaims Fact1. Broker ID2. Quarter ID3. Claim IDClaims MetricsClaim Details1. Claim ID2. Claim Type3. Claimant NameBusiness Analytics Project Page 170
BrokerClaimDetailsTimeAssociated Forms (Brokers Department- Claims Data)Code Form Name Objective FrequencyINPUT_BROKER_12 Claims Data To capture the details of the claims for abrokerQuarterlyDimensionsDept.Form NameBrokers Claims Data X X QBusiness Analytics Project Page 171
Brokers – Office DataBroker1. Broker ID2. Broker Name3. Broker Category4. Broker Type5. License No.Time1. Year ID2. Half Year ID3. Quarter ID4. Month ID5. DayOffice Data Fact1. Broker ID2. Year ID3. Office ID4. State IDOffice DetailsGeography1. Classification2. Country ID3. Country Name4. State ID5 State Name6. City Name7. Pin CodeOffice Data Metrics1. Office Type2. Office ID3. Office Name4. Office AddressBusiness Analytics Project Page 172
BrokerGeographyOfficeTimeAssociated Forms (Brokers Department)Code Form Name Objective FrequencyINPUT_BROKER_2Particular of branch andregistered officesTo capture the details of a branchoffice for a brokerYearlyDimensionsDept.Form NameBrokers Particular of branch and registered offices X X X YBusiness Analytics Project Page 173
Brokers-Financial AnalysisBroker1. Broker ID2. Broker Name3. Broker Category4. Broker Type5. License No.Broker Financial AnalysisFactTime1. Year ID2. Half Year IDs3. Quarter ID4. Month ID5. Day1. Broker ID2. Quarter ID3. Shareholder/Promoter/Associate ID4. Account No.Share Holder/Promoter/Associate1. Shareholder/Promoter/Associate ID2. Shareholder/Promoter/Associate Name3. Shareholder/Promoter/Associate Address4. Shareholder/Promoter/Associate ProfessionBroker Financial AnalysisMetricsBank Details1. Bank ID2. Bank Name3. Bank Address4. Account No.5. Account Type6. Account Balance7. F.D.No.Business Analytics Project Page 174
Associated Forms (Brokers Department)Code Form Name Objective FrequencyINPUT_BROKER_1Capital Structure andshareholders details for abrokerTo capture the details of the capitalstructure of a brokerQuarterlyINPUT_BROKER_3Financial Statement foreach broker - Profit andLoss StatementTo capture the profit and lossstatement details for a brokerYearlyINPUT_BROKER_4 Balance Sheet of Brokers To capture balance sheet details for abrokerINPUT_BROKER_5 Financial data for brokers To capture the financial data for abrokerYearlyHalf YearlyINPUT_BROKER_11Insurance Bank Accountsof brokersTo capture the details of the insurancebank accountsYearlyINPUT_BROKER_15 Fixed Deposit Details To capture the fixed deposit details fora brokerINPUT_BROKER_19 Annual Fees Data To capture the details of annual feespaid with details such as demand Draftdetails, date of payment and paymentstatus.YearlyYearlyBusiness Analytics Project Page 175
BrokerTimeShareholderBankDetailsDimensionsDept.Form NameCapital Structure and shareholders details fora brokerX Q XFinancial Statement for each broker - Profitand Loss StatementXYBrokersBalance Sheet of Brokers X YFinancial data for brokers X HYInsurance Bank Accounts of brokers X Y XFixed Deposit Details X Y XAnnual Fees Data X Y XBusiness Analytics Project Page 176
Brokers-Organization Structure DataBroker1. Broker ID2. Broker Name3. Broker Category4. Broker Type5. License No.6. Name of Director/Person(s)7. Profession8. AddressBroker Org Struct Fact1. Broker ID2. Year IDTime1. Year ID2. Half Year IDs3. Quarter ID4. Month ID5. DayBroker Org Struct MetricsBusiness Analytics Project Page 177
BrokerTimeAssociated Forms (Brokers Department)Code Form Name Objective FrequencyINPUT_BROKER_6Board of Directors andmanagement detailsTo capture the details of the personsin the board of directors andmanagement detailsYearlyINPUT_BROKER_8Particulars of personsresponsible for soliciting orprocuring or brokinginsurance or reinsurancebusinessTo capture the particulars of personsresponsible for soliciting orprocuring or broking insurance orreinsurance businessYearlyINPUT_BROKER_9Standing arrangements withother brokers or serviceprovidersTo capture the details of thestanding arrangements with otherbrokers or service providersYearlyINPUT_BROKER_16Details of Group companiesfor a brokerTo capture the standingarrangements list of all groupcompanies attached with a particularbrokerYearlyDimensionsDept.Form NameBoard of Directors and management details X YBrokersParticulars of persons responsible for solicitingor procuring or broking insurance orreinsurance businessXYStanding arrangements with other brokers orservice providersXYDetails of Group companies for a broker X YBusiness Analytics Project Page 178
Brokers-Financial Inspection AnalysisBroker1. Broker ID2. Broker Name3. Broker Category4. Broker Type5. License No.6. Sub ClassBroker Financial Inspection Analysis DataFactTime1. Year ID2. Half Year IDs3. Quarter ID4. Month ID5. Day1. Broker ID2. Quarter Month IDID3. Shareholder Inspection IDID4. Account No.Broker Financial Inspection Analysis DataMetricsFactsInspection Bank Details1. Bank ID2. 1. Bank Inspection NameID3. 2. Bank Inspection Address Status4. 3. Account Inspection No. Date5. 4. Account Violation Type Desc.6. 5. Account <strong>Report</strong> SubmissionBalance7. DateF.D.No.Business Analytics Project Page 179
BrokerTimeInspectionDetailsAssociated Forms (Brokers Department)Code Form Name Objective FrequencyINPUT_BROKER_17 Inspection Data To capture the details of theinspection activities carried outagainst brokersMonthlyDimensionsDept.Form NameBrokers Inspection Data X M XBusiness Analytics Project Page 180
Brokers-Financial Legal AnalysisBroker1. Broker ID2. 1. Broker Name ID3. 2. Broker Category Name4. 3. Broker Type Category5. 4. License Broker TypeNo.6. 5. Sub License Class No.Broker Financial AnalysisBroker Legal Data FactFactTime1. Year ID2. Half Year IDs3. Quarter ID4. Month ID5. Day1. Broker ID2. Quarter ID3. Shareholder Case IDID4. Account No.Broker Broker Financial Legal Analysis DataMetricsFactsCase Bank Details1. Bank ID2. Bank Name3. 1. Bank Case Address ID4. 2. Account Case StatusNo.5. 3. Account Case DateType6. Account Balance7. F.D.No.Business Analytics Project Page 181
BrokerTimeCase DetailsAssociated Forms (Brokers Department)Code Form Name Objective FrequencyINPUT_BROKER_20 Legal Data To capture the details of the no. oflawsuits against each brokerQuarterlyDimensionsDept.Form NameBrokers Legal Data X Q XBusiness Analytics Project Page 182
Brokers – OthersBroker1. Broker ID/License No.2. Broker Name3. Broker Category4. Broker Type5. License Issue DateOthers1. Broker ID/License No.2. Year ID3. Auditor ID4. Reinsurance Type ID5. Security Screening IDTime1. Year ID2. Half Year ID3. Quarter ID4. Month ID5. DayOther MetricsReinsurance TypeDetails1. Reinsurance TypeID2. Reinsurance TypeSecurity ScreeningDetails1. SecurityScreening ID2. SecurityScreening TypeAuditor1. Auditor ID2. Auditor Name3. Auditor Type4. Auditor Address5. Auditor QualificationBusiness Analytics Project Page 183
BrokerTimeReinsuranceDetailsAuditorSecurityScreeningDetailsAssociated Forms (Brokers Department)Code Form Name Objective FrequencyINPUT_BROKER_7Audit arrangements for abrokerTo capture the details of the auditarrangement for a broker.YearlyINPUT_BROKER_13Reinsurance balancesoutstanding as at---To capture the details of thereinsurance balances outstandingfor a brokerYearlyINPUT_BROKER_14Security screeningproceedings for reinsurancebrokingTo capture the details of thesecurity screening proceedings forreinsurance bankingYearlyINPUT_BROKER_21APPLICATION FOR GRANT OFLICENCE/RENEWAL OFLICENCEEach brokers who is willing toregister with <strong>IRDA</strong> for brokingbusiness, is liable to fill up this formAs and whenINPUT_BROKER_22GRANT OF LICENSE TO THEBROKERSThis form is used for grantinglicense to a brokerAs and whenINPUT_BROKER_23APPLICATION FOR DUPLICATELICENCEThis form is used for application fora duplicate license by the brokersAs and whenDimensionsDept.Form NameAudit arrangements for a broker X Y XReinsurance balances outstanding as at--- X Y XSecurity screening proceedings for reinsurance broking X Y XBrokersAPPLICATION FOR GRANT OF LICENCE/RENEWAL OFLICENCEXXGRANT OF LICENSE TO THE BROKERS X XAPPLICATION FOR DUPLICATE LICENCE X XBusiness Analytics Project Page 184
7. Intermediaries – Corporate Agents DepartmentCorporate Brokers-Financial Agents- Business Analysis DataCA1. CA ID2. CA Name3. CA Category4. License No.5. Primary Profession 1/2/3Insurer1. Insurer ID2. Insurer Name3. Insurer Type4. Date of RegistrationBroker Financial AnalysisCA Business Data FactFact1. CA ID2. Quarter ID1. 3. Broker Client ID2. 4. Quarter Insurer ID3. 5. Shareholder LOB IDID4. 6. Account Premium No. Type ID7. UINBroker CA Financial Business DataAnalysisMetricsFactsTime1. Year ID2. Half Year IDs3. Quarter ID4. Month ID5. DayClient Details1. Client ID2. Client Name3. Client TypeBank DetailsProduct1. Product Category2. Category ID3. Target Group4. Product Name5. UIN6. Date of approval7. Average TermLine of Business1. LOB ID2 LOB Name3. LOB TypePremium Type1. Premium Type ID2. Premium TypeBusiness Analytics Project Page 185
CAInsurerTimeClientPremiumTypeProductCategoryLoBAssociated Forms (CA Department)Code Form Name Objective FrequencyINPUT_CA_14New Business Data forcorporate agentsTo capture the new business data for acorporate agents insurer wiseYearlyINPUT_CA_14.1New Business Data forcorporate agents(Insurerwise)To capture the new business data for acorporate agent’s insurer wise.QuarterlyDimensionsDept.Form NameNew Business Data for corporate agents X X Y XCANew Business Data for corporateagents(Insurer wise)XQX P XC: Category Level; P: Product levelM: Monthly; Q: Quarterly; Y: YearlyBusiness Analytics Project Page 186
Corporate Agents– Claims DataCA1. CA ID2. CA Name3. CA Category4. License No.5. Primary Profession 1/2/3Claims FactTime1. Year ID2. Half Year ID3. Quarter ID4. Month ID5. Day1. CA ID2. Quarter ID3. Claim IDClaims MetricsClaim Details1. Claim ID2. Claim Type3. Claimant NameBusiness Analytics Project Page 187
CAClaimDetailsTimeAssociated Forms (CA Department)Code Form Name Objective FrequencyINPUT_CA_13 Claims Data To capture the details of the claims for acorporate agentsQuarterlyDimensionsDept.Form NameCA Claims Data X X QBusiness Analytics Project Page 188
Corporate Agents – Office DataCA1. CA ID2. CA Name3. CA Category4. License No.5. Primary Profession 1/2/3Time1. Year ID2. Half Year ID3. Quarter ID4. Month ID5. DayOffice Data Fact1. CA ID2. Quarter ID3. Office ID4. State IDOffice DetailsGeography1. Classification2. Country ID3. Country Name4. State ID5 State Name6. City Name7. Pin CodeOffice Data Metrics1. Office Type2. Office ID3. Office Name4. Office AddressBusiness Analytics Project Page 189
CAGeographyOfficeTimeAssociated Forms (CA Department)Code Form Name Objective FrequencyInput_CA_12.0Particular of offices ofcorporate agentsTo capture the details of an office fora corporate agentYearlyDimensionsDept.Form NameCA Particular of offices of corporate agents X X X YBusiness Analytics Project Page 190
Corporate Agents -Financial AnalysisCA1. CA ID2. CA Name3. CA Category4. License No.5. Primary Profession 1/2/3CA Financial AnalysisFact1. CA ID2. Quarter ID3. Shareholder/Promotre/Associate IDTime1. Year ID2. Half Year IDs3. Quarter ID4. Month ID5. DayShare Holder/Promoter/AssociateCA Financial AnalysisMetrics1. Shareholder/Promoter/Associate ID2. Shareholder/Promoter/Associate Name3. Shareholder/Promoter/Associate Address4. Shareholder/Promoter/Associate ProfessionBusiness Analytics Project Page 191
CATimeShareholder/PromoterAssociated Forms (CA Department)Code Form Name Objective FrequencyInput_CA_10.0 Income Statement To capture financial data for inflow andoutflow with respect to a corporateagentInput_CA_10.1 Balance Sheet To capture balance sheet data for acorporate agentYearlyYearlyInput_CA_11.0Capital structure andShareholder's Details of acorporate agentsTo capture the details of the capitalstructure and shareholders for acorporate agentQuarterlyInput_CA_11.1 Income Data To capture the income data for thecorporate agentsYearlyDimensionsDept.Form Nameto capture the income data for the corporateagentsXYCAto capture the income data for the corporateagentsto capture the income data for the corporateagentsXYX Q Xto capture the income data for the corporateagentsXYBusiness Analytics Project Page 192
Corporate Agents-Organization Structure DataCA1. CA ID2. CA Name3. CA Category4. License No.5. Primary Profession 1/2/36. Name of Director/Person(s)7. Profession8. AddressCA Org Struct Fact1. CA ID2. Quarter IDTime1. Year ID2. Half Year IDs3. Quarter ID4. Month ID5. DayCA Org Struct MetricsBusiness Analytics Project Page 193
CATimeAssociated Forms (CA Department)Code Form Name Objective FrequencyInput_CA_7.0Board of Director and managementdetailsTo capture the details of the boardof directors / partners for acorporate agent and managementdetailsYearlyInput_CA_8.0Particulars of specified personsresponsible for soliciting orprocuring or insurance orreinsurance businessTo the particulars of specifiedpersons responsible for soliciting orprocuring or insurance orreinsurance businessYearlyInput_CA_9.0Group Companies for a corporateagentTo capture list of all groupcompanies attached with acorporate agentYearlyDimensionsDept.Form NameBoard of Director and management details X YCAParticulars of specified persons responsible forsoliciting or procuring or insurance orreinsurance businessXYGroup Companies for a corporate agent X YBusiness Analytics Project Page 194
Corporate Brokers-Financial Agents- Licensing Analysis Data CaptureCA1. CA ID2. CA Name3. CA Category4. License No.5. Primary Profession 1/2/3Broker CA Licensing Financial Analysis DataCapture Fact Fact1. Broker CA IDID2. Quarter DayID3. Shareholder ID4. Account No.Time1. Year ID2. Half Year IDs3. Quarter ID4. Month ID5. DayBroker CA Licensing Financial Analysis DataCapture Facts MetricsBusiness Analytics Project Page 195
Associated Forms (CA Department)Code Form Name Objective FrequencyINPUT_CA_1Application for a newlicense to act as aCorporate AgentThis form is used for application for anew corporate agent license.As and whenrequiredINPUT_CA_2Application for a License/Renewal of License to actas a Corporate AgentThis form is used for application for alicense/renewal of license to act as acorporate agentAs and whenrequiredINPUT_CA_3License to Act as aspecified person underthe Insurance Act, 1938(IV OF 1938)This form is used for application from afirm or company for a certificate/renewalof certificate to act as a specified personAs and whenrequiredINPUT_CA_4License to Act as aCorporate Agent underthe Insurance Act, 1938(IV OF 1938)This form is used for issuing license to actas a corporate agentAs and whenrequiredINPUT_CA_5Data Capture forCorporate AgentsTo capture the details like name, address,contact no., photograph, date ofcommencement of employment, date ofleaving the service, if any, and salaryspecified for a corporate agent.As and whenrequiredINPUT_CA_6Application for DuplicateLicenseThe form will be used for application of aduplicate license in case the originallicense gets destroyed or lost ormutilatedAs and whenrequiredBusiness Analytics Project Page 196
CATimeDimensionsDept.Form NameApplication for a new license to act as aCorporate AgentXDApplication for a License/ Renewal of Licenseto act as a Corporate AgentXDCALicense to Act as a specified person under theInsurance Act, 1938 (IV OF 1938)XDLicense to Act as a Corporate Agent under theInsurance Act, 1938 (IV OF 1938)XDData Capture for Corporate Agents X DApplication for Duplicate License X DBusiness Analytics Project Page 197
Corporate Agents – Legal DataCA1. CA ID2. CA Name3. CA Category4. License No.5. Primary Profession 1/2/3Others1. CA ID/License No.2. Quarter ID3. Case IDTime1. Year ID2. Half Year ID3. Quarter ID4. Month ID5. DayOther MetricsCase Details1. Case ID2. Case Status3. Case Date4. Case Location5. Case SourceBusiness Analytics Project Page 198
BrokerTimeClaimDetailsAssociated Forms (CA Department)Code Form Name Objective FrequencyInput_CA_16.0Legal Data for CorporateAgentsTo capture the details of the no. oflawsuits against each corporateagentQuarterlyDimensionsDept.Form NameCA Legal Data for Corporate Agents X Q XBusiness Analytics Project Page 199
8. Intermediaries – SurveyorsSurveyors DataInsurer1. Insurer ID2. Insurer Name3. Insurer Type4. Date of RegistrationSurveyor1. License No.2. Surveyor Name3. Surveyor Category4.Qualification5. Age6. Date of Registration7. Name of Persons/DirectorsTime1. Year ID2. Half Year ID3. Quarter ID4. Month ID5. DayProduct1. Product Category2. Category ID3. Target Group4. Product Name5. UIN6. Date of approval7. Average Term1. Insurer ID2. Day ID3. License No.4. Business ID5. City ID6. Claim ID7. UINSurveyor FactSurveyor MetricsGeographyLine of Business1. LOB ID2 LOB Name3. LOB TypeClaim Details1. Claim ID2. Claim Type3. Claim Description4. Claimant Name1. Classification2. Country ID3. Country Name4. State ID5 State Name6. City Name7.. Pin CodeBusiness Analytics Project Page 200
Associated Forms (Surveyor Department)Code Form Name Objective FrequencyForm 1-AFAPPLICATION FORA LICENCE TO ACTAS SURVEYORAND LOSSASSESSORTo capture details of an applicant in theapplication processAs and WhenFORM - <strong>IRDA</strong> – 3A– AFDetails of partners/ directors for asurveying firmTo capture the details of partners / directorsfor a surveying firmYearlyForm - <strong>IRDA</strong>- 2-AFAPPLICATIONFROM A FIRM ORCOMPANY FOR ALICENCE TO ACTAS A SURVEYORAND LOSSASSESSORTo capture details of an applicant in theapplication process from a firm or acompanyAs and WhenForm - <strong>IRDA</strong>- 5-AFAPPLICATION FORRENEWAL OF ALICENCE TO ACTAS SURVEYORAND LOSSASSESSORTo capture the details of the surveyor forrenewal of licenseAs and WhenForm - 6A-AFAPPLICATIONFROM A FIRM ORCOMPANY FORRENEWAL OF ALICENCE TO ACTAS A SURVEYORAND LOSSASSESSORTo capture the details of the surveyor forrenewal of license( In case of firm or acompany)As and WhenForm 3-AFAPPLICATIONFROM A FIRM ORCOMPANY FOR ATo capture the details of fresh applicationfor a firm or a companyAs and WhenBusiness Analytics Project Page 201
Associated Forms (Surveyor Department)Code Form Name Objective FrequencyLICENCE TO ACTAS A SURVEYORAND LOSSASSESSORFORM - <strong>IRDA</strong> – 9Application forDuplicate LicenseTo capture application details for duplicatelicenseAs and WhenFORM - <strong>IRDA</strong> – 13Data captureformat forcapturing 3 yearsof dataTo capture state wise information for eachsurveyor for claims and inspections dataYearlyForm IIIPRESCRIBEDFORMAT FORENROLLMENT OFTRAINEESURVEYORS &LOSS ASSESSORSFOR TRAININGTo capture the enrollment details for atrainee surveyorAs and WhenForm IVFORMAT FORDAILY DIARYTo capture the quarterly data for a traineesurveyor having details of the trainingactivitiesQuarterlyBusiness Analytics Project Page 202
InsurerProductLoBSurveyorClaimGeography DetailsTime TypeAPPLICATION FOR A LICENCE TO ACT ASSURVEYOR AND LOSS ASSESSORDetails of partners / directors for a surveyingfirmAPPLICATION FROM A FIRM OR COMPANYFOR A LICENCE TO ACT AS A SURVEYOR ANDLOSS ASSESSORAPPLICATION FOR RENEWAL OF A LICENCETO ACT AS SURVEYOR AND LOSS ASSESSORX X X DX X X YX X X DX X DSurveyorAPPLICATION FROM A FIRM OR COMPANYFOR RENEWAL OF A LICENCE TO ACT AS ASURVEYOR AND LOSS ASSESSORXDAPPLICATION FROM A FIRM OR COMPANYFOR A LICENCE TO ACT AS A SURVEYOR ANDLOSS ASSESSORX X X DApplication for Duplicate LicenseXDData capture format for capturing 3 years ofdataPRESCRIBED FORMAT FOR ENROLLMENT OFTRAINEE SURVEYORS & LOSS ASSESSORS FORTRAININGFORMAT FOR DAILY DIARYX P X X X X YX X X DX X X QBusiness Analytics Project Page 203
B. Indicative List of Dimensions with their values and attributesDimensions UsedImportantAttributesAttribute DefinitionTime Year ID Calendar or Financial YearHalf YearQuarter IDMonth IDDayHalf Year within a YearQuarter of a yearMonth of a yearDays and Dates within a yearInsurer Insurer ID Unique Identification Number of an InsurerInsurer NameInsurer TypeDate ofRegistrationName of an InsurerCategory or Type in which the Insurer belongs. Forexample, private insurer, public sector insurerDate of Registration for an InsurerReinsurer Reinsurer ID Unique Identification Number of a ReinsurerReinsurer NameReinsurer TypeDate ofRegistrationName of a ReinsurerCategory or Type in which the Reinsurer belongs. Forexample, private insurer, public sector insurerDate of Registration for a ReinsurerGeography Country ID Unique identifier for a countryCountry NameClassificationState IDState NameName of the countryWithin India or Outside India BusinessUnique Identification Number of department for a statewithin the countryName of the StateBusiness Analytics Project Page 204
Dimensions UsedProductImportantAttributesCity NamePin CodeProduct CategoryIDProduct CategoryNameTarget Group ofthe ProductProduct UINProduct NameDate of ApprovalAverage TermAttribute DefinitionName of the cityUnique code for a cityUnique ID for the product categoryName of the product categoryTarget group which the products belongs toUnique identification number assigned with each productapproved by <strong>IRDA</strong>Name of the productDate of approval of the product by <strong>IRDA</strong>Average of the term of the productLine of Business Business ID Unique Identification Number of department or a line ofbusinessBusiness NameBusiness TypeName of the line of BusinessCategory or Type in which the business belongs. Forexample, rural or urban etc.Premium Type Premium Type ID Unique ID for each of the premium typePremium TypeType of the premiumDivision Division ID Unique Identifier for a divisionDivision NameLabel of a particular divisionChannel Type Channel ID Unique ID for identifying each of the different channeltypeChannel NameThe name of the channel used for acquiring businessClaim Details Claim ID Unique Identifier for a claimBusiness Analytics Project Page 205
Dimensions UsedImportantAttributesClaim TypeClaimant NameClaim DescriptionAttribute DefinitionName of the claimThe name of the claimantDescription of the claimLocation Type Location ID Unique identifier for a location typeLocation NameName of a location typeGroup Group ID Unique Identifier for a groupGroup NameName of the groupOffice Details Office ID Unique ID for identifying each of the different channeltypeOffice TypeOffice NameOffice AddressThe name of the channel used for acquiring businessUnique ID generated for each policy slabComplete postal address of the officeLocation Location ID Unique identifier for the locationLocation NameName and type of the locationPolicy Slab Slab ID Unique ID generated for each policy slabSlab NameDetailed description for each policy slabAdvertisement DetailsURNDate of LaunchDate of launch of the advertisementAd TypeCo InsurerMediumCase Details Case ID Unique Identification Number of a caseCase SourceSource of the caseBusiness Analytics Project Page 206
Dimensions UsedImportantAttributesCase LocationCase StatusCase DateAttribute DefinitionLocation where the case took placeCurrent Status of the caseDate of registration of the caseCA CA ID Unique Identification Number of a corporate agentCA NameCA CategoryLicense No.PrimaryProfession 1/2/3Name of a corporate agentCategory in which the corporate agent belongs.License number of the corporate agentPrimary Profession of the corporate agentAuditor Auditor ID Unique Identification Number of an auditorReinsurance DetailsSecurity ScreeningAuditor NameAuditor TypeAuditor AddressAuditorQualificationReinsuranceDetails IDReinsuranceDetails NameSecurity ScreeningIDSecurity ScreeningNameAverage TermName of a auditorType of auditorAddress of auditorProfession of auditorUnique Identification Number of Reinsurance DetailsName of the Reinsurance DetailsUnique Identification Number of a Security ScreeningName of a Security Screening typeAverage of the term of the productBroker Broker ID Unique Identification Number of an BrokerBusiness Analytics Project Page 207
Dimensions UsedImportantAttributesBroker NameBroker CategoryLicense No.Broker TypeAttribute DefinitionName of an BrokerCategory in which the Broker belongs. For example,private broker, public sector brokerLicense number of the brokerType in which the Broker belongsClient Details Client ID Unique ID for each of the clientClient TypeClient nameType of the clientName of the clientTPA TPA ID Unique Identification Number of a TPATPA NameDate ofRegistrationName of a TPADate of Registration for a TPACover Type Cover Type ID Unique ID for identifying each of the different cover typeCover Type NameThe name of the cover type used for acquiring businessShareholder Shareholder ID Unique Identification Number of ShareholderShareholderNameShareholderAddressShareholderCategoryShareholderProfessionName of the ShareholderPostal Address of the ShareholderCategory of the ShareholderProfession of the ShareholderBank Details Bank ID Unique Identification Number of bankBank NameName of the bankBusiness Analytics Project Page 208
Dimensions UsedShareholder/Promoter/AssociateImportantAttributesBank AddressAccount No.Account TypeAccount BalanceF.D. No.Shareholder IDShareholderNameShareholderAddressShareholderProfessionAttribute DefinitionPostal Address of the bankUnique Identification Number of accountCategory of the accountCurrent account balanceUnique Identification Number of F.D.Unique Identification Number ofShareholder/Promoter/AssociateName of the Shareholder/Promoter/AssociatePostal Address of the Shareholder/Promoter/AssociateProfession of the Shareholder/Promoter/AssociateInspection Details Inspection ID Unique Identification Number of inspection being carriedoutInspection StatusInspection DateViolation Desc<strong>Report</strong>Submission DateCurrent status of the inspection activityDate of carrying out the inspection activityDetailed description of the violation occurredDate of submission of the reportTreaty Details Treaty ID Unique Identification Number of the treatyTreaty TypeTreaty NameNature of TreatyBasis of TreatyType of the treatyName of the treatyNature of the treatyBasis of the treatyBusiness Analytics Project Page 209
Dimensions UsedImportantAttributesAttribute DefinitionSubClass Details SubClass ID Unique Identification Number of the subclassSubClass NameName of the subclassSurveyor License Number Unique Identification Number of a SurveyorSurveyor NameSurveyor categoryDate ofRegistrationAgeQualificationName of a SurveyorCategory or Type in which the Surveyor belongs.Date of Registration for a SurveyorAge of a SurveyorQualification of a SurveyorName ofPersons/DirectorsActuary Actuary ID Unique Identification Number of an ActuaryActuary NameName of a ActuaryRating Agency Rating Agency ID Unique Identification Number of a rating agencyRating AgencyNameName of a rating agencyBusiness Analytics Project Page 210
C. Data Sizing Estimate for the <strong>IRDA</strong> BAP <strong>Solution</strong>Generic Assumptions:Average Row Size = 0.5 KB (Assuming a maximum of 15 columns in a table)Data type for each field: VarChar(25) No. of years of history data: 8 Growth of data per year till date = 8% No. of years of future data: 5 No. of Product Categories: 2 No. of divisions: 2 No. of groups: 2 No. of states: 30 No. of premium types: 4 No. of channels: 8Business Analytics Project Page 211
a) Life DepartmentKey AssumptionsNo. of Insurers=30No. of Products per Insurer=50No of Repudiated Claims per Insurer per Quarter=20 No. of lines of business: 4SubjectAreaMaster DataCombinations(Possible)Approximate No.ofDataPointInputsTotalRowSize(GB)%MonthlydataMonthlyData(GB)% ofQuarterlydataQuarterlyData(GB)% ofYearlydataYearlyData(GB)TotalData(GB)NBRNBClaimsDataAgencyStatsOfficeDataAdvertisementDataOthers2880000.00 8.00 10.99 0.00 0.00 0.78 34.28 0.22 2.42 36.6948000.00 8.00 0.18 0.00 0.00 1.00 0.73 0.00 0.00 0.731152000.00 20.00 10.99 0.00 0.00 1.00 43.95 0.00 0.00 43.9536000.00 10.00 0.17 0.00 0.00 1.00 0.69 0.00 0.00 0.69300000.00 10.00 1.43 1.00 17.17 0.00 0.00 0.00 0.00 17.177200.00 4.00 0.01 1.00 0.16 0.00 0.00 0.00 0.00 0.163840.00 20.00 0.04 0.00 0.00 1.00 0.15 0.00 0.00 0.15Department Total = 99.54 GBBusiness Analytics Project Page 212
) Non Life General DepartmentKey AssumptionsNo. of Insurers=30No. of Products per Insurer=50No of Repudiated Claims per Insurer per Quarter=20 No. of lines of business = 10Subject AreaNB DataProductPerformanceDataClaims DataNon Life MIOffice DataMasterDataCombinations(Possible)ApproximateNo. of DataPoint InputsTotalRowSize(GB)%MonthlydataMonthlyData(GB)% ofQuarterlydataQuarterlyData(GB)% ofYearlydataYearlyData(GB)TotalData(GB)288000.00 8.00 1.10 0.00 0.00 1.00 4.39 0.00 0.00 4.3960000.00 40.00 1.14 0.00 0.00 0.00 0.00 1.00 1.14 1.1448000.00 20.00 0.46 0.00 0.00 1.00 1.83 0.00 0.00 1.836000.00 10.00 0.03 0.00 0.00 1.00 0.11 0.00 0.00 0.1136000.00 10.00 0.17 0.00 0.00 1.00 0.69 0.00 0.00 0.69Department Total = 8.17 GBBusiness Analytics Project Page 213
c) Non Life Reinsurance DepartmentKey AssumptionsNo. of Insurers=30No. of Reinsurers=15No. of Treaties per Quarter=50No. of Products per Quarter=50 No. of lines of business = 10SubjectAreaTreatyWiseDataProgramDetailsBusiness DataRecoveries DataClaimsDataOthersMasterDataCombinations(Possible)Approximate No. ofDataPointInputsTotalRowSize(GB)%MonthlydataMonthlyData(GB)% ofQuarterlydataQuarterlyData(GB)% ofYearlydataYearlyData(GB)TotalData(GB)11250000.00 10.00 53.64 0.00 0.00 0.00 0.00 1.00 53.64 53.642250000.00 5.00 5.36 0.00 0.00 0.00 0.00 1.00 5.36 5.3615000.00 6.00 0.04 0.00 0.00 0.00 0.00 1.00 0.04 0.04225000.00 10.00 1.07 0.00 0.00 0.50 2.15 0.50 0.54 2.689000.00 10.00 0.04 0.00 0.00 1.00 0.17 0.00 0.00 0.174500.00 10.00 0.02 0.00 0.00 1.00 0.09 0.00 0.00 0.09Department Total = 61.99 GBBusiness Analytics Project Page 214
d) Health DepartmentKey AssumptionsNo. of TPAs=30No. of Insurers=30No. of Products per Quarter=50 No. of lines of business = 10SubjectAreaBusinessDataProductPerformance DataClaimsDataTPA DataTPAFinancialDataMasterDataCombinations(Possible)Approximate No. ofDataPointInputsTotalRowSize(GB)%MonthlydataMonthlyData(GB)% ofQuarterlydataQuarterlyData(GB)% ofYearlydataYearlyData(GB)TotalData(GB)72000.00 6.00 0.21 0.00 0.00 1.00 0.82 0.00 0.00 0.821152000.00 10.00 5.49 0.00 0.00 0.00 0.00 1.00 5.49 5.499000.00 10.00 0.04 0.60 0.31 0.00 0.00 0.40 0.02 0.334500.00 10.00 0.02 0.33 0.08 0.00 0.00 0.67 0.01 0.1027000.00 50.00 0.64 0.00 0.00 0.25 0.64 0.75 0.48 1.13Department Total = 7.87 GBBusiness Analytics Project Page 215
e) Actuarial DepartmentKey AssumptionsNo. of Insurers=30No. of reinsurers=15No. of Products per Insurer=50 No. of lines of business = 10SubjectAreaIBNRValuationsReinsuranceMasterDataCombinations(Possible)Approximate No. ofDataPointInputsTotalRowSize(GB)%MonthlydataMonthlyData(GB)% ofQuarterlydataQuarterlyData(GB)% ofYearlydataYearlyData(GB)TotalData(GB)6000.00 10.00 0.03 0.00 0.00 1.00 0.11 0.00 0.00 0.111800000.00 10.00 8.58 0.00 0.00 0.00 0.00 1.00 8.58 8.582250000.00 10.00 10.73 0.00 0.00 0.00 0.00 1.00 10.73 10.73Department Total = 19.43 GBBusiness Analytics Project Page 216
f) Intermediaries- Brokers DepartmentKey AssumptionsNo. of Brokers=300 No. of broker categories = 4No. of Insurers=30SubjectAreaBusinessDataClaimsDataOfficeDataFinancialdataOrganizationStructureDataInspection DataLegalDataOthersMasterDataCombinations(Possible)Approximate No. ofDataPointInputsTotalRowSize(GB)%MonthlydataMonthlyData(GB)% ofQuarterlydataQuarterlyData(GB)% ofYearlydataYearlyData(GB)TotalData(GB)4320000.00 8.00 16.48 0.00 0.00 0.33 21.75 0.67 11.04 32.79300000.00 4.00 0.57 0.00 0.00 1.00 2.29 0.00 0.00 2.29150000.00 4.00 0.29 0.00 0.00 0.00 0.00 1.00 0.29 0.29300000.00 10.00 1.43 0.00 0.00 0.00 0.00 1.00 1.43 1.43300.00 10.00 0.00 0.00 0.00 0.00 0.00 1.00 0.00 0.00300.00 10.00 0.00 1.00 0.02 0.00 0.00 0.00 0.00 0.0215000.00 10.00 0.07 0.00 0.00 1.00 0.29 0.00 0.00 0.2915000.00 10.00 0.07 0.00 0.00 0.00 0.00 1.00 0.07 0.07Department Total = 37.18 GBBusiness Analytics Project Page 217
g) F&A DepartmentKey AssumptionsNo. of Insurers=30 No. of shareholders for an insurer = 50SubjectAreaMasterDataCombinations(Possible)Approximate No.of DataPointInputsTotalRowSize(GB)%MonthlydataMonthlyData(GB)% ofQuarterlydataQuarterlyData(GB)% ofYearlydataYearlyData(GB)TotalData(GB)FinancialData 6000.00 15.00 0.04 0.00 0.00 0.00 0.00 1.00 0.04 0.04Shareholder'sData 15000.00 10.00 0.07 0.00 0.00 1.00 0.29 0.00 0.00 0.29NB Data(Life) 3840.00 6.00 0.01 1.00 0.13 0.00 0.00 0.00 0.00 0.13NB Data(Non Life) 1200.00 6.00 0.00 1.00 0.04 0.00 0.00 0.00 0.00 0.04Department Total = 0.5 GBApproximate data size for the current year (including all the departments and functions) = 317 GBTotal data size (Considering 8 years of history data at 8% growth) = 317*8/ (1.08^7) = 1.48 TBIndexing Factor = 8%Total Adjusted Data Size Considering Indexing= 1.48*(1.08) = 1.58 TBh) Total physical space EstimationAssuming a physical space of 70% of the total data size is consumed by the logs, views, storedprocedures and tables etc., the YoY estimation of the total space is given below:Business Analytics Project Page 218
Year wise data size (in TB)Year 1 Year 2 Year 3 Year 4 Year 5 Year 6 Year 7 Year 8Aggressive Estimate (12%Growth in Data Per Year)Average Estimate (10%Growth in Data Per Year)Conservative Estimate(8%Growth in Data Per Year)2.7 3.0 3.4 3.8 4.2 4.7 5.3 5.92.7 3.0 3.3 3.6 3.9 4.3 4.8 5.22.7 2.9 3.1 3.4 3.7 4.0 4.3 4.6i) Server Load EstimationAssumptions:Total No. of users for the solution = 1000 (Approx.)Maximum No. of concurrent users (15% of 1000) = 150Percentage of light weight users: 70%Percentage of medium weight users: 20%Percentage of heavy users: 10%User CategoryMaximum No. ofconcurrent usersAverage No. oftransactions per dayper userAverage Band widthrequirement peruserLoadLight 105 15 1 KBPS 1.575 MBPSMedium 30 25 3 KBPS 2.25 MBPSHeavy 15 20 10 KBPS 3.0 MBPSAdditional bandwidth requirements for email, other data intensive operations etc. will be another 1MbpsAn additional 0.5 Mbps should be kept as a reserve buffer to handle any surge of requests as well asspecial data intensive processing in an one off modeBusiness Analytics Project Page 219
Based on the above observations, it is envisaged that a bandwidth requirement of approximately 8.325MBPS.Business Analytics Project Page 220
D. CDC and DR SpecificationThis section elaborates the technical and infrastructure specifications for the CDC and DR site at <strong>IRDA</strong>Hardware SpecificationsIt is recommended to design a hardware infrastructure that will not only address the presentrequirements of the <strong>IRDA</strong> application but will also take into account the future high-bandwidth and highavailability of the application stack. Hardware infrastructure should have:High Availability: Application, Web and database servers have been designed in failover and firmmode with an ability to ensure full-proof operationsSeparate Storage: Additional space requirements for <strong>IRDA</strong> in future will ensured through aseparate Storage Area Network (SAN) driven disk. The disk will also be mirrored to ensure dataprotection and integrityRedundancy: Adequate processing and capacity redundancy have been built in within thesystem to ensure zero to minimal disruption in the overall operationsTable below describes various hardware components envisaged for the solution in the main data center:Components Specification CommentsWeb ServerWeb Accelerator/LoadBalancerDatabase ServerApplication ServerWeb Services ServerFirewall/Proxy Gateway2 Processors with dual coreeach or higher6 Processors with quad coreeach6 Processors with quad coreeach6 Processors with quad coreeach2 Processors with dual coreeach or higher2 Processors with dual coreeach or higherConfigured in a cluster of 2.May use existing hardwareand infrastructureConfigured in a cluster of 2.May use existing hardwareand infrastructureConfigured in a cluster of 2.May use existing hardwareand infrastructureConfigured in a cluster of 2.May use existing hardwareand infrastructureConfigured in a cluster of 2.May use existing hardwareand infrastructureExisting firewall and gatewaymay be usedStorage Device Capacity of around 5 TB with Additional storage capacityBusiness Analytics Project Page 221
Components Specification CommentsRoutersRAID 10 disk mirroringconfigurationStandard with 2 c v.35 portand 1 x ISDN failoveravailable may be leveraged1 router planned.; but anyexisting capacity will bereusedSwitches Switch 24 port 10/100/1000mbps Switch - (Catalyst 296024 10/100/1000, 4 T/SFP)1 Switch planned; but anyexisting capacity will bereusedFirewallModems4 x 10/100/1000 portsFirewallStandard configurationmodem with failoverFirewall in High Availabilitymode should be used. Existingset-up may be re-usedExisting set-up may be re-usedAll components of the proposed infrastructure should be configured in a fail over mode. This will ensureno single point of failure of the system and a high availability of the application for its end users. Tooptimize performance, load balancing should be implemented using a group of web servers. No antivirussoftware envisaged in the facility as it will be configured through high-end firewall configurations.Desktops will be protected using standard antivirus softwareBusiness Analytics Project Page 222
Network SpecificationsNetworking will be enabled by two virtualized ports configured in a failover mode. Dedicated VPN linkswill be established between Development environment and Hosted Services environment fordevelopment purposes.<strong>IRDA</strong> IntranetExternal UsersInternetFTP ServerUsersHosted EnvironmentDedicated VPNRouterOnline AccessFirewallLoadBalancersDMZ<strong>IRDA</strong> FTP Server<strong>IRDA</strong> Web Server Cluster<strong>IRDA</strong>DATABASEtextCLUSTERPublicPrivate<strong>IRDA</strong> File Server<strong>IRDA</strong> Application Server ClusterApplication design will ensure that all the data intensive processing will be restricted as back-end serverprocess within the data centre environment. Data centre will operate on a dedicated 10/100 MBPS LANensuring the processing integrity. All the master data managed facilities; application intensiveprocessing as well as transactions will be carried out through the standard internet traffic from the field.Physical Infrastructure SpecificationsCivil InteriorsAround 250 square foot of facilities should be made available at a designated area at <strong>IRDA</strong>. The roomshould have four walls and a ceiling with an appropriate clearance for putting server racks. Followingsections details out an indicative approach to the different facets of the data centre design, securitiesand maintenance operations.Civil and MasonryBusiness Analytics Project Page 223
Following civil and masonry work will be conducted as part of the operations. If the current facilitieshave the features available according to the specification, minor alterations may be carried out on thesame9-inch thick brick wall will be laid to ensure safety and compliance standardsWalls will be all plasteredA ramp will be provided at the entrance. Laying and fabrication work of the ramp will be carried outaccording to the required slope angle specification.Good penetrations will be made on all doors and seals with appropriate fire-stop material to ensureintegrityJoineryAnti-termite treatment will be provided initially as well as on periodic basisMain fire door will be a 2.4 m double winged , fire rated 1.5 x 2.4 m , double door with 300x900 mmfire rated flass vision panel100 mm x 50 mm marandi/equivalent wooden frame fire glass will be provided with Fire Checkmaterial in the top and bottom along with minimum 6 mm thick 1 hour Fire rated glass withbeading and finished with approved colors of 1.5 mm thickFULL HEIGHT CALCIUM SILICATE (FIRE RATE MIN 1 Hour) BOARD PARTITION will be provided for firecontrol. Calcium Silicate board partition (Non Asbestos) faced both sides will be 12 mm thick.Skirting, door junction and material transition sections to be in hardwood frame 50 x to provide10x10 grooves at all ends. If any hardwood sections are provided, these are to be coated all overwith 2 or more coats of viper anti-termite/fire retard paint. Inside voids to be filled with 50 mm thickpanels of glass wool/ rock wool. All board edges to be protected with aluminium anglesAccess Flooring and Insulation Work ACCESS FLOOR: Adjusting floor panels of 450+/- 20mm height will be provided under floorconstructionSelf adhesive type 13mm thick XLPE foam on under deck & floor including metalized foil completewith proper jointing will be provided as insulationFalse CeilingArmstrong or equivalent make false ceiling including making openings for electricallight fitting complete and fire alarm detectors and nozzles will be providedPainting and Epoxy WorksPlastic/acrylic light textured emulsion paint will be applied on server room internalwalls. Epoxy coating will be applied to the Duco paint will be provided for fire decorAdditionally appropriate fire and security signage will be provided as wellElectrical Works & Cabling and RacksBusiness Analytics Project Page 224
6 amp outlets with universal pin along with MS Box will be installedWiring for 16 amp power outlet points with 4 sq. mm PVC insulated copperconductor wire will be installed for hardwareSupplying and fixing of 63 amp 5-pin (Three phase Neutral and earth) for 3-phaseindustrial socket outlet will be provided forCat6 UTP Cable, roll of 305m will be used for cabling19" Rack 42U/800W/1000D Aluminium Extruded Structure (For Safe Working Loadof 1000Kgs) with Side Panels with Top and Bottom panel will be provided for housing the server andStorage devicesAccess Control SystemData Centre will have access control system with proximity card reader with appropriate security controlprocedures established. Standard features for such a system is outlined below:1 Door Control Unit for Access Control, microprocessor based with tamperprotected wall-mount caseoperation.Low power 12 V DC power supply with internal battery backup for 4 hoursProximity card Readers with 3" read range capable of Reading the facility code and unique card number from the card Shall only read the card data and passes on to the door controller for validationISO thickness Proximity Cards (Blank faced) with option of printing directly on card.Card has facility code, and unique card numberdoorsElectromagnetic Locks (600 lbs) with Magnetic Contact UL listed for single leafEmergency Door Release (Break Glass Type)1:N authentication Biometric Finger Print Reader with inbuilt proximity readerAccess Management Software complete with Graphic User Interface, Time &Attendance software – transactions, Anti-passback features complete as requiredFire Detection SystemStandard fire extinguishers will be deployed in the server roomAir Conditioning3 TR capacity PeX135FA-100 Precision AC, Floor discharge type with R-407C with Ethernet Connectivityand Sequential controller will be provided with appropriate climate control featuresPower Back-upBusiness Analytics Project Page 225
Power back-up is an important feature to protect the facility from outage. Following UPS features will beavailable in the data centreLiebert make 7400M 30/40 KVA UPS system with 3 phase input and 3 phase outputwith accessoriesSealed Maintenance free Battery to Support approximately 30 minutes back-upAdditionally a standard public address system as well as a Rodent insect repellent should also need to beinstalled in the data centre.Service Level for the proposed Data CenterSince most of the services to be provided by Data Center (DC) are highly critical to <strong>IRDA</strong>, the efficiency ofDC operation should be of high importance. The service levels should be of prime importance to ensurehigh efficiency of DC operations. The proposed technical architecture requires high availability .Thisshould be achieved through a High Available Design at various IT Infrastructure layers.Along with the design, there is a need for strong IT infrastructure management processes and acomprehensive maintenance plan involving maintenance engineers, spares and backend support fromOEMs for spare replenishment.The key considerations for ensuring high efficiency of Data Center (DC) operations are discussed in thetable below:Operations Should be 24 x 7 x 365Computing, Storageand ApplicationEnvironmentFrom an operational perspective, the system should provide enough availabilityto give comfort to applicants in terms of reliability and efficiency of the system.Service Level for ensuring uptime should be 99.9 per centThe architecture should have ‘No Single Point Of Failures’CommunicationNetworkThe MPLS backbone and Network should have assured uptime and therefore twoseparate links from two individual service providers should be used.Service Level for ensuring uptime should be 99.9 per centInformationSecurityInformation Security at various layers prohibiting the possible security threatsshould be ensured.Security should be ensured for the application data, Network and PhysicalInfrastructure being set up under this project.Security threats from unknown networks integrating with <strong>IRDA</strong> such as Insurerneed special attention and the design should take care of such users in a differentmanner.Business Analytics Project Page 226
PowerMaintainabilityManageabilityAdequate power backups to prevent system downtimeAdequate spares at the sites for all elements with single point of failure, sufficienton-site manpower to failure resolution on site, and back-to-back sparereplenishment plan with minimum spares turnaround time from the ProductOEMs should be ensured.Latest tools for Incident Management including Help desk, Problem Managementand Asset Management should be used and appropriate processes should bedefined based on the ITIL framework.Business Analytics Project Page 227
E. Technical details of Security for <strong>IRDA</strong> Business Analytics <strong>Solution</strong>Application TierThis is the innermost security tier covering the security aspects of the applications running in <strong>IRDA</strong>setup. This application tier should have following security aspects:Identification and Authentication – Multi Factor AuthenticationTwo-factor, or multi-factor authentication is exactly what it sounds like. Instead of using only one typeof authentication factor, such as only things a user KNOWS (login IDs, passwords, secret images, sharedsecrets, solicited personal information, etc), two-factor authentication requires the addition of a secondfactor, the addition of something the user HAS or something the user IS. For <strong>IRDA</strong> there is need for suchmulti factor authentications, especially for sensitive data like product pricing etc.Two-factor authentication is a commonly used concept. For example, the two-factor authentication isused every time a bank customer visits their local ATM machine. One authentication factor is thephysical ATM card the customer slides into the machine. The second factor is the PIN they enter.Without both, authentication cannot take place. This scenario illustrates the basic parts of most multifactorauthentication systems; the "something you have" + "something you know" concept.Types of Multi Factor Authentication are given below:TokensOne form of 'something you have' is the smart card and USB tokens. Differences between the smart cardand USB token are diminishing; both technologies include a microcontroller, an OS, a securityapplication, and a secured storage area.Virtual TokensVirtual tokens are a new concept in multi-factor authentication first introduced in 2005 by securitycompany, Sestus. Virtual tokens reduce the costs normally associated with implementation andmaintenance of multi-factor solutions by utilizing the user's existing internet device as the "somethingthe user has" factor. Also, since the user's internet device is communicating directly with theauthenticating website, the solution does not suffer from man-in-the-middle attacks and other forms ofonline fraud.BiometricsBiometric authentication also satisfies the regulatory definition of true multi-factor authentication.Users may biometrically authenticate via their fingerprint, voiceprint, or iris scan using providedhardware and then enter a PIN or password in order to open the credential vault. However, while thistype of authentication is suitable in limited applications, this solution may become unacceptably slowBusiness Analytics Project Page 228
and comparatively expensive when a large number of users are involved. In addition, it is extremelyvulnerable to a replay attack: once the biometric information is compromised, it may easily be replayedunless the reader is completely secure and guarded. Finally, there is great user resistance to biometricauthentication. Users resist having their personal physical characteristics captured and recorded forauthentication purposes.For many biometric identifiers, the actual biometric information is rendered into string or mathematicinformation. The device scans the physical characteristic, extracts critical information, and then storesthe result as a string of data. Comparison is therefore made between two data strings, and if there issufficient commonality a pass is achieved. It may be appreciated that choice of how much data tomatch, and to what degree of accuracy, governs the accuracy/speed ratio of the biometric device. Allbiometric devices, therefore, do not provide unambiguous guarantees of identity, but ratherprobabilities and all may provide false positive and negative outputs. If a biometric system is applied to alarge number of users - perhaps all of the customers of a bank, the error rate may make the systemimpractical to use.Biometric information may be mechanically copied and they cannot be easily changed. This is perceivedas a key disadvantage since, if discovered, the compromised data cannot be changed. A user can easilychange his/her password; however, a user cannot change their fingerprint. A bio-identifier can also befaked. For example, fingerprints can be captured on sticky tape and false gelatine copies made, orsimple photos of eye retinas can be presented. More expensive biometrics sensors should be capable todistinguish between live original and dead replicas, but such devices are not practical for massdistribution. It is likely that, as biometric identifiers become widespread, more sophisticatedcompromise techniques will also be developed.Historically, fingerprints have been used as the most authoritative method of authentication. Otherbiometric methods such as retinal scans are promising, but have shown themselves to be easilyspoofable in practice. Hybrid or two-tiered authentication methods offer a compelling solution, such asprivate keys encrypted by fingerprint inside of a USB device.SMS One Time PasswordSMS One time password uses information sent as an SMS to the user as part of the login process. Onescenario is where a user either registers (or updates) their contact information on a website. During thistime the user is also asked to enter his or her regularly used telephone numbers (home, mobile, work,etc). The next time the user logs in to the website, they must enter their username and password; if theyenter the correct information, the user then chooses the phone number at which they can be contactedimmediately from their previously registered phone numbers. The user will be instantly called or receivean SMS text message with a unique, temporary PIN code. The user then enters this code into thewebsite to prove their identity, and if the PIN code entered is correct, the user will be granted access totheir account. This process provides an extra layer of online security beyond merely a username andpassword. These solutions can be used with any telephone, not just mobile devices.Business Analytics Project Page 229
There is a newer method of using the mobile phone as the processor and having the Security Tokenreside on the mobile as a Java ME client. This method does not include data latency or incur hiddencosts for the end user. While such methods can simplify deployment, reduce logistical costs, and removethe need for a separate hardware token devices, there are numerous trade-offs. Users may incur feesfor text/data services or cellular calling minutes. In addition, there is a latency involved with SMSservices especially during peak SMS usage periods like the holidays. Finally, as with telephone-basedprocesses, these processes are also vulnerable to man-in-the-middle attacks. The victim visits acounterfeit website where they supply their login credentials. The counterfeit website passes these tothe legitimate website using scripts or other protocols. The legitimate website initiates an SMS textmessage delivery of a one-time-password to the victim's mobile device or simply waits for the Javatoken value to be generated. The victim enters the one-time-password onto the counterfeit website,which then forwards this to the legitimate website, where the waiting fraudster uses it to complete theiraccess.Universal Serial BusA USB token has different form factor; it can't fit in a wallet, but can easily be attached to a key ring. AUSB port is standard equipment on today's computers, and USB tokens generally have a much largerstorage capacity for logon credentials than smart cards. As with smart cards, magnetic card readers, andmobile signature methods, they are costly to deploy and support, are vulnerable to numerous forms oftheft and fraud, and have been resisted by consumers.Digital CertificatesDigital Client certificates are PKI solutions for enabling the enhanced user identification and accesscontrols needed to protect sensitive online information. Digital certificates can also be stored andtransported on smart cards or USB tokens for use when travelling. Each certificate can only be used toauthenticate one particular user because only that user’s computer has the corresponding and uniqueprivate key needed to complete the authentication process. Client certificates are deliveredelectronically; however, deployment and support of digital certificates have proven problematic. In a2008 study published by the Credit Union Journal, digital certificates were noted as averaging very highsupport costs and very low rates of user acceptance due to difficult technical implementationrequirements.Identification and Authentication – Digital SignatureConverting the paper based data capture process to online data submission will require utilizing someadvanced data authentications mechanism like Digital Signature. For quite a few returns submitted byInsurer require physical signoff by various stakeholders like CFO, Auditor, Appointed Actuary etc. Thissection will focus on various aspects of Digital Signature for utilizing it appropriately at <strong>IRDA</strong>.The Information Technology Act, 2000 provides for use of Digital Signatures on the documentssubmitted in electronic form in order to ensure the security and authenticity of the documents filedelectronically. This is the only secure and authentic way that a document can be submittedBusiness Analytics Project Page 230
electronically. As such, all filings done by the companies under MCA21 e-Governance programme arerequired to be filed with the use of Digital Signatures by the person authorized to sign the documents.Digital Signature provides the following:Authentication/ Identification (Who)Message Integrity (What)Non Repudiation/Non Denial (Legal Binding)Sample Digital SignatureSample Public Key in DigitalSignatureDigital Signature is used in Electronic filing or e-filing which is a method of filing signed document thatuses an electronic format rather than a traditional paper format. Parties convert their documents intothe file format designated by the authority and file their documents via email or over the Internet.Scenario comparison between Digital Signature and traditional authentication is given below:Business Analytics Project Page 231
Advantage of Digital Signature:Transactions can be done electronically with a click of a button.Details are sent across instantaneously once the information is submitted. No time delay incommunication.Processing & approval done electronically at each level and hence takes less timeAll the official communications can be sent through email, which is fast and cost-effectiveEnsures PAIN (Privacy & Confidentiality, Authenticity, Integrity, Non-Repudiation)Archival of information is possible. Also retrieval of the archived data is easierNo physical storage is required for the documentsLegal sanctity in a court of lawProcess for using Digital SignatureGetting a Private and Public Key: In order to electronically sign documents with standard digitalsignatures, sender needs to obtain a Private and Public Key – a one-time setup/operation. ThePrivate Key, as the name implies, is not shared and is used only by the signer to sign documents.The Public Key is openly available and used by those that need to validate the signer’s digitalsignature.Initiate the signing process: Depending on the software used, sender needs to initiate thesigning process (e.g. clicking a “Sign” button on the software’s toolbar).Create a digital signature: A unique digital fingerprint of the document (sometimes calledMessage Digest or Document Hash) is created using a mathematical algorithm (such as SHA-1).Even the slightest difference between two documents would create a different digitalfingerprint of the document.Append the signature to the document: The hash result and the user’s digital certificate (whichincludes his Public Key) are combined into a digital signature (by using the user’s Private Key toBusiness Analytics Project Page 232
encrypt the document hash). The resulting signature is unique to both the document and theuser. Finally, the digital signature is appended to the document.Initiates the validation process: depending on the software used, the receiver needs to initiatethe signing process (e.g. clicking a “Validate Signature” menu option button on the software’stoolbar).Decrypts Sender’s signature: Using his Public Key and gets the original document (the documentfingerprint).Compare Senders fingerprint with calculated: Software then calculates the document hash ofthe received document and compares it with the original document hash (from the previousstep). If they are the same, the signed document has not been altered.Business Analytics Project Page 233
Proposed Process flow of acquiring Digital SignatureBased on the specific data confidentiality requirement at <strong>IRDA</strong>, the following process flow is proposedfor acquiring Digital Signature:Business Analytics Project Page 234
Proposed process flow of validating Digital SignatureBased on the specific data confidentiality requirement at <strong>IRDA</strong>, the following process flow is proposedfor validating Digital Signature:Access Control – Role Based AccessWithin <strong>IRDA</strong>, roles are created for various job functions. The permissions to perform certain operationsare assigned to specific roles. Members of staff (or other system users) are assigned particular roles, andthrough those role assignments acquire the permissions to perform particular system functions. Unlikecontext-based access control (CBAC), RBAC does not look at the message context (such as a connection'ssource).Since users are not assigned permissions directly, but only acquire them through their role (or roles),management of individual user rights becomes a matter of simply assigning appropriate roles to theuser; this simplifies common operations, such as adding a user, or changing a user's department.RBAC differs from access control lists (ACLs) used in traditional discretionary access control systems inthat it assigns permissions to specific operations with meaning in the organization, rather than to lowlevel data objects. For example, an access control list could be used to grant or deny write access to aparticular system file, but it would not dictate how that file could be changed. In an RBAC-based system,an operation might be to create a 'credit account' transaction in a financial application or to populate a'blood sugar level test' record in a medical application. The assignment of permission to perform aBusiness Analytics Project Page 235
particular operation is meaningful, because the operations are granular with meaning within theapplication. RBAC has been shown to be particularly well suited to separation of duties (SoD)requirements, which ensure that two or more people must be involved in authorizing critical operations.Necessary and sufficient conditions for safety of SoD in RBAC have been analyzed. An underlyingprinciple of SoD is that no individual should be able to affect a breach of security through dual privilege.By extension, no person may hold a role that exercises audit, control or review authority over another,concurrently held role.Audit and Accountability – Audit LoggingAudit log is a chronological sequence of audit records, each of which contains evidence directlypertaining to and resulting from the execution of a business process or system function.Audit Trails provides track, trace and reporting capabilities for any changes associated with any data asystem, and for any data in third-party software or customized software residentSystem & Communications Protection – SSLTransport Layer Security (TLS) and its predecessor, Secure Sockets Layer (SSL), are cryptographicprotocols that provide security for communications over networks such as the Internet. TLS and SSLencrypt the segments of network connections at the Transport Layer end-to-end.In applications design, TLS is usually implemented on top of any of the Transport Layer protocols,encapsulating the application specific protocols such as HTTP, FTP, SMTP, NNTP, and XMPP. Historicallyit has been used primarily with reliable transport protocols such as the Transmission Control Protocol(TCP). However, it has also been implemented with datagram-oriented transport protocols, such as theUser Datagram Protocol (UDP) and the Datagram Congestion Control Protocol (DCCP), usage which hasbeen standardized independently using the term Datagram Transport Layer Security (DTLS).A prominent use of TLS is for securing World Wide Web traffic carried by HTTP to form HTTPS. Notableapplications are electronic commerce and asset management. Increasingly, the Simple Mail TransferProtocol (SMTP) is also protected by TLS (RFC 3207). These applications use public key certificates toverify the identity of endpoints.An increasing number of client and server products support TLS natively, but many still lack support. Asan alternative, users may wish to use standalone TLS products like Stunnel. Wrappers such as Stunnelrely on being able to obtain a TLS connection immediately, by simply connecting to a separate portreserved for the purpose.TLS can also be used to tunnel an entire network stack to create a VPN, as is the case with OpenVPN.Many vendors now marry TLS's encryption and authentication capabilities with authorization. Whencompared against traditional IPsec VPN technologies, TLS has some inherent advantages in firewall andNAT traversal that make it easier to administer for large remote-access populations.Business Analytics Project Page 236
TLS is also a standard method to protect Session Initiation Protocol (SIP) application signalling. TLS canbe used to provide authentication and encryption of the SIP signalling associated with VoIP and otherSIP-based applications.System & Communications Protection – Data EncryptionIn cryptography, encryption is the process of transforming information (referred to as plaintext) using analgorithm (called cipher) to make it unreadable to anyone except those possessing special knowledge,usually referred to as a key. The result of the process is encrypted information (in cryptography, referredto as ciphertext). In many contexts, the word encryption also implicitly refers to the reverseprocess, decryption (e.g. “software for encryption” can typically also perform decryption), to make theencrypted information readable again (i.e. to make it unencrypted).Business Analytics Project Page 237
System TierIt is a branch of technology known as information security as applied to computers and networks. Theobjective of system security includes protection of information and property from theft, corruption, ornatural disaster, while allowing the information and property to remain accessible and productive to itsintended users. The term system security means the collective processes and mechanisms by whichsensitive and valuable information and services are protected from publication, tampering or collapse byunauthorized activities or untrustworthy individuals and unplanned events.Systems & Information Integrity – Software IntegritySystem integrity means:That condition of a system wherein its mandated operational and technical parameters arewithin the prescribed limits.The quality of an Automated Information System when it performs its intended function in anunimpaired manner, free from deliberate or inadvertent unauthorized manipulation of thesystem. The state that exists when there is complete assurance that under all conditions an IT system isbased on the logical correctness and reliability of the operating system, the logical completenessof the hardware and software that implement the protection mechanisms, and data integrity.Data integrity is a term used in computer science and telecommunications that can mean ensuring datais "whole" or complete, the condition in which data is identically maintained during any operation (suchas transfer, storage or retrieval), the preservation of data for their intended use, or, relative to specifiedoperations, the a priori expectation of data quality. Put simply, data integrity is the assurance that datais consistent and correct.In terms of a database data integrity refers to the process of ensuring that a database remains anaccurate reflection of the universe of discourse it is modelling or representing. In other words there is aclose correspondence between the facts stored in the database and the real world it modelsIdentification & Authentication – Strong PasswordsIdentification is the process by which the identity of a user is established, and authentication is theprocess by which a service confirms the claim of a user to use a specific identity by the use of credentials(usually a password or a certificate).Identification is an assertion of who someone is or what something is. If a person makes the statement"Hello, my name is John Doe." they are making a claim of who they are. However, their claim may ormay not be true. Before John Doe can be granted access to protected information it will be necessary toverify that the person claiming to be John Doe really is John Doe.Authentication is the act of verifying a claim of identity. When John Doe goes into a bank to make awithdrawal, he tells the bank teller he is John Doe (a claim of identity). The bank teller asks to see aphoto ID, so he hands the teller his driver's license. The bank teller checks the license to make sure it hasBusiness Analytics Project Page 238
John Doe printed on it and compares the photograph on the license against the person claiming to beJohn Doe. If the photo and name match the person, then the teller has authenticated that John Doe iswho he claimed to be.There are three different types of information that can be used for authentication: something you know,something you have, or something you are. Examples of something you know include such things as aPIN, a password, or your mother's maiden name. Examples of something you have include a driver'slicense or a magnetic swipe card. Something you are refers to biometrics. Examples of biometricsinclude palm prints, finger prints, voice prints and retina (eye) scans.Using strong passwords lowers overall risk of a security breach, but strong passwords do not replace theneed for other effective security controls. The effectiveness of a password of a given strength is stronglydetermined by the design and implementation of the authentication system software, particularly howfrequently password guesses can be tested by an attacker and how securely information on userpasswords is stored and transmitted.Access Control – Role Bases AccessAccess to protected information must be restricted to people who are authorized to access theinformation. The computer programs, and in many cases the computers that process the information,must also be authorized. This requires that mechanisms be in place to control the access to protectedinformation. The sophistication of the access control mechanisms should be in parity with the value ofthe information being protected - the more sensitive or valuable the information the stronger thecontrol mechanisms need to be. The foundation on which access control mechanisms are built, startwith identification and authentication.Role-based access control (RBAC) is an approach to restricting system access to authorized users. It is anewer alternative approach to mandatory access control (MAC) and discretionary access control (DAC).RBAC is sometimes referred to as role-based security.RBAC is a policy neutral and flexible access control technology sufficiently powerful to simulate DAC andMAC.With the concepts of role hierarchy and constraints, one can control RBAC to create or simulate latticebasedaccess control (LBAC). Thus RBAC can be considered a superset of LBAC.Business Analytics Project Page 239
Audit & Accountability – Audit LoggingAudit trail or audit log is a chronological sequence of audit records, each of which contains evidencedirectly pertaining to and resulting from the execution of a business process or system function.Audit records typically result from activities such as transactions or communications by individualpeople, systems, accounts or other entities. The process that creates audit trail should always run in aprivileged mode, so it could access and supervise all actions from all users, and normal user could notstop/change it. Furthermore, for the same reason, trail file or database table with a trail should not beaccessible to normal users.Accountability uses such system components as audit trails (records) and logs to associate a subject withits actions. The information recorded should be sufficient to map the subject to a controlling user. Audittrails and logs are important forDetecting security violations Re-creating security incidentsIf no one is regularly reviewing your logs and they are not maintained in a secure and consistentmanner, they may not be admissible as evidence.Many systems can generate automated reports based on certain predefined criteria or thresholds,known as clipping levels. For example, a clipping level may be set to generate a report for the following:More than three failed logon attempts in a given period Any attempt to use a disabled user accountThese reports help a system administrator or security administrator to more easily identify possiblebreak-in attempts.System & Communications protectionWhen organizations think of backup and recovery, it is usually associated with protecting informationresiding on a server. It is important in <strong>IRDA</strong>’s context to remember, however, that this constitutes bothBusiness Analytics Project Page 240
data and system information. Too often, so much emphasis is put on the need to protect the data thatthe system is overlooked. But if the system is not operable, the chances of accessing the data are slim.When a server operating system fails, it can take eight or more hours (days, in some instances) torebuild and restore the server. This process includes reinstalling the OS, applications, patches,configuring settings, etc. Moreover, there are no guarantees that the server will be in the exact samestate as before the failure took place.There is also the matter of having to replace the server hardware. Few organizations can afford theluxury of maintaining extra server hardware in case they need to replace an existing system. Thisintroduces the issue of restoring a system to a new and dissimilar piece of hardware, while trying topreserve the integrity of the system state and the availability of the data. Organizations must ensurethat their system backup/recovery solutions provide hardware-independent restoration.By deploying both data protection and system recovery solutions, organizations of any size can realizethe benefits of shorter backup times, faster system recovery, and reduced data loss.For this purpose it is recommended to use Disaster Recovery Site for <strong>IRDA</strong> to protect the Data andApplications considering the sensitivity and criticality of the data that <strong>IRDA</strong> deals with.Network TierNetwork security consists of the provisions made in an underlying computer network infrastructure,policies adopted by the network administrator to protect the network and the network-accessibleresources from unauthorized access, and consistent and continuous monitoring and measurement of itseffectiveness (or lack) combined together.Network security starts from authenticating the user, commonly with a username and a password. Sincethis requires just one thing besides the user name, i.e. the password which is something you 'know', thisis sometimes termed one factor authentication. With two factor authentication something you 'have' isalso used (e.g. a security token or 'dongle', an ATM card, or your mobile phone), or with three factorauthentication something you 'are' is also used (e.g. a fingerprint or retinal scan).Once authenticated, a firewall enforces access policies such as what services are allowed to be accessedby the network users. Though effective to prevent unauthorized access, this component may fail tocheck potentially harmful content such as computer worms or Trojans being transmitted over thenetwork. Anti-virus software or an intrusion prevention system (IPS) helps to detect and inhibit theaction of such malware. An anomaly-based intrusion detection system may also monitor the networkand traffic for unexpected (i.e. suspicious) content or behaviour and other anomalies to protectresources, e.g. from denial of service attacks or an employee accessing files at strange times. Individualevents occurring on the network may be logged for audit purposes and for later high level analysis.Business Analytics Project Page 241
Security managementIt is recommended to have following Network security measurements for the <strong>IRDA</strong> system.A strong firewall and proxy to keep unwanted people out.A strong Antivirus software package and Internet Security Software package.For authentication, use strong passwords and change it on a weekly/bi-weekly basis.When using a wireless connection, use a robust password.Exercise physical security precautions to employees.Prepare a network analyzer or network monitor and use it when needed.Implement physical security management like closed circuit television for entry areas andrestricted zones.Security fencing to mark the company's perimeter.Fire extinguishers for fire-sensitive areas like server rooms and security rooms. Security guards can help to maximize security.It is also recommended for <strong>IRDA</strong> to design and implement a IT Security policy to safeguard its IT assets.Everything that is done in the name of security, then, must enforce that policy uniformly. The followingpart of this section focuses on the Network Security components.FirewallsIn order to provide some level of separation between <strong>IRDA</strong>’s intranet and the Internet, firewalls wouldhave to be employed. A firewall is simply a group of components that collectively form a barrierbetween two networks.Few terms related to firewalls:Bastion hostA general-purpose computer used to control access between the internal (private) network (intranet)and the Internet (or any other un-trusted network). Typically, these are hosts running a flavour of theUnix operating system that has been customized in order to reduce its functionality to only what isnecessary in order to support its functions. Many of the general-purpose features have been turned off,and in many cases, completely removed, in order to improve the security of the machine.RouterA special purpose computer for connecting networks together. Routers also handle certain functions,such as routing, or managing the traffic on the networks they connect.Access Control List (ACL).Many routers now have the ability to selectively perform their duties, based on a number of facts abouta packet that comes to it. This includes things like origination address, destination address, destinationBusiness Analytics Project Page 242
service port, and so on. These can be employed to limit the sorts of packets that are allowed to come inand go out of a given network.Demilitarized Zone (DMZ)The DMZ is a critical part of a firewall: it is a network that is neither part of the untrusted network, norpart of the trusted network. But, this is a network that connects the untrusted to the trusted. Theimportance of a DMZ is tremendous: someone who breaks into your network from the Internet shouldhave to get through several layers in order to successfully do so. Those layers are provided by variouscomponents within the DMZ.ProxyThis is the process of having one host act in behalf of another. A host that has the ability to fetchdocuments from the Internet might be configured as a proxy server, and host on the intranet might beconfigured to be proxy clients. In this situation, when a host on the intranet wishes to fetch the <strong>IRDA</strong>’sweb page, for example, the browser will make a connection to the proxy server, and request the givenURL. The proxy server will fetch the document, and return the result to the client. In this way, all hostson the intranet are able to access resources on the Internet without having the ability to direct talk tothe Internet.Business Analytics Project Page 243
F. Security Settings for <strong>IRDA</strong> Business Analytics ProjectThe following section outlines the various application components that are used to administer security.This strategy includes the decisions <strong>IRDA</strong> has made regarding the processing options settings for thesecurity objects.1) Sign-On Security# Description Possible Value(s) <strong>IRDA</strong> BAP Settings1 Unique ID generation 1 – Enable Default Blank – DisableBlank – Detail a complex initialpassword for new User IDs2 Maximum number ofdays before thesystem requires apassword change.11 digits are possible:(Range of: 0 –99999999999)Password Change Frequency:45 Days3 The number of timesthat a user canunsuccessfullyattempt to log onbefore his or heraccount is disabled.3 digits are possible:(Range of: 0 – 999)Unsuccessful Logon AttemptsBefore Account Lock-out: 34 Indicates if the user’saccount is enabled ordisabled. A disabledaccount is not allowedinto the businessanalytics solution01 - Enable02 - DisableEnable5 Force immediatepassword change fornew users0 – No1 - YesYes6 The number of timesthat a user canchange his or herpassword in one day.10 digits are possible(Range of 0 –9999999999)3Business Analytics Project Page 244
# Description Possible Value(s) <strong>IRDA</strong> BAP Settings7 Minimum passwordlength8 Minimum number ofcharacters to be usedin the password9 Minimum number ofcharacters to be usedin the password10 Maximum number ofconsecutivecharacters in thepassword11 Minimum number ofspecial charactersrequired in thepassword5 digits (Range of: 0 –99999)5 digits (Range of: 0 –99999)5 digits (Range of: 0 –99999)5 digits (Range of: 0 –99999)5 digits (Range of: 0 –99999)81100In addition, the following global password settings will be configured, in accordance with <strong>IRDA</strong>’srequirements. TheSetting<strong>IRDA</strong> BAP SettingsMinimum password length 8Minimum number of characters to be used in the password 1Minimum number of characters to be used in the password 1Maximum number of consecutive characters in the password 0Minimum number of special characters required in the password 0Business Analytics Project Page 245
G. Data Archiving Procedures and Guidelines for <strong>IRDA</strong> BusinessAnalytics <strong>Solution</strong>The following table summarizes the marking, transmission, storage, restoration, and destructionprocedures / guidelines for information assets classified as “Restricted”, “Confidential”, and“Internal”. These procedures / guidelines do not apply to the information assets classified as“Public”.Classification Marking Transmission Storage & retention DestructionRestricted“<strong>IRDA</strong>Restricted”prominentlyprinted on apage /displayed onscreen, form orpresentationmedia.In case ofelectronicdocuments,use footers formarkingGeneral:Information is sharedwith third parties undercontractual agreement,appropriate informationsecurity controls, auditand appropriatemanagement approval.Electronic Information:Authenticate recipientprior to transmissionusing at least thepassword (in case ofFTP). Ensure completetransmission andreceipt by intendedparty. Use appropriatelevel of encryption fortransmission on publicnetworks and otherdelivery channels, ifrequired. Password -protect the documentand send the documentand passwordseparately.Non-ElectronicInformation:Use appropriateElectronicInformation:Authenticateindividuals requiringaccess using strongauthenticationmeasures.Modificationrestricted to theinformation owner orparty authorized byinformation owner.Encryption should beused for privacyprotection ifnecessary.Information is backedup to facilitaterecovery of approvedbackup procedures /guidelines.Backup media shouldbe kept in fire-proofsafe.Non-electronicInformation:Information is not leftunattended andElectronicInformation:Delete file fromstorage mediausing typicalsystem deletecommands.If on the harddisk, delete thefiles beforeusing it fordifferentpurpose, ordegauss thehard diskremoving itfrom thesystem.If on CD /Floppy, ensuredestruction byshredding it intosmaller parts.If on DAT tape,ensureBusiness Analytics Project Page 246
Classification Marking Transmission Storage & retention Destructionpackaging to concealthe contents. Receipt ofdelivery required. Useregistered mail ordedicated carrier. Affixtamper-proof seal onthe package. Superscribethe following onthe envelope: “Privateand Confidential”should be storedunder lock and key.Retention:As per contractual /legal requirements.In case of customerdata as per regulatoryguidelines.destruction byphysical meansNon-ElectronicInformation:Destroy usingshredder kept inrestricted area.As per informationowner requirements.Confidential“<strong>IRDA</strong>Confidential”prominentlyprinted on apage /displayed onscreen, form orpresentationmedia.In case ofelectronicdocuments,use footers formarkingGeneral:Information is sharedwith third parties undercontractual agreement,appropriate informationsecurity controls, auditand appropriatemanagement approval.Sharing of customerinformation must be incompliance withcontract or agreement.Electronic Information:Authenticate recipientprior to transmissionusing at least thepassword (in case ofFTP). Ensure completetransmission andreceipt by intendedparty. Use appropriatelevel of encryption fortransmission on publicElectronicInformation:Authenticateindividuals requiringaccess using strongauthenticationmeasures.Modificationrestricted to theinformation owner orparty authorized byinformation owner.Information is backedup to facilitaterecovery of approvedbackup procedures /guidelines.ElectronicInformation:Delete file fromstorage mediausing typicalsystem deletecommands.If on hard disk,delete the filesbefore using itfor a differentpurpose ordegauss thehard diskIf information ishighly sensitive,overwrite files.If on CD /Floppy, ensuredestruction byBusiness Analytics Project Page 247
Classification Marking Transmission Storage & retention Destructionnetworks and otherdelivery channels, ifrequired. Password -protect the documentand send the documentand passwordseparately.Non-electronicInformation:Information is not leftunattended andshould be storedunder lock and key.shredding it intosmaller parts.If on DAT tape,ensuredestruction byphysical meansNon-ElectronicInformation:Use appropriatepackaging to concealthe contents. Receipt ofdelivery required. Useregistered mail ordedicated carrier. Affixtamper-proof seal onthe package. Superscribethe following onthe envelope: “Privateand Confidential”Retention:As per contractual /legal requirements.In case of customerdata as per regulatoryguidelines.As per informationowner requirementsNon-ElectronicInformation:Destroy usingshredder kept inrestricted area.Internal“<strong>IRDA</strong>Internal”prominentlyprinted on apage /displayed onscreen, form orpresentationmedia.In case ofelectronicdocuments,use footers formarkingGeneral:Information is sharedwith third parties undercontractual agreement.Electronic Information:Authenticate recipientprior to transmissionusing at least thepassword (in case ofFTP).Non-ElectronicInformation:Use appropriatepackaging to concealthe contents. Seal onElectronicInformation:Modificationrestricted to theinformation owner orparty authorized byinformation owner.Information is backedup to facilitaterecovery of approvedbackup procedures /guidelines.Back up media shouldbe kept in a fire proofsafe.ElectronicInformation:Delete file fromstorage mediausing typicalsystem deletecommands. Ifon the harddisk, delete thefiles beforeusing it fordifferentpurpose, ordegauss thehard disk. If onCD / Floppy,Business Analytics Project Page 248
Classification Marking Transmission Storage & retention Destructionthe package.Non-electronicInformation:Information is not leftunattended andshould be storedunder lock and key.Retention:As per contractual /legal requirements.As per informationowner requirementsensuredestruction byshredding it intosmaller parts.If on DAT tape,ensuredestruction byphysical meansNon-ElectronicInformation:Destroy usingshredder kept inrestricted area.Business Analytics Project Page 249
H. Existing applications at <strong>IRDA</strong> with their detailsFunctionalities performed by different applications1. Content Management SystemObjective:Frequently used for storing, controlling, versioning, and publishing industry-specific documentation suchas news articles, operators' manuals, technical manuals, sales guides, and marketing brochures. Thecontent managed may include computer files, image media, audio files, video files, electronicdocuments, and Web content. These concepts represent integrated and interdependent layers.Main Features of CMS:Content can be entered manuallyContent of different format such as PDF, Excel, Word are storedContent can be downloaded from the portalPortal is available in English and HindiBuilt-in search facilityRole based content managementFunctionality of CMS:User Credential verification – This is the security based access method so that the users willproper access rights can access the proper documents and data security is maintainedAdding of page content – This functionality is used for adding new pages in the portal. Once userlog into the system, he can add new contents based on his credentials.Modifying a page content – Modifying functionality applies on the existing contents in theportal. If any user wants to modify the content, then he log in the system using his user id andpassword and depending upon his credentials, he can modify the content.Deleting Page Content - This functionality is used for deleting the content already present in theportal. The user logs in the system using his user ID and password. The system verifies hiscredentials and depending upon his access rights, he can delete the content from the portal. Incase the user does not have any deletion rights, system throws a message.Search Engine – This functionality is used for searching the contents using some key words.Business Analytics Project Page 250
Once any user input some keyword and hit the search button, then the system starts searchingthe database and it traces out all those items having matching keyword. In case there is no itemmatched, then the system shows a message that no item has been found.2. Brokers Online Filing SystemObjective:The main objective of Broker online filing is to provide an online facility for registering new broker,modifying existing brokers’ information, filing of returns by brokers.Functionality of Broker Online Filing:Registration of brokers with <strong>IRDA</strong> – The new would-be brokers are required to fill up some forms forregistering themselves with <strong>IRDA</strong>. This facility is available online in this portal. The form required to befilled up for registration is available in this portal. A would-be broker will fill up the form. The data willbe automatically stored in database. This data will be visible to <strong>IRDA</strong> nodal officer who will approve ordisapprove the registration on the basis of his offline findings about the data.Modification and removal of broker’s details – This functionality is available for <strong>IRDA</strong> Nodal officer whocan modify or remove the information on brokers whenever necessary. Once the officer receives anycommunication from the broker regarding modification of details, he can go this portal and change theinformation as per needed. He can also remove the information about a broker in case he finds anythingto do so.Filing of returns – Brokers files the returns on monthly basis. This functionality of the portal helps themto file the returns online. The returns can be submitted using a pre-defined template. The datasubmitted will be captured and stored in a database. This data will be used for generating theconsolidated reports for audit and internal consumption.Once the returns are submitted, the broker can also view the summary status report on the followingcategories;Resubmission requestReturns FiledReturns not FiledThe broker can drill down to those reports that are falling in each category.Business Analytics Project Page 251
3. Grievance Management SystemObjective:The objective of Grievance management is to monitor the policyholders’ grievance and track them forspeedy resolution. The grievance management system tracks the new complaint, forwarded complaints,update status of complaints, rending the insurers and generating some customized reports on the basisof the complaints.Functionality of Grievance Management:Registering New Complaint – Once <strong>IRDA</strong> receives any complaint from the policyholders, it registers thecomplaints after some verification. The newly registered complaint is given a grievance no. and a status.The grievance no. is a unique no and is used to track the complaint for future reference.Tracking new complaints – <strong>IRDA</strong> tracks the new complaints along with some basic information on thedate of receipt and status of the complaint. The portal is capable of showing the complaints for eachinsurer and for overall insurers also.Track the forwarded complaints – This functionality of the portal helps the grievance Department totrack the forwarded complaints so that if there is any forwarded complaint which has not been takencare of by the insurer for long, they can send the reminder to the insurers.Reminder – The system is capable of tracking the complaints which have not been taken care of by theinsurers and reminder has been sent to them.Update Status – The status of the complaints are changed as per the follow up. Such status helps totrack the current scenario of the complaints.Customized <strong>Report</strong>s – On the basis of the complaints registered, the system is capable of generatingsome customized reports for each insurer and on an overall basis. Such reports are generated annuallyand reviewed by <strong>IRDA</strong> for accessing the complaints status for each insurer and in Indian insurancescenario.Customized Letters Format – There are three types of letter formats available -Acknowledgement letterClosed letterUpdate screen for date of filing and insurer reply date4. Advertisement Management SystemBusiness Analytics Project Page 252
Objective:This module is designed to track the details advertisements for each insurer. The module also tracksthose advertisements that are released by Intermediaries. The insurers maintain a separate register fortracking the advertisements. So the information captured in the portal helps <strong>IRDA</strong> to inspect the datamaintained by the insurers.Functionality of Advertisement:Registering New Advertisement – Once there is some new advertisement for any insurer, then the portalgenerates the unique insurer-wise advertisement reference no. to track the advertisements and also itsends automatic e-mail to the insurer and the Office-in-Charge (OIC).Modification of Advertisement – Modification of advertisement is considered as new advertisement andhence the portal generates another advertisement reference no. for the modified advertisements.Tracking complaints – The insurers has to send the details of the advertisements released to <strong>IRDA</strong>through hardcopy format. On the receipt of the details, <strong>IRDA</strong> enters the following details about theadvertisement;Date of receipt<strong>IRDA</strong> inward No.ObservationsFiling of Advertisement detailsNotification – The notification is sent to the insurers in the following scenario; There is any advertisement which has been launched by the insurer but not provided details .If there is any non-compliance in the details of the advertisement, then notification is sent tothe insurer.5. Third Party Administrators ModuleObjective:This module is designed to track the details of the third party administrators. Third Party Administratorsare engaged by the insurers for fee/ remuneration.Functionality of Advertisement:Business Analytics Project Page 253
Registration of TPA - The functionality helps the third party administrators to register with <strong>IRDA</strong> online.Only those licensed Surveyors are eligible for registration with <strong>IRDA</strong>. The portal contains a form thatSurveyors need to fill up for registration. Once the form is submitted, then the data is captured andstored in database. The Officer-in-Charge of <strong>IRDA</strong> can access the data. He can approve or disapprove onthe basis of the data submitted by the Surveyors.Modification and removal of details of Surveyors – Once a registered Surveyors communicates with theOfficer-in-Charge in <strong>IRDA</strong> about some changes in the details, the officer-in-charge can change the detailsof the TPA as required and update the data in the system. If there is anything which dictates the removalof TPA, then the OIC also can remove the TPA using the removal functionality.Querying of data – The portal is capable of querying the data on the basis of the requirements. Once anyuser runs a particular query, the portal will fetch the relevant data from the database and display thedata in a structured predefine format. This feature of the portal helps to generate dynamic reports onthe basis of the data on Surveyors.6. New Business Statistics (Life and Non Life)Objective:This module is designed to track the statistics on new business for life & non-life business. Thecompliance officer of insurer submits the value of the new business statistics for every month to theOfficer-in-Charge (OIC) at <strong>IRDA</strong>.Functionality of New Business Statistics Module:Online Submission of Statistics – The insurers submit the new business statistics value on monthly basisto the officer-in-charge in <strong>IRDA</strong>. Once they submit the values of the new business statistics, the data isstored in the database so that OIC can access the data and validate the same on the basis of the returnssubmitted by the insurers.The returns are classified into Individual, group , urban, rural, social sector. Also the portal captures theinformation on rides.Security Enabled Accessing Feature – Each insurer is assigned a user ID and a password so that they cansubmit the new business statistics values and cannot view the details of other insurers. This functionhelps to maintain data security.Customized <strong>Report</strong>ing – Customized reporting capability helps <strong>IRDA</strong> to consolidate the returnssubmitted by the insurers and generate reports for each insurer and also for the Indian Insuranceindustry. The reports are published in the website and <strong>IRDA</strong> journals after obtaining the approval fromBusiness Analytics Project Page 254
the concerned authority.Auto-Mailing Feature – This auto-mailing feature sends automated e-mails to the insurers in case thereis any delay in submission of the new business statistics values.Technical Specifications of different existing operational applicationsThe following data was gathered for different systems based on a questionnaire session organized forcapturing the details for various systems1. Grievance Management SystemParametersSystem/Application NameSystem Application Objective and functionality(optional)System UsersSystem OwnerData Entry TypeFrequency of Data EntryTechnology usedDetailsGrievances Management System(Life & Non-Life)Grievances Management for both Life and Non-LifeGrievances Cell of Life and Non-Life departmentGrievances Cell of Life and Non-Life departmentData entry screenDaily and As & When.NETDatabase System Sql Server 2000 / 2005Database SizeHow many years of dataLess than 1 GBSince 1 April 2005, 4 Yrs# of users (IDs created) 10 UsersHours of peak accessKnowledge of structureHow is report generated out of this particular SourceSystem10:00 AM to 2:00 PM and 3PM to 5:30 PM on aweek day<strong>IRDA</strong> has knowledge about Structure of the tables.PdfBusiness Analytics Project Page 255
Parameters<strong>Architecture</strong> TypeDetailsWeb basedServer Hardware Type HP / IBM X 235Pain Points and Drawbacks in the system CurrentlyChanges and improvement desired in the systemSome attributes / Classifications not availableAdditional MIS reports required2. Surveyor Licensing PortalParametersSystem/Application NameSystem Application Objective and functionality(optional)System UsersSystem OwnerData Entry TypeFrequency of Data EntryTechnology usedDetailsSurveyor Licensing SystemLicensing of Surveyors ( including traineesurveyors)Surveyor Division ( Non-Life Department)Surveyor Division ( Non-Life Department)Data Entry ScreensAs and WhenVB.NETDatabase System Sql Server 2000 / 2005Database SizeHow many years of data10 Years of Data5 Years# of users (IDs created) 5 UsersHours of peak accessKnowledge of structureHow is report generated out of this particular SourceSystem10:00 AM to 2:00 PM and 3PM to 5:30 PM on aweek day<strong>IRDA</strong> has knowledge about Structure of the tablesCrystal reportBusiness Analytics Project Page 256
Parameters<strong>Architecture</strong> TypeDetailsClient / ServerServer Hardware Type IBM x 235Pain Points and Drawbacks in the system CurrentlyChanges and improvement desired in the systemNo pain areasWeb based interface would be required3. Online Agent RegistrationParametersSystem/Application NameSystem Application Objective and functionality(optional)System UsersSystem OwnerData Entry TypeFrequency of Data EntryDetailsAgency Licensing PortalIssue of Agent Licenses (individual/Corporate/Specified person)DPs of InsurersAgent and ATIData entry screenDaily and As & WhenTechnology used ASP / IIS 5.0Database System Sql Server 2000Database SizeHow many years of data5 - 10 GB9 Yrs# of users (IDs created) 500 UsersHours of peak accessKnowledge of structure10:00 AM to 2:00 PM and 3PM to 5:30 PM ona week day<strong>IRDA</strong> has knowledge about Structure of thetablesBusiness Analytics Project Page 257
ParametersHow is report generated out of this particularSource System<strong>Architecture</strong> TypeServer Hardware TypePain Points and Drawbacks in the systemCurrentlyChanges desired in the systemDetailsExcelWeb basedHPSlow response time, reports take lot of timeAdditional functionalities like directregistration of Agents, generation of someadditional reports4. Receipt and Inward SystemParametersSystem/Application NameSystem Application Objective and functionality(optional)System UsersSystem OwnerData Entry TypeFrequency of Data EntryTechnology usedDatabase SystemHow many years of dataDetailsReceipt and Inward SystemTracking of inward mails /office notesAll staff of <strong>IRDA</strong>AdministrationData entry screenDaily and As & WhenDeveloper 2KOracle 9i under Sun Solaris6 Yrs# of users (IDs created) 125 UsersHours of peak access10:00 AM to 2:00 PM and 3PM to 5:30 PM ona week dayBusiness Analytics Project Page 258
ParametersKnowledge of structureHow is report generated out of this particularSource System<strong>Architecture</strong> TypeServer Hardware TypePain Points and Drawbacks in the systemCurrentlyChanges and improvement desired in the systemDetails<strong>IRDA</strong> has knowledge about Structure of thetables<strong>Report</strong>s 2.5 ( D2K)Client / ServerSun Fire 250 RSlow response timeAdditional functionalities to be included5. MISParametersSystem/Application NameSystem Application Objective and functionality(optional)System UsersSystem OwnerData Entry TypeFrequency of Data EntryDetailsMISCollecting Regulatory returns from Insurersand Generating AnalysisF & A DepartmentF & A DepartmentData entry screen / Excel template uploadQuarterly / AnnualTechnology used VB 6Database System Sql Server 2000 / 2005Database SizeHow many years of data5 Years Data5 Years# of users (IDs created) 5 Users ( Users of F&A Dept)Business Analytics Project Page 259
ParametersHours of peak accessKnowledge of structureHow is report generated out of this particularSource System<strong>Architecture</strong> Type (if you have a diagram thenkindly attach)Details10:00 AM to 2:00 PM and 3PM to 5:30 PM ona week day<strong>IRDA</strong> has knowledge about Structure of thetablesCrystal <strong>Report</strong>s / Sql <strong>Report</strong>ing ServicesClient / ServerServer Hardware Type IBM x 235Pain Points and Drawbacks in the systemCurrentlyChanges and improvement desired in the system<strong>Report</strong>s do not tally with the actual reportssubmitted by InsurersData filing should be online , Propervalidation to be done at Insurer level6. ATI DatabaseParametersSystem/Application NameSystem Application Objective and functionality(optional)System UsersSystem OwnerData Entry TypeFrequency of Data EntryTechnology usedDatabase SystemDetailsATI DatabaseCapturing new application details of ATIs(Online / Off-line)Agents and ATI DivisionAgents and ATI DivisionData Entry ScreensAs and WhenDeveloper 2KOracle 9i under Sun SolarisBusiness Analytics Project Page 260
ParametersDatabase SizeHow many years of dataDetails3-4 Years Data3 Years# of users (IDs created) 5 UsersHours of peak accessKnowledge of structureHow is report generated out of this particularSource System<strong>Architecture</strong> TypeServer Hardware Type10:00 AM to 2:00 PM and 3PM to 5:30 PM ona week day<strong>IRDA</strong> has knowledge about Structure of thetables<strong>Report</strong>s 2.5 ( D2K)Client / ServerSun Fire 250 RBusiness Analytics Project Page 261