Site selection for artificial recharging of groundwater by application ...
Site selection for artificial recharging of groundwater by application ...
Site selection for artificial recharging of groundwater by application ...

You also want an ePaper? Increase the reach of your titles
YUMPU automatically turns print PDFs into web optimized ePapers that Google loves.
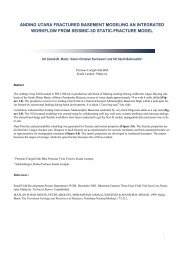
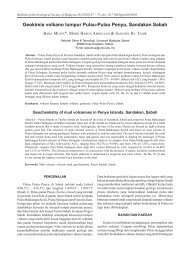
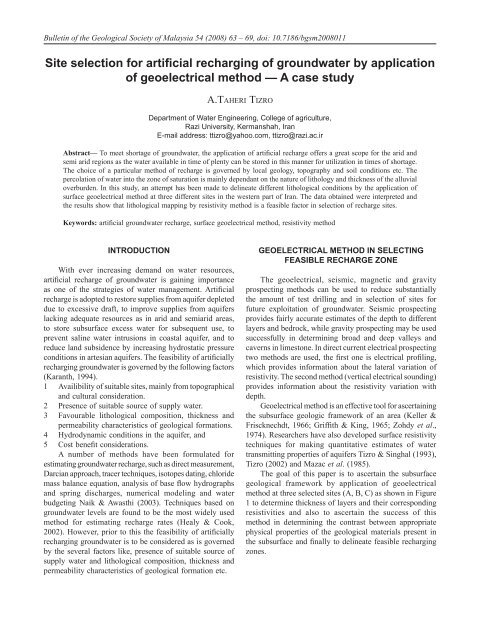
A.Ta h e r i Ti z r oBackground<strong>Site</strong> locationThe area is at the foot <strong>of</strong> the Alvand Mountain, locatedto the north east <strong>of</strong> Hamedan west <strong>of</strong> Iran. The area has anetwork <strong>of</strong> roads and is connected to Hamedan, the statecapital. Three selected sites, A, B and C as shown in Figure1were examined. The area A, located near Qareh Aqach Riveris underlain <strong>by</strong> alluvial deposits <strong>of</strong> varied composition whichincreases in thickness towards the south and <strong>for</strong>ms an aquiferknown as the Bahar and Lalejin Basin (Figure 1).The principal study area selected is the Qareh AqachRiver aquifer which is relatively small in width. The aquiferis made up <strong>of</strong> a thick veneer <strong>of</strong> alluvial <strong>for</strong>mations andpresently <strong>for</strong>ms recharge sites.Resistivity soundings were also made in the AsadAbad basin to furnish and locate fractures to obtain existingsubsurface data in site B. The aquifer is bordered <strong>by</strong>metamorphosed schistose and partly crystallized rocks inthe east and <strong>for</strong>ming a broad plain in the west providinghigh-yielding wells <strong>for</strong> agricultural use. Groundwater occursunder water table conditions in the alluvial, weathered,fissured, jointed and fractured zones. Detailed study <strong>of</strong>borehole lithology data reveals that the depth to the basementtopography ranges from 20 m to more than 75 m belowground level in site C.Meteorological ConditionsThe study area experiences a cold winter with aminimum temperature <strong>of</strong> -9 °C and moderate summers witha maximum temperature <strong>of</strong> 35 °C. Average annual rainfallin this region is about 350 mm. The entire catchment comesunder the influence <strong>of</strong> Mediterranean front, and the major part<strong>of</strong> the precipitation is received between February (Bahman)and March (Farwarding). Demartin type <strong>of</strong> classificationshows that the climate is semi-arid.Physiographic SettingPhysiography here is concerned with the evaluation <strong>of</strong>topography, soil, vegetation, land use and stream networkwhich are principal factors in hydrological processes. Thearea has well-defined physiographic features.(1) The Lesser AlwandThe Lesser Alwand ranges from 2500 to 3000m inheight. It has deeply dissected valleys which suggest thatrivers are still actively at work. This belt can be furtherdivided in to two regions:(i) High batholithic mountains have been demarcated <strong>by</strong>the 3000 m contour. These consist <strong>of</strong> small snow-cappedmountains. The Qareh Aqach, Bahadour Big, Saleh Abad,Soulan, Abas Abad, Dareh Morad Big and Yalfan whichare sub catchments with asymmetrical slopes <strong>for</strong>mingcharacteristic features <strong>of</strong> the region. The tributaries <strong>of</strong> thesecatchments are U-shaped valleys with moraines and aresmooth with aggradational slopes.Fracturing is caused <strong>by</strong> the tectonic and intrusive activityin country rocks and the debris from landslides accumulatesat the base <strong>of</strong> escarpments.(ii) Low to moderately high mountains occur in the64Figure 1: Index map <strong>of</strong> the study area.Geological Society <strong>of</strong> Malaysia, Bulletin 54, November 2008
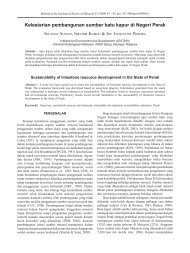
Si t e s e l e c t i o n f o r <strong>artificial</strong> r e c h a r g i n g o f g r o u n d wat e r b y a p p l i c at i o n o f g e o e l e c t r i c a l m e t h o daltitudes <strong>of</strong> 1000 m and 2000 m above MSL. The massivemountainous tracts are underlain <strong>by</strong> metamorphic <strong>for</strong>mationswith series <strong>of</strong> ridges and spurs dividing river valleys. Theslopes vary from 25 to 30 percent. The rivers and theirtributaries <strong>for</strong>m entrenched valleys at the higher reaches.The rivers <strong>for</strong>m depositional terraces at a number <strong>of</strong> placesand cause head-water erosion. The Harun Abad hills are<strong>for</strong>med as a result <strong>of</strong> intense dissection <strong>by</strong> fine-texturedpattern drainage lines. They <strong>for</strong>m long prominent ridgestrending NW-SE with altitudes above 1500 m. The riveris drained <strong>by</strong> numerous parallel to sub parallel streamsflowing southwards.(2) Depositional FeaturesThese are alluvial plain, point bars and flood plains. Thealluvial plain occurs in the central part, and are composed<strong>of</strong> sands admixed with other materials. Point bars havebeen observed at a few places but are not large and theserepresent gradational features, though their <strong>groundwater</strong>potential is likely to be moderately good.(3) Drainage Pattern and RiversThe drainage patterns are dendritic in character. Inabnormal season the rivers have less run<strong>of</strong>f and in the dryperiod these rivers becomes non-entities with no waterflow.GeologyThe area lies in between the tectonic zones <strong>of</strong> Alborz andSanandaj-Sirjan, and is considered to be a tectonically activearea. Intrusive (granites, granodiorites, diorites, gabbro),metamorphic (marble, schist, astrolite, andulusites) andsedimentary sequences (limestone, marl, shale, sandstone,dolomites) and volcanic rocks such as basalt, tuff areexposed in the area.The area has been mapped on 1:250000 scale <strong>by</strong> theGeological Survey <strong>of</strong> Iran and the geology described <strong>by</strong>Braud (1970) and Boulourchi (1979). The following briefdescription <strong>of</strong> geology is intended to bring out only features<strong>of</strong> hydrogeological aspects. The reader is referred to theoriginal references <strong>for</strong> more detail if needed. The geology<strong>of</strong> the area is shown in Figure 2. Table 1 represents thestratigraphical succession and gives broad descriptions <strong>of</strong>each <strong>for</strong>mation.Groundwater Occurrence andConditionsThe occurrence <strong>of</strong> <strong>groundwater</strong> in the area iscontrolled <strong>by</strong> diverse geological factors e.g. structures andgeological sequences and stratigraphical disturbances <strong>of</strong>hydrogeological units. The occurrence <strong>of</strong> <strong>groundwater</strong> inthe area can be studied in two parts.Table 1: Stratigraphic succession.AgeFormationsQuaternaryRecent alluviumYounger gravel fansOlder terraces and fansOligo-MioceneLimestone, marl, marly limestone,conglomerateCretaceousShale with intercalation <strong>of</strong> limestone,sandstone dolomiticJurassicWhite limestone, partly crystallized andinterceded with slate, shale slate and shcistPre-Jurassic Metamorphosed shale, calcareous sandstone.Figure 2: Geological map <strong>of</strong> the study area.Geological Society <strong>of</strong> Malaysia, Bulletin 54, November 200865
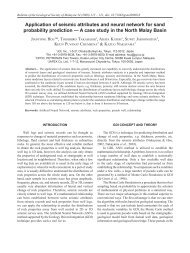
A.Ta h e r i Ti z r o(i) The north east, eastern and south east parts where thickalluvial <strong>for</strong>mations constitute the aquifer-aquiclude systems.Alluvial deposits, comprising silt, sand and gravel, occuralong the major river tributaries and include good aquiferhorizons.Lithological data from the exploratory wells show thatthe thickness <strong>of</strong> aquifer increases in the central part <strong>of</strong> thebasin and reaches up to 110 m, whereas in the peripheryit is 40 m only.The point bars, which consist <strong>of</strong> unconsolidatedsediments <strong>of</strong> coarse to medium grain size, appear to <strong>for</strong>m<strong>groundwater</strong> storage, but due to small size <strong>of</strong> river and itsephemeral nature, the <strong>groundwater</strong> potential <strong>of</strong> point barsare limited.The erosional valleys, located in the eastern parts appearto possess good <strong>groundwater</strong> potential. The geological andhydrogeological studies have revealed the existence <strong>of</strong>deeper aquifer zone in the confined state as it is overlain <strong>by</strong>impermeable beds <strong>of</strong> considerable thickness in the easternpart <strong>of</strong> Bahar Basin. Limited numbers <strong>of</strong> deep bored wellshave been drilled in the area. So existence <strong>of</strong> deeper zonein the confined state can be studied on the logs geoelectricaldata and few available lithologs.(ii) The south- western parts, where the weathered andfractured rock <strong>for</strong>mations occur are likely to <strong>for</strong>m aquifers.The occurrence and also movement <strong>of</strong> <strong>groundwater</strong>are controlled <strong>by</strong> the nature, depth and intensity <strong>of</strong>weathering.A gently sloping horizontal well, known as Qanat,was dug through alluvial materials to lead water <strong>by</strong> gravityflow from beneath the water table at higher elevation tothe ground surface outlets. Vertical shafts dug at closelyspaced intervals provide access to the tunnel. The verticalcollapsed wells persist to the present day and can be seenin the band across Lalejin regions. The collapse <strong>of</strong> Qanatwells was due to overdraft conditions in the region.There are 2169 deep wells discharging 314 MCM <strong>of</strong><strong>groundwater</strong> annually. The value <strong>of</strong> transmissivity is <strong>of</strong> theorder 200 to 250 m 2 /day in the periphery, and up to 900m 2 /day in central part <strong>of</strong> the basin.The study <strong>of</strong> water level data <strong>of</strong> wells <strong>of</strong>fers a usefultechnique <strong>for</strong> evaluating the subsurface geohydrologicalregimes. Different workers like Davis & DeWiest (1966),Freeze & Cheery (1987), Fetter (1988), and Karnath (1994)have dealt in detail about the methods <strong>of</strong> analyzing thewater level data <strong>of</strong> wells tapping unconfined and artesianaquifers. From the depth to water table maps (DTW) <strong>of</strong>area it is inferred that, the depth to water table (Figure 3)is highly variable being shallow in the western part andgreater than 50 m below ground level in the north and 36below ground level in the south east.The movement <strong>of</strong> <strong>groundwater</strong> is from recharge area<strong>of</strong> upper hills towards central part <strong>of</strong> the basin ultimatelydischarges into the Qareh Chay River.The unit hydrograph analysis <strong>of</strong> observation wellstations during the years 1981-2003 shows that there isaverage decline <strong>of</strong> about 20 m in the static water level in66region. Figure 4 shows a selected hydrograph <strong>of</strong> the BaharBasin. The quality <strong>of</strong> <strong>groundwater</strong> has also deterioratedand this can be alarming. These issues call <strong>for</strong> betterwater resources management including augmentation <strong>of</strong><strong>groundwater</strong> through <strong>artificial</strong> recharge measures. Forpurpose <strong>of</strong> increasing the potential <strong>of</strong> <strong>groundwater</strong> supplyin the area recharge well method can be very useful in thenorthern part as this area experiences highest decline in<strong>groundwater</strong> level. Selected site <strong>for</strong> <strong>artificial</strong> recharge isshown in Figure 2.Studies based on available lithological data reveals thatthe thickness <strong>of</strong> the aquifer increases from the peripheryto the central parts i.e. Bahar and Lalejin and it reachesup to 110 m.The available lithologs have failed to provide a synopticpicture <strong>of</strong> the subsurface features especially in the central part<strong>of</strong> the area. Accordingly, attempts are made to decipher thesubsurface picture from the interpretation <strong>of</strong> the generatedgeoelectrical data.Geoelectrical Measurements andInterpretationMeasurementsVertical electrical soundings (VES) were conductedwith Schlumberger Configuration at three sites (Figure 1).The advantages <strong>of</strong> the Schlumberger method (Bhattacharya& Patra, 1968; Keller & Friscknechdt, 1966; Zohdy et al.,1974), particularly the interpretation techniques available,made it the choice <strong>for</strong> this study. The maximum currentelectrode spacing was kept between 400 m and 500 m. Theapparent resistivity data <strong>for</strong> different values <strong>of</strong> AB/2 havebeen processed and sounding data <strong>for</strong> 55 VES locationswere obtained. A selected VES field curve is presented inFigure 5.InterpretationThe main purpose <strong>of</strong> interpretation <strong>of</strong> resistivitydata is to determine the true resistivities and thickness <strong>of</strong>different layers purely on theoretical considerations. Theseresults were subsequently used to obtain realistic picture<strong>of</strong> the geological framework. There<strong>for</strong>e quantitative andgeologic methods have been applied in the interpretation.The quantitative method is classified as indirect, and direct.Koefoed (1979) has described the techniques used in theindirect interpretation. A comprehensive account <strong>of</strong> variousapproaches <strong>of</strong> automatic interpretation <strong>of</strong> resistivity data hasbeen given <strong>by</strong> (Zohdy et al., 1974: Zohdy, 1989; Sriniwas& Singhal, 1983).The fast iterative method <strong>for</strong> automatic interpretation<strong>of</strong> sounding data (Zohdy, 1989) produces the interpreteddepths and resistivities respectively and does not require anyinitial guess <strong>of</strong> the number <strong>of</strong> layers and their thickness. Thenumber <strong>of</strong> layers in the interpreted model equals the number<strong>of</strong> digitized points <strong>of</strong> the sounding curve. This method hasbeen utilized <strong>for</strong> the quantitative interpretation <strong>of</strong> VES dataand the true resistivity values and the corresponding layerGeological Society <strong>of</strong> Malaysia, Bulletin 54, November 2008
Si t e s e l e c t i o n f o r <strong>artificial</strong> r e c h a r g i n g o f g r o u n d wat e r b y a p p l i c at i o n o f g e o e l e c t r i c a l m e t h o dTable 2: Result <strong>of</strong> interpretation <strong>of</strong> VES data.Top Soil Unsaturated Zone Aquifer BedrockVESResistivity Thickness Resistivity Thickness Resistivity Thickness Resistivity ThicknessNo(ohm-m) (m) (ohm-m) (m) (ohm-m) (m) (ohm-m) (m)<strong>Site</strong>A1 12 2 35-100 28 20-24 20 72 -A2 15 2 40 25 25 22 >80 -A3 12 1.5 30 28 30 28 >100 -A4 10 1.8 28 30 28 30 >120 -A5 11 1.5 30 28 25 28 >100 -A6 12 1.5 28 25 31 30 >80 -A7 10 2 25 32 22 32 >100 -A8 10 2 22 30 13-40 65 >60 -A9 10 1.5 20 31 44 60 >80 -A10 11 2 30 28 20-25 65 >100 -A11 55 2 46 28 40 60 >70 -A12 50 2 52 25 39 60 >65 -A13 65 1.8 43 24 33 62 100 -A14 70 2 50 25 40 61 55 -B1 105 2.8 120-260 38 130 40 214 -B2 118 2.5 206-400 40 88 38 230 -B3 200 3 >200 35 55-80 35 513 FractureB4 >300 2 267-300 35 127 30 378 -B5 116 2 415 30 98 40 459 -B6 200 2 158 35 40-60 40 496 FractureB7 103 1.5 >130 32 89 41 >300 -B8 110 2 100 31 100 40 250 -B9 200 2 >100 30 120 41 300 -B10 150 2 210 30 130 40 350 -B11 120 2 200 31 110 40 358 -C1 40-50 1.5 70-80 40 50 35 35-100 FractureC2 40-55 2 70 40 60 30 168 -C3 67 2 >20 55 55 25 110 -C4 60 2 90 50 19 20 >100 -C5 70 1.8 95 45 70 30 >150 -C6 40 2 100 40 90 31 100 -C7 75 2 >50 35 28 30 150 -C8 77 2 80 30 >50 35 >80 -C9 77 3 80 32 70 30 >90 -C10 60 2 >100 31 80 31 >90 -C11 37 2 135 30 80 31 32 FractureGeological Society <strong>of</strong> Malaysia, Bulletin 54, November 2008Figure 3: Depth to water table contour map(post monsoon in 2003).67
A.Ta h e r i Ti z r oFigure 4: Unit hydrograph <strong>of</strong> Bahar well station.Figure 5: Selected field curve (B-6).Figure 6: Schematic geoelectricalsections <strong>of</strong> selected sites.thickness interpreted are given in Table 2.The data has been carefully compared with the lithologs<strong>of</strong> boreholes located in the vicinity <strong>of</strong> the correspondingsounding <strong>for</strong> sites A, B and C. The general distribution <strong>of</strong>resistivity response <strong>of</strong> the <strong>for</strong>mations is obtained from thesesoundings. Table 2 illustrates the range <strong>of</strong> resistivities <strong>for</strong>different geological <strong>for</strong>mations. It is observed that resistivity<strong>for</strong> sandy horizon varies from 35 to 100 ohm-m whereas<strong>for</strong> predominantly clay zones, it ranges from low to highresistivity. The rock <strong>for</strong>mations exhibit a wider range <strong>of</strong>resistivity i.e.150 to 400 ohm-m respectively. The lowvalues <strong>of</strong> resistivity <strong>for</strong> these <strong>for</strong>mations imply their friableand weathered nature.Geoelectrical sections prepared from the interpretedVES data are shown in Figure 6. From this figure it can beconcluded that the site A1 can be considered as a favorablesite <strong>for</strong> <strong>artificial</strong> recharge, as the area possessing alluvial<strong>for</strong>mation, whereas at sites B6 and C1, the subsurfacelayers are characterized with the compact zones at top andweathered nature <strong>of</strong> hard rock <strong>for</strong>mations can be favorablesites <strong>for</strong> recharge. To ascertain the geological framework thegeneral distribution <strong>of</strong> resistivity response <strong>of</strong> the <strong>for</strong>mationhas obtained and a geoelectrical section along AB line havebeen prepared (Figure 7) to study variation in lithology in68north to southern direction. The location <strong>of</strong> the section andposition <strong>of</strong> respective sounding points are shown in Figure2. The thickness <strong>of</strong> the alluvial burden increases in centralparts <strong>of</strong> the basin.CONCLUSIONThe unit hydrograph analysis <strong>of</strong> observation wellstations during the years 1981-2003 shows that there isaverage decline <strong>of</strong> about 20 m in the static water levels inregion. The quality <strong>of</strong> <strong>groundwater</strong> has deteriorated and thiscan be alarming. These issues call <strong>for</strong> better water resourcemanagement including augmentation <strong>of</strong> <strong>groundwater</strong> through<strong>artificial</strong> recharge measures. The feasibility <strong>of</strong> rechargedepends on availability <strong>of</strong> hydrogeologically suitable sites.Nature <strong>of</strong> subsurface layers and their characteristics can beidentified <strong>by</strong> the <strong>application</strong> <strong>of</strong> geoelectrical method.REFERENCESBraud. J., 1970. Les <strong>for</strong>mations du Zagros dans la region deKermanshah, Iran. Bull. Soc. Geol. France (7), xiii, (3-4),416-419.Boulourchi, M.H., 1979. Explanatory text <strong>of</strong> Kabudar AhangQuadrangle Map. Geological and Mineral Survey <strong>of</strong> Iran.Bhattacharya, R. & Patra, H. P., 1968. Direct Current Geoelectricsounding. Elsevier, Amsterdam.Geological Society <strong>of</strong> Malaysia, Bulletin 54, November 2008
Si t e s e l e c t i o n f o r <strong>artificial</strong> r e c h a r g i n g o f g r o u n d wat e r b y a p p l i c at i o n o f g e o e l e c t r i c a l m e t h o dFigure 7: Comparison <strong>of</strong> boreholes lithologs and geoelectrical sections.Davis, S.N. & DeWeist, R.J.M., 1966. Hydrogeology. John Wiley& Sons Inc., New York, 463 p.Fetter, C.W.,1988. Applied Hydrogeology. Merril Publication,592 p.Freeze, R.A. & Cheery, J.A.,1987. Groundwater. Prentice Hall,London, 524 p.Griffith, D.H. & King, R.F., 1965. Applied Geophysics <strong>for</strong> Engineersand Geologists. Paragon press, London, 223 p.Healy, R.W. & Cook, P.G., 2002. Using <strong>groundwater</strong> levels toestimate recharge. Hydrogeology J. 10(2), 91-109.Karnath, K. R. 1994. Hydrogeology, Tata Mc Graw-Hill, 458 p.Keller, G.V. & Friscknechdt, F.C. 1966. Electrical method ingeophysical Prospecting. Pergamon Press, Ox<strong>for</strong>d, 517 p.Koefoed, O., 1979. Geosounding principles <strong>of</strong> resistivity soundingmeasurements.Mazac, O., Kelly, W.E. and Landa, I., 1985. A hydrogeophysicalmodel <strong>for</strong> relations between electrical and hydraulic properties<strong>of</strong> aquifers. J. Hydrol. 79, 1–19.Naik, K. P. & Awasthi, A.K., 2003. Groundwater resourse assessments<strong>of</strong> the Koyna basin. India Hydrogelogy J., 11, 582-594.Sriniwas & Singhal, 1983. Aquifer transmissivity <strong>of</strong> porous mediafrom resistivity data. J. Hydrology, 82, 143-153.Tizro Taheri, A. 2002. Hydrogeological investigations <strong>by</strong> surfacegeoelctrical method in hard rock <strong>for</strong>mation— A case study.Bulletin <strong>of</strong> the Geological Society <strong>of</strong> Malaysia, 45, 37-41.Tizro Taheri & Singhal 1993. Geoelectrical studies in Narnaul area<strong>for</strong> estimating transmissivity in alluvial aquifers. NationalSeminar on Hydrology, Roorkee. India.Zohdy, A.A.R., Eaton, G.P., Mabey, D.R., 1974. Application<strong>of</strong> surface geophysics to <strong>groundwater</strong> investigations.U.S. Geological Survey Techniques <strong>of</strong> Water-ResourcesInvestigations, 116 p.Zohdy, A.A.R. 1989. A new method <strong>for</strong> automatic interpretation<strong>of</strong> Schlumberger and Wenner sounding curves. Geophysics,5(2), 245-253.Manuscript received 13 December 2004Revised manuscript received 15 August 2007Geological Society <strong>of</strong> Malaysia, Bulletin 54, November 200869