Page 043-77 Papers01-12 rearrange.pdf - Department Of Geology
Page 043-77 Papers01-12 rearrange.pdf - Department Of Geology
Page 043-77 Papers01-12 rearrange.pdf - Department Of Geology

You also want an ePaper? Increase the reach of your titles
YUMPU automatically turns print PDFs into web optimized ePapers that Google loves.
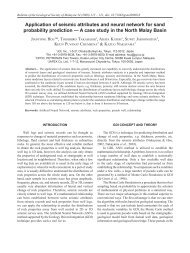
Petroleum <strong>Geology</strong> Conference and Exhibition 200627-28 th November, 2006 Kuala Lumpur Convention Center, Kuala Lumpur, MalaysiaTECHNICAL KEYNOTE PAPER 1MALAY BASIN PETROLEUM SYSTEMS AND SEQUENCE-STRATIGRAPHYA UNIFIED GEOLOGICAL THEORY OF EVERYTHING?Dr Peter M. BarberDirector, Isis Petroleum Consultants, Perth, Western AustraliaTel: +61 8 9226 4610 Fax: +61 8 9226 4610Email: pbarber@isispetroleum.com.auAfter Albert Einstein’s discovery of The Theory of Relativity in 1915, the following 40 years of hislife were devoted to formulating a Theory <strong>Of</strong> Everything (TOE theory). His contemporaries researchedQuantum Theory, dealing with, among other things, mathematical expressions of probabilities and theexistence of parallel universes. Einstein’s famous response was “God does not play with dice!” He died stillsearching for the answer!As we move through this early 21 st century, a peak oil crunch looms. And are we still playing dice inthe way we look for oil and gas? Do we continue to take unnecessary risks with our exploration dollars? Canwe hedge our bets using some kind of unified Geological Theory of Everything to find additional resources in‘supposedly’ mature hydrocarbon provinces such as the Malay Basin?One possible way, albeit subjective, is to combine mother nature and math – like using logarithmicdice. The method is to combine a deterministic fractal log distribution of ranked hydrocarbon field sizes withan integrated petroleum system analysis using seismic-sequence stratigraphic tools. This powerful methodenables the geoscientist to figure out if large hydrocarbon discoveries remain to be discovered. It locatesbasins or hydrocarbon fairway trends with remaining or yet-to-find (YTF) resources and quantifies thoseresources within any trend.With this objective in mind, Petronas Petroleum Management Unit (PMU) and several PSC studygroup partners recently commissioned PRSS to undertake a multidisciplinary regional study to identify newplay types in the Malay Basin. This involved a sequence-stratigraphic analysis in conjunction with 3D burialhistory modeling, augmented by new biostratigraphic well calibrations, CO2 distribution studies, cap-rockintegrity and section restoration work. The results of this study are exciting and in part are summarized in thiskeynote address – and prove the Malay Basin is by no means a mature hydrocarbon province.Since the study is regional in nature and scope, we will be indicating in general terms where we mightlook for more oil and gas in the Malay Basin – the sweet spots, and suggest play types with potential YTFresources. The field sizes distributions from actual and implied fractal distributions are surprising. Basicallythis method gives the PSC operators a reserve target to hunt or identify.Integrated burial history modeling in conjunction with regional seismic-sequence stratigraphicmapping of reservoir facies has identified that sweet spots for YTF liquid hydrocarbons will tend to befocused along the peripheral margins of the basin. Traps occur in a variety of plays ranging from lacustrineturbidites, incised valley fills, canyon deposits, synrift subcrops, fractured Pre-Tertiary basement andcarbonate plays. Basin centered hydrocarbons or basin centered gas (BCG) plays will tend to be the mainYTF hydrocarbon type in the basin depocentre and, as proven in many basins world wide, can be expected toextend onto the basin flanks – or the external ‘steer head’ portion of the basin margin.The size and number of YTF fields within these plays in the Malay Basin could be significant, basedupon fractal and creaming curve analysis, augmented by the sequence stratigraphy that has been applied.Estimates for HCIIP and YTF resource will be presented during the Address. The exact size of the HCIIP isopen to conjecture being that it is dependent within the mathematically-constrained geometric shape of thedistribution curve, especially when calibrated to existing field sizes.43 Geological Society of Malaysia
SESSION 1TECHNICAL KEYNOTE PAPER 1As Niels Bohr, the Quantum Physicist, once said "It is very difficult to make an accurate prediction,especially about the future." In our business it is the same. Predicting YTF resources and where to find themis a challenge; and the challenge is met by the crystal ball of sequence-stratigraphy. If used correctly,sequence analysis in a stratigraphic context has, and can in the Malay Basin, prove up where fractaldistribution YTF resources will be located. So throw your dice away.It is pleasure to present this Keynote Address to you. And I hope the contents have suggested someideas which will help you to discover large reserves.November, 2006 44
Petroleum <strong>Geology</strong> Conference and Exhibition 200627-28 th November, 2006 Kuala Lumpur Convention Center, Kuala Lumpur, MalaysiaPAPER 1ILLUMINATION OF VIETNAM BASEMENTFRACTURES FROM 3D SEISMIC – A METHODOLOGYVincent W.T. Kong 1 , Dr Nguyen Huy Ngoc 2 ,Jimmy C.S. Ting 3 and Amri b. Amdan 31 Petronas Carigali Sdn. Bhd.2 Petronas Carigali Vietnam3 Fugro-JasonConventional 3D seismic attributes have been used to try identify faults and lineaments within graniteor metamorphic basements. However, normal full stack seismic reflectivity has inherent noise and tuningeffects contamination that complicates the visualization of subtle lineaments, faults and fractures.Empirically we found the acoustic impedance data derived from the far angle 3D seismic sub-stackwas better than full stack seismic reflectivity to image the top basement reflection and better focus faults andimage fractures. These localized areas of estimated higher fracture density are seen to be consistent with theinterpretation of expected denser fracture areas from the convergence of the larger faults.The far angle seismic acoustic impedance data was processed through the dip and azimuth routine toenhance imaging fracture clusters and fracture trends. The illumination of such sets of fractures, faults andlineaments is facilitated by the use of selective color palette.These first results formed part of the input to new well trajectory design to encounter the basementfaults and fractures optimally. The new wells’ FMI analyses confirmed the fracture azimuth sets as predicted.45 Geological Society of Malaysia
SESSION 1PAPER 2THE ANALYSIS OF CONTROLLED SOURCEELECTROMAGNETIC DATA FORPROSPECT EVALUATION IN BLOCK E, SARAWAK, MALAYSIAJonny Guddingsmo, Peter Van der Sman, John Voon,Matthew Choo and Kok, Yip-CheongSarawak Shell Bhd.The controlled source electromagnetic method is increasingly used in petroleum exploration.However, interpretation and integration of CSEM data in the context of prospect evaluation is still quite achallenge.SSB recently acquired several 2D and 3D CSEM surveys in the E-block with state-of-the-artequipments. The survey covered an area of 2250 sq km by dropping 331 receivers and acquiring 582km of2D, 364km of 3D and 635km of reconnaissance survey. The program is a compilation of operations and R&Dinitiatives and targeted 10 prospects with up to three 2D lines and a single prospect with a dense grid of 2Dlines complemented by a reconnaissance survey covering the entire survey area. Although all acquisition wasexecuted in 2D, actual survey design was such that next to MT, also 3D CSEM data was collected. However,processing and interpretation of those data is the subject of a separate R&D effort and will not be discussedhere. The subject of this paper centers on the conventional 2D CSEM data, their processing, interpretation androle in the context of prospect evaluation.Tying a CSEM response to a specific target is often confused by bathymetry and near-surface geologylike gas-hydrates. The E-block survey is no exception. A methodology will be presented to make an inventoryof these risks and how to significantly improve the confidence in the data by exploiting this knowledge infurther processing and interpretation.A different, often ignored complication to the CSEM method are regional variations and trends thatgo undetected by a conventional, localized surveys and that may result in and misleading interpretations. Wehope to demonstrate that by using the regional survey, trends and statistics the overall reliability of CSEM forprospect evaluation will further improve.November, 2006 46
Petroleum <strong>Geology</strong> Conference and Exhibition 200627-28 th November, 2006 Kuala Lumpur Convention Center, Kuala Lumpur, MalaysiaPAPER 3A NEW 3D SEISMIC STRATIGRAPHIC METHODOLOGYAPPLIED TO TURBIDITECHANNEL SYSTEMSPierre Le Guern 1,2 , Bérengère Savary 1 , Hilde Grude Borgos 1 , Geir Vaaland Dahl 1 , ErikMonsen 1 , Lars Sonneland 1 , Andreia Regina Dias Elias 3 , José Fernando Rosalba 31Schlumberger Stavanger Research, Risabergveien 3,Tananger, P.O.Box 8013, 4068 Stavanger, Norway2 pguern@stavanger.oilfield.slb.com3 PetrobrasSummarySeismic stratigraphic interpretation is a powerful method for analyzing the depositional history of thesubsurface. However, the lack of support of such interpretation methods in the state-of-the-art tools limits itsapplication. A novel technology allowing a highly automated procedure for seismic stratigraphic interpretationis presented (figure 1). The technology includes an automated high resolution extraction step of all thestratigraphic primitives prior to the interactive session. The technology supports a “dual domain” concept thatenables to interpret transparently in the seismic domain and the chronostratigraphic time domain. Theinterpreter controls this mapping by selecting the appropriate set of stratigraphic primitives to define thistransformation.The high resolution extraction step, referred to as extrema classification in figure 1, is based onFigure 1: The flow-chart of the new seismic stratigraphic interpretation methodology.47 Geological Society of Malaysia
SESSION 1PAPER 3Borgos et al., 2005. The output from this classification results in extrema patches (figure 1) from which thestratigraphic primitives might be defined. The method can be extended to active tectonic basins by includingfault patches in the mapping between the seismic domain and the chronostratigraphic time domain (Pedersonet. al, 2005). Figure 1 illustrates how faults supplement extrema patches to define the geological model. Incomplex geological settings, as e.g. stacked turbidite channel systems, the application of seismic stratigraphicinterpretation might reveal a better understanding of the depositional settings. To demonstrate the potential ofthe new methodology we have applied it to a case from offshore Brazil. The four extracted stratigraphicsurfaces are built from merged extrema patches. The obtained stratigraphic primitives refine the geologicalmodel and allow accurately placing the compartment boundaries and identifying presence of hydrocarbons(figure 2).AcknowlegmentsThe authors wish to thank Petrobras for having provided the data, for the collaboration and thepermission to publish these results. Figure 2: Surface of an extracted horizon (A) and corresponding attributemaps (B). Classification results displayed on C underline geological features, reservoir boundaries andhydrocarbons. Bullet numbers correspond to (1) erosive channels, (2) erosive base of a lobe, (3) depositionalfeatures, (4) hemipelagic deposits, and (5) presence of high amplitude anomalies.ReferencesBorgos, H. G., Skov, T., and Sonneland, L. 2005,Automated Structural InterpretationThrough Classification of SeismicHorizons, in Mathematical Methods andModelling in Hydrocarbon Explorationand Production (Armin Iske, TrygveRanden Eds), Mathematics in Industry 7,Springer- Verlag, Germany, 2005, p 89-106.Pedersen S. I., Randen T., Sønneland, L., andSteen, O., 2005, Automatic FaultExtraction Using Artificial Ants. Societyof Exploration Geophysicists 72thAnnual Meeting, Salt Lake City (Utah).Figure 2: Surface of an extracted horizon(A) and corresponding attribute maps (B).Classification results displayed on Cunderline geological features, reservoirboundaries and hydrocarbons. Bulletnumbers correspond to (1) erosivechannels, (2) erosive base of a lobe, (3)depositional features, (4) hemipelagicdeposits, and (5) presence of highamplitude anomalies.November, 2006 48
Petroleum <strong>Geology</strong> Conference and Exhibition 200627-28 th November, 2006 Kuala Lumpur Convention Center, Kuala Lumpur, MalaysiaPAPER 4IMPROVING SUBMARINE FAN AND CHANNELINTERPRETATION USING 3D SEISMIC MEGASURVEYSShane Westlake, Senior Geophysicist 11PGS Marine GeophysicalThis paper demonstrates why a recent innovation using 3D seismic surveys is an exceptional tool fordefining regional frameworks and play models. Traditionally, regional studies are based on 2D seismicinterpretation and geological mapping, with subsequent input from prospect level 3D seismic data. However,improvements in hardware and software, together with technical advancements, now allow merging ofcontiguous 3D seismic datasets into one seamless MegaSurvey volume that may encompass an entire basin.Such coverage provides a consistent regional framework and perspective for detailed studies. It also providesa basis for high-grading plays and enables detailed assessment of critical elements within a petroleum system(e.g. fans and channels).The PGS North Sea MegaSurvey, currently covers over 100,000 sq km. This coverage has enabledPaleocene fans to be fully imaged using seismic-volume attributes, which produced new play fairwayconcepts and increased regional understanding, thus rejuvenating interest in a mature basin. Similar megafeatureswere identified in the PGS Dampier Sub-Basin MegaSurvey in Australia and the Campos BasinMegaSurvey in Brazil.In the Dampier Sub-Basin, feeder channels to the ~50 km long Angel fan system traversed the LambertShelf, along the Rosemary Fault Zone, and deposited sediments into the Lewis Trough during the Tithonian.Late Jurassic movement of the Rosemary Fault Zone had an impact on the depositional history of this fansystem and hence on the critical elements of the associated petroleum system.In the Campos Basin, the Tertiary channel is ~100 km long. It lies adjacent to the producing fields ofthe Marlim complex. The MegaSurvey allows mega-channel and salt-induced structures to be interpreted witha high degree of confidence, thus reducing exploration risks in an ultra-deep water setting.These examples clearly illustrate the value of the “big picture” to explorationists and illustrate howMegaSurveys can provide an invaluable tool in stimulating activity in basins around the world.49 Geological Society of Malaysia
SESSION 2TECHNICAL KEYNOTE PAPER 2FORMULA FOR SUCCESS: THE ROLE OF NEW INFORMATIONIN CREATING ASSET VALUEStephen PickeringWesternGecoA challenge that faces all asset managers is when and how much to invest in new information (e.g.,seismic or well log data) to gain a more detailed image or knowledge of their reservoir. In Malaysia this canbe a particularly vexing question in late field life when revenues are declining and there is a need to boostproduction through further infill drilling. Yet it is precisely in this situation, where there is great uncertainlyabout whether to drill and where to drill, that more detailed knowledge of the reservoir can contribute the mostvalue. Similarly, improvements in reservoir characterization and imaging can significantly contribute to thesuccess of deepwater dev elopments where template slots are sparse and productivity of each developmentwell directly impacts the field’s return on investment (ROI).<strong>Of</strong>ten, better measurements are provided through technology innovation. The seismic industry has aproven track record in continuously innovating new technologies, such as single–sensor seismic recording(e.g. Q-Marine ♦ technology) for repeatable time-lapse seismic or new depth-imaging techniques. The benefitsof these technology developments are observed in the seismic data in the form of improved resolution of thinbeds, better imaging beneath salt and basalt horizons, and, in the case of time-lapse seismic, snapshots ofreservoir production, to name but a few examples.Some companies such as Petronas recognise the added-value impact of technology to its businesscompetitiveness and sustained growth. However the industry is generally viewed as being slower than otherindustries to adopted new technologies even though they bring the prospect of better reservoir understandingand better well placement. We can ask the question, why is this so?One reason may be culture; as an industry we are focused on risk mitigation and new technologies areperceived as risky. New technologies are trialled initially by innovators and early adopters, these people aregenerally visionaries and risk takers, however the majority will not adopt until the value of the technology isproven. The other reason and that which concerns this paper, is that the value information brings is inherentlydifficult to predict. How do we predict the value of information? Well first we must understand what drivesand influences information gathering.Drivers of information valueThere are three criteria that any information gathering opportunity must meet if it is to add value.1. Relevant. You must be uncertain about something that is important to your decision and the informationmust offer the possibility of learning about this uncertainty. For example, you may be uncertain about thepotential of a well location. If you are not uncertain then you already have prefect information and furtherinformation gathering is not worthwhile. If you are uncertain, then the information must offer the possibilityof changing your beliefs about the uncertainty. For example, the information might lead you to believe that awell location will be productive or unproductive. If this is the case, then the information is relevant.2. Material. Information only has value if it offers the potential to change decisions. How much would youpay for information that, no matter what that information said, you would take the same action? Zero! If theinformation has the potential to change decisions then it is material and it has value. For example, you mightbe facing a decision of drilling or not drilling a well in a particular location. If this decision is contingent uponinformation you could obtain, then the information is material.3. Economic. Even if the information is relevant and material, it still has to be a good investment. Forexample, new information that perfectly reveals reservoir properties is relevant and probably material,however, it is still possible that it is too costly.November, 2006 50
Petroleum <strong>Geology</strong> Conference and Exhibition 200627-28 th November, 2006 Kuala Lumpur Convention Center, Kuala Lumpur, MalaysiaTECHNICAL KEYNOTE PAPER 2What influences value?An influence diagram for a timelapseseismic survey is shown in Figure 1. Inthis model, the objective is to understand howtime-lapse seismic influences the ultimatevalue in a situation in which the seismicindicates whether the reservoir is swept bywater or unswept and contains hydrocarbons.The value is most obviously influenced bythe oil price and the volume of hydrocarbonsFigure 1recovered. The latter is influenced by anumber of factors including recovery factor, porosity, the gross rock volume of the reserve and fluid type--there being no value in finding water.The amount of recovered hydrocarbon is also influenced by the number of wells to be drilled and thisin turn by the drilling budget. If, for instance, there is a portfolio of <strong>12</strong> potential drilling targets but only onewell in the budget, then the entire value of the portfolio can not be realized should more than one targetcontain hydrocarbons.The drilling program is influenced by the availability of seismic data. For example, if a company isforced to drill blind without seismic information, it may choose not to drill any wells. Seismic data enables theidentification and characterization of drilling targets (either exploration or development wells). However, ifonly a sparse 2D seismic grid is available rather than a high resolution 3D survey, potential drilling objectivesmay be missed. Long offset data may identify hydrocarbons through AVO (amplitude variation with offset)and reduce the risk in drilling at a particular location. In addition, different time-lapse seismic acquisitiontechnologies may impact the clarity of the final image and hence the assessment of drilling risks (Figure 1).To summarize, the value of the information is dependent on:• the reservoir properties and is thus unique to each reservoir• the number of drilling opportunities identified and subsequently drilled• the quality (or type) of the seismic measurement that influences the seismicresponse, the decision to drill and, the ultimate valueDecision analysis and Bayes’ RuleSo the asset team is often faced with perplexing problems: should theydrill a well or not; or should they gather more information about the reservoirfrom seismic before dec iding? Many teams in this situation use a simpleprocess based on experience and single point estimates without knowing allthe facts – they gamble on success. But there is an alternate method knownas decision analysis.For any project a decision tree can be constructed to determinewhether or not to drill whether or not there is access to seismic information.Figure 2 represents a decision to drill a single well without the benefit ofseismic information. P(U) is the probability the reservoir is unswept. Thebest dr illing alternative can be determined by solving this tree, which yieldsthe Value without Seismic Information (VwoS). For example, if the bestalternative is to drill then VwoS = P(U) * V – C (Cost).If a seismic survey can be commissioned before drilling, then thedrilling decision can be tailored to the seismic results. This is captured inFigure 3. If the seismic test is material then the decision to drill is made ifthe survey reports unswept and not to drill otherwise. P(U|”U”) is theprobability the reservoir is unswept given the survey reports unswept and51 Geological Society of Malaysia
SESSION 2TECHNICAL KEYNOTE PAPER 2P(U|”S”) is the probability the reservoir is unswept given the survey reports swept. Solving this tree yields theValue with Seismic Information (VwS). The Value of Seismic Information (VoS) is equal to the value withseismic information less the value without seismic information, VoS = VwS - VwoS.So how is P(U|”U”) and P(U|”S”) determined? The answer can be obtained through the use of Bayes'Rule as shown below.PU ( ) P(" U"| U)PU ( |" U")=P( U) P(" U"| U) + P( S) P(" U"| S)PU ( ) P(" S"| U)PU ( |" S")=P( U) P(" S"| U) + P( S) P(" S"| S)A key input into Bayes’ Rule is the accuracy or reliability of the seismic information, which iscaptured in P(“U”|U) and P(“S”|S). That is, how likely the survey is to correctly predict the reservoir property.But how is seismic accuracy assessed? An assessment of technical performance to determine theprobability of seismic success using differing acquisition or processing techniques can be employed. Anotherapproach is to assess the ability of different seismic techniques to reduce uncertainty in predicting reservoirproperties given a particular seismic measurement in different geologic environments (Figure 4).The value of information for multiple drilling targetsSeldom is only a single well drilled following aseismic survey—especially a development 3D or a 4D timelapsesurvey. So a calculation for multiple drilling targets isneeded. The math for this is more complex than previouslyshown but the principles as described above for a singletarget are the same.Lets consider a notional development of a smalloilfield containing <strong>12</strong> identical targets, where theincremental Net Present Value (NPV) per successful well is$50 million, well costs $5 million and the prior probabilityof drilling success (without new information) is 75%. Whatwould be the value of a time-lapse survey using twodifferent technologies with accuracies of 70% and 75%,respectively?As shown in Figure 5, seismic information is worth more up to a point when more wells are drilled,then it begins to decline. Seismic does not have any value in this particular example when all <strong>12</strong> targets can bedrilled. Figure 5 also shows that slight changes in seismic accuracy can create significant value. For example,the VoS peaks in this case at approximately $35 million for an accuracy of 70%, when we can drill sevenwells. Increasing the accuracy of seismic to 75% increases its value by $10 million to $45 million.Figure 6 highlights the sensitivity of seismic valueNovember, 2006 52
Petroleum <strong>Geology</strong> Conference and Exhibition 200627-28 th November, 2006 Kuala Lumpur Convention Center, Kuala Lumpur, MalaysiaTECHNICAL KEYNOTE PAPER 2to its accuracy. In this case <strong>12</strong> targets and a well budget of six wells are considered. At an accuracy of 75%,VoS at $45 million is obtained. Perfect information (accuracy of 1) is worth about $85 million and, of course,seismic with an accuracy of 50% is worthless. Again, as can be seen in the graphic, small changes in accuracycan be very valuable. In fact, over the range considered here, every 1% increase in accuracy is worthapproximately $1.7 million.SummaryTo justify gathering new information, the information must have the potential to change a decisionyou would otherwise make. When faced with a budget constraint (e.g., capital, rigs, etc.) and uncertaintyregarding the success of individual wells, information (e.g. seismic data) can add significant value. The actualvalue added is dependent upon the particular reservoir economics and the quality of the seismicmeasurements. In most cases, better measurements add more value and even modest increases in accuracycould be worth millions of dollars. Decision analysis can be used to determine the value of seismicinformation before the survey is acquired.53 Geological Society of Malaysia
SESSION 2PAPER 53D SEISMIC IMAGING OF SOFT-SEDIMENTDEFORMATION FEATURES IN SEDIMENTARY BASINS,OFFSHORE NORWAY: IMPLICATIONS FOREXPLORATION AND PRODUCTIONChristopher A-L JacksonIntroductionLarge volumes of unconsolidated sedimentscan be remobilised by the migration of fluids throughsedimentary basins. The occurrence and distribution ofsoft-sediment deformation features in sedimentarybasins, therefore, can be used to help map theoccurrence and flow of basinal fluids. Based on theinterpretation and visualisation of 3D seismic data,two case studies of the scale, geometry anddistribution of soft-sediment deformation features arepresented from the post-rift succession of the northernNorth Sea basin (Fig. 1). Key seismic-stratigraphicfeatures and the relationships between them wereanalysed using various volume and grid-based seismicattributes. It is demonstrated that in both examplesnumerous phases of soft-sediment deformation haveoccurred which can be related to a series of fluid flowprocesses. The results of this study, although based onexamples from the North Sea, may have implicationsfor the exploration and production of deepwater slopesystems offshore NW Borneo.Geological SettingBoth case studies come from the mudstonedominatedpost-rift succession of the northern NorthSea basin (Fig. 1). Although the post-rift succession ismudstone-rich in both study areas, delivery ofsandstones to the slope and basinfloor did occur inthe Late Cretaceous and Middle Oligocene. Well dataindicates that a number of regionally significant keystratal surfaces (i.e. flooding surfaces, sequenceboundaries) are developed within the studiedsuccessions, which manifest on seismic data as<strong>Department</strong> of Earth Science & Engineering,Imperial CollegePrince Consort RoadLondon SW7 2BPEngland, UKemail: c.jackson@imperial.ac.ukFigure 1: Map showing the locations of thetwo case study areas in the Northern NorthSea, offshore Norway; (1) Lomre Terrace,and (2) Måløy Slope.regionally-mappable seismic reflections. These horizons provide the basis of the seismic-stratigraphicframework and the seismic attribute analysis.November, 2006 54
Petroleum <strong>Geology</strong> Conference and Exhibition 200627-28 th November, 2006 Kuala Lumpur Convention Center, Kuala Lumpur, MalaysiaPAPER 5DatasetsBoth case studies utilise 3D seismic datasets with an inline and crossline spacing of <strong>12</strong>.5 m. Neithersurveys have been depth converted, but by using velocity information from wells it is possible to convert alldepth and thickness measurements from two-way travel time to metres. Both surveys are zero-phase processedwith normal polarity. In both case studies the studied stratigraphic intervals are penetrated by explorationboreholes which are used in this study to establish (i) the age of the mapped seismic reflections, and (ii) theage and lithology of the mapped seismic packages.Case Study 1 - Upper Cretaceous, Måløy Terrace, offshore Norway3D seismic data from the Måløy Slope, offshore Norway indicates the development of a series of LateCretaceous-age deepwater slope systems. These features manifest on seismic data as amplitude anomalies, andtheir plan-view geometry can be determined using amplitude extraction techniques. Adjacent to the deepwaterslope system-related amplitude anomalies, steeply-dipping, high amplitude seismic reflections are observed(Fig. 2). These dip 10-20°, and cross-cut up to 90 m of the overlying stratigraphy. Mapping and visualisationof the amplitude anomalies in 3D indicates they form wing-like structures which flank the margins of thedeepwater slope systems (Fig. 2). The channel margin wings may also display more complex 3D geometries,branching both along-strike and/or up-section. Based on, (i) their relationship to sand-bearing submarine slopesystems, (ii) their complex 3D geometries, (iii) their cross-cutting relationship with encasing mudstonedominatedunits, and (iv) by analogy to similar features identified in the Tertiary of the UK Central North Sea(Huuse et al. 2003), the bedding discordant amplitude anomalies are interpreted as the seismic expression oflarge-scale clastic injections (dykes), sourced from the Upper Cretaceous deepwater slope systems (seeJackson, in press).Case Study 2 – Cretaceous-Tertiary, Lomre Terrace, Northern North SeaThe Upper Oligocene interval of the Lomre Terrace, Northern North Sea is characterised by low tomoderate amplitude, parallel seismic reflections. Locally, zones of variable amplitude, highly chaoticreflections are developed (Fig. 3). These zones have sharp, sub-vertical margins against the surroundingparallel reflections, and have mounded tops which result in the development of marked relief along overlyinghorizons. Immediately adjacent to the zones of chaotic reflections, the parallel reflections are locally highlydeformed exhibiting steep-dips and reverse faults that verge away from the chaotic reflection packages.Towards the bases of chaotic reflection packages, steeply-dipping, high-amplitude reflections are observedwhich have a conical shape in 3D (Fig. 3). Visualisation of the chaotic seismic units reveals they form a seriesof circular to ovate bodies, 4.2 x 10 9 - 7.2 x 10 10 m 3 in size. The chaotic reflection packages are locatedimmediately above features interpreted as fluid flow conduits or gas chimneys emanating from the underlyingUpper Jurassic basins (see full discussion by Jackson & Stoddart 2005). Based on, (i) their chaotic seismicexpression, (ii) mudstone-dominated lithology, and (iii) location above interpreted fluid flow conduits, thechaotic reflection packages are interpreted as the seismic expression of zones of mud which became mobilisedand highly deformed in response to gas and water migrating through the poorly consolidated, mudstonedominatedsuccession (Jackson & Stoddart 2005). Amplitude anomalies within the mobilised zones representthe seismic expression of clastic injections source from a thin, sandstone-rich horizon at the base of the UpperOligocene.Implications for exploration and production offshore NW Borneo(i) Clastic injection – This study indicates that the remobilisation and injection of deepwater slopesystems can markedly affect the primary depositional reservoir geometry and volumetrics, and changethe seismic-scale top-reservoir structure (see also review by Lonergan et al., 2000; Huuse et al. 2003).The results of this study, therefore, may have implications for the exploration and production ofdeepwater slope and basinfloor reservoirs offshore NW Borneo. Units such as these may be equally assusceptible to being remobilisation and injection as the example presented here from the NorthernNorth Sea, especially where deepwater systems are deposited and encased within thick mudstonedominatedunits.55 Geological Society of Malaysia
ReferencesSESSION 2PAPER 5(ii) Mud mobilisation – Mud mobilisation, if triggered by the focused migration of gaseous fluids, canhelp understanding the hydrocarbon plumbing system within sedimentary basins (Ligtenberg, 2003;Jackson & Stoddart, 2005). For example, zones of mobilised mud may lie above “leaking”hydrocarbon traps, therefore serving to increase the exploration “risk” of any particular mappedstructural trap. In addition, the identification of mobilised mud zones (and their associated gaschimneys) may help “derisk” the existence of mature petroleum source rocks in a sedimentary basin.These techniques may be valuable when assessing trap integrity offshore NW Borneo, where thickmudstone-dominated successions of the lower slope and basinfloor overly deepwater slope sandstonereservoirs.Huuse, M. et al., 2003. Sandstone intrusions: detection and significance for exploration and production. FirstBreak, 21: 33-42.Jackson, C. A. L., in press. The geometry, distribution and development of clastic injections in slope systems:seismic examples from the Upper Cretaceous Kyrre Formation, Måløy Slope, Norwegian Margin. Tobe published in AAPG Memoir on Clastic Injections.Jackson, C. A. L. & Stoddart, D. P., 2005. Temporal constraints on the growth and decay of large-scalemobilized mud masses and implications for fluid flow mapping in sedimentary basins. Terra Nova,17: 580-585.Ligtenberg, J.H, 2003. Unravelling the petroleum system by enhancing fluid migration paths in seismic datausing a neural network based pattern recognition technique. Geofluids, 3: 255-261.Lonergan, L., et al., 2000. Remobilisation and injection in deepwater depositional systems: implications forreservoir architecture and prediction, in P. Wiemer, et al (Eds.), Deep Water Reservoirs of the World.GCSSEPM Foundation 20 th Annual Conference: 515-532.November, 2006 56
Petroleum <strong>Geology</strong> Conference and Exhibition 200627-28 th November, 2006 Kuala Lumpur Convention Center, Kuala Lumpur, MalaysiaPAPER 5Figure 2: 3D visualisation illustrating theseismic expression and geometry of largescaleclastic injections at the margins of asubmarine slope channel, Upper Cretaceous,Måløy Slope, offshore Norway.Figure 3: 3D visualisation illustrating theseismic expression of mobilized mud zonesand associated clastic injections in the UpperOligocene of the Lomre Terrace, offshoreNorway.Figure 4: Conceptual diagrams illustrating the potential effect of clastic injection on (a) reservoirgeometry and (b) reservoir connectivity (taken from Lonergan et al. 2000). (c) Seismic expression ofa gas chimney (not associated with seismic-scale mud mobilization) above a leaking hydrocarbontrap, North Sea (taken from Ligtenberg, 2000).57 Geological Society of Malaysia
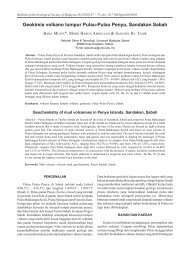
SESSION 2PAPER 6HYDROCARBON PROSPECTIVITY OFEAST CENTRAL LUCONIA CARBONATES, SARAWAKHamdan Mohamad, Nur Kartini Mansur * , W Zaizuri W EmbongPetroleum Management Unit, PETRONASKuala Lumpur, Malaysia* speakerSince the 1970’s, carbonate reservoirs were the main reservoir and contained the largest portion of thereserves in Central Luconia. During the third Petroleum Sharing Contract (PSC) round in 1995, less than 30%of the identified carbonate prospects had been drilled, and a similar situation remains today because ofperceived risks. But previous historical carbonate exploration risks in the reefs located in Central LuconiaCarbonates (CLC) have been challenged recently with new ideas proven successful with discoveries.Historically, the risks incorrectly downgraded the play, and can be summarized, viz.:i. Carbonate reef pinnacles were thought to be small and contain limited hydrocarbon reserves;ii. Most carbonates were over pressured and would have small gas columns;iii. Many reefs contained high CO 2 with significant H 2 S concentrations; andiv. Thief sands breached the reservoir seal and increased exploration risk.However, for the last few years several gas discoveries made, such as PC4, F2, F38, NC4 andKanowit fields (Figure 1), contradicts the above reasons for downgrading the carbonate plays. Specifically,the 2006 well, called PC4.1, discovered more than 640 meters of gas column which is the longest single gascolumn penetrated to date in east Malaysia (Figure 2). The well was drilled under normal pressure conditionsthus allowing a larger gas column (Figure 2). Also, low CO2 and minimal H2S contamination dispel previouscontamination risks. The crestal seal breach via a trangressive lag deposit, or sand thief, exists in shallowcarbonates areas in wells such as Tiong Mas-1, F39-1 (Tiong Gajah) and B16.1. This thief is present basinward, but marine ward reefs were drowned earlier with thicker shales, so their seal integrity has not breached.These findings are significant. Challenging previous conceived risks has allowed the CLC exploration play tobe high graded.In order to map the maximum gas column potential in the carbonates, future geological/geophysicalunderstanding needs to be enhanced regarding thief sand distribution patterns both aerially andstratigraphically, as well as overpressure distribution and hydrocarbon seal capacity. Future 3D seismic willhelp mitigate the latter uncertainties, delineate with more clarity the reef pinnacles as well as biostromes andplatform edges, and possibly dolomitization or recrystallization and dissolution enhancement of porosity inthe carbonates. Basically, 3D will increase the possibility of finding more large reserve reefs with TCFpotential and potentially thick oil rims. The main gas supply for Malaysia Liquid Natural Gas (MLNG) plantsin Sarawak is produced from the CLC reservoirs. At present, only 45 gas fields have been discovered in CLC;but more than 100 identified prospects and leads at present remain to be drilled.November, 2006 58
Petroleum <strong>Geology</strong> Conference and Exhibition 200627-28 th November, 2006 Kuala Lumpur Convention Center, Kuala Lumpur, MalaysiaPAPER 6Figure 1: 3D perspective view, regional Near Top Cycle IV/V Carbonate59 Geological Society of Malaysia
SESSION 2PAPER 6Figure 2: Pressure Plot GraphPressure (psia)00 1000 2000 3000 4000 5000 6000 7000 800050010001500Depth (mss)2000250030003500NC4F2 AtticPC4B11.1linear (hydrostatic)NC4- Highpressure~7000 psi4000Figure 2: Central Luconia Carbonate discoveries ‘Pressure-Depth Plot’.November, 2006 60
Petroleum <strong>Geology</strong> Conference and Exhibition 200627-28 th November, 2006 Kuala Lumpur Convention Center, Kuala Lumpur, MalaysiaPAPER 7FRACTURED BASEMENT PLAYS,PENYU BASIN, MALAYSIAF. Fanani, B. Boyce, R. Wong,A. Fahrul and Alwyn C.,PMU Basin Studies,Petroleum Management Unit,PETRONAS,Kuala Lumpur, Malaysia.The Penyu Basin is located offshore 50 km west of Peninsula Malaysia and 40 km south of theprolific oil and gas fields of the Malay Basin. Located in open Block PM308, it covers 14,200 sq km and haswater depths ranging 30 – 100 m. <strong>12</strong> exploration wells were drilled from 14,000 km 2D seismic.In 2004, PETRONAS Resource Assessment and Marketing (PRAM) acquired 660 square kilometersof 3D seismic over the Rhu structure and surrounding areas. The 3D seismic revealed various fracturingbasement highs, presumably analogous to the Anding Utara Malay Basin fractured basement oil discoverymade in 2005.This new play type in the Penyu Basin opens a new frontier of untested basement plays – i.e. multiplebasement targets from various structural styles. Crystalline basement in the Penyu are mainly fracturedmetamorphosed basalts and weathered tuffs. Regionally in SE Asia, basement fracturing is attributed to theCretaceous tectonism, with possible overprints from Oligocene rifting, and later Miocene inversion. With 3Dand 2D seismic, fractured basement leads were identified adjacent to Paleogene syn-rift hydrocarbon sourcekitchen.61 Geological Society of Malaysia
SESSION 2PAPER 7November, 2006 62
Petroleum <strong>Geology</strong> Conference and Exhibition 200627-28 th November, 2006 Kuala Lumpur Convention Center, Kuala Lumpur, MalaysiaPAPER 8SOFT-SEDIMENT DEFORMATION AND HYDRAULIC FRACTURINGOF DEEP-WATER SEDIMENTS: EXAMPLES FROM THE WEST CROCKER FORMATION(OLIGOCENE-LOWER MIOCENE), SABAH, MALAYSIA1 Mazlan Madon, 2 Abdul Hadi Abd Rahmanand 2 Mohd Nizam Abu Bakar1 Petronas Research, Lot 3288-3289,Kawasan Institusi Bangi,43000 Kajang, Malaysia2 Petroleum Geoscience Research,Geophysics Group, School of Physics,Universiti Sains Malaysia,11800 Pulau Pinang, MalaysiaSoft-sediment deformation is a common feature of sedimentary rocks deposited under conditions ofrapid burial. In the Lower Miocene West Crocker Formation, Kota Kinabalu area (West Sabah), soft-sedimentdeformational features occur in deep-marine sandstone, interpreted as submarine turbidites and debris flows.The structures include load moulds, flame structures, dish structures, and injection structures. Both sand andclay injectites, although mainly of mm to cm in scale, seem to be a common feature of the West CrockerFormation but have not been documented in the past. The occurrence of clastic injectites, especially of sand,in deep-marine sediment has received much attention lately because of their reservoir potential and impact onreservoir continuity.Another interesting and distinctive feature of the West Crocker debrites is the occurrence of layerbound,bedding-normal fractures. These thin, often “hair-line” fractures are pervasive within individualsandstone beds but terminate in the shale beds above and below. Fracture spacing ranges from a few mm to10’s of cm. They occur more commonly in the thicker (> 1 m) debrite beds, although some have beenobserved in beds that are less than 0.5 m thick. In the thicker beds, they are commonly associated with waterescape“dish” structures, and in places, clay injections at the base of the sand. These fractures are also cut bylater, probably tectonic, faults.The soft-sediment deformational structures, such as load and flame structures, were evidently formedby gravitational loading of sand onto a fluidized muddy substrate, very commonly occur in the cm-thick shalepartings between the massive sandstone beds. Injection structures are usually the result of instantaneousrelease of overpressure through the fracturing and re-mobilization of semi-consolidated sediment. The softsedimentdeformation features were formed at shallow burial depths (metres to tens of metres), when thesediment was still poorly consolidated. In contrast, the brittle deformation, however, which had led tofracturing, must have occurred after the sands had attained sufficient strength through consolidation andlithification at moderate burial depths (probably many hundreds of metres). In a compacting sedimentarybasin, where the maximum principal horizontal stress (σ 1 ) direction is essentially vertical, tensile hydraulicfractures may form at right angles to the minimum principal horizontal stress (σ 3 ) direction, resulting in layerboundbedding-normal fractures.We envisage a post-depositional evolution for the West Crocker debrites as follows: (1) deposition (2)shallow burial and soft-sediment deformation (3) deep burial, sealing and overpressuring, (3) fracturing andinjection.63 Geological Society of Malaysia
3D-BASED ANALYSIS OF THE SUMANDAK COMPLEX:SIGNIFICANCE TO THE SEDIMENT DEPOSITIONIN OFFSHORE NW SABAHAzli Abu Bakar 1Christopher Jackson 2Howard Johnson 21 Petronas Carigali Sdn Bhd,Level 15, Tower 1, Petronas Twin Towers,50088 Kuala Lumpur, Malaysia2 <strong>Department</strong> of Earth Science & Engineering,Imperial College, Prince Consort Road,London, SW7 2BP, England, UKSESSION 3PAPER 9The Sumandak Complex consists of a series of oil and gas fields discovered in the Late MioceneStage IVC sediments along the footwall of Morris fault located in the Samarang Sub-Block, offshoreNorthwest Sabah, Malaysia (Figure ). This study aimed to use 3D seismic interpretation and visualisationcombined with well data to; (i) understand the sub-regional scale sediment supply pathways into the studyarea, and (ii) determine the influence of active faulting on local depositional patterns.Figure 1: Location of the Sumandak Complex, offshore NW SabahIn the footwall of Morris fault, well data indicates that the Stage IVC interval is bound below by theUpper Intermediate Unconformity (UIU) and top by the Shallow Regional Unconformity (SRU) (Figure).Internally, the interval consists of two main prograding delta complexes, called the Sumandak Delta Complex1 (SDC1) and 2 (SDC2) in this paper. These delta complexes are seismic-scale (ca. 800 m thick) and aredefined on seismic data by low angle clinoforms with well developed toesets, foresets and topsets.The main reservoirs in SDC1 system are interpreted to be deposited in a lower delta plain to deltafront environment (i.e on the topsets or upper foresets of the seismic scale clinoforms). However, thin (ca. 10November, 2006 64
Petroleum <strong>Geology</strong> Conference and Exhibition 200627-28 th November, 2006 Kuala Lumpur Convention Center, Kuala Lumpur, MalaysiaPAPER 9m), fining upward sandy units are also observed in the deeper part of the well data and these appear to tie withamplitude anomalies on seismic data. Spatially, these amplitude anomalies are developed on the toesets of theSDC1 clinoforms and are interpreted to be turbidite channels deposited in a prodelta environment (Figure ).Seismic data also indicates that the SDC1 system prograded westwards, away from the mainland Sabah andalmost perpendicular to the Champion and Baram Deltas,both of which were prograding northwestward from Brunei.The frontal part of the SDC1 systemperiodically collapsed during the progradation phase,probably in response to uplift in NW Borneo during the LateMiocene when compressional events are interpreted to havebeen most active. Seismic isochore maps indicate that theproducts of the delta-front slumping events flowednorthwards and the westwards, consistent with uplift of theSDC1 system to the south and the east in response tostructural growth (Figure ).The overlying SDC2 system progrades over anddownlaps onto the underlying slump-scarred SDC1 system(Figure ). It is interpreted that these sediments weredeposited during a highstand following a transgressive periodthat had drowned the SDC1 system. Interestingly, seismicdata indicates that the direction of delta progradation hadnow switched to be northwestwards. This switch in sedimentsupply and progradation prior to the formation of the SRUFigure 2: Generalised stratigraphiccolumn for the interval of studyNFigure 3: Interpreted seismic sectionsignals the start of the influence of the Champion delta orthe Baram delta on sediment supply into the study area.Seismic isochore maps indicate that neither theSDC1 nor SDC2 systems were affected by the Morris or theHasselfoot fault and therefore might have been depositedprior to the initiation of activity on these faults. Sedimentthicknesses south of the slump scars are observed to be65 Geological Society of Malaysia
SESSION 3PAPER 9tabular across both faults. Furthermore, the slump scars arealso observed in both the hangingwall of Morris fault andthe footwall of Hasselfoot fault (Figure ). This suggests thatneither of the faults had controlled the slumping event andthat these features had formed prior to signifcant activity onthese faults.5 kmFigure 4: Isochore map showing the delta fronterosional features in SDC1However, the Stage IVD and Stage IVE sediments(Latest Miocene to Pliocene), which are younger than theStage IVC, thickens into the hangingwall of Hasselfoot faultand Morris fault, respectively. Therefore, both of the faultswere syn-depositionally active only with the youngersediments.In conclusion, the sediment transport was directedwestwards in the SDC1 system (early Stage IVC) but then changed to northwestward in the overlying SDC2system (Late Stage IVC). Both Morris and Hasselfoot faults started to move significantly after the depositionof the Stage IVC in this study area.A wider regional study, including biostratigraphic and structural analyses, need to be conducted bothin the offshore and onshore areas in NW Sabah in order to establish the exact timing of the structural andstratigraphic events mentioned in this study. A local sea-level curve can then be constructed to put the areainto the right sequence stratigraphic framework.November, 2006 66
Petroleum <strong>Geology</strong> Conference and Exhibition 200627-28 th November, 2006 Kuala Lumpur Convention Center, Kuala Lumpur, MalaysiaPAPER 10CONTROLLING FACTORS IN CLASTIC RESERVOIR DIAGENESISOFFSHORE BINTULU – SARAWAK BASINTeguh Prasetyo and Andy FirthMurphy Sarawak Oil Co. LTDe-mail: teguh_prasetyo@murphyoilcorp.comandy_firth@murphyoilcorp.comRock data from new well discoveries show that diagenetic factors such as pyrite, siderite, silica &ferroan-calcite/dolomite cementations, clay minerals (kaolinite, illite/smectite & chlorite) and compaction arethe important controlling factors in reducing reservoir quality in <strong>Of</strong>fshore Bintulu – Sarawak Basin.Pyrite and siderite are more abundant in shallow depths but their abundance decreases with theincreasing depth (Fig.1). This phenomenon is because pyrite and siderite were formed as early diageneticminerals in sandstone. The bulk rock volume of pyrite and siderite is small (
SESSION 3PAPER 10November, 2006 68
Petroleum <strong>Geology</strong> Conference and Exhibition 200627-28 th November, 2006 Kuala Lumpur Convention Center, Kuala Lumpur, MalaysiaPAPER 1069 Geological Society of Malaysia
SESSION 3PAPER 10November, 2006 70
Petroleum <strong>Geology</strong> Conference and Exhibition 200627-28 th November, 2006 Kuala Lumpur Convention Center, Kuala Lumpur, MalaysiaPAPER 1071 Geological Society of Malaysia
SESSION 3PAPER 10November, 2006 72
Petroleum <strong>Geology</strong> Conference and Exhibition 200627-28 th November, 2006 Kuala Lumpur Convention Center, Kuala Lumpur, MalaysiaPAPER 11THE ROLE OF SEDIMENTOLOGY INACCURATELY CHARACTERISINGNEWLY DISCOVERED RESERVOIRSDuncan Barr and Tony KennairdCore Laboratories Australia Pty LtdAbstractEarly confirmation of depositional environment is essential if a new hydrocarbon play is to beproperly understood and developed, as it is a major factor influencing the morphology, trend and continuity ofa reservoir. Accurately predicting the reservoir morphology, trend and continuity limits the risk of drilling dryholes and leads to superior estimates of reservoir gross rock volume – probably the single most importantfactor when calculating hydrocarbon reserves.On the larger scale, regional seismic information is used to paint a broad picture of the reservoir, withmore detail added as wireline log information comes to hand. The inferences drawn from these two methodsof investigation should then be confirmed or refuted as quickly as possible by detailed sedimentologicalexamination of the actual reservoir rock. This is best achieved by visual description of conventional core.The importance of sedimentological core description is highlighted in this paper by reviewing twocase studies. The first study, completed in 2003, was conducted following the unexpected drilling of a dryhole. Sedimentological description of available core material led to a complete re-interpretation of thedepositional environment, and consequent reassessment of reservoir trend and morphology. In the secondstudy, completed in 2001, detailed core descriptions also caused a previously conceived, pessimisticgeological model to be dismissed. The new model re-defined reservoir continuity and morphology, therebyadding substantially to estimated reserves.IntroductionAn understanding of depositional environments maximizes the prospects for successful explorationand production, as illustrated in the two case studies presented in this paper.Study 1BackgroundThis study included several wells drilled along the eastern margin of the Barrow sub-basin of theAustralian North West Shelf by operator Apache Energy Ltd (Fig. 1).Sandstone deposition in this area has historically been interpreted as a deep marine turbidite setting,which infers reservoir sandstones aligned roughly perpendicular to the palaeo-shoreline. After initialdiscovery wells, the positioning of a subsequent appraisal well was based on the traditional depositionalmodel. This appraisal well was dry. Hence a study was undertaken to re-evaluate the depositionalenvironment.Sedimentological InterpretationThe wells drilled by Apache lay along the “Linda-Denver fault terrace” (Fig. 2).Evidence for shallow marine deposition of the Linda sandstones was provided by core description andpetrography:• Grain size distribution and sedimentary structures• Repeated coarsening upwards cycles• Ichnofacies (Cruziana)• Reworked pisoidal and pedogenetic grains• Complex early diagenetic histories73 Geological Society of Malaysia
SESSION 3PAPER 11The reservoir sandstones studied were interpreted as a low-stand shoreface model where the sand wastrapped in a series of ramps on the fault terrace. Essentially these reservoir sands are roughly parallel (aspredicted from the new model) rather than perpendicular (as predicted by the traditional model) to the palaeoshoreline.Figure 1: The eastern Barrow sub-basin and location of wellsNovember, 2006 74
Petroleum <strong>Geology</strong> Conference and Exhibition 200627-28 th November, 2006 Kuala Lumpur Convention Center, Kuala Lumpur, MalaysiaPAPER 11Figure 2: (A) A map of the Linda-Denver fault terrace. The outlines of the Linda andDenver seismic amplitude anomalies are shown.Study 2BackgroundThe subject of this study was the Mid to Late Jurassic Laminaria formation, within the LaminariaField, operated by Woodside Energy Ltd in the Timor Sea area (Fig. 3).Early geological work had suggested the existence of a series of deltaic channel sands, and therefore alack of sand continuity across the field.Sedimentological InterpretationSix primary Facies Groups were identified from core description and correlated with wireline gammaray log profiles to predict facies patterns in uncored wells. The characteristics of each Facies Group wereinterpreted.Sedimentological identification of which beds represented major vs minor bounding surfaces alloweda bedding hierarchy to be established. From there, the formation was divided into eight depositional cycles(labeled A to H in order of deposition). The cycles are mostly regressive, with sandstones graduallycoarsening and thickening upwards before being capped by flooding surfaces overlain by heterolithic beds orargillaceous bioturbated sandstones. Therefore the best reservoir quality sandstones comprise the upper partsof each cycle.75 Geological Society of Malaysia
SESSION 3PAPER 11Integration of core to core and core to log correlationspermitted the establishment of vertical and lateral relationshipsof the Facies Groups, as illustrated in Fig. 4. The mainsandstone beds could be traced across most of the study area,notwithstanding localized lateral facies variations and pinchouts.ConclusionsDetailed sedimentological descriptions of cores formedthe cornerstones of two studies which had the followingbenefits:• Study 1 re-interpreted the depositional model from deepmarine turbidite to low-stand shoreface, allowing reassessmentof reservoir trend and morphology. Oneconsequence of this re-assessment was significant riskreduction in the positioning of subsequent wells.• Study 2 re-interpreted the depositional model from deltaicto marine and demonstrated that reservoir sandstones werecontinuous rather than discontinuous. The sandstonecontinuity substantially increased reserves potential.Figure 3 (above): Sketch map showinglocation of study area and approximatepositions of wells used in this study.Approximate distance between grid lines =1.85kmFigure 4 (below): Excerpt from sedimentologicalcross section across the Laminaria Formation,illustrating the section between East Corralina-1and Laminaria -3November, 2006 76
Petroleum <strong>Geology</strong> Conference and Exhibition 200627-28 th November, 2006 Kuala Lumpur Convention Center, Kuala Lumpur, MalaysiaPAPER <strong>12</strong>THE SEQUENCE BIOSTRATIGRAPHYAND CHRONOSTRATIGRAPHY OF THE MALAY BASINRobert J. Morley 1 and Shamsuddin Jirin 21 Palynova, 1 Mow Fen Road,Littleport Cambs UK2 Group Research, Research and Technology Division, PETRONAS,Kawasan Institusi Bangi,43000 Kajang, Selangor, MALAYSIAThrough a comprehensive review of biostratigraphic data from the Malay Basin, in relation to seismicdata, it is demonstrated that a large proportion of the microfossil assemblage variation seen in the basin isdriven by sequence stratigraphic processes. Sequence biostratigraphic signals fall into two types: 1) signalsrelating to sea and lake level change, such as abundance and diversity acmes of foraminifera and nannofossils,and acmes of mangrove pollen and lacustrine algae, and 2) palynomorph assemblage changes reflectingclimate change, which would have paralleled changes in sea level.Biostratigraphic signals for each systems tract can be distinguished. The maximum flooding surface,separating the transgressive systems tract from the highstand, is generally marked by a foraminiferal (andsometimes nannofossil) abundance and diversity acme, whereas the highstand is generally characterised bypollen signals suggesting a warm and wet climate. The transgressive systems tract is invariably marked by anacme of mangrove (Rhizophora type) pollen, and the transgressive surface by an increase in abundance ofmarine microfossils. The lowstand is usually characterised by an acme of cool and/or seasonal climate pollen,although some for some lowstands the climate was cool but wet, and these are generally characterised byacmes of pollen from an unusual type of peat swamp. Lacustrine algal signals need to be used differently issequence interpretation depending on the strength of marine influence.The succession has been divided into 21 sequences based on biostratigraphic signals alone. Fourteenof these are within seismic groups D-M. Sequences within seismic groups A-H can each be independentlydated using mainly nannofossils which occur at the maximum flood, but for sequences within seismic groups I– M there are no reliable Malay Basin microfossil occurrences for which the age has been accuratelyestablished. However, within groups I through M, terrestrially derived palynomorphs are abundant, and bycorrelating using palynological zones into the West Natuna Basin, where good nannofossil control is availableto the base of the Arang Formation at the base of the Early Miocene (tying the ‘PR’ Malay Basinpalynological zones of Azmi et al (1996) into the West Natuna ‘P’ zones of Morley et al (2003), thesuccession can be accurately dated down to base Group J. The age for Groups K through to M is proposed bysequence correlation with the West Natuna Barat and Gabus Formations, for which the age has been proposedusing climate signals alone, through comparison with the global oxygen isotope curve. The study indicatesthat the age of the Group J/K boundary (previously ~21.4 Ma) is underestimated, and that this boundaryshould coincide closely with base Early Miocene at 23.09 Ma.ReferencesAzmi, M.Y., Awalludin, H., Bahari, M.N., and Morley, R.J., 1996, Integrated biostratigraphic zonation for theMalay Basin, Geological Society of Malaysia 39, pp157-184.Morley, R.J., Morley, H.P. and Restrepo-Pace, P. 2003. Unravelling the tectonically controlled stratigraphy ofthe West Natuna Basin by means of palaeo-derived Mid Tertiary climate changes. 29 th IPAproceedings volume 1.<strong>77</strong> Geological Society of Malaysia