
Create successful ePaper yourself
Turn your PDF publications into a flip-book with our unique Google optimized e-Paper software.
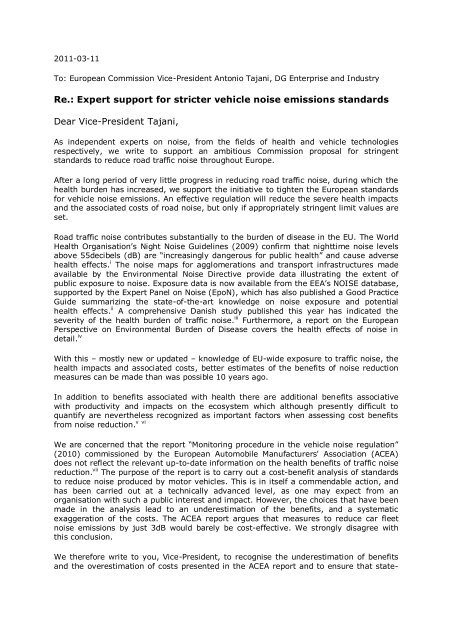
2011-03-11To: European Commission Vice-President Antonio Tajani, DG Enterprise and IndustryRe.: Expert support for stricter vehicle noise emissions standardsDear Vice-President Tajani,As independent experts on noise, from the fields of health and vehicle technologiesrespectively, we write to support an ambitious Commission proposal for stringentstandards to reduce road traffic noise throughout Europe.After a long period of very little progress in reducing road traffic noise, during which thehealth burden has increased, we support the initiative to tighten the European standardsfor vehicle noise emissions. An effective regulation will reduce the severe health impactsand the associated costs of road noise, but only if appropriately stringent limit values areset.Road traffic noise contributes substantially to the burden of disease in the EU. The WorldHealth Organisation’s Night Noise Guidelines (2009) confirm that nighttime noise levelsabove 55decibels (dB) are “increasingly dangerous for public health” and cause adversehealth effects. i The noise maps for agglomerations and transport infrastructures madeavailable by the Environmental Noise Directive provide data illustrating the extent ofpublic exposure to noise. Exposure data is now available from the EEA’s NOISE database,supported by the Expert Panel on Noise (EpoN), which has also published a Good PracticeGuide summarizing the state-of-the-art knowledge on noise exposure and potentialhealth effects. ii A comprehensive Danish study published this year has indicated theseverity of the health burden of traffic noise. iii Furthermore, a report on the EuropeanPerspective on Environmental Burden of Disease covers the health effects of noise indetail. ivWith this – mostly new or updated – knowledge of EU-wide exposure to traffic noise, thehealth impacts and associated costs, better estimates of the benefits of noise reductionmeasures can be made than was possible 10 years ago.In addition to benefits associated with health there are additional benefits associativewith productivity and impacts on the ecosystem which although presently difficult toquantify are nevertheless recognized as important factors when assessing cost benefitsfrom noise reduction. v viWe are concerned that the report “Monitoring procedure in the vehicle noise regulation”(2010) commissioned by the European Automobile Manufacturers' Association (ACEA)does not reflect the relevant up-to-date information on the health benefits of traffic noisereduction. vii The purpose of the report is to carry out a cost-benefit analysis of standardsto reduce noise produced by motor vehicles. This is in itself a commendable action, andhas been carried out at a technically advanced level, as one may expect from anorganisation with such a public interest and impact. However, the choices that have beenmade in the analysis lead to an underestimation of the benefits, and a systematicexaggeration of the costs. The ACEA report argues that measures to reduce car fleetnoise emissions by just 3dB would barely be cost-effective. We strongly disagree withthis conclusion.We therefore write to you, Vice-President, to recognise the underestimation of benefitsand the overestimation of costs presented in the ACEA report and to ensure that state-
of-the-art knowledge on health benefits of noise reduction is properly taken into accountand reflected by an ambitious proposal in the coming weeks.Underestimation of benefits, especially health benefitsThe protection of health and wellbeing is the primary motivation for improving vehiclenoise standards. It is therefore regrettable that the report for ACEA does not take thesevere health effects of traffic noise and the benefits of noise reduction properly intoaccount.The general approach taken in the report for ACEA for calculating the benefits of noisereduction is narrow, with every possibility taken to play down the value of the benefits.For example, a meagre 2.8 dB reduction in L den (the noise exposure over a 24hourperiod) is found in the report for ACEA to raise an EU-wide benefit of €52billion,outstripped by costs of €112billion over 20 years. We take this opportunity to explainwhy this is not accurate:(a) Health effects are not included in the benefit calculations. These are commonlyevaluated in terms of Disability-Affected Life Years (DALYs) and taking effects ofnighttime noise reduction into account. The inclusion of up-to-date knowledge onhealth effects would lead to a more accurate evaluation of benefits. State-of-theartdata included in a forthcoming WHO report on Environmental Burden ofDisease clearly show the connection between road traffic noise and cardiovasculardiseases, for example. viii(b) The evaluation only takes willingness-to-pay (WTP) studies into account. Thefigure used comes from an EU-WTP value based on 2001 prices (€25 per decibelper household per year) which is seen as very conservative as severe healtheffects are not included. The flat-rate per decibel fails to take into account thateach decibel reduction in a noise hotspot has a much higher value. More recenthedonic pricing studies a bandwidth for a loss of property values between 0.2-1.5% per decibel for L den over 50-55dB, with the best-estimate at 0.5%. ix(c) Benefit estimates are very sensitive to the choice of threshold for onset of healtheffects. Standard practice and the EU-WTP-value uses a threshold value of L den:50-55dB. However the report for ACEA has chosen a higher threshold of 55dB.While exposure data between 50-55dB is more difficult to obtain from EU-data,extrapolations from other data could be used. xWith reference to these points, the report for ACEA recognizes that an alternativemethod, as used by the UK government, is available for benefit calculation based onthe relationship between noise and house prices: xi “If one had applied the UK methodfor benefit calculation as described in the Transport Analysis Guidance (…), thebenefit would be roughly twice as high as described here.” (p.20) However, thisimportant admission is not adequately reflected in the report’s conclusions.(d) As the cost-benefit calculations span over a long time period, the WTP figureshould at least be corrected for inflation. As the figure was established in 2001, itshould already be corrected to be around €30/dB/household/year.(e) Referring to the WHO Night Noise Guidelines and the EEA NOISE database abenefit estimation of nighttime noise reduction can be made (including part ofWTP): assuming an effective linear noise reduction reaching 3dB by 2030, ourcalculation of benefits comes to €38-230billion over the period. (See appendix 1)In conclusion: the benefits are underestimated by at least a factor of 2, and upto a factor of 4 when the latest health research, exposure data and valuationtechniques are taken into account.
Overestimation of costs to manufacturersProduction costs and investment costs should be examined separately. The productioncosts found in the report for ACEA are similar to those quoted in a report for theEuropean Commission by TNO xii , and in accordance with previous reports, at around €20per decibel per vehicle reduction for M1 vehicles. xiiiIn contrast, estimates of investment (mainly R&D) costs vary widely. It can be concludedfrom the report for ACEA that a 3dB noise effective reduction of the limit values for M1vehicles is estimated cost €26million for each vehicle type, whilst a 4dB reduction wouldcost €59million. (See appendix 2) There are several reasons why this estimate is notrealistic:a) Many of the noise reduction measures listed (Appendix D, table D5) have alreadybeen applied for several decades. Although it can be accepted that some of thesecommon measures need some adaptation, attributing all or main part of the coststo future cars is a severe overestimate.b) The attribution of R&D costs over a 20 year period appears unjustified. Thisaccounts for at least 50% of the total costs. R&D costs will occur in the shortmediumterm only, once the stringency of the regulation and deadlines forimplementation are apparent.c) There is no technological barrier to quiet vehicles, witnessed by the fact thatsubstantially quieter vehicles are already available throughout the price andproduct range (including sports and luxury models, family cars and budgetmodels). No correlation is found between noise emissions and power, or betweennoise emissions and price. There are already many models on the market whichare 3-4dB below the current noise limits, so it seems unfeasible that R&D costswould be so high. Please see appendix 3 (figure 2) which illustrates that half ofM1 vehicles are 3dB or more quieter than the current equivalent limit values.d) In a cost-benefit analysis, the costs to be used are the costs to society. The study“Review and analysis of the reduction potential and cost of technological and othermeasures to reduce CO2-emissions from passenger cars” (2006) has a thoroughliterature review and analysis regarding the factor by which to multiply increasedproduction costs to estimate societal costs. xiv Whereas the study concludes afactor of 1.16 for additional costs is appropriate, in relation to CO2 abatementcosts, the report for ACEA has used a facor 1.7 (page 25). There is no indicationthat a higher figure should be used in relation to noise abatement.Importance of improved noise standards for heavy vehiclesFor the health and wellbeing of the European citizen in the coming decades, significantnoise reduction of heavy vehicles is absolutely essential. Development in traffic andvehicle compositions over the latest decade, as well as the anticipated time trend hasmade noise emission from heavy duty vehicles (HDV) increasingly important in relationto that of light vehicles. This is because HDV traffic has increased much faster than lightvehicle traffic. Furthermore, although some HDV may shift to hybrid or electric, the trendwill most likely be faster among the light vehicles. Importantly, the new tyre noise limits(Regulation 661/2009) are much less stringent for heavy vehicle tyres than for lightvehicle tyres and will enter into force much later, in combination with the fact thatapprox. half of the heavy vehicle tyres (retreaded tyres) are not subject to any noiselimits. Therefore, special attention must be paid to reducing HDV noise emissions. Theambition level for reducing HDV noise should be higher than for light vehicles, to achievesignificant overall traffic noise reduction.
We believe that strict standards will achieve significant results. In 1989, Austriaintroduced a nighttime driving ban for heavy duty commercial transit traffic, unless thevehicles complied with a noise level 4 dB(A) lower than the EU limit of 84 dB coming intoforce about the same time. There were strong objections that the noise reduction wouldbe almost impossible, or at least extremely expensive, to achieve. However, two truckmanufacturers offered compliant vehicles almost immediately. By the early 1990s, many,if not most, of the heavy trucks travelling in central Europe met the 80 dB limit, wellahead of the 1996 deadline for the EU-wide limit value of 80dB. xvNoise control technology has advanced substantially in the past 20 years. For example, inorder to meet the noise limits which entered into force in 1996, encapsulation wascommonly used, but technological progress quickly rendered this unnecessary. There istherefore important scope to redeploy encapsulation to significantly reduce noiseemissions from HGVs in the short-medium term.In addition to the maximum limits, it is important to promote the development of quietcity buses and quiet vehicles for urban services during the night. We therefore suggestthat in addition to the maximum limits, requirements are introduced for “quiet heavyvehicles” to which customers (e. g. city administrations and public bus companies) couldrefer in procurement requirements. Hybrid and electric vehicles that meet such purposesare already becoming available. This could initiate a “buy quiet” development.Issues for future considerationMotorcycle noise is not to be included in the forthcoming proposal. However, we want toemphasize that noise from motorcycles is a growing environmental concern. xvi With theplanned noise-reducing measures for cars, buses and trucks in Europe, motorcycle noisewill be even more prominent. It is absolutely necessary to also tackle the noise emissionsof these vehicles, and in particular to improve enforcement as a significant proportion oftwo wheelers are found to be louder than permitted due to tampering.A minor problem in the past which could become more serious in the future, is related tolow frequency noise (referred to here as 16-125 Hz). There is a tendency that noiseemission from heavy power units shifts to lower frequencies. The noise limits as they areset in A-weighted sound levels expressed in decibels (commonly indicated as dB(A)), donot take the low frequency problems sufficiently into account. Barriers, windows, etc,attenuate the high frequencies much more effectively than the low frequencies. The lowfrequencies do not significantly influence the A-weighted levels in the certificationmeasurements but may dominate the noise on the reception side; especially indoors.One simple way to correct this problem would be to set limit values with both A- and C-weighting. This would promote technical measures on the vehicles of importance for theenvironment but which are not motivated to comply with certification limits set in A-weighted dB only. The industry should be positive to this since these low frequencies maycreate drowsiness of drivers. xviiConclusionsWe the undersigned are convinced, on the basis of scientific evidence, that the monetarybenefits of quieter traffic by far outweigh the costs of quieter cars to society. This isalready proven by market availability of cars that would satisfy even the most stringentfuture demands. If all vehicles would meet the level of today’s best current technologiesavailable, the environmental noise problem caused by road traffic would be greatlyreduced. The technology for quieter vehicles is sufficiently well known to set substantiallystricter noise limits.
Vehicle noise emissions limits have remained unchanged since 1992, with the result thatthe noise burden on Europeans has continued to increase. Vehicle manufacturers haveregrettably not been encouraged by regulation to reduce noise, and we strongly supportthe Commission’s initiative to finally take action with several steps of increasinglystringent limit values to be introduced over the coming years.We the undersigned request the EU Commission, Council and Parliament to take theabove into consideration when making proposals to revise the legislation on vehicle noiseemissions.The coordinators of this <strong>letter</strong> are open to answer any questions in this regard, includingthe appendices and would welcome an opportunity to provide further inputs in support ofthis proposal.Sincerely,Name Affiliation SignatureMartin van den Temporary advisor to the WHO on Martin.vandenberg@minvrom.nlBergnoise and health;EEA expert panel on noise (EpON);(coordinator)Chairman EU-Working Group onIndicators and on Health and Socio-Economic aspects;Editor WHO Night Noise GuidelinesProf. Tor Kihlman(coordinator)Philip AbbottDr. WolfgangBabischProf. Em. BirgittaBerglundProf. em. Applied Acoustics,Chalmers University of Technology,Sweden;Chair, <strong>CAETS</strong> Noise ControlTechnology Committee;Board member, InternationalInstitute of Noise ControlEngineering (I-INCE);Former member EU Working groupHealth and Socio-economicassessmentTechnical Director Acoustics,AECOMTemporary advisor to the WHO onhealth effects of noise;International Commission on theBiological Effects of Noise (ICBEN),Member of Team 3 (Non-auditoryHealth Effects)Institute of Environmental Medicine,Karolinska Iinstitute, Department ofPsychology, Stockholm University;Temporary advisor to WHO;Author, editor WHO Guidelines forCommunity Noise;EU Noise Steering Group, chair ofDose/Effect WG;CEC Steering Committee on UrbanAir, Indoor Environment and HumanExposure;President, International Commissionon Biological Effects of Noisetor.kihlman@chalmers.se
Truls GjestlandUniv.-Prof. Dr.Barbara Griefahn(ICBEN);Member, Board for EnergyDevelopment, Swedish Council forIndustrial and TechnicalDevelopment;Expert, WHO WG aircraft noise andhealthSenior Research Scientist, SINTEF,Norway;Temporary advisor to WHO;ICBEN – International Commissionon Biological Effects of NoiseIfADo Leibniz-Institut fürArbeitsforschung, TechnicalUniversity DortmundMichael JäckerCüppersWilliam W. LangProf PeterLercher, M.D.M.P.H.Alain Muzet, MDProf. José ManuelPalma-OliveiraMarco PaviottiConsultant, formerly of GermanFederal Environment AgencySecretary, <strong>CAETS</strong> Noise ControlTechnology Committee;Vice-President I-INCE;Noise Control Foundation, USAInterim Director, Division of SocialMedicine, Medical UniversityInnsbruckFormer Research Director, CNRS,France;Former chairman, ICBEN;Former temporary advisor to WHO;Former member of the FrenchControl Authority on Airport NoiseAnnoyance;Acting chair of the Working Groupon Noise and Health Indicators,French Agency for Food,Environmental, Occupational Healthand SafetyProfessor of EnvironmentalPsychology, University of Lisbon;Expert, Health and Socio-economicWG on END;Representative on Portuguese noisesteering groupFormer member, EC WGAssessment of Exposure to Noise(WG-AEN);Former member, EC Expert Panelon Noise (EpON);Member of the CNOSSOS-EUdrafting team
Dr. Laura RealiDr. Eng. UlfSandbergDr. DietrichSchwelaProf. StephenStansfeldDr. GiacomoToffolDr. Irene vanKampProf. Greg WattsPrimary Care Pediatrician,Pediatric Cultural AssociationEducation and Research secretary;Member of “Pediatri per un mondopossibile”Senior Research Scientist,Swedish National Road andTransport Research Institute (VTI);2002-2008 Adj Prof in Tyre/RoadNoise at Chalmers University ofTechnologySenior Research Associate,Stockholm Environment Institute,University of York;Co-chair, ICBEN Team 9;Former staff member of WHO.Professor of Psychiatry;Chair, ICBEN;Coordinator, European Network onNoise and Health (ENNAH);Temporary advisor to WHOPrimary Care Pediatrician;National expert to “Pediatri per unmondo possibile” Pediatric CulturalAssociationNational Institute of Public Healthand Environment, the Netherlands;Temporary advisor to WHO;ICBEN – International Commissionon Biological Effects of Noise;Member of European Association forPublic HealthProfessor of Transportation NoiseBradford Centre for SustainabilityEnvironments, School ofEngineering, Design andTechnology, University of Bradford
Appendix 1: Benefit estimates of exposure to night time road traffic noiseMartin van den BergIntroductionThe Good Practice Guide on health effects (EPoN) offers the necessary instruments to calculateDisability Adjusted Life Years. The first requirement is the dose-response relation for sleepdisturbance (section 3.2.1) and the second the disability weight (0.07; table 4.3).In order to calculate the number of DALY’s for the EU population, the number of exposedinhabitants to a certain noise level is needed.ExposureThe EU noise mapping exercise was intended to produce the required overview of exposure. TheEEA made the reported levels available via the NOISE- database.For road traffic noise 2 data sets are available:- Road traffic noise exposure in agglomerations>250.000 inhabitants- Exposure to road traffic noise to motorways with more than 6 million vehicles/year.The total numbers (June 2010 dataset ) are:Table 1. Exposure data fromNOISE-databaseLnight(dB)Exposedinhabitants inagglomerationsand along majorroads50-54 33.160.30055-59 18.397.40060-64 9.267.50065-69 2.999.600>70 1.965.500Total 65.790.300These are partial data, referring to only 17% of the population (in agglomerations) or a minor partof the road network (
Optimising the 2 parameters that fix the distribution to be 9.3 and 54.6, the following distributionresults:Applying this distribution to the EU-population of 501 million 1 (Eurostat, 2009),.Exposedinhabitants inagglomerationsLnight(dB)and alongmajor roads40-44 44.687.162 9,4%45-49 92.645.691 19,5%50-54 142.062.891 29,9%55-59 133.631.352 28,1%60-64 56.235.502 11,8%65-69 6.526.095 1,4%>70 96.564 0,0%475.885.258This compared reasonably well with nationwide estimates and is the basis to calculate the benefits.Daly1 Strictly spoken the age-group
According to the Night noise guidelines NNG), the percentage Highly sleep disturbed can beassessed using the dose-effect relation established in the EU-position paper on night time noise:%HSD=20,8-1,05*Lnight+0,01486*Lnight^2 for Lnight>40Applying this to the weibull distribution, the number of Highly Sleep Disturbed is 38 million people.The NNG defines a DALY weight of 0,07 for severe sleep disturbance due to noise.Multiplying this factor by the number of people with high sleep disturbance results in a yearly lossof healthy life years.According to the noise mapping data now established by EEA, this would result in 431.165 healthylife years lost. Using the extrapolated data (therefore including also exposed between 40 and 50Lnight and all those not yet “mapped”), the resulting loss is 2.7 million.Health CostThe recommended Value of a healthy life year (VOLY) by NEEDS (New Energy ExternalitiesDevelopments for Sustainability, 2007), using a contingency valuation study to assess the VOLY in9 different European countries, is to use €40,000 per VOLY with a confidence intervals of €25,000and €100,000.Using this figure the cost of night time exposure – therefore the potential benefit- to night noise isa minimum of 17 G€/year, up to 108.7 G€/year if all exposed are considered.Effect of source reductionLowering the source levels reduces this cost, but may also run into costs. Assuming that effectivesource levels are lowered by 3 dB in 20 years time, the benefits would be 33.6 G€ for the NOISEassessment,up to 230 G€ for the extrapolated data.
Appendix 2: Separation of production costs and investment costs in the UTAC-TÜV Nordreport for ACEAA separation of the costs can be effected from the data in Figures D 8 and D 9 in the report. Thesetwo figures are reproduced below:
By reading off values from these two figures, the following table is readily obtained:Noise reduction1dB 2dB 3dB 4dB 5dB 6dBTotal cost per vehicle € (from figure D8) 29,0 60,4 118,4 216,0 373,4 613,2% investment cost (from figure D9) 4,2 29,7 44,3 54,7 62,0 68,0For 5 dB and 6 dB the % are estimatedby rough extension of fig D9Investment cost € 1,2 17,9 52,5 118,2 231,5 417,0Production cost € 27,8 42,5 65,9 97,8 141,9 196,2Production cost € per dB 27,8 21,2 22,0 24,5 28,4 32,7___________________________________________________________It is clear from this separation of costs that the contribution from the investment costs to the totalcost per vehicle is very high.It is of interest to calculate the total investment costs per vehicle type. The following information isgiven on page 100 of the ACEA report:The investment costs per vehicle in the table above can accordingly be multiplied by 500 000 inorder to obtain the investment costs per vehicle type:Noise reduction1 dB 2 dB 3 dB 4 dB 5 dB 6 dBInvestment costsper vehicle type0.6 M€ 9 M€ 26 M€ 59 M€ 116 M€ 208 M€From other information given in the report, it seems that these costs mainly relate to research anddevelopment costs. The estimates are very much higher than the estimates given in the TNOreport.
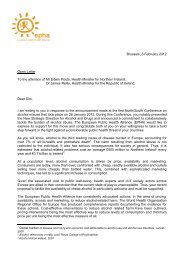
Percentage of the population at or below type approval level (%)Appendix 3: Analysis of type-approval and manufacturer data1. Distribution of Type Approval Noise Limits in the EUA large percentage of the vehicles manufactured today easily meet the type approval noise limits.100Distribution of Type Approval Levels for all EURO 4 Cars in the UK Market908070605040302010Type Approval Limit for Cars063 64 65 66 67 68 69 70 71 72 73 74 75 76Type Approval Level dB(A)Figure 1: Distribution of Type Approval Levels for all EURO 4 Cars in the UK Market 11 Source: Vehicle Certification Agency: www.vcacarfueldata,org.uk/downloads/may/2010.aspFigure 1 shows the distribution of type approval noise levels for all EURO 4 vehicles that were onthe UK market in 2010. The range in type approval levels range from about 65 to 74 dB(A) withnearly 50% of the market having type approval noise limits at 3 dB(A) or more below the typeapproval noise limit.
Figure 2. Noise distribution for M1 cars (in total 591) according to current equivalent limit CEL,diagram from UTAC-TÜV report for ACEA report, table E1 (page 112).Figure 3 Comparison Figures 1 and 2 The data set from ACEA confirms the findings of Figure 1that approx. 50% of the dataset is 3dB or more below CEL values.
2. Comparison of vehicle noise levels from different manufacturing regionsTable 1 Comparison of Noise Levels for Cars with Automatic Transmission 1StatisticMETHOD AMETHOD BEU JAPAN USA EU JAPAN USASample 15 19 12 15 19 12Mean 72.8(+1.5) 2 71.3 75.1(+3.8)70.5(+0.7)69.8 71.7(+1.9)St. Dev. 1.72 1.33 1.62 1.65 1.16 0.891 Data Source: ACEA Database M1 Vehicles 2004.2 Values in brackets indicate the difference in mean noise levels compared with Japan.Table 1 compares noise levels obtained from Method A and Method B for all cars in the ACEADatabase with automatic transmissions. This was the only vehicle type found in the database whichhad sufficiently large samples from each area to carry out statistical analysis.Comparing the noise levels from each manufactured region, the results show that for both MethodA and B, the mean levels for Japan are lower than compared with the EU and USA.Under Method A, cars with automatic transmissions from Japan are on average 1.5 and 3.8 dB(A)lower than their counterparts from the EU and USA, respectively.Similarly, under Method B, cars with automatic transmissions from Japan are on average 0.7 and1.9 dB(A) lower than their counterparts from the EU and USA, respectively.To show whether these differences are likely to be real differences rather than occurring by chancea statistical analysis comparing the means (Student-t Test) provided the following results:Method A: Cars with automatic transmission from Japan, noise significantly lower than similarvehicles from EU ( p > 0.01) and USA (p > 0.001)Method B: Cars with automatic transmission from Japan, noise significantly lower than similarvehicles from USA (p > 0.001) but were not found to be significantly lower than EU vehicles.The values of p shown in the brackets indicate the probability of the result being correct for thewhole population, eg when p = 0.01 there is a 99% probability that the result is correct and whenp = 0.001 a 99.9% probability).
ReferencesiiiWHO (2009) Night noise guidelines, Bonn.EEA (2010) Good practice guide on noise exposure and potential health effects,Technical report No 11/2010, Copenhagen.iiiSørensen, M., et al (2011) Road traffic noise and stroke: a prospective cohort study,European Heart Journal Advance Access, published January 25, 2011.iv Hänninen and Knol (eds) (2011) European Perspective on Environmental Burden ofDisease, National Institute for Health and Welfare, Helsinki.v DEFRA (2008). An Economic Valuation of Noise Pollution – developing a tool for policyappraisal. First report of the Interdepatmnental Group on Costs and Benefits, NoiseSubyect Group.http://www.defra.gov.uk/environment/quality/noise/igcb/documents/igcb-first-report.pdfviDEFRA (2010). Noise & Health – Valuing the Human Health Impacts of EnvironmentalNoise Exposure.A Response by The Interdepartmental Group on Costs and Benefits NoiseSubject Group (IGCB(N)).www.defra.gov.uk/environment/quality/noise/igcb/documents/igcn-noise-healthresponse100707.pdfviiUTAC and TÜV Nord (2010) Monitoring procedure in the vehicle noise regulation, Finalreport, prepared for ACEA.viiiWHO (2011 forthcoming): Environmental Burden of Diseaseix EEA (2010) Good practice guide on noise exposure and potential health effects,Technical report No 11/2010, Copenhagen.x EU Working group on Health and Socio-economic aspects (2003), Valuation of Noise,Position paper and Navrud (2002) The state-of-the-art on economic valuation of noise,Final report for the European Commission, both available fromhttp://ec.europa.eu/environment/noise/effectiveness.htmxiUK Department for Transport (2010) Transport Analysis Guidance: The Noise Subobjective,TAG Unit 3.3.2, available from:http://www.dft.gov.uk/webtag/documents/expert/pdf/unit3.3.2d.pdfxiiTNO (2011), VENOLIVA – Vehicle Noise Limit Values: Comparison of two noiseemission test methods, Interim report, prepared for EC DG Enterprise and Industry.xiii Ika RWTH Aachen (2007) Unpublished. Commissioned by the Norwegian Public RoadsAdministration and the Norwegian Climate and Pollution Agencyxiv TNO, IEEP et al (2006) Review and analysis of the reduction potential and cost oftechnological and other measures to reduce CO2-emissions from passenger cars,prepared for EC DG Enterprise and Industry.
xv Sandberg U. (2001) Noise emissions of road vehicles effect of regulations, Final Report01-1. I-INCE working party on noise emissions of road vehicles (WP–NERV). InternationalInstitute of Noise Control Engineering, July 2001.http://www.unece.org/trans/doc/2002/wp29grb/TRANS-WP29-GRB-36-inf_c1_sweden.pdfxviSee for example: www.cityhush.eu and Lercher, P., Sölder, M. (2009): Exposure bymotorbike noise in alpine residential areas – a case study in public health riskassessment, presented at EuroNoise 2009, Oct 26-28 2009, Edinburgh, UK.xviiCALM II (2007) Research for a Quieter Europe in 2020, an updated strategy paper ofthe CALM II network, European Commission Research Directorate General, Brussels,Sept. 2007.